Performance evaluation of HTTP web servers in embedded systems724235/FULLTEXT01.pdf · Performance...
75
Performance evaluation of HTTP web servers in embedded systems DANIEL LIND Master of Science Thesis Stockholm, Sweden 2014
Transcript of Performance evaluation of HTTP web servers in embedded systems724235/FULLTEXT01.pdf · Performance...
Performance evaluation of HTTPweb servers in embedded systems
DANIEL LIND
Master of Science ThesisStockholm, Sweden 2014

2
Prestandautvärdering avHTTP webbservrar i inbyggda system
av
Daniel Lind
Examensarbete MMK 2014:05 MDA 442
KTH Industriell teknik och management
Maskinkonstruktion
SE-100 44 STOCKHOLM
3
Performance evaluation of HTTP web servers in embedded systems
Daniel Lind
Master of Science Thesis MMK 2014:05 MDA 442
KTH Industrial Engineering and Management
Machine Design
SE-100 44 STOCKHOLM
4
Examensarbete MMK 2014:05 MDA 442
Prestandautvärdering av
HTTP webbservrar i inbyggda system
Daniel Lind
Godkänt
2014-02-23Examinator
Martin Edin GrimhedenHandledare
Sagar BehereUppdragsgivare
Syntronic ABKontaktperson
Mladen Nikitovic
SammanfattningDetta examensarbete utfördes i samarbete med Syntronic AB. Syftet var att utröna vilkenprestanda som kunde uppnås med Hypertext Transfer Protocol (HTTP) servrar på utvaldahårdvaruplattformar för inbyggda system. Resultatet skulle vara användbart för den som skavälja en hårdvaruplattform till ett inbyggt system med en HTTP-server, och utvärderingeninnehöll därför beteende under belastning, belastningsgränser, samt användning avsystemresurser.
Prestandamätningar användes för att generera data för analys, och en förstudie utfördes föratt bestämma vilka plattformar, funktionalitet och prestandaparametrar som skulle ingå istudien. Tre hårdvaruplattformar med olika prestandanivåer - BeagleBoard-xM, STK1000och Syntronic Midrange - valdes ut. En simulerad webapplikation användes under testen ochtotalt testades fem HTTP-serverprogramvaror.
BeagleBoard-xM med BusyBox httpd hade totalt sett den bästa prestandan vid körning avtestapplikationen. Den hade en hög överbelastningspunkt, korta behandlingstider samtöverlägset beteende under överbelastning. Midrange med en modifierad version av enserver skapad av Stefano Oliveri presterade dock bättre när den inte var överbelastad.STK1000 presterade klart sämre än de andra plattformarna.
Beteendet under överbelastning och effektiviteten i utnyttjandet av systemresurer skilde sigkraftigt åt mellan de olika servrarna. Testresultaten visade också att det var stor skillnadmellan HTTP-serverprogramvarorna som kördes på samma hårdvaruplatform, och generelltsett presterade programvaror med ett begränsat antal funktioner bäst.
5

Master of Science Thesis MMK 2014:05 MDA 442
Performance evaluation of
HTTP web servers in embedded systems
Daniel Lind
Approved
2014-02-23Examiner
Martin Edin GrimhedenSupervisor
Sagar BehereCommissioner
Syntronic ABContact person
Mladen Nikitovic
AbstractThis Masters Thesis was carried out in cooperation with Syntronic AB. The purpose was todetermine what was possible in terms of Hypertext Transfer Protocol (HTTP) serverperformance on selected hardware platforms for embedded systems. The results should bevaluable for those who are about to select a hardware platform for an embedded system thatwill contain a HTTP server, and the evaluation therefore included load limits, performancecharacteristics and system resource usage.
The required data was gathered with performance measurements, and a pre-study wasperformed to decide on platforms, functionality and performance parameters to include in thestudy. Three hardware platforms with different levels of performance - BeagleBoard-xM,STK1000 and Syntronic Midrange - were selected. A simulated web application was usedduring the tests and a total of five HTTP server software were tested.
BeagleBoard-xM with BusyBox httpd had the best overall performance when running the testapplication. It had a high overload point, low connection durations when not overloaded, anda superior overload behavior. However, Midrange with a modified version of a server madeby Stefano Oliveri performed better when not overloaded. STK1000 was far behind the othertwo platforms in terms of performance.
The overload behavior and efficiency of system resource usage differed greatly between theservers. The test results also showed that the performance varied significantly betweenHTTP server software running on the same hardware platform, and generally the softwarewith limited feature sets performed best.
6
Acknowledgements
I would like to express my gratitude to the people who have supported me during the workwith this thesis:
● Examiner: Mats Hanson, KTH
● Supervisors: Sagar Behere, KTH and Mladen Nikitovic, Syntronic AB
● David Näslund, Syntronic AB
Stockholm June 14, 2013,
Daniel Lind
7
Table of Contents
1. Introduction.....................................................................................................................101.1 Background................................................................................................................101.2 Problem description....................................................................................................111.3 Purpose......................................................................................................................111.4 Methodology...............................................................................................................111.5 Delimitations...............................................................................................................121.6 Pre-study results.........................................................................................................13
2. Available HTTP server software.....................................................................................152.1 Barracuda Embedded Web Server.............................................................................172.2 yaSSL Embedded Web Server...................................................................................172.3 Boa Webserver...........................................................................................................17
2.3.1 Comments...........................................................................................................182.4 KLone.........................................................................................................................182.5 Fusion Embedded™ HTTPS......................................................................................182.6 BusyBox httpd.............................................................................................................18
2.6.1 Comments...........................................................................................................182.7 Appweb™...................................................................................................................192.8 Cherokee....................................................................................................................202.9 thttpd - tiny/turbo/throttling HTTP server.....................................................................20
2.9.1 Comments...........................................................................................................202.10 Lighttpd.....................................................................................................................212.11 HTTP servers built on top of lwIP..............................................................................21
3. Measuring embedded HTTP server performance.........................................................223.1 Performance parameters............................................................................................223.2 Factors affecting measurement results.......................................................................22
3.2.1 The server...........................................................................................................233.2.2 The network........................................................................................................243.2.3 The web application............................................................................................253.2.4 The clients...........................................................................................................253.2.5 Conclusions.........................................................................................................26
3.3 Preparation.................................................................................................................263.4 Measurement methodology........................................................................................263.5 Tools...........................................................................................................................27
4. Test environment.............................................................................................................284.1 Client..........................................................................................................................284.2 Servers.......................................................................................................................28
4.2.1 BeagleBoard-xM.................................................................................................284.2.2 STK1000.............................................................................................................294.2.3 Midrange.............................................................................................................30
5. Test methodology............................................................................................................315.1 Simulated web application, instrument panel..............................................................315.2 Simulation techniques.................................................................................................315.3 Measurement techniques............................................................................................32
8
6. Test results......................................................................................................................346.1 BeagleBoard-xM.........................................................................................................346.2 STK1000.....................................................................................................................416.3 Midrange.....................................................................................................................48
7. Analysis...........................................................................................................................527.1 HTTP server software comparisons per platform........................................................52
7.1.1 BeagleBoard-xM.................................................................................................527.1.2 STK1000.............................................................................................................547.1.3 Midrange.............................................................................................................56
7.2 Platform comparison...................................................................................................57
8. Conclusions.....................................................................................................................63
9. Discussion.......................................................................................................................649.1 Future work.................................................................................................................64
9.1.1 Complementary performance aspects.................................................................649.1.2 Software tuning and alternatives.........................................................................64
10. References.....................................................................................................................65
9
1. IntroductionThis report describes a Master Thesis project about performance evaluation of HypertextTransfer Protocol (HTTP) [4] servers in embedded systems, that was carried out incooperation with Syntronic AB [77] in 2012.
1.1 BackgroundConnecting an embedded system to a local area network (LAN) and/or the Internet enablesremote monitoring, control and configuration of the embedded system. If a client-servermodel is used and the data communication is done with one of the protocols commonly usedon the Internet, such as HTTP which is discussed throughout this thesis, regular webbrowsers can be used as client software. This is advantageous as no custom client softwarehas to be developed and also makes every computer with a web browser and a connectionto the same network as the embedded system a possible client. This kind of user interfaceimplementation is very flexible as several users can access it simultaneously and fromremote locations. Another advantage is that the user interface easily can be updated orextended by modification of the software in the embedded system.
Devices that are connected to networks, such as routers, surveillance cameras and printers,are today commonly equipped with embedded HTTP servers, but usages in other types ofproducts, for example household appliances, are also possible.
Many options exists when it comes to HTTP server software that are suitable for embeddedsystems, but hardware and operating system choices can affect the number of alternatives.For example, Linux [75] based operating systems generally provides more HTTP serveralternatives than other operating systems. When it comes to microprocessor architectures,some are well supported, e.g. some ARM [74] versions, while others might require porting ornew development, as very few HTTP servers are written for them.
There are many aspects to take into consideration when selecting HTTP server software foran embedded system. As the CPU performance and the amount of memory usually arelimited in an embedded system, a lightweight HTTP server, e.g. a server that uses littlesystem resources, is often preferred. Important to note, however, is that the resource usagecan differ significantly between servers that are called lightweight.
The feature sets can vary greatly between different servers. Some features that are requiredin many embedded systems, such as support for generation of dynamic content andTLS/SSL encryption [10], are not supported by all lightweight HTTP server software. Comet[76] and byte rate throttling are two other features that can be useful for web applications inembedded systems, but lightweight server software that implement them are quite rare.
There are several technologies available for generation of web pages with dynamic content,and these technologies have different characteristics when it comes to system resourceusage. Which technology to use depends on the expected load on the system. For example,some methods use little resources under small loads, but scale badly, while others havehigher initial resource usage but scale more efficiently.
Performance, for example when it comes to the number of requests the server can handleper second, or the time it takes for the server to respond, also differ greatly between serversoftware. The type of load - for example the number of simultaneous clients, number of
10
requests sent per client and the amount of data sent in each request and response - canaffect the server software performance. It is important to consider that satisfying performancefor one type of load does not automatically mean that the server will perform equally good foranother type of load.
1.2 Problem descriptionThe concept of using HTTP server functionality in embedded systems is not new and it isused in existing products developed by many companies. The client had previously usedbasic HTTP server functionality in systems with low loads on the HTTP server. To increasecompetitiveness in the market they wanted to develop more demanding applications.Therefore, they wanted to investigate the performance of different hardware platforms forembedded systems, when used as dedicated HTTP servers.
1.3 PurposeThe purpose of this thesis was to determine load limits, performance characteristics andsystem resource usage of selected hardware platforms for embedded systems when runningHTTP server software. The selected platforms should have different technical capacities, forexample different processor types and amounts of memory. Comparisons should be madebetween them regarding their performance when used as dedicated HTTP servers. Theresults should be valuable for those who are about to select a hardware platform for anembedded system that will contain an HTTP server.
1.4 MethodologyThere were several possible methodologies to consider for this study, for example:
● Performance measurements (benchmarking).● Interviews with people that had experience with this kind of software and hardware.● Comparisons of specifications.● Compilation of published studies.
Performance measurements were chosen, because it was considered more accurate thanthe other alternatives. Hardly any studies were found that covered this subject, which ruledout the methodology of compiling results from previous studies. Drawing conclusions fromspecifications was also ruled out, as there is a vast number of parameters that affect theperformance of a HTTP server (see the literature study presented in chapter 3), and makingaccurate predictions about performance would have been more or less impossible.Interviews was also rejected as a method, because it was considered too difficult to find asatisfying number of interviewees with recent and adequate experience from using HTTPservers on several different hardware platforms.
As a preparation for the performance measurements, a pre-study was conducted in whichexperienced engineers answered a questionnaire with questions about which platforms,functionality and performance parameters they thought were relevant to include in the study.Based on the answers, three hardware platforms with different levels of performance wereselected, and the HTTP server functionalities to test, as well as the performance parametersto measure, were chosen.
11
Ethernet [1] was chosen for the communication between the clients and servers, as it iswidely used and enables the embedded system to be easily connected to existing local areanetworks, LANs, and/or the Internet. Other advantages of Ethernet are data rates up to 100Gb/s [2] and the possibility to use Power over Ethernet [3], which makes it possible totransfer data and supply power to the embedded system through a single cable.
As the purpose of the thesis project was to compare the different hardware platforms, onepossible method would have been to test all platforms with the same software setup. Theonly thing changing would then have been the hardware, which would have resulted in astrict comparison of what the hardware was capable of with that particular software setup.However, that approach would have had several drawbacks. Firstly, it would not havecomplied with the goal to investigate the load limits on the different platforms, as softwarethat performs well on one platform might perform bad on other platforms. Secondly, all HTTPserver software that were desirable to test might not have been available for all the selectedhardware platforms. Because of the above mentioned reasons, an approach with differentsoftware on the different platforms was chosen instead. It was also decided that the choicesof operating systems to use would be based on what was typically used on the platforms.
Research was carried out to find available HTTP server software that was suitable for use inembedded systems, and the results are described in chapter 2. Among the availablealternatives, a few servers were selected to be used in the performance measurements. Theselection criteria were the following, the servers should be: a) developed for, or ported to, atleast one of the chosen platforms; b) supported by the operating system chosen for theparticular platform; c) lightweight and/or specifically designed for use in embedded systems.
To be able to test the performance of the HTTP servers, a simulated web application wasused. As described in chapter 3, there are many factors that affect the performance, and thisshould be taken into consideration when performing performance measurements. If the goalfor example is to find the most suitable HTTP server software for a certain application, thenit’s desirable to use a test setup that closely resembles the setup that will be used in the finalsystem, as this will result in more accurate data. Because of this, a simulated web applicationthat resembled a real world use case for a HTTP server in an embedded system wasdeveloped. As the purpose of the tests was to study load limits and performancecharacteristics, it was also of importance to simulate a web application where those factorsmatters.
1.5 DelimitationsThe following delimitations were done due to time constraints:
● The number of hardware platforms to test was limited to three.● Ethernet was used for all tests, i.e. no performance comparisons were made between
Ethernet and other communication technologies.● All of the tested platforms had 100 Mbit/s Ethernet controllers and no tests were
performed with either lower or higher performing Ethernet controllers.● All tests were performed in a LAN environment, i.e. the possible performance impact
of wide area network (WAN) characteristics was not measured.● The number of HTTP server software that were tested on each hardware platform
was, besides time constraints, also limited by availability. At most three HTTP serversoftware were tested per hardware platform.
12
● Only HTTP server software aimed at hosting web applications in the form of websites, i.e. web applications with human interaction on the client side, were considered.
● Only solutions where the entire web server application was placed in the embeddedsystem were tested, i.e. no solutions were tested where some material and/orcomputations were provided by external servers.
● Default HTTP server software settings were used for all tested servers, except for afew exceptions described in the test methodology chapter.
● One operating system per platform were used during the tests.● Default operating system settings were used during all tests.● All tests were performed with artificially generated loads.● All tests were performed with one simulated example application. Measurements and
comparisons between different types of web applications were not conducted.
1.6 Pre-study resultsThe pre-study consisted of three open questions that were answered by five engineers atSyntronic AB. The first question was “Which hardware platforms for embedded systems doyou think are relevant to use in this study?”. The answers to this question consisted mostly ofmicroprocessors and microcontrollers, but also two hardware platforms. The followinghardware were considered relevant for this study:
● Atmel AVR 32-bit [78]● Intel Atom [79]● ARM Cortex-M3 [80]● ARM Cortex-M4 [81]● ARM Cortex-A8 [82]● ARM Cortex-A9 [83]● Syntronic Midrange (uses ARM Cortex-M3)● Arduino [84]
Of these options ARM Cortex-M3, Atmel AVR32 and ARM Cortex-A8 were chosen, as theyhave different technical capacities and therefore represent three different levels of hardwareperformance.
The second question was “Which web server functionality would you like to see in embeddedsystems?”. The following functionality and technologies were suggested:
● Audio streaming● Video streaming● Responding to HTTP requests with HTTP responses containing HTML● Java applets● Dynamically generated responses● Firmware upgrade● WebSockets [85] together with HTML5 [86]● Presentation of real-time data
These answers were very diverse and all functionality mentioned above could not be testedbecause of time constraints. The following functionalities were chosen as they could becombined into a single example application that could be simulated in the tests: respondingto HTTP requests with HTTP responses containing HTML, dynamically generated responsesand presentation of real-time data.
13
The third question was “Which performance parameters are important for the functionalityyou mentioned above?”. The answers contained the following suggestions:
● Speed● Robustness● Volatile memory usage● Nonvolatile memory usage● Number of possible connections per time unit● The responsiveness of the web interface● Data throughput
The following measurements, at different levels of load, were chosen to cover all thesuggested parameters:
● HTTP reply rate● HTTP reply rate standard deviation● Durations for successful TCP [87] connections● Standard deviations for durations of successful TCP connections● CPU usage● Volatile memory usage● Nonvolatile memory usage● Network throughput● Communication errors● Server crashes
14
2. Available HTTP server softwareThis chapter gives an overview of the HTTP server software that was available for use inresource constrained environments in March 2012. It is not a complete list of available serversoftware, but it should give the reader an idea about what kinds of software there were tochoose between. The servers described are either specifically designed for use in embeddedsystems, or designed for low system resource usage in general. They are all general purposeservers that are not tied to a specific hardware platform.
Only servers with the capability to generate web pages with dynamic content are described,as that is required if the server should be used for monitoring of an embedded system. It isalso a very useful feature if the server is used for configuration of the embedded system, as itmakes it possible to display the current settings and verify that the desired changes havebeen made. An overview of the HTTP server software that are described in this chapter ispresented in Table 2.1., and more detailed descriptions are provided in chapters 2.1 to 2.10.Chapter 2.11 contains brief descriptions of three demonstration servers (not included in Table2.1.) that can be used as a starting point when developing HTTP servers on top of lwIP [91](a lightweight TCP/IP implementation).
The quality and amount of documentation varies greatly between the different servers, whichis reflected in the level of detail in the descriptions in this chapter. Specific “Comments”sections are used in some places in this chapter to cleanly separate the author’s reflectionsfrom the facts about the servers.
As a complement to the server descriptions below, it’s worth mentioning that if very littlesystem resources are available, a custom HTTP server that only implements the functionalitythat is needed by the web application that it serves, can be a good solution. Such a servercan be made very lightweight by, for example, only implementing a small part of the HTTPprotocol. An extreme example would be a web application that only consists of one page withdynamically generated content and doesn’t rely on data provided in the HTTP request. Insuch applications the parsing of the HTTP request can be completely omitted by the HTTPserver, which results in reduced volatile and nonvolatile memory usage, as well as reducedCPU load.
15

Table 2.1. Overview of HTTP server software that are covered in this chapter. Abbreviations used:Common Gateway Interface (CGI), Server Side Includes (SSI), Embedded Server Pages (ESP), FastCommon Gateway Interface (FastCGI), Simple Common Gateway Interface (SCGI).
Server Type Dynamic web page generation technologies
SSL/TLSsupport
Barracuda EmbeddedWeb Server [12], [13]
Framework Lua or C/C++ scripts Yes
yaSSL Embedded Web Server [14]
Standalone application orembedded in another application
CGI, SSI Yes
Boa Webserver [5] Standalone application CGI No
KLone [20] Framework CGI or scripts that are compiled into the server’s binary file
Yes
Fusion Embedded™ HTTPS [22]
Framework CGI Yes
BusyBox httpd [23] Standalone application CGI No
Appweb™ [26] Standalone application orframework
CGI, ESP or in-memory modules for Ejscript and PHP
Yes
Cherokee [43] Standalone application CGI, FastCGI, SCGI, uWSGI or SSI
Yes
thttpd [54] Standalone application CGI, SSI No
Lighttpd [88] Standalone application CGI, FastCGI, SCGI, SSI, among others
Yes
16
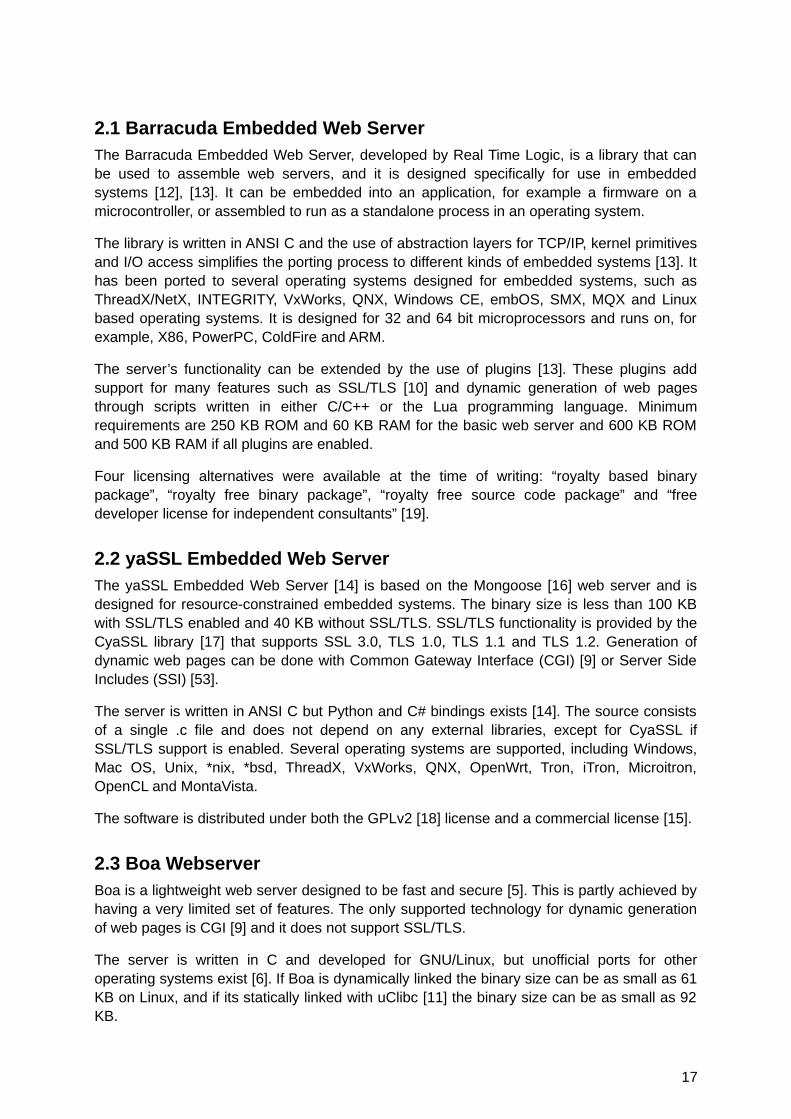
2.1 Barracuda Embedded Web ServerThe Barracuda Embedded Web Server, developed by Real Time Logic, is a library that canbe used to assemble web servers, and it is designed specifically for use in embeddedsystems [12], [13]. It can be embedded into an application, for example a firmware on amicrocontroller, or assembled to run as a standalone process in an operating system.
The library is written in ANSI C and the use of abstraction layers for TCP/IP, kernel primitivesand I/O access simplifies the porting process to different kinds of embedded systems [13]. Ithas been ported to several operating systems designed for embedded systems, such asThreadX/NetX, INTEGRITY, VxWorks, QNX, Windows CE, embOS, SMX, MQX and Linuxbased operating systems. It is designed for 32 and 64 bit microprocessors and runs on, forexample, X86, PowerPC, ColdFire and ARM.
The server’s functionality can be extended by the use of plugins [13]. These plugins addsupport for many features such as SSL/TLS [10] and dynamic generation of web pagesthrough scripts written in either C/C++ or the Lua programming language. Minimumrequirements are 250 KB ROM and 60 KB RAM for the basic web server and 600 KB ROMand 500 KB RAM if all plugins are enabled.
Four licensing alternatives were available at the time of writing: “royalty based binarypackage”, “royalty free binary package”, “royalty free source code package” and “freedeveloper license for independent consultants” [19].
2.2 yaSSL Embedded Web ServerThe yaSSL Embedded Web Server [14] is based on the Mongoose [16] web server and isdesigned for resource-constrained embedded systems. The binary size is less than 100 KBwith SSL/TLS enabled and 40 KB without SSL/TLS. SSL/TLS functionality is provided by theCyaSSL library [17] that supports SSL 3.0, TLS 1.0, TLS 1.1 and TLS 1.2. Generation ofdynamic web pages can be done with Common Gateway Interface (CGI) [9] or Server SideIncludes (SSI) [53].
The server is written in ANSI C but Python and C# bindings exists [14]. The source consistsof a single .c file and does not depend on any external libraries, except for CyaSSL ifSSL/TLS support is enabled. Several operating systems are supported, including Windows,Mac OS, Unix, *nix, *bsd, ThreadX, VxWorks, QNX, OpenWrt, Tron, iTron, Microitron,OpenCL and MontaVista.
The software is distributed under both the GPLv2 [18] license and a commercial license [15].
2.3 Boa WebserverBoa is a lightweight web server designed to be fast and secure [5]. This is partly achieved byhaving a very limited set of features. The only supported technology for dynamic generationof web pages is CGI [9] and it does not support SSL/TLS.
The server is written in C and developed for GNU/Linux, but unofficial ports for otheroperating systems exist [6]. If Boa is dynamically linked the binary size can be as small as 61KB on Linux, and if its statically linked with uClibc [11] the binary size can be as small as 92KB.
17
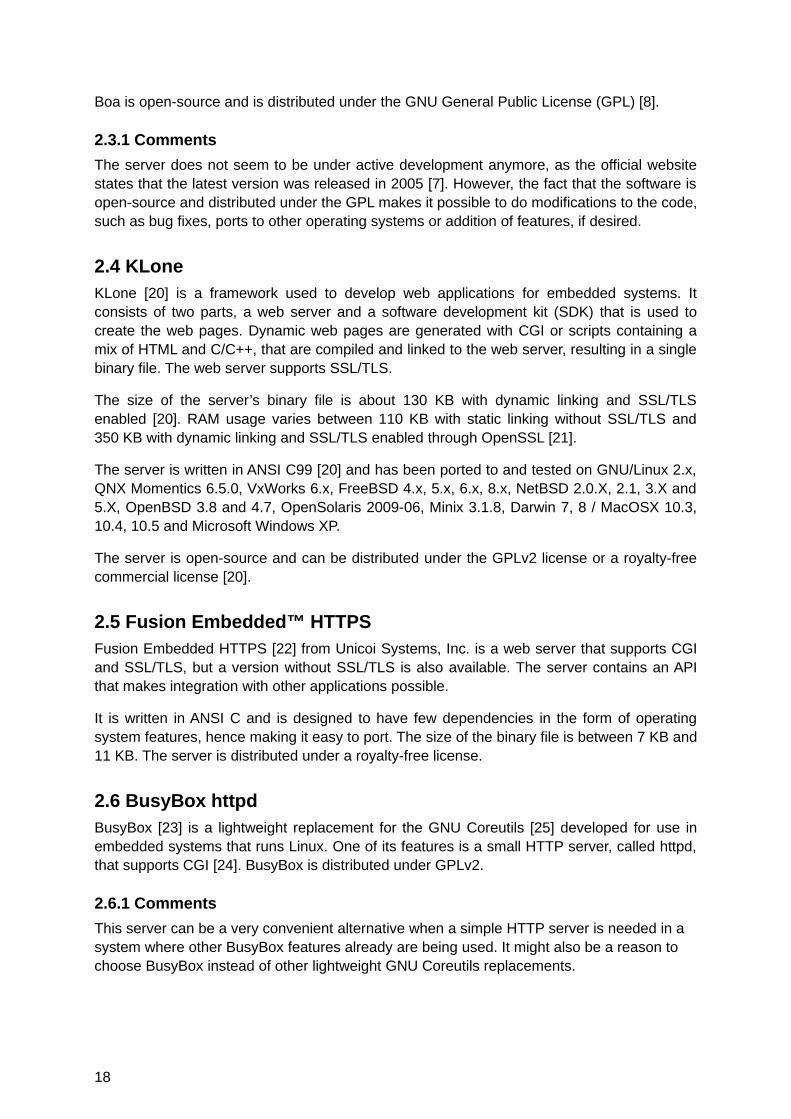
Boa is open-source and is distributed under the GNU General Public License (GPL) [8].
2.3.1 Comments
The server does not seem to be under active development anymore, as the official websitestates that the latest version was released in 2005 [7]. However, the fact that the software isopen-source and distributed under the GPL makes it possible to do modifications to the code,such as bug fixes, ports to other operating systems or addition of features, if desired.
2.4 KLoneKLone [20] is a framework used to develop web applications for embedded systems. Itconsists of two parts, a web server and a software development kit (SDK) that is used tocreate the web pages. Dynamic web pages are generated with CGI or scripts containing amix of HTML and C/C++, that are compiled and linked to the web server, resulting in a singlebinary file. The web server supports SSL/TLS.
The size of the server’s binary file is about 130 KB with dynamic linking and SSL/TLSenabled [20]. RAM usage varies between 110 KB with static linking without SSL/TLS and350 KB with dynamic linking and SSL/TLS enabled through OpenSSL [21].
The server is written in ANSI C99 [20] and has been ported to and tested on GNU/Linux 2.x,QNX Momentics 6.5.0, VxWorks 6.x, FreeBSD 4.x, 5.x, 6.x, 8.x, NetBSD 2.0.X, 2.1, 3.X and5.X, OpenBSD 3.8 and 4.7, OpenSolaris 2009-06, Minix 3.1.8, Darwin 7, 8 / MacOSX 10.3,10.4, 10.5 and Microsoft Windows XP.
The server is open-source and can be distributed under the GPLv2 license or a royalty-freecommercial license [20].
2.5 Fusion Embedded™ HTTPSFusion Embedded HTTPS [22] from Unicoi Systems, Inc. is a web server that supports CGIand SSL/TLS, but a version without SSL/TLS is also available. The server contains an APIthat makes integration with other applications possible.
It is written in ANSI C and is designed to have few dependencies in the form of operatingsystem features, hence making it easy to port. The size of the binary file is between 7 KB and11 KB. The server is distributed under a royalty-free license.
2.6 BusyBox httpdBusyBox [23] is a lightweight replacement for the GNU Coreutils [25] developed for use inembedded systems that runs Linux. One of its features is a small HTTP server, called httpd,that supports CGI [24]. BusyBox is distributed under GPLv2.
2.6.1 Comments
This server can be a very convenient alternative when a simple HTTP server is needed in a system where other BusyBox features already are being used. It might also be a reason to choose BusyBox instead of other lightweight GNU Coreutils replacements.
18
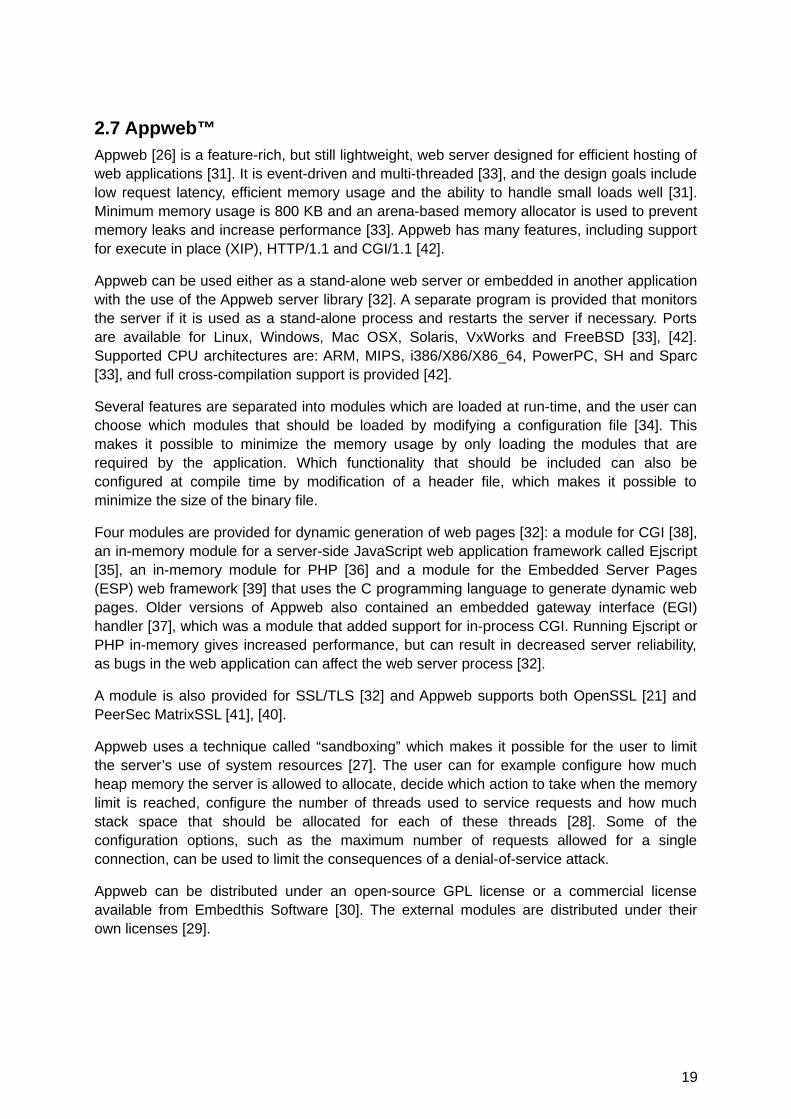
2.7 Appweb™Appweb [26] is a feature-rich, but still lightweight, web server designed for efficient hosting ofweb applications [31]. It is event-driven and multi-threaded [33], and the design goals includelow request latency, efficient memory usage and the ability to handle small loads well [31].Minimum memory usage is 800 KB and an arena-based memory allocator is used to preventmemory leaks and increase performance [33]. Appweb has many features, including supportfor execute in place (XIP), HTTP/1.1 and CGI/1.1 [42].
Appweb can be used either as a stand-alone web server or embedded in another applicationwith the use of the Appweb server library [32]. A separate program is provided that monitorsthe server if it is used as a stand-alone process and restarts the server if necessary. Portsare available for Linux, Windows, Mac OSX, Solaris, VxWorks and FreeBSD [33], [42].Supported CPU architectures are: ARM, MIPS, i386/X86/X86_64, PowerPC, SH and Sparc[33], and full cross-compilation support is provided [42].
Several features are separated into modules which are loaded at run-time, and the user canchoose which modules that should be loaded by modifying a configuration file [34]. Thismakes it possible to minimize the memory usage by only loading the modules that arerequired by the application. Which functionality that should be included can also beconfigured at compile time by modification of a header file, which makes it possible tominimize the size of the binary file.
Four modules are provided for dynamic generation of web pages [32]: a module for CGI [38],an in-memory module for a server-side JavaScript web application framework called Ejscript[35], an in-memory module for PHP [36] and a module for the Embedded Server Pages(ESP) web framework [39] that uses the C programming language to generate dynamic webpages. Older versions of Appweb also contained an embedded gateway interface (EGI)handler [37], which was a module that added support for in-process CGI. Running Ejscript orPHP in-memory gives increased performance, but can result in decreased server reliability,as bugs in the web application can affect the web server process [32].
A module is also provided for SSL/TLS [32] and Appweb supports both OpenSSL [21] andPeerSec MatrixSSL [41], [40].
Appweb uses a technique called “sandboxing” which makes it possible for the user to limitthe server’s use of system resources [27]. The user can for example configure how muchheap memory the server is allowed to allocate, decide which action to take when the memorylimit is reached, configure the number of threads used to service requests and how muchstack space that should be allocated for each of these threads [28]. Some of theconfiguration options, such as the maximum number of requests allowed for a singleconnection, can be used to limit the consequences of a denial-of-service attack.
Appweb can be distributed under an open-source GPL license or a commercial licenseavailable from Embedthis Software [30]. The external modules are distributed under theirown licenses [29].
19

2.8 CherokeeCherokee [43] is a lightweight web server that is completely modular. It supports SSL/TLSand several methods for generation of dynamic web pages. The basic server’s onlydependency is the C standard library [45] and ports are available for Unix, Linux andWindows [43]. The size of the binary file depends on the options selected during compilation,and a static build for an embedded device can create a binary file as small as 200 KB [45].Some configuration options for control of the server’s use of system resources are available,such as the possibility to specify the number of threads used when handling incomingrequests [46].
SSL/TLS support is provided by the OpenSSL backend by default, but the server’s modulardesign makes it possible to implement other backend libraries [45]. Five differenttechnologies are provided for generation of dynamic web pages [44]: the Common GatewayInterface (CGI) [9], the Fast Common Gateway Interface (FastCGI) [49], the Simple CommonGateway Interface (SCGI) [50], the uWSGI protocol (uWSGI) [51] and Server Side Includes(SSI) [52]. Modules for audio and video streaming are also available [44].
Cherokee is distributed under the GNU General Public License version 2 [18], but alternativelicensing schemes can be obtained from the company Octality [48], [47].
2.9 thttpd - tiny/turbo/throttling HTTP serverthttpd is a small web server [54]. It has few features and is designed to use small amounts ofmemory, which is accomplished partly with a scaling strategy that does not involve forking. Itis written in C and can be compiled on FreeBSD, SunOS 4, Solaris 2, BSD/OS, Linux andOSF. The size of the executable file is about 50 KB [58].
CGI 1.1 is supported [55] and a few options are available for control of the CGI programs[57]. It is for example possible to set a time limit for the execution of CGI programs. This canbe valuable as it frees up system resources if there are bugs in the CGI programs that forexample causes infinite loops. It is also possible to set the priority level for the CGIprocesses, thereby controlling the amount of CPU time given to the process by the operatingsystem. A CGI program that implements Server Side Includes (SSI) is available [56].
The server also includes a feature called URL-traffic-based throttling, which makes it possibleto set both maximum and minimum byte rates on single URLs or groups of URLs [55].
2.9.1 Comments
URL-traffic-based throttling can be useful if there are specific web pages that are moreimportant than others and should get priority in a situation where the byte rate is a limitingfactor. If the server for example serves a dynamic page that shows warnings if a safetycritical failure occurs, that page can be given higher maximum and minimum byte rates thanless important pages.
20
2.10 LighttpdLighttpd stands out in this list, as it is not designed for resource constrained systems. On thecontrary, it is actually optimized for high performance environments and large numbers ofconcurrent connections [88]. What makes Lighttpd interesting in the context of embeddedsystems is that it aims to have low system resource usage compared to other serverscapable of the same levels of performance.
Lighttpd is a modularized, feature packed HTTP server that has an extensive amount ofconfiguration options [90]. It supports SSL and has several modules for generation of webpages with dynamic content, such as modules for CGI, FastCGI, SCGI and SSI.
The server is distributed under the revised BSD license [89].
2.11 HTTP servers built on top of lwIPlwIP is a lightweight TCP/IP implementation developed for use in embedded systems [91]. Itis designed to be easy to port to different platforms, and can be used with an underlyingoperating system or as a standalone application [92].
Two examples of HTTP servers built on top of lwIP can be found on the project’s website[93]. The first example [94] demonstrates how to make a very basic HTTP server that uses Ccode to generate web pages. The second example [95] is much more advanced andimplements both SSI and CGI for generation of web pages with dynamic content.
Many more demonstration servers exist, and some of them also include examples of webapplications. One of these is a server made by Stefano Oliveri [96] that demonstrates how tocreate bidirectional communication over TCP/IP using a HTTP server that serves a web pagecontaining a Java applet.
21
3. Measuring embedded HTTP server performanceThis chapter discusses techniques that can be used to measure the performance of HTTPservers, as well as factors that affect the measurement result.
3.1 Performance parametersMany different performance parameters can be used when measuring the performance of aHTTP server. Which parameters to choose depends on the purpose of the measurements. Ifyou for example want to find out if the network the HTTP server is connected to acts as aperformance bottleneck, then the network’s throughput in the unit kilobits per seconds can beuseful.
Which performance parameters that are relevant to measure for a HTTP server in anembedded system depends on the load characteristics and the type of web application thatthe server serves. In other words, a performance parameter that is crucial in one applicationcan be irrelevant to measure in other applications.
A performance parameter that is very common in web server benchmarking results publishedon the Internet is the number of requests per second the server can respond to underdifferent load conditions. This is a very important parameter if the web application forexample is a monitoring system that requests data from the server at a certain frequency. Onthe other hand, if the web application is used for configuration of an embedded system and isused once every month by one user, then this performance parameter might be irrelevant tomeasure.
Two other common performance parameters are response time, measured in milliseconds,and throughput, measured in bytes per second. The response time and throughput does insome use cases only affect the user experience and not the actual functionality, but it can stillbe important, even in these cases, as users can be annoyed if the web application is toounresponsive. However, long response times and low throughput can be seen as acceptablein some cases, where the main functionality of the embedded system uses a largepercentage of available system resources and the web server functionality has a low priority.Low response times and high throughput can in other use cases be very important, forexample if the web application is used for manual control of some functionality in theembedded system.
3.2 Factors affecting measurement resultsThere are many factors that affect HTTP server performance and performance measurementresults. Some of the factors might seem trivial, while others, like certain operating systemsettings, can be easy to miss. The factors include, but are not limited to, those listed belowand are here divided into four categories:
1. The server.2. The network.3. The web application.4. The clients.
22
3.2.1 The server
As shown by Pariag et al. [67] both the server software architecture and tuning of serversoftware parameters can have a significant impact on performance. Many of the serversdesigned for use in embedded systems are optimized for low system resource usage andusually has settings that can be used to limit their system resource usage with the tradeoff ofdecreased performance. Therefore, it is important to review, and potentially change, thedefault settings, in order to make sure that they are optimized for the intended application.Many servers are also modularized, and as a rule of thumb only modules that are required bythe application should be activated. Otherwise you run a risk of degraded performance byhaving a module active, even if it is not used by the web application. Some server featurescan have a major impact on the server’s performance. Coarfa et al. [68] showed that the useof TLS can result in substantially increased CPU load and lowered server throughput.
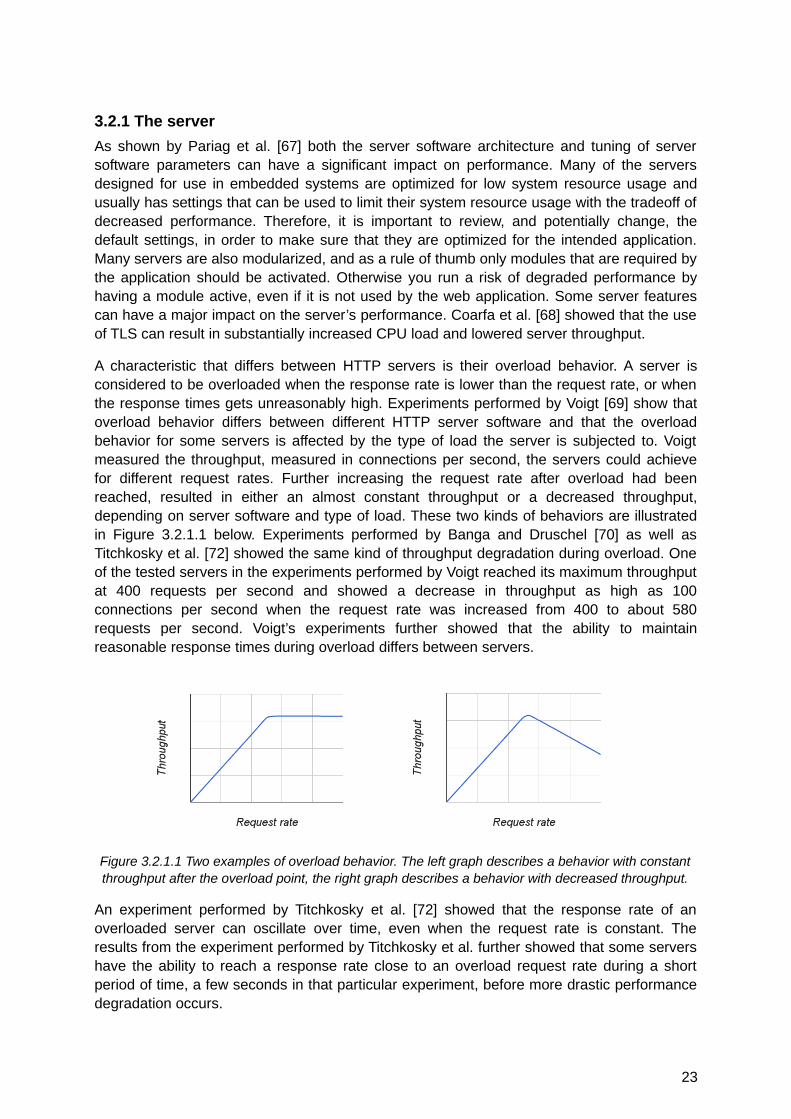
A characteristic that differs between HTTP servers is their overload behavior. A server isconsidered to be overloaded when the response rate is lower than the request rate, or whenthe response times gets unreasonably high. Experiments performed by Voigt [69] show thatoverload behavior differs between different HTTP server software and that the overloadbehavior for some servers is affected by the type of load the server is subjected to. Voigtmeasured the throughput, measured in connections per second, the servers could achievefor different request rates. Further increasing the request rate after overload had beenreached, resulted in either an almost constant throughput or a decreased throughput,depending on server software and type of load. These two kinds of behaviors are illustratedin Figure 3.2.1.1 below. Experiments performed by Banga and Druschel [70] as well asTitchkosky et al. [72] showed the same kind of throughput degradation during overload. Oneof the tested servers in the experiments performed by Voigt reached its maximum throughputat 400 requests per second and showed a decrease in throughput as high as 100connections per second when the request rate was increased from 400 to about 580requests per second. Voigt’s experiments further showed that the ability to maintainreasonable response times during overload differs between servers.
Figure 3.2.1.1 Two examples of overload behavior. The left graph describes a behavior with constantthroughput after the overload point, the right graph describes a behavior with decreased throughput.
An experiment performed by Titchkosky et al. [72] showed that the response rate of anoverloaded server can oscillate over time, even when the request rate is constant. Theresults from the experiment performed by Titchkosky et al. further showed that some servershave the ability to reach a response rate close to an overload request rate during a shortperiod of time, a few seconds in that particular experiment, before more drastic performancedegradation occurs.
23
Titchkosky et al. tested several techniques for generation of web pages with dynamiccontent. Two of these, PHP and Perl, were tested in combination with the same HTTP server,as modules for Apache 1.3.27. The results showed significant differences in overload pointsfor PHP and Perl, which indicates that the choice of technique for generation of web pageswith dynamic content can have a major influence on a server’s performance. In addition tothe choice of programming language used for the scripts that generate the web pages, youalso have several techniques to choose between when it comes to ways of executing thecode, such as CGI, FastCGI and different kinds of server modules.
The choice of operating system can also affect the server performance, and some operatingsystem settings can act as bottlenecks and significantly decrease the server’s performance ifthey are not properly tuned. An example of such a variable in Linux is the maximum numberof file descriptors that a single process is allowed to open [65]. This variable affects someserver software architectures more than others, as described by Midgley [65]. Serversoftware that use several system processes to process requests are less likely to beaffected, while single process servers that use one file descriptor per connection can getsevere performance degradation if the limit is too low. Other operating system features, suchas logging of incoming connections, can also decrease the server’s performance if they areactivated.
Another example of a potential operating system setting bottleneck is the somaxconn kernelvariable that is used in most UNIX-based TCP/IP implementations to limit the sum of thelengths of the queues used for storing new connections before they are completelyestablished and passed on to the HTTP server for processing of incoming data [70]. Theserver TCP will ignore new connection requests as long as these queues are full, andaccording to Banga and Druschel [70] this behavior can limit the throughput of the server ifthe somaxconn variable is set too low. The reason for this is that new connection requestswill be dropped even if the server software is capable of processing them. Banga andDruschel further states that the sum of the lengths of these queues depends on theround-trip delay between the server and the clients, the connection request rate and the rateat which the HTTP server processes requests. An increase in round-trip delays results in anincrease in the sum of the queue lengths. An effect of this that is very important to consider isthat a somaxconn setting that works well in a LAN can become a bottleneck in a WAN, wherethe round-trip delays typically are longer.
On many platforms there are several TCP/IP implementations to choose between, and animportant consideration is that some of them that are developed for embedded systems areoptimized for low memory usage, and not for high speed.
Other software running on the same hardware as the HTTP server can of course degrade theHTTP server’s performance, by using shared resources. This can be an important factor inembedded systems where the HTTP server is not considered to be the main functionality,and runs with low priority.
Many parts of the server’s hardware may become bottlenecks for the server’s performance.Servers can for example be memory, CPU or I/O bound.
3.2.2 The network
There are a number of factors related to the network that the HTTP server is connected tothat affect the performance of the server. Bandwidths, round-trip delays and packet loss ratesare examples of these factors, and differs in different kinds of networks. Networks where
24
HTTP servers are used can be split into two major categories, local area networks (LANs)and wide area networks (WANs). The main difference between the two is that WANsgenerally have higher packet loss rates and round-trip delays.
Banga and Druschel [70] measured how packet loss rates and round-trip delays in WANsaffect HTTP server performance. They performed their benchmarks in a LAN, but placed arouter in front of the benchmarked servers and used software in the router to artificiallycreate round-trip delays and packet loss. They benchmarked two HTTP servers, Apache1.2.4 and Zeus 1.3.0. The results from the experiments with artificial round-trip delaysshowed that a 200 millisecond delay caused Apaches throughput to decrease about 54%compared to the throughput at 0 milliseconds delay. For Zeus the throughput decreasedabout 20%. Based on their results, Banga and Druschel concluded that “... wide-areanetwork delays have a significant impact on the performance of Web servers.”. Anotherconclusion that can be made is that the performance degradation caused by round-tripdelays differs between servers.
Banga and Druschel [70] also performed benchmarks with a constant round-trip delay, butvarying packet loss rates. The results from this experiment showed that also packet lossrates can cause a significant degradation of server throughput. Banga and Druschelexplained the throughput decreases, caused by both round-trip delay and packet loss, withincreased durations for HTTP transactions, which increased the number of concurrentconnections that the servers had to handle, for a fixed request rate.
3.2.3 The web application
The type of web application, and also the design of the web application, that the HTTP serverserves can affect the server’s performance. Titchkosky et al. [72] benchmarked two versionsof the Apache web server, 1.3.27 and 2.0.45, and measured response rates for both deliveryof web pages with static content and delivery of web pages with dynamic content. The webpages with dynamic content was generated by PHP scripts on Apache 1.3.27 and on Apache2.0.45 benchmarks were performed with both PHP and Perl. Both PHP and Perl wererunning as Apache modules. After analysis of the test results, Titchkosky et al. concluded that“... dynamic page generation alone can reduce the server's peak response rate by a factor of3 to 4.”.
As described above, in section 3.2.2, the HTTP server’s throughput can be affected by thedurations for each HTTP transaction. A result of this is that the throughput can be affected bythe execution time for the code that is used to generate the responses. Hence, activities suchas fetching sensor values, fetching information from other processors in the embeddedsystem, or querying a database can degrade the HTTP server’s throughput.
3.2.4 The clients
The characteristics of the load that the clients generate on a HTTP server affects the server’sperformance. One example of such characteristics is the burstiness of the generated traffic.Banga and Druschel [64] tested the effects of burstiness on the throughput of the NCSA 1.5.1server and concluded that “... even a small amount of burstiness can degrade the throughputof a Web server.”.
The clients hardware and software can also affect the performance. For example, slow clientmachines may increase the durations of HTTP transactions and cause server throughputdegradation, in the same way as round-trip delays and packet loss.
25
3.2.5 Conclusions
The large number of factors affecting a HTTP server’s performance, and the fact that someof these factors have a significant impact, makes it possible to make some importantconclusions. Firstly, it is difficult to compare results of benchmarks done with different testsetups. Secondly, one should be careful when generalizing benchmarking results from a testenvironment, as the HTTP server’s actual performance in the production environment candiffer greatly, if for example the networks packet loss rate is different.
3.3 PreparationThere are many possible reasons to why you would like to carry out performancemeasurements of an HTTP server in an embedded system, for example finding the mostsuitable server software for a certain application, verifying that a system can handle definedrequirements, or finding bottlenecks to be able to optimize a system. Whatever the reason,the recommended approach is to create a test environment that as closely as possibleemulates the production environment, within the constraints of budget and time, in order toget as useful and accurate results as possible. The reason for this is the many factors thatwill affect the server’s performance, as described in section 3.2.
In order to set up the test environment, there are a few major areas to consider. What shouldbe measured, which performance parameters are relevant? What type of web application?What type of load should be used? For example, how many clients should access the serversimultaneously, user behavior patterns, amount of data in both requests and responses, loaddistribution between different web pages in the application? What type of environment shouldbe simulated? For example, LAN, WAN, or both LAN and WAN? Software and hardware onthe server and client side?
3.4 Measurement methodologyThe test setup that most accurately simulates real world scenarios is to use one softwareclient per client machine. This can be a feasible setup if the goal is to simulate a use casewith just a few clients, but if the goal is to for example simulate the load of a few hundredclients, then this approach gets impractical and probably quite expensive. A commonapproach is to instead use a small number of client machines running load generationsoftware that simulates a large number of clients. This approach has the advantage ofkeeping costs lower and can, in some cases, decrease the complexity level of the system.
If the server will be accessed through a WAN in the real world application, then either a WANor some kind of WAN simulation should be used during the tests, as it will make the testresults more accurate. If the test results should be repeatable, which is crucial if the goal withthe measurements is to compare different servers or tune a server, then a WAN simulationthat has the same behavior for every test run is more appropriate than performing the testswith the use of a real WAN. If the tested server for example is accessed through the Internet,then the results from different test runs might not be comparable, as the load in the networkcan be very different between the different test runs. Banga and Druschel [64, 70] propose atest setup where the clients are connected to the server through a router, as an artificialdelay can be added in the router’s forwarding mechanism to simulate WAN delays. Therouter can also be used to simulate other WAN effects, such as packet loss and bandwidthfluctuations [70]. However, it is important to make sure that the router isn’t a bottleneck.
26
If the goal of the measurements is to find a server's performance limits, then, as stated byMidgley [65], the results of the measurements will only be accurate if the server is the onlybottleneck in the test environment. Banga and Druschel [64, 70] underline the importance oftaking the clients performance into consideration, as poor client performance can distort themeasurement results. Some factors that can affect a HTTP server’s performance, such asoperating system settings related to TCP, can also affect the performance of a client machinethat is running load generation software. On the other hand, if the test is used forperformance verification of an entire system, both the network and clients can bebottlenecks. In this case it’s crucial that the test environment is as similar to the productionenvironment as possible.
A method, proposed by Midgley [65], that can be used to determine if the clients are abottleneck, is to perform two test runs with different amounts of client machines, but with thesame resulting load on the server. The clients are not a bottleneck if the results for the twotest runs are equal. Furthermore, Midgley advice against the method of using system loadmeasurements in the client to determine if it is a bottleneck, as some benchmarking toolsreport 100% CPU usage even when they haven’t reached their maximum capacity. Tools thatmeasure the network load can be used to determine if the network is a bottleneck. If thenetwork load is close to the network's maximum limit, then the network might be a bottleneck.
A technique that can be used to find load limits, that is commonly described in the literature,is to perform a series of test runs with different levels of load generated from the clientmachines. This can for example be used to find a server’s overload point for a certain type ofload. A decision that can have a great impact on the measurement results from this kind ofstudy is the duration for each test run. The reason for this is the fact that some HTTP serverscan handle load levels above their overload point for a short period of time, as described insection 3.2.1. The ideal duration for each test run is therefore the duration that the serverwould experience the load in the production environment, with an added safety margin.However, this is not always possible due to time and budget constraints. The problem ofselecting a duration that gives accurate results is discussed by Titchkosky et al. [72], but nogeneral solution is proposed and the study resorts to a trial and error approach.
3.5 ToolsThere are many tools available, both free and commercial, that can be used to measure theperformance of HTTP servers. The feature sets vary greatly between them, but it is commonthat the same tool is used both for making measurements and generating traffic. Below youcan find a list of some of the available tools.
● httperf - HTTP performance measurement tool [59]● ab - Apache HTTP server benchmarking tool [60]● Apache JMeter™ [61]● Tsung [62]● weighttp [63]● Load Tester [66]● Webserver Stress Tool [71]● curl-loader [97]● OpenSTA [98]● IxLoad [99]● Spirent Avalanche [100]
27
4. Test environmentThis chapter describes the hardware and software that was used in the tests. The testenvironment consisted of one client machine and three servers. The client machine wasconnected directly to one server at a time with an Ethernet cable. This minimal and isolatednetwork setup was used to eliminate the risk of interference that would be present if otherequipment was connected to the network. The use of an isolated LAN in favor of a LAN orWAN with competing communication increased the reliability of the tests.
4.1 ClientThe software that was used for measuring the web servers’ performance was httperf-0.9.0[59], compiled without debug mode support. Among the options described in chapter 3 httperfwas chosen for several reasons. It could measure all the parameters that were selected inthe pre-study and it could be configured to simulate the characteristic load that the testedapplication would have been subjected to in the real world. Furthermore it providedmeasurements of disturbances from other software running on the client.
The client machine that was used for running httperf was a HP ProBook 6550b with a IntelCore i5 M450 processor, 4 GB memory and a 38.8 GB hard drive. The operating system wasthe 64-bit version of Ubuntu 12.04 LTS. The Ethernet controller was an Intel 82577LC with 1Gbit/s capacity.
4.2 ServersOne hardware platform was selected for each processor that was selected in the pre study.The requirements for the platforms was that they had to have support for 10/100 Mbit/sEthernet. Each of the selected platforms are described below.
4.2.1 BeagleBoard-xM
The BeagleBoard-xM [101] was the most powerful of the three hardware platforms and itsspecifications can be seen in Table 4.2.1.1.
The operating system that was used was the Ångström Distribution version 2010.7 usingLinux 2.6.32. The Ångström Distribution was chosen as it had support for theBeagleBoard-xM and several web servers. The operating system was installed on a microSD card.
The program that was used for measuring CPU load and memory usage was the sar utility insysstat version 9.0.6. Three servers were tested: BusyBox httpd v1.13.2, Lighttpd/1.4.26 andCherokee Web Server 0.99.24. They were chosen as they were supported by Ångström andcould generate HTTP responses with dynamically generated content.
28

Table 4.2.1.1. BeagleBoard-xM specifications.
Processor architecture ARM Cortex-A8
Processor model TI DM3730
Processor performance 2000 DMIPS, 1 GHz
Board version BeagleBoard-xM Rev A
Volatile memory 512 MB external
Nonvolatile memory 4 GB micro SD card
Ethernet controller 10/100 Mbit/s, external with MAC and PHY
4.2.2 STK1000
The STK1000 [102] was the second most powerful of the three hardware platforms and itsspecifications can be seen in Table 4.2.2.1.
The operating system that was used was AVR32 Linux using the 2.6.35.4 kernel. AVR32Linux was chosen as it was shipped together with the board and also supported several webservers. The operating system was installed on a SD card.
The program that was used for measuring CPU load and memory usage was the sar utility insysstat version 9.0.5 and the top utility in BusyBox v1.16.2. Three servers were tested:BusyBox httpd v1.13.2, Lighttpd/1.4.26 and thttpd/2.25b. They were chosen as they weresupported by AVR32 Linux and could generate HTTP responses with dynamically generatedcontent.
Table 4.2.2.1. STK1000 specifications.
Processor architecture Atmel AVR32 AP7
Processor model AT32AP7000
Processor performance 210 DMIPS, 140 MHz
Board version STK1000
Volatile memory 8 MB external SDRAM, 32 kB internal
Nonvolatile memory 256 MB SD card, 8 MB parallel flash
Ethernet controller 10/100 Mbit/s, internal MAC, external PHY
29

4.2.3 Midrange
The Midrange platform, developed by Syntronic AB [77], was the least powerful of the threehardware platforms and its specifications can be seen in Table 4.2.3.1.
The operating system that was used was FreeRTOS V5.4.2. FreeRTOS was chosen as it isthe operating system that is most frequently used by Syntronic on this platform. Theoperating system was installed in an internal flash memory.
The server that was tested was a modified version of a server made by Stefano Oliveri(SSO) [96]. The server was originally bundled with an example web application, but thatapplication was removed and replaced with the test application. This server was chosen as itwas the only server that was ported to the platform and could generate HTTP responses withdynamically generated content. The server and operation system was compiled with GCC,without debug information and with the -O2 optimization flag set.
CPU load and memory usage was not measured on the Midrange platform, see chapter 5.3for details.
Table 4.2.3.1. Midrange specifications.
Processor architecture ARM Cortex-M3
Processor model STM32F103VCT6
Processor performance 90 DMIPS, 72 MHz
Board version Syntronic Midrange
Volatile memory 48 kB internal
Nonvolatile memory 256 kB internal, optional SD card
Ethernet controller 10/100 Mbit/s, external via SPI
30
5. Test methodologyThis chapter describes the methodology that was used for the tests, as well as the simulatedweb application.
5.1 Simulated web application, instrument panel
As described in chapter 1.6, the functionality that the simulated web application shouldinclude was:
● Responding to HTTP requests with HTTP responses containing HTML.● Dynamically generated responses.● Presentation of real-time data.
The type of web application that was chosen was an instrument panel, as it is commonlyused in embedded systems and incorporates all these functionalities. The simulated webapplication implemented the real-time aspect by sending a web page containing an AJAXscript as the first response to a new client. The AJAX script then automatically generatedrequests for new data to display on the instrument panel at a fixed frequency. The responsesto the AJAX requests were generated dynamically on the server and contained the newvalues for the instrument panel. All the traffic was sent over a LAN using HTTP and theresponses consisted of HTML.
The simulated load consisted of one client that was requesting instrument panel updatesfrom the server during an extended amount of time. The simulated load can also beinterpreted as several concurrently connected clients. If the total load for example is 100 TCPconnection initiations per second, it could be seen as one client requesting updates 100times per second, or 100 clients requesting updates one time per second. However, thepossible scenario of all clients sending requests at the same time, and causing bursts ofrequests to the server, was not simulated.
5.2 Simulation techniques
The AJAX requests were simulated by configuring httperf to send requests at a fixedfrequency. Httperf was configured to initiate a new TCP connection for every HTTP request.The web page containing the AJAX script was not simulated, as it is requested only once forevery new client, whilst the requests for new data can occur an unlimited amount of times foreach client. The load generated by the request for the initial web page is hence negligiblecompared to the load generated by the AJAX requests when the load consists of a fewclients that are connected for an extended amount of time.
On the BeagleBoard-xM and STK1000 platforms the responses were generated by CGI shellscripts that were called by the tested HTTP server software. On the Midrange platform theresponses were generated directly by the HTTP server software. In a real instrument panelapplication, the code that generated the responses would have been responsible for readingsensor values and include these values in the responses. However, the code used in thetests generated the same output every time it was called, but generated that output using thesame technologies that would have been used to generate dynamic responses. The reasonfor this was that the time it takes to read real sensor values can be non-deterministic, whichwould make comparisons of the measurement results unreliable. Random output from thecode that generated the responses was considered, but not chosen. Instead the code
31
generated the exact same data for every test, in order to make the results repeatable and thedifferent test runs comparable. As described in chapter 3, the amount of time it takes togenerate HTTP responses can affect the server’s performance, as the system resources tiedto the request will be held during the time when the response is generated. Furthermore, thepurpose of the tests were to measure the performance of the HTTP servers, not theperformance of sensors.
The size of each generated response was 256 bytes, including both HTTP headers andcontent, in all tests. Such a small amount of data was sent in order to simulate responsesonly containing data, and not an entire web page. This is a common technique used tominimize server and client load, as well as network throughput. It is a suitable technique touse in embedded systems as it limits resource usage.
All tested servers did not support HTTP keep-alive and it was therefore disabled on allservers in order to improve the comparability between the test results for different servers.With the chosen httperf configuration, initiating a new TCP connection for every HTTPrequest, enabling HTTP keep-alive would probably have decreased the performance of theservers using keep-alive by sustaining connections server side that the client didn’t use. Onthe other hand, if the httperf configuration was changed to send several HTTP requests perTCP connection, then keep-alive might improve the performance of the servers supportingkeep-alive, but it would not have been possible to use that kind of httperf configuration fortesting the servers that didn’t support keep-alive.
5.3 Measurement techniques
The testing of each server consisted of test runs at different load levels on the HTTP server,starting from a very low load and ending well beyond the server’s overload point. For eachtest run httperf was configured to create a load with a constant TCP connection initiation rate,and that load was sustained for 180 seconds. A test duration of 180 seconds was chosen asthe httperf manual version 0.9 [73] states that a test duration of at least 150 seconds isrecommended to obtain standard deviations that are meaningful. This meant that the leastamount of measurements performed during each test run was 180, when the load was set toits minimum value, i.e. one connection initiation per second. The maximum amount ofmeasurements performed during a test run was 45 000.
The fact that the TCP connection initiation rate was constant made it possible to createoverload in the server, as the load generating software didn’t wait for responses from theserver before initiating new TCP connections. The server was considered to be overloadedwhen the average HTTP reply rate became lower than the TCP connection initiation rate.When overload was detected, more test runs were made with loads between the load whereoverload was detected and the tested load just below that. This was done in order to find theoverload point and observe the behavior around the overload point. Knowing the overloadbehavior of a server used in embedded system can be very important in some applications. Aserver that for example causes the operating system to crash when it is overloaded shouldbe avoided if high availability is important.
Httperf measures its own CPU usage and the results can be used to validate that otherprocesses running on the client machine are not disturbing the tests [73]. The server wasrebooted between every test run to reset caches and the server’s and operating system’sstates in general. This was done in order to isolate the test runs from each other so that a
32
test run wasn’t affected by the previous one. This is important in particular when an error hasoccurred during a previous run.
The sar utility was used on the BeagleBoard-xM and STK1000 to measure both CPUutilization and memory usage on the servers. Sar was configured to make a measurementonce every second and write the results to a file. A separate series of tests were made withSTK1000 using the top utility in BusyBox instead of sar to measure CPU utilization andmemory usage. The reason for this was that sar returned unexpected results.
CPU utilization and memory usage was not measured on the Midrange platform. Thetechnique provided by FreeRTOS, the operating system used on the Midrange platform, tomeasure CPU utilization consists of measuring the percentage of time spent in the operatingsystems idle task. As the platform was used as a dedicated HTTP server, the server taskswere running 100% of the time, with no time spent in the idle task. Memory usage was notmeasured as the HTTP server didn’t allocate memory dynamically.
The HTTP servers’ nonvolatile memory utilization on the BeagleBoard-xM and STK1000 wasmeasured with the BusyBox du utility. On the Midrange platform it was measured bycompiling FreeRTOS both with and without the HTTP server and calculating the difference.
33
6. Test resultsThis chapter presents the test results achieved with the methodology described in theprevious chapter. The results for each hardware platform are presented separately. The CPUutilization for the load generating software, httperf, on the client machine was 99.7 percent,or higher, in every test.
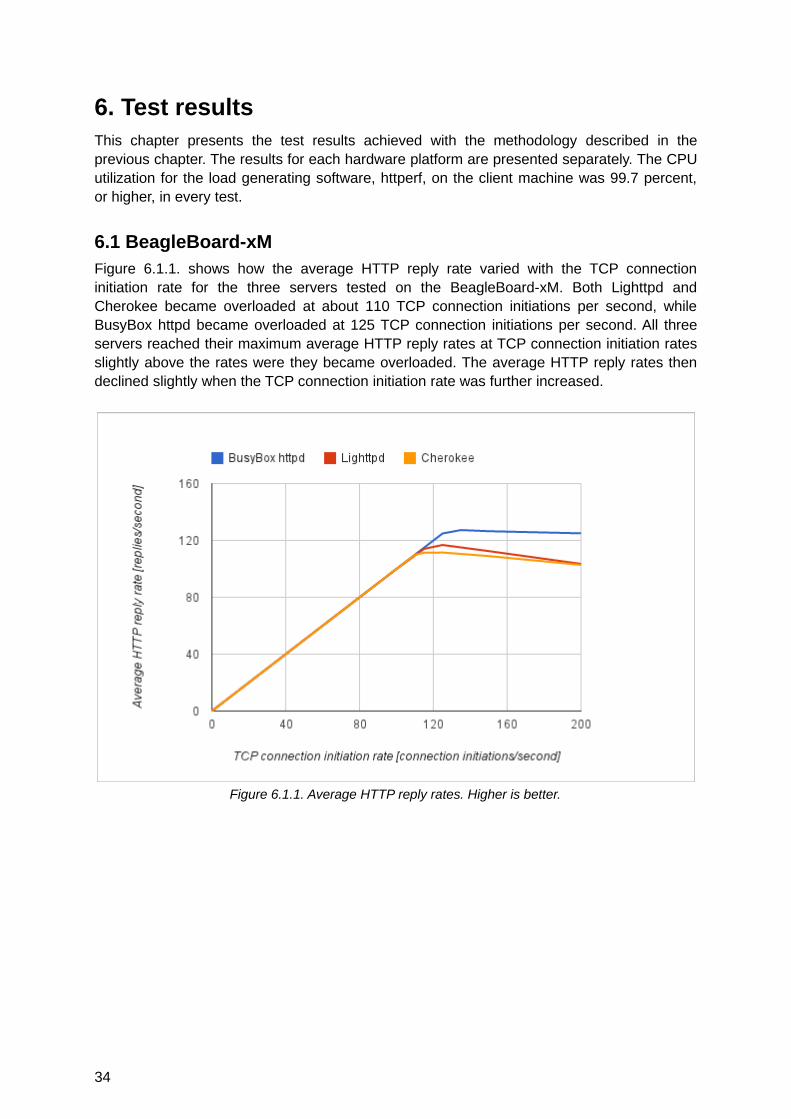
6.1 BeagleBoard-xMFigure 6.1.1. shows how the average HTTP reply rate varied with the TCP connectioninitiation rate for the three servers tested on the BeagleBoard-xM. Both Lighttpd andCherokee became overloaded at about 110 TCP connection initiations per second, whileBusyBox httpd became overloaded at 125 TCP connection initiations per second. All threeservers reached their maximum average HTTP reply rates at TCP connection initiation ratesslightly above the rates were they became overloaded. The average HTTP reply rates thendeclined slightly when the TCP connection initiation rate was further increased.
Figure 6.1.1. Average HTTP reply rates. Higher is better.
34

Standard deviations for the HTTP reply rates can be seen in Figure 6.1.2. Both BusyBoxhttpd and Cherokee had stable HTTP reply rates, even under overload. Lighttpd had verystable HTTP reply rates for TCP connection initiation rates up to about 50 connectioninitiations per second, but for higher TCP connection initiation rates the HTTP reply rate forLighttpd became unstable.
Figure 6.1.2. HTTP reply rates standard deviations. Lower is better.
35
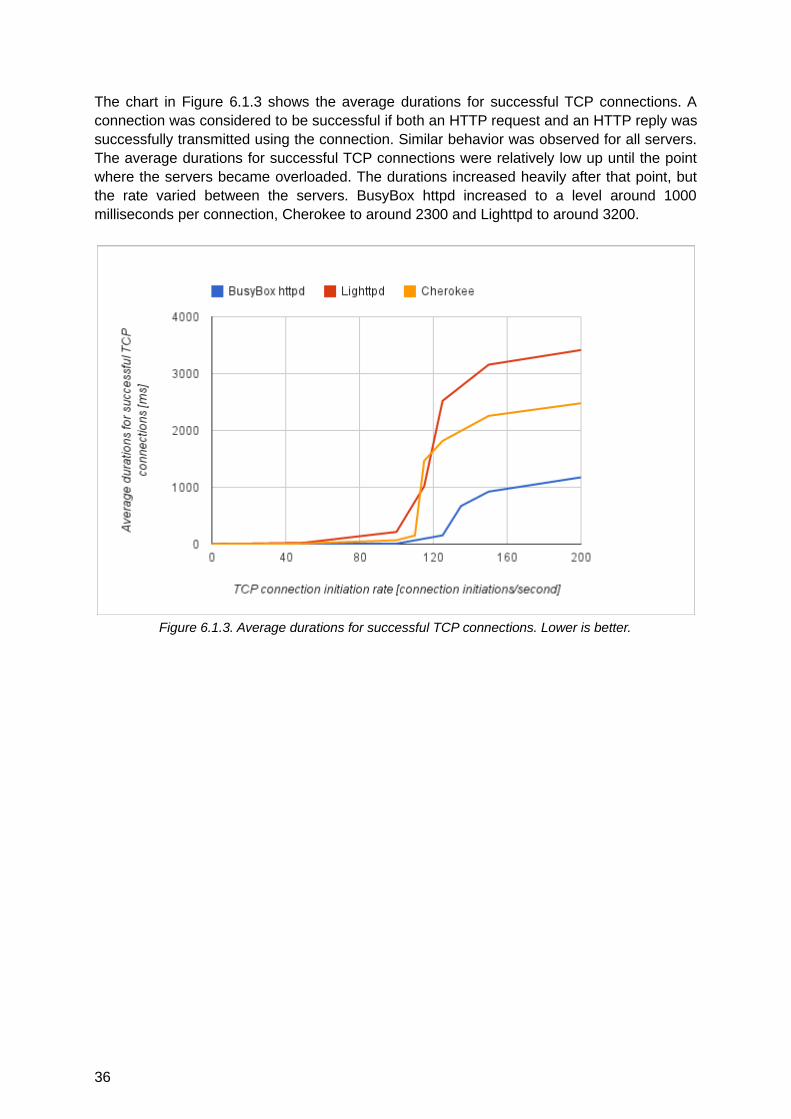
The chart in Figure 6.1.3 shows the average durations for successful TCP connections. Aconnection was considered to be successful if both an HTTP request and an HTTP reply wassuccessfully transmitted using the connection. Similar behavior was observed for all servers.The average durations for successful TCP connections were relatively low up until the pointwhere the servers became overloaded. The durations increased heavily after that point, butthe rate varied between the servers. BusyBox httpd increased to a level around 1000milliseconds per connection, Cherokee to around 2300 and Lighttpd to around 3200.
Figure 6.1.3. Average durations for successful TCP connections. Lower is better.
36
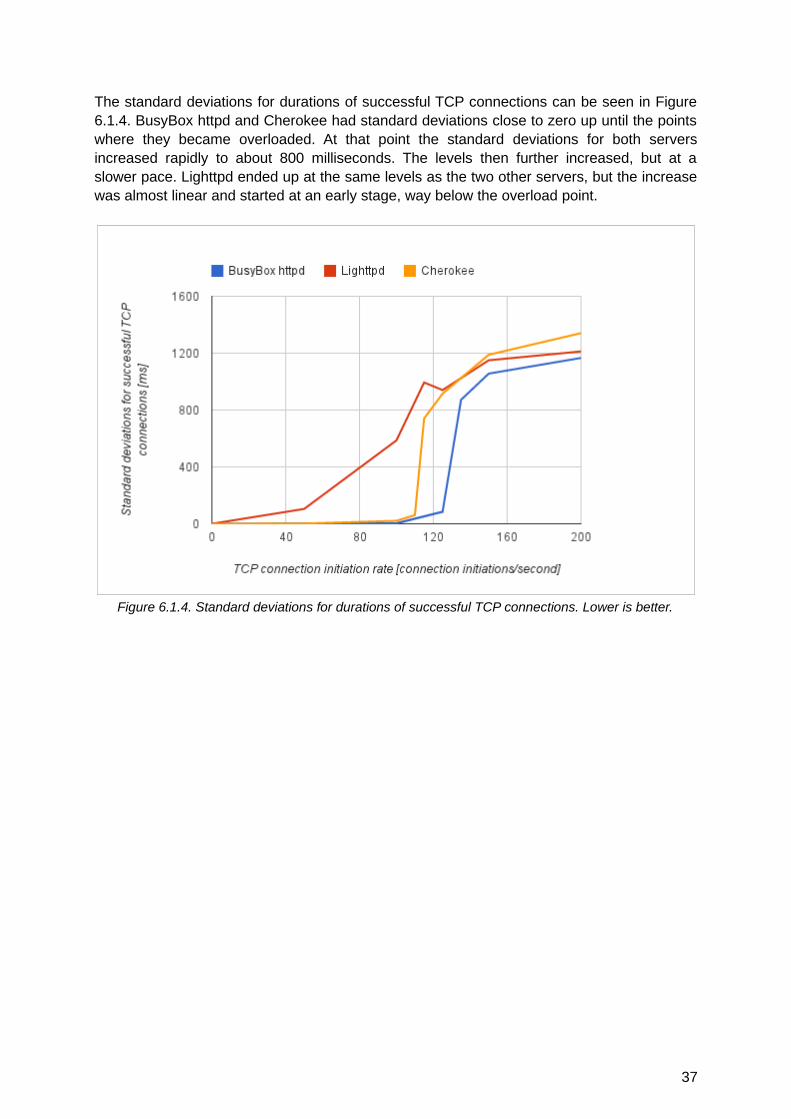
The standard deviations for durations of successful TCP connections can be seen in Figure6.1.4. BusyBox httpd and Cherokee had standard deviations close to zero up until the pointswhere they became overloaded. At that point the standard deviations for both serversincreased rapidly to about 800 milliseconds. The levels then further increased, but at aslower pace. Lighttpd ended up at the same levels as the two other servers, but the increasewas almost linear and started at an early stage, way below the overload point.
Figure 6.1.4. Standard deviations for durations of successful TCP connections. Lower is better.
37
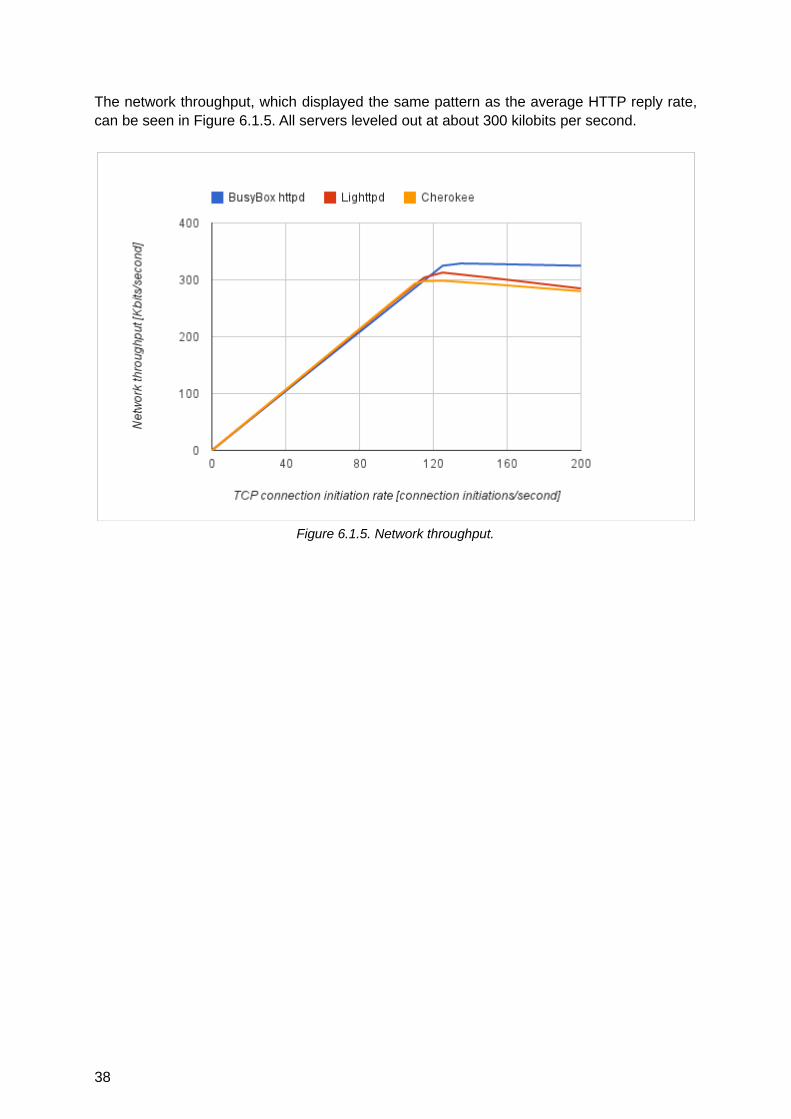
The network throughput, which displayed the same pattern as the average HTTP reply rate,can be seen in Figure 6.1.5. All servers leveled out at about 300 kilobits per second.
Figure 6.1.5. Network throughput.
38
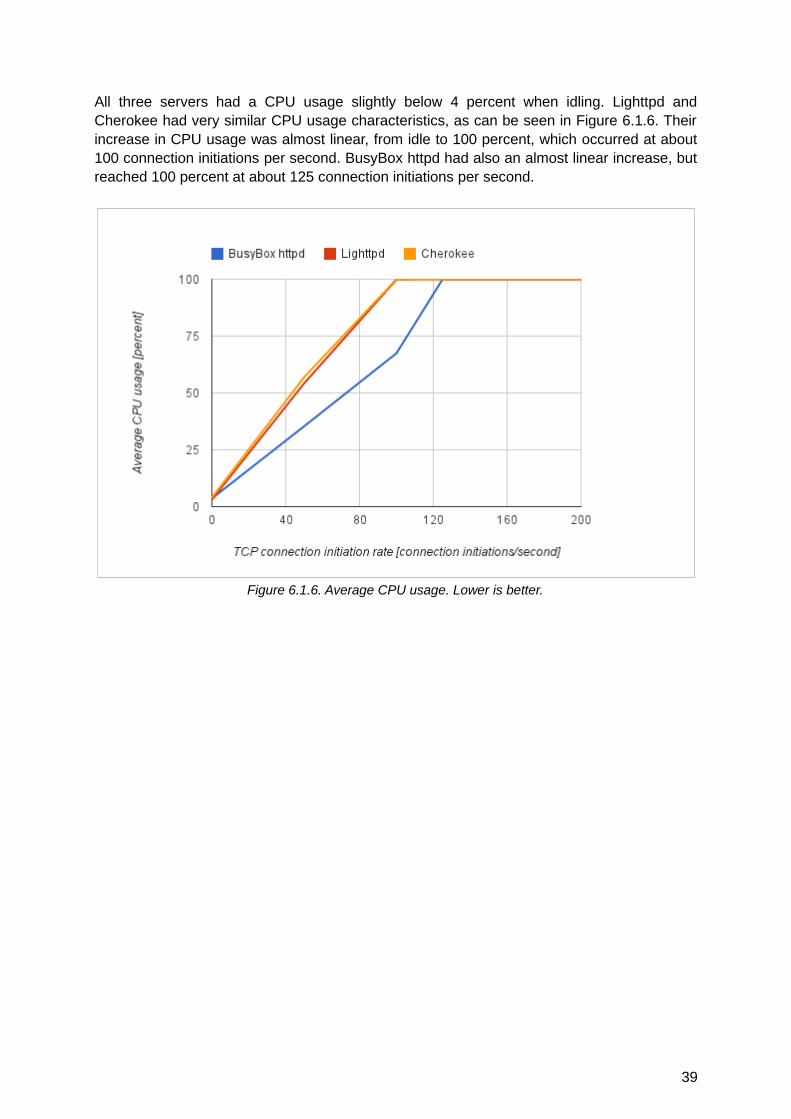
All three servers had a CPU usage slightly below 4 percent when idling. Lighttpd andCherokee had very similar CPU usage characteristics, as can be seen in Figure 6.1.6. Theirincrease in CPU usage was almost linear, from idle to 100 percent, which occurred at about100 connection initiations per second. BusyBox httpd had also an almost linear increase, butreached 100 percent at about 125 connection initiations per second.
Figure 6.1.6. Average CPU usage. Lower is better.
39
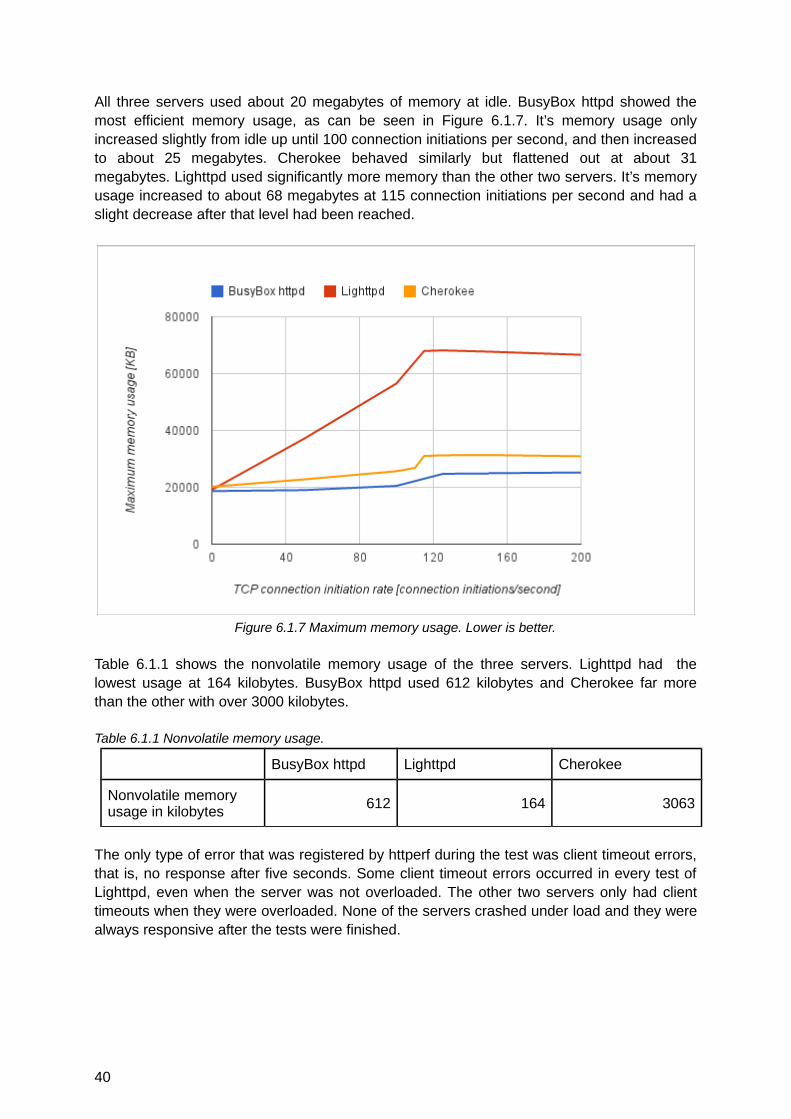
All three servers used about 20 megabytes of memory at idle. BusyBox httpd showed themost efficient memory usage, as can be seen in Figure 6.1.7. It’s memory usage onlyincreased slightly from idle up until 100 connection initiations per second, and then increasedto about 25 megabytes. Cherokee behaved similarly but flattened out at about 31megabytes. Lighttpd used significantly more memory than the other two servers. It’s memoryusage increased to about 68 megabytes at 115 connection initiations per second and had aslight decrease after that level had been reached.
Figure 6.1.7 Maximum memory usage. Lower is better.
Table 6.1.1 shows the nonvolatile memory usage of the three servers. Lighttpd had thelowest usage at 164 kilobytes. BusyBox httpd used 612 kilobytes and Cherokee far morethan the other with over 3000 kilobytes.
Table 6.1.1 Nonvolatile memory usage.
BusyBox httpd Lighttpd Cherokee
Nonvolatile memory usage in kilobytes
612 164 3063
The only type of error that was registered by httperf during the test was client timeout errors,that is, no response after five seconds. Some client timeout errors occurred in every test ofLighttpd, even when the server was not overloaded. The other two servers only had clienttimeouts when they were overloaded. None of the servers crashed under load and they werealways responsive after the tests were finished.
40
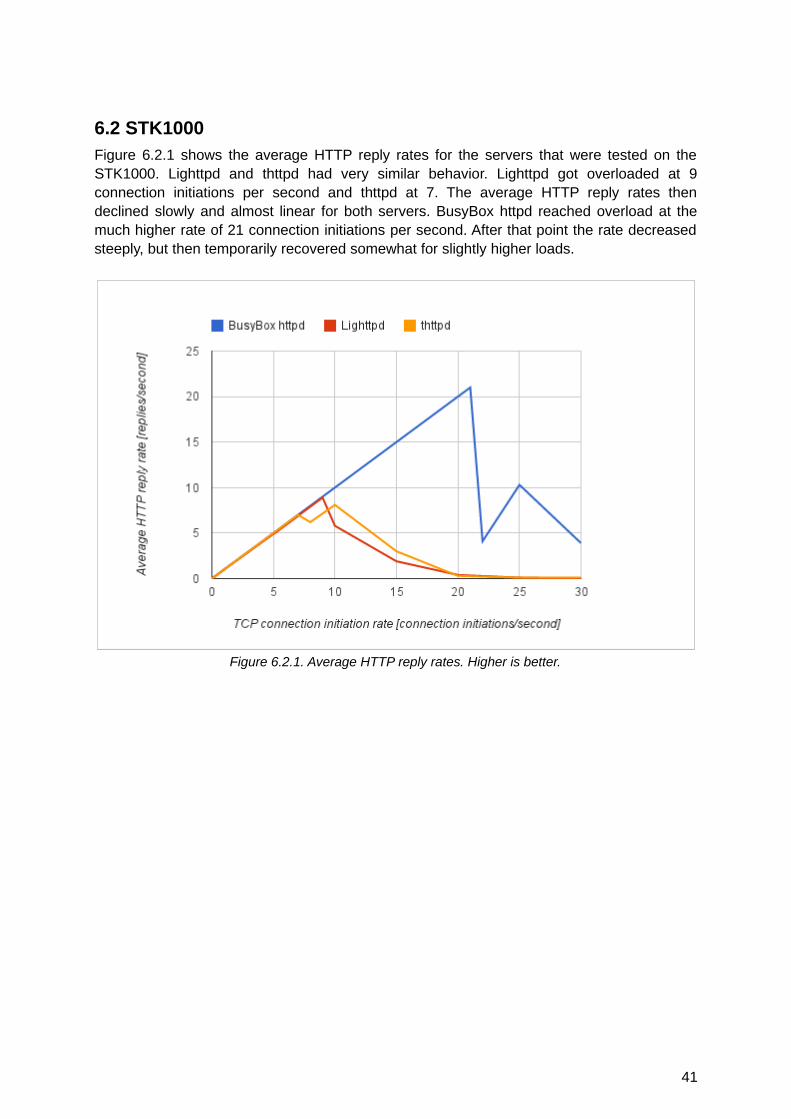
6.2 STK1000Figure 6.2.1 shows the average HTTP reply rates for the servers that were tested on theSTK1000. Lighttpd and thttpd had very similar behavior. Lighttpd got overloaded at 9connection initiations per second and thttpd at 7. The average HTTP reply rates thendeclined slowly and almost linear for both servers. BusyBox httpd reached overload at themuch higher rate of 21 connection initiations per second. After that point the rate decreasedsteeply, but then temporarily recovered somewhat for slightly higher loads.
Figure 6.2.1. Average HTTP reply rates. Higher is better.
41
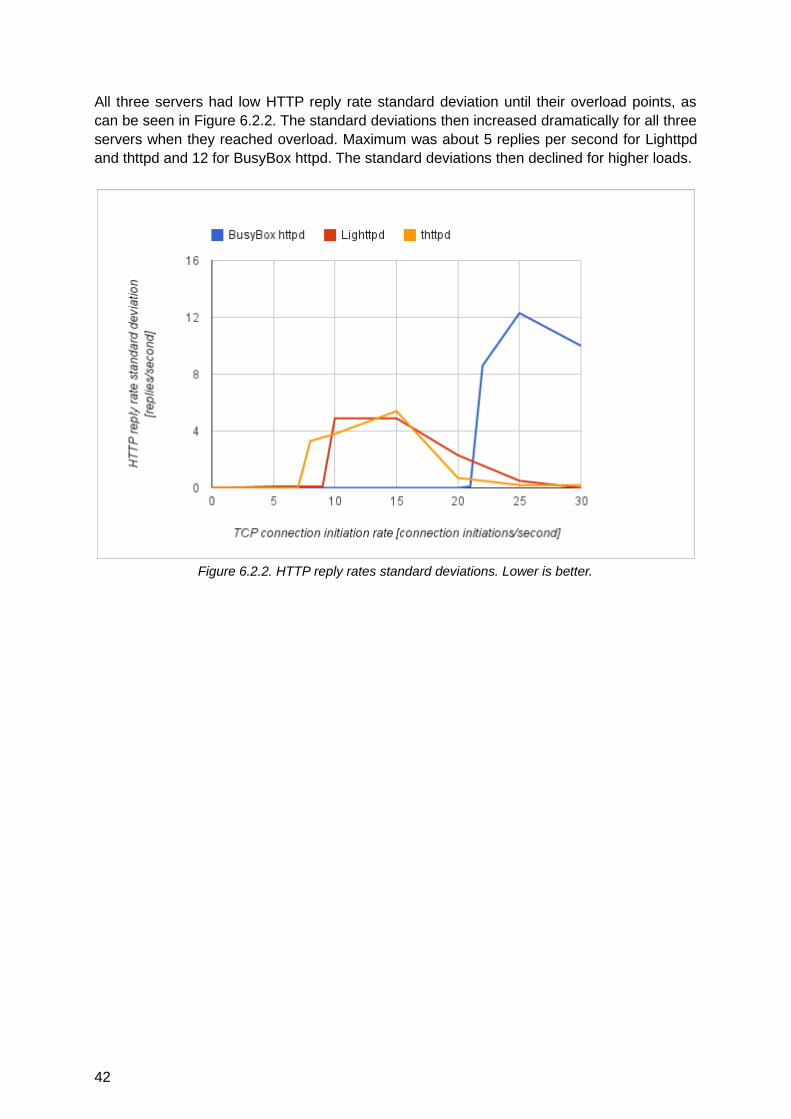
All three servers had low HTTP reply rate standard deviation until their overload points, ascan be seen in Figure 6.2.2. The standard deviations then increased dramatically for all threeservers when they reached overload. Maximum was about 5 replies per second for Lighttpdand thttpd and 12 for BusyBox httpd. The standard deviations then declined for higher loads.
Figure 6.2.2. HTTP reply rates standard deviations. Lower is better.
42
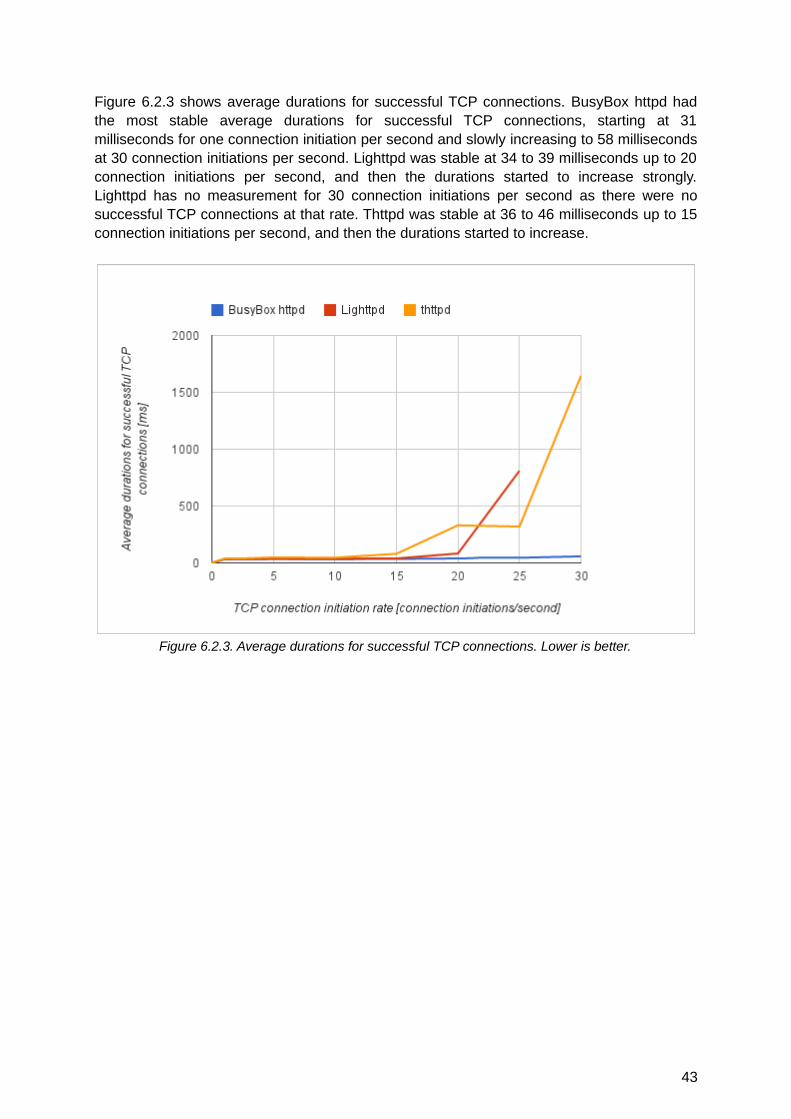
Figure 6.2.3 shows average durations for successful TCP connections. BusyBox httpd hadthe most stable average durations for successful TCP connections, starting at 31milliseconds for one connection initiation per second and slowly increasing to 58 millisecondsat 30 connection initiations per second. Lighttpd was stable at 34 to 39 milliseconds up to 20connection initiations per second, and then the durations started to increase strongly.Lighttpd has no measurement for 30 connection initiations per second as there were nosuccessful TCP connections at that rate. Thttpd was stable at 36 to 46 milliseconds up to 15connection initiations per second, and then the durations started to increase.
Figure 6.2.3. Average durations for successful TCP connections. Lower is better.
43

BusyBox httpd had the lowest standard deviations for durations of successful TCPconnections, as can be seen in Figure 6.2.4. It started at 5 milliseconds and slowly increasedto 54 milliseconds as the load was increased. Lighttpd was close to BusyBox httpd up until15 connection initiations per second, then the standard deviation increased almost linearlyfrom 20 to 141 when the connection initiation rate was increased from 15 to 25. Thttpd wasthe server with the highest standard deviations. It behaved similarly to the other servers upuntil 10 connection initiations per second, then the standard deviations started to increaserapidly, ending at over 1200 milliseconds. At 25 connection initiations per second thestandard deviation decreased temporarily.
Figure 6.2.4. Standard deviations for durations of successful TCP connections. Lower is better.
44
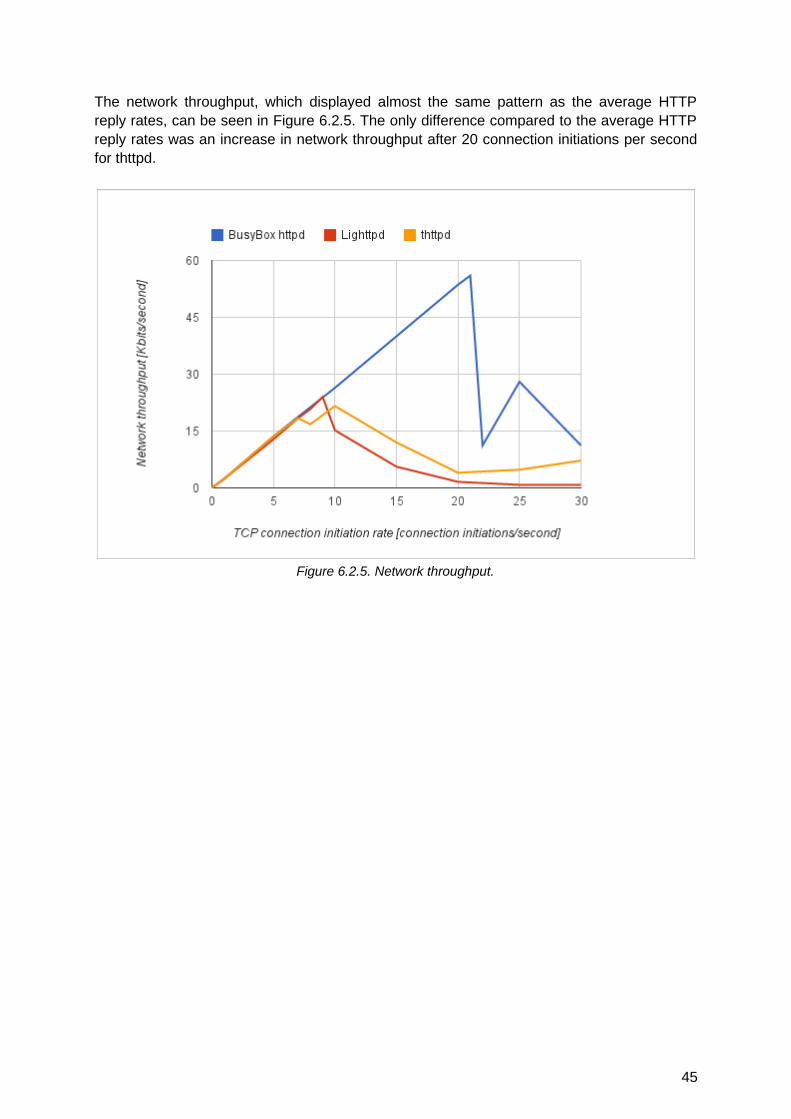
The network throughput, which displayed almost the same pattern as the average HTTPreply rates, can be seen in Figure 6.2.5. The only difference compared to the average HTTPreply rates was an increase in network throughput after 20 connection initiations per secondfor thttpd.
Figure 6.2.5. Network throughput.
45

The average CPU usage increased almost linearly for all three servers and can be seen inFigure 6.2.6. BusyBox httpd reached its maximum of 78 percent at 21 connection initiationsper second, Lighttpd reached 48 at 9 and thttpd reached 41 at 7.
Figure 6.2.6. Average CPU usage. Lower is better.
46
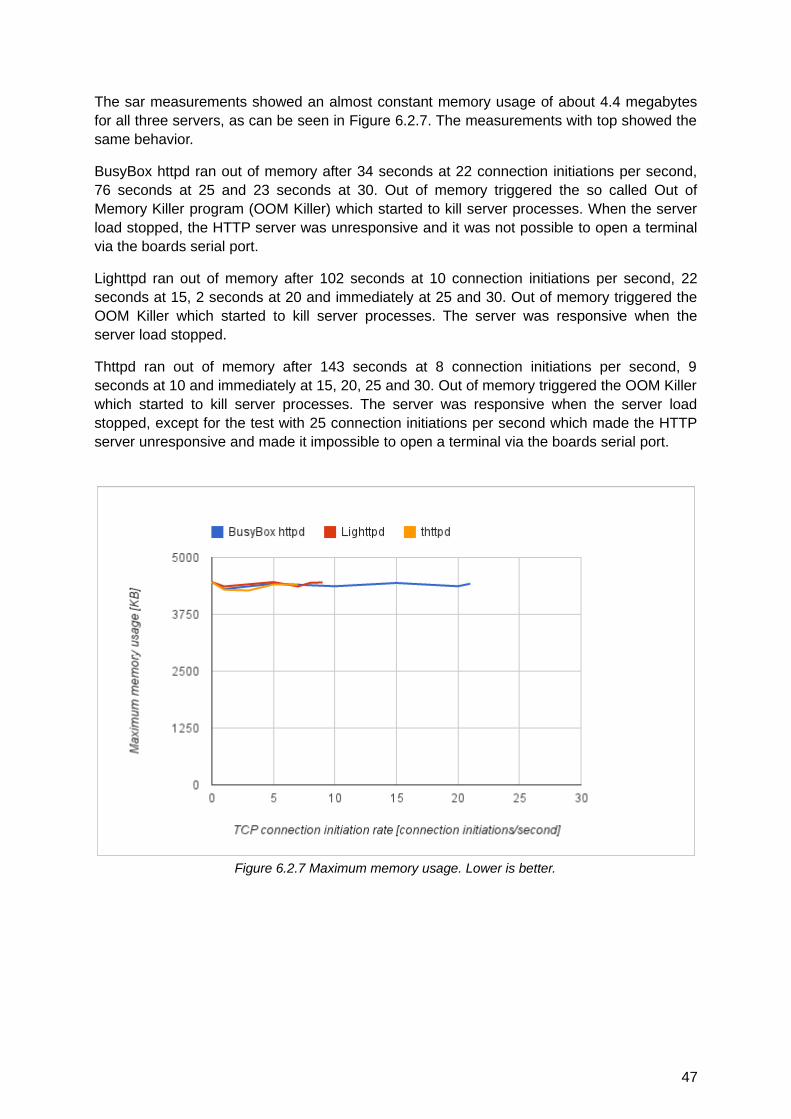
The sar measurements showed an almost constant memory usage of about 4.4 megabytesfor all three servers, as can be seen in Figure 6.2.7. The measurements with top showed thesame behavior.
BusyBox httpd ran out of memory after 34 seconds at 22 connection initiations per second,76 seconds at 25 and 23 seconds at 30. Out of memory triggered the so called Out ofMemory Killer program (OOM Killer) which started to kill server processes. When the serverload stopped, the HTTP server was unresponsive and it was not possible to open a terminalvia the boards serial port.
Lighttpd ran out of memory after 102 seconds at 10 connection initiations per second, 22seconds at 15, 2 seconds at 20 and immediately at 25 and 30. Out of memory triggered theOOM Killer which started to kill server processes. The server was responsive when theserver load stopped.
Thttpd ran out of memory after 143 seconds at 8 connection initiations per second, 9seconds at 10 and immediately at 15, 20, 25 and 30. Out of memory triggered the OOM Killerwhich started to kill server processes. The server was responsive when the server loadstopped, except for the test with 25 connection initiations per second which made the HTTPserver unresponsive and made it impossible to open a terminal via the boards serial port.
Figure 6.2.7 Maximum memory usage. Lower is better.
47
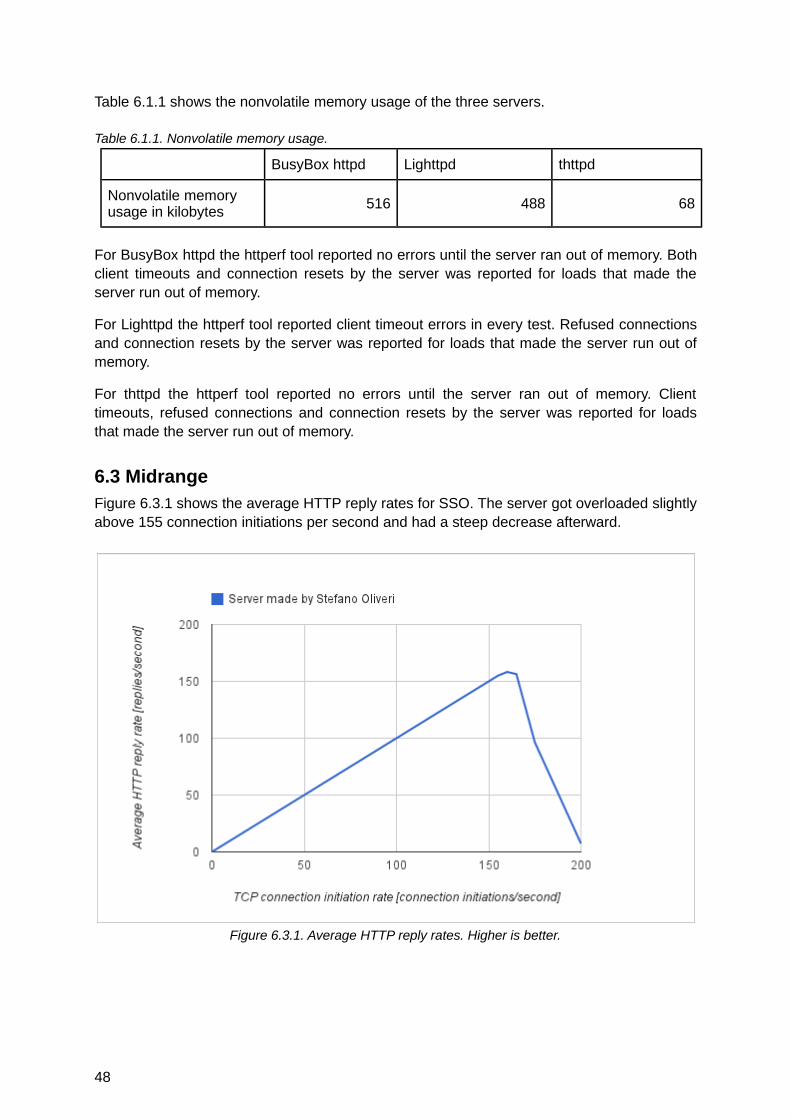
Table 6.1.1 shows the nonvolatile memory usage of the three servers.
Table 6.1.1. Nonvolatile memory usage.
BusyBox httpd Lighttpd thttpd
Nonvolatile memory usage in kilobytes
516 488 68
For BusyBox httpd the httperf tool reported no errors until the server ran out of memory. Bothclient timeouts and connection resets by the server was reported for loads that made theserver run out of memory.
For Lighttpd the httperf tool reported client timeout errors in every test. Refused connectionsand connection resets by the server was reported for loads that made the server run out ofmemory.
For thttpd the httperf tool reported no errors until the server ran out of memory. Clienttimeouts, refused connections and connection resets by the server was reported for loadsthat made the server run out of memory.
6.3 MidrangeFigure 6.3.1 shows the average HTTP reply rates for SSO. The server got overloaded slightlyabove 155 connection initiations per second and had a steep decrease afterward.
Figure 6.3.1. Average HTTP reply rates. Higher is better.
48
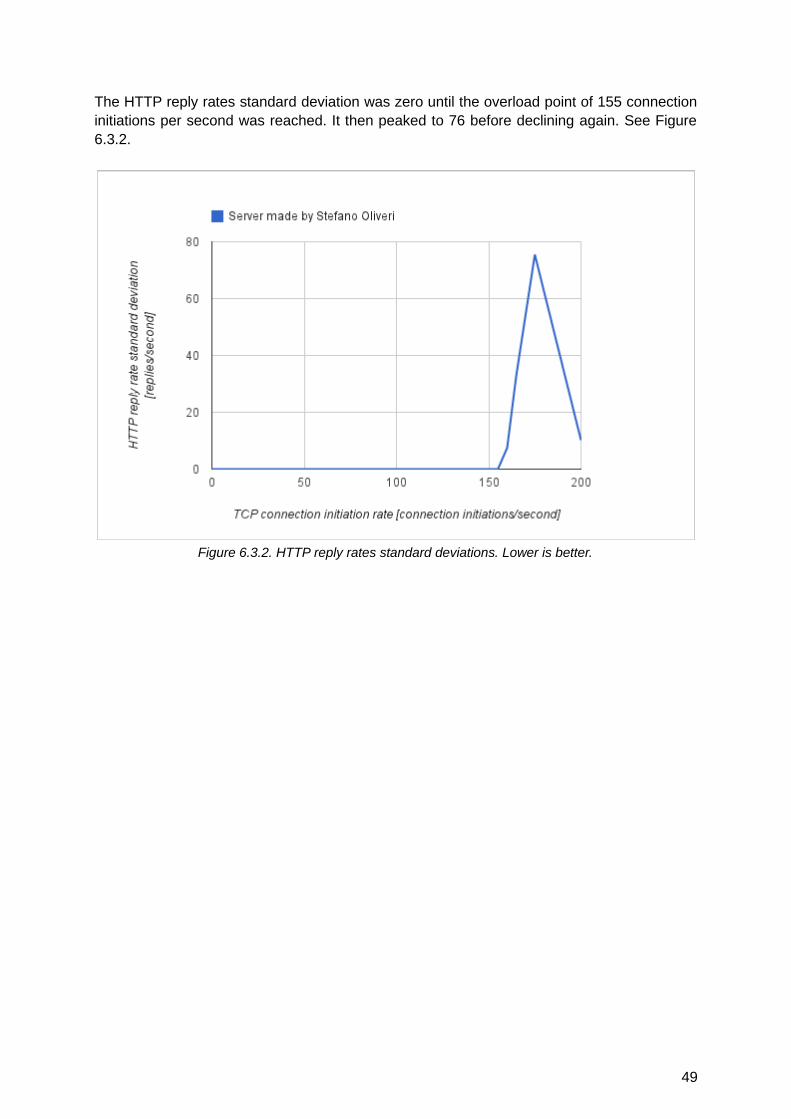
The HTTP reply rates standard deviation was zero until the overload point of 155 connectioninitiations per second was reached. It then peaked to 76 before declining again. See Figure6.3.2.
Figure 6.3.2. HTTP reply rates standard deviations. Lower is better.
49
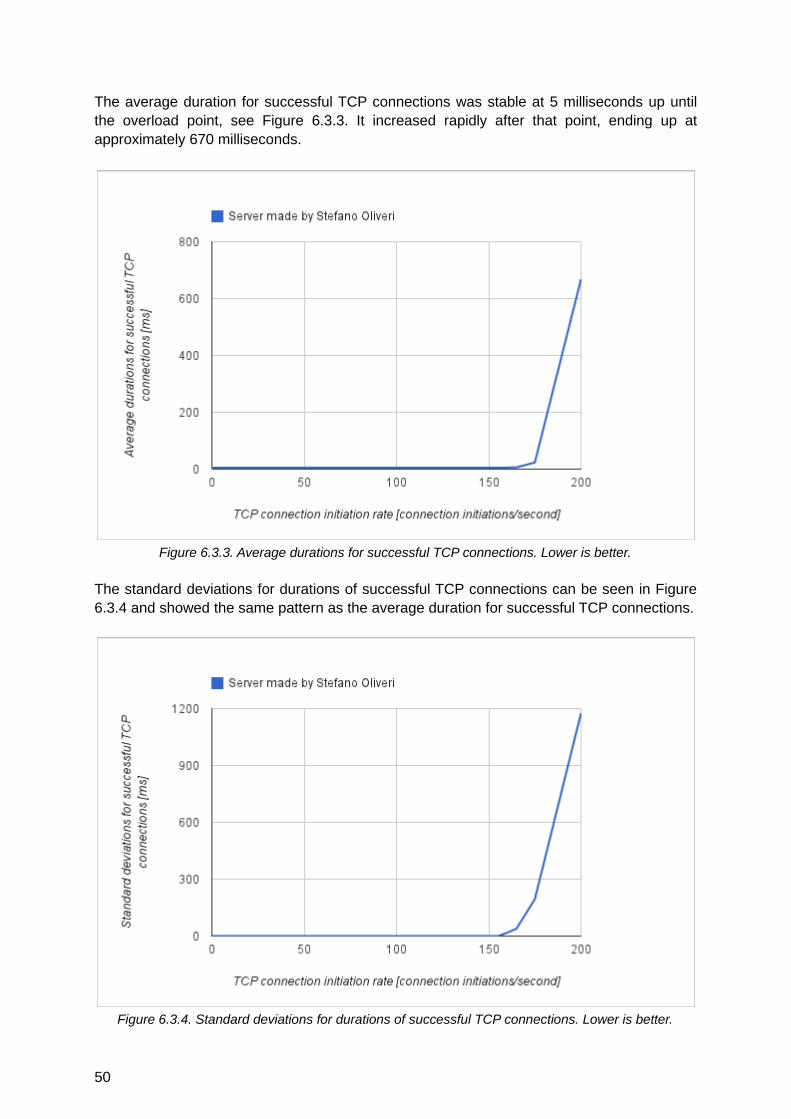
The average duration for successful TCP connections was stable at 5 milliseconds up untilthe overload point, see Figure 6.3.3. It increased rapidly after that point, ending up atapproximately 670 milliseconds.
Figure 6.3.3. Average durations for successful TCP connections. Lower is better.
The standard deviations for durations of successful TCP connections can be seen in Figure6.3.4 and showed the same pattern as the average duration for successful TCP connections.
Figure 6.3.4. Standard deviations for durations of successful TCP connections. Lower is better.
50
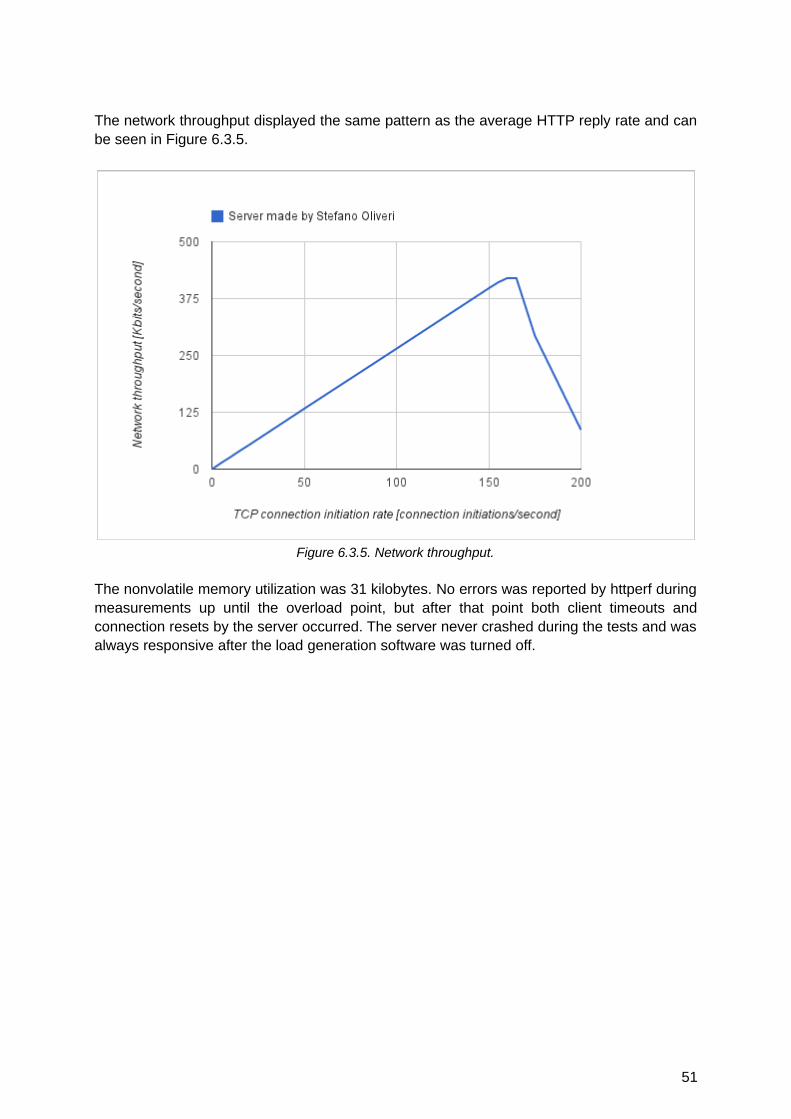
The network throughput displayed the same pattern as the average HTTP reply rate and canbe seen in Figure 6.3.5.
Figure 6.3.5. Network throughput.
The nonvolatile memory utilization was 31 kilobytes. No errors was reported by httperf duringmeasurements up until the overload point, but after that point both client timeouts andconnection resets by the server occurred. The server never crashed during the tests and wasalways responsive after the load generation software was turned off.
51
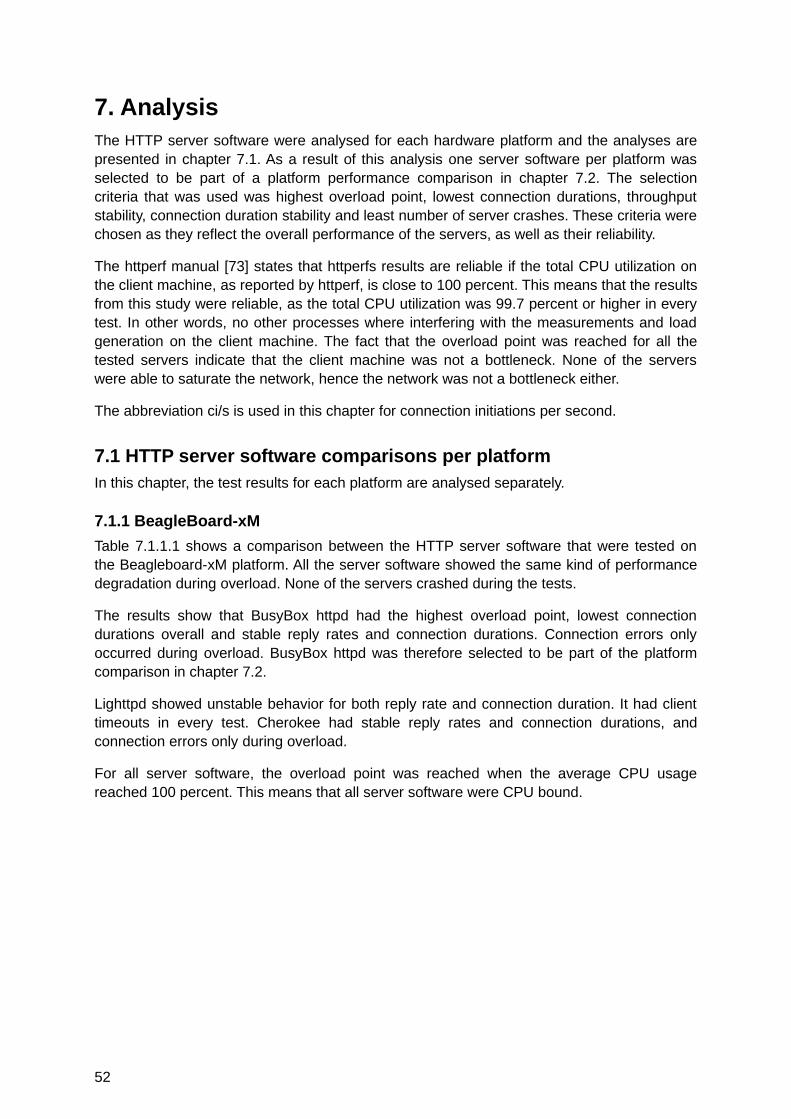
7. AnalysisThe HTTP server software were analysed for each hardware platform and the analyses arepresented in chapter 7.1. As a result of this analysis one server software per platform wasselected to be part of a platform performance comparison in chapter 7.2. The selectioncriteria that was used was highest overload point, lowest connection durations, throughputstability, connection duration stability and least number of server crashes. These criteria werechosen as they reflect the overall performance of the servers, as well as their reliability.
The httperf manual [73] states that httperfs results are reliable if the total CPU utilization onthe client machine, as reported by httperf, is close to 100 percent. This means that the resultsfrom this study were reliable, as the total CPU utilization was 99.7 percent or higher in everytest. In other words, no other processes where interfering with the measurements and loadgeneration on the client machine. The fact that the overload point was reached for all thetested servers indicate that the client machine was not a bottleneck. None of the serverswere able to saturate the network, hence the network was not a bottleneck either.
The abbreviation ci/s is used in this chapter for connection initiations per second.
7.1 HTTP server software comparisons per platformIn this chapter, the test results for each platform are analysed separately.
7.1.1 BeagleBoard-xM
Table 7.1.1.1 shows a comparison between the HTTP server software that were tested onthe Beagleboard-xM platform. All the server software showed the same kind of performancedegradation during overload. None of the servers crashed during the tests.
The results show that BusyBox httpd had the highest overload point, lowest connectiondurations overall and stable reply rates and connection durations. Connection errors onlyoccurred during overload. BusyBox httpd was therefore selected to be part of the platformcomparison in chapter 7.2.
Lighttpd showed unstable behavior for both reply rate and connection duration. It had clienttimeouts in every test. Cherokee had stable reply rates and connection durations, andconnection errors only during overload.
For all server software, the overload point was reached when the average CPU usagereached 100 percent. This means that all server software were CPU bound.
52
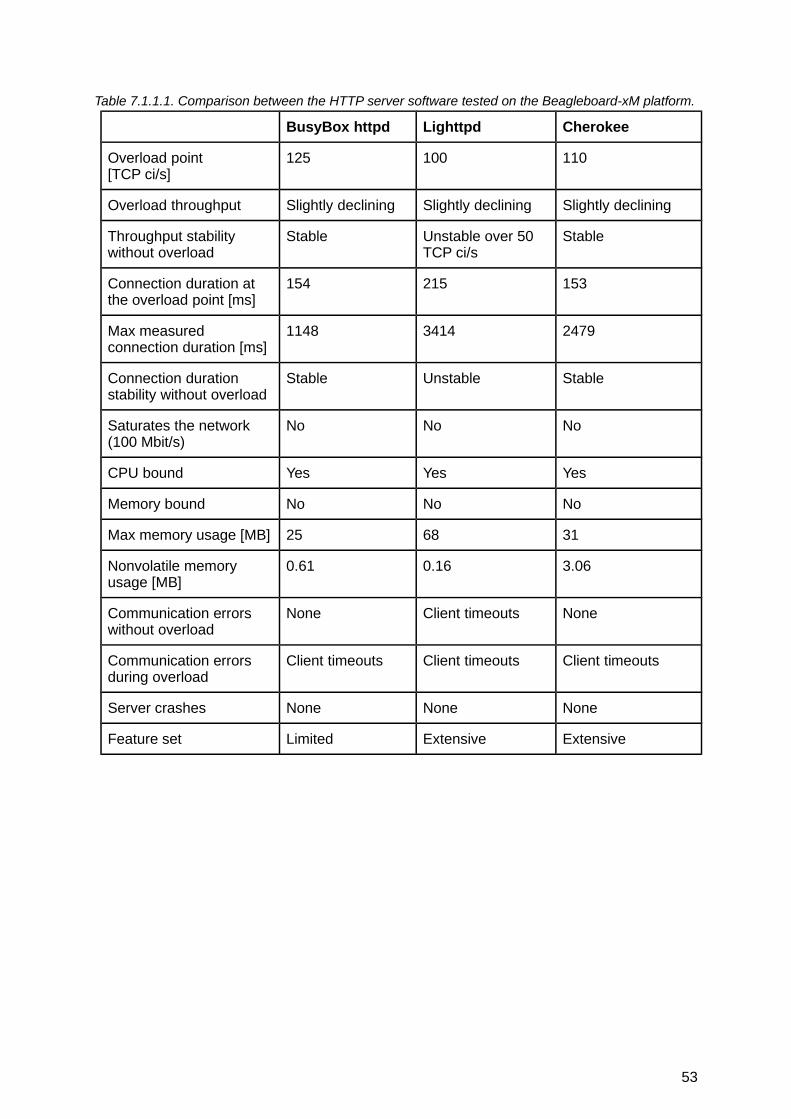
Table 7.1.1.1. Comparison between the HTTP server software tested on the Beagleboard-xM platform.
BusyBox httpd Lighttpd Cherokee
Overload point[TCP ci/s]
125 100 110
Overload throughput Slightly declining Slightly declining Slightly declining
Throughput stability without overload
Stable Unstable over 50 TCP ci/s
Stable
Connection duration at the overload point [ms]
154 215 153
Max measured connection duration [ms]
1148 3414 2479
Connection duration stability without overload
Stable Unstable Stable
Saturates the network(100 Mbit/s)
No No No
CPU bound Yes Yes Yes
Memory bound No No No
Max memory usage [MB] 25 68 31
Nonvolatile memory usage [MB]
0.61 0.16 3.06
Communication errors without overload
None Client timeouts None
Communication errors during overload
Client timeouts Client timeouts Client timeouts
Server crashes None None None
Feature set Limited Extensive Extensive
53
7.1.2 STK1000
Table 7.1.2.1 shows a comparison between the HTTP server software that were tested onthe STK1000 platform. All the server software had stable throughputs and connectiondurations, but significant differences could be seen in overload points and connectiondurations. All the server software also showed the same kind of performance degradationduring overload.
As described in chapter 6.2, all server software ran out of memory when overloaded. Themaximum memory usage listed in Table 7.1.2.1 is therefore the platforms total amount ofmemory. Both thttpd and BusyBox httpd became unresponsive after some test runs in whichthe server ran out of memory, and it also became impossible to open a terminal via theboards serial port. This kind of crash never occurred with Lighttpd, which always wasresponsive when the server load was turned off.
The results show that BusyBox httpd had the highest overload point, lowest connectiondurations overall and stable reply rates and connection durations. BusyBox httpd had themost stable average durations for successful TCP connections, starting at 31 milliseconds forone connection initiation per second and slowly increasing to 58 milliseconds at 30connection initiations per second. This small increase during overload was far superior to allthe other server software tested, regardless of platform. Connection errors only occurredduring overload. Although server crashes occurred when out of memory, BusyBox httpd wasstill selected to be part of the platform comparison in chapter 7.2, as its overload point andoverall connection durations were superior to the other servers.
The tests performed on the STK1000 platform shows the importance of selecting appropriateHTTP server software, as the performance may differ significantly. For example, BusyBoxhttpds overload point was three times higher than thttpds, 21 versus 7 TCP ci/s. Maxmeasured connection duration was 58 ms for BusyBox httpd and 1646 ms for thttpd. Theseperformance differences are in line with the results from the study performed by Pariag et al.[67], that was discussed in chapter 3.2.1.
54

Table 7.1.2.1. Comparison between the HTTP server software tested on the STK1000 platform.
BusyBox httpd Lighttpd thttpd
Overload point[TCP ci/s]
21 9 7
Overload throughput Steeply decreasing Steeply decreasing Steeply decreasing
Throughput stability without overload
Stable Stable Stable
Connection duration at the overload point [ms]
41 38 48
Max measured connection duration [ms]
58 810 1646
Connection duration stability without overload
Stable Stable Stable
Saturates the network(100 Mbit/s)
No No No
CPU bound No No No
Memory bound Yes Yes Yes
Max memory usage [MB] 8 8 8
Nonvolatile memory usage [MB]
0.52 0.49 0.07
Communication errors without overload
None Client timeouts None
Communication errors during overload
Client timeouts, connection resets
Client timeouts, connection resets, refused connections
Client timeouts, connection resets, refused connections
Server crashes Always after running out of memory
None During one test run when running out ofmemory
Feature set Limited Extensive Medium
55

7.1.3 Midrange
Table 7.1.3.1 shows a summary of the test results for the Midrange platform. SSO showedstable behavior in both throughput and connection duration before the overload point, buthad drastic performance degradation during overload. Communication errors only occurredduring overload and no server crashes occurred. Since SSO was the only server softwarethat was tested on the Midrange platform, it was used for the performance comparison inchapter 7.2.
Table 7.1.3.1. Summary of the test results for the Midrange platform.
SSO
Overload point[TCP ci/s]
155
Overload throughput Steeply decreasing
Throughput stability without overload
Stable
Connection duration at the overload point [ms]
5
Max measured connection duration [ms]
668
Connection duration stability without overload
Stable
Saturates the network(100 Mbit/s)
No
CPU bound N/A
Memory bound N/A
Max memory usage [MB] N/A
Nonvolatile memory usage [MB]
0.03
Communication errors without overload
None
Communication errors during overload
Client timeouts, connection resets
Server crashes None
Feature set Very limited
56
7.2 Platform comparisonTable 7.2.1 shows a comparison of the HTTP server software that were selected from eachhardware platform. A few similarities can be seen between the selected server software. Allof the best performing servers, according to the chosen criteria, had limited feature sets.BusyBox httpd was the best performing server software on both platforms where it wastested.
The only platform that was memory bound was the STK1000, and the STK1000 was also theonly platform where HTTP server software crashed during testing. The crashes alwaysoccurred when the server ran out of memory, which triggered the OOM Killer, which startedto kill server processes. As mentioned in chapter 2, some servers, such as Appweb, havesettings that can be used to specify a top limit for the servers’ memory usage. Using such aserver would of course make it possible to prevent the triggering of the OOM Killer becauseof server load, which in turn could prevent the server from crashing.
57

Table 7.2.1. Comparison of the selected HTTP server software from each platform.
BeagleBoard-xMBusyBox httpd
STK1000BusyBox httpd
MidrangeSSO
Overload point[TCP ci/s]
125 21 155
Overload throughput Slightly declining Steeply decreasing Steeply decreasing
Throughput stability without overload
Stable Stable Stable
Connection duration at the overload point [ms]
154 41 5
Max measured connection duration [ms]
1148 58 668
Connection duration stability without overload
Stable Stable Stable
Saturates the network(100 Mbit/s)
No No No
CPU bound Yes No N/A
Memory bound No Yes N/A
Max memory usage [MB] 25 8 N/A
Nonvolatile memory usage [MB]
0.61 0.52 0.03
Communication errors without overload
None None None
Communication errors during overload
Client timeouts Client timeouts, connection resets
Client timeouts, connection resets
Server crashes None Always after running out of memory
None
Feature set Limited Limited Very limited
58

Figure 7.2.1 shows a comparison of the average HTTP reply rates for the server softwareselected for each platform. The highest overload point was measured on the Midrangeplatform, at 155 TCP ci/s. However, the throughput steeply decreased during overload. TheBeagleBoard-xM had a somewhat lower overload point, 125 TCP ci/s, but showed a muchsmaller decrease in throughput after the overload point. This is important to consider if you inan application is running the risk of getting beyond the overload point. Figure 7.2.1 alsoclearly shows that the best performing server software on the STK1000 platform was farbehind the other platforms in this aspect of performance.
All server software on all platforms showed performance degradation during overload thatwas in line with expectations, based on findings from experiments performed by Voigt [69],Banga and Druschel [70], and Titchkosky et al. [72], that was discussed in chapter 3.2.1.
Figure 7.2.1. Average HTTP reply rates for the selected server software for each platform. Higher isbetter.
59

Figure 7.2.2 shows a comparison of the HTTP reply rates standard deviations for the serversoftware selected for each platform. All three servers had stable throughput up until theiroverload points, but the BeagleBoard-xM had significantly more stable throughput than theother two servers during overload.
Figure 7.2.2. HTTP reply rates standard deviations for the selected server software for each platform.Lower is better.
60
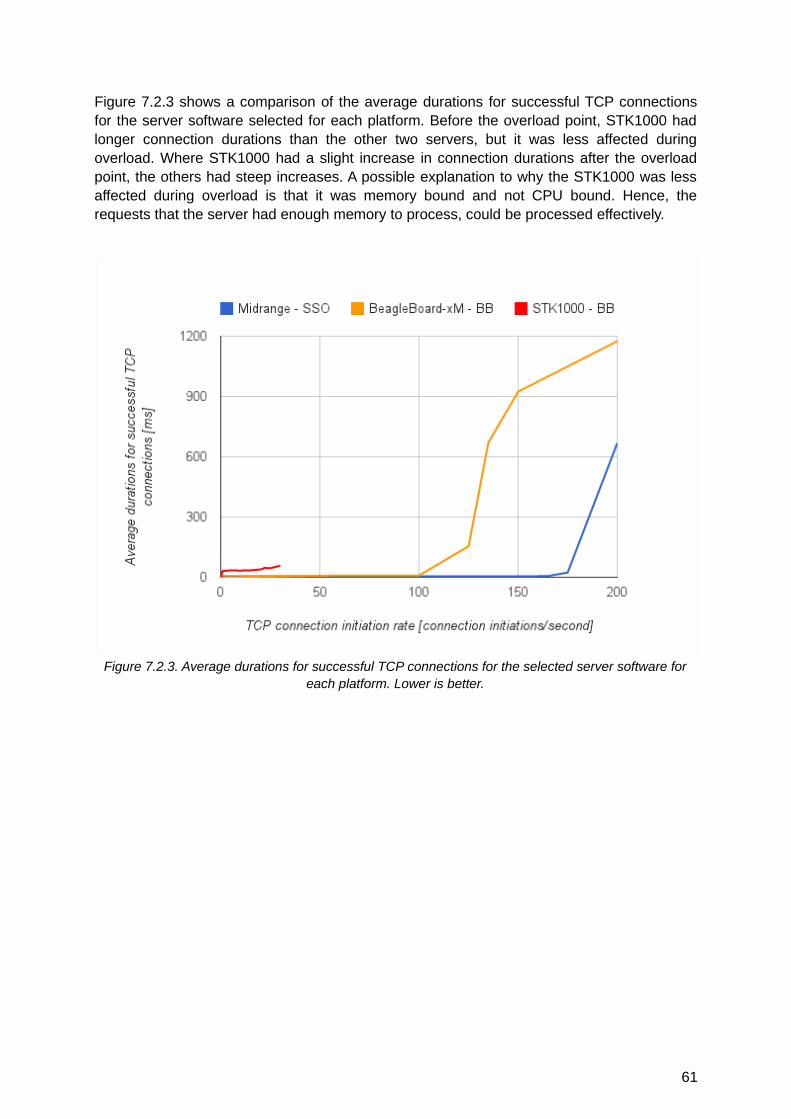
Figure 7.2.3 shows a comparison of the average durations for successful TCP connectionsfor the server software selected for each platform. Before the overload point, STK1000 hadlonger connection durations than the other two servers, but it was less affected duringoverload. Where STK1000 had a slight increase in connection durations after the overloadpoint, the others had steep increases. A possible explanation to why the STK1000 was lessaffected during overload is that it was memory bound and not CPU bound. Hence, therequests that the server had enough memory to process, could be processed effectively.
Figure 7.2.3. Average durations for successful TCP connections for the selected server software foreach platform. Lower is better.
61
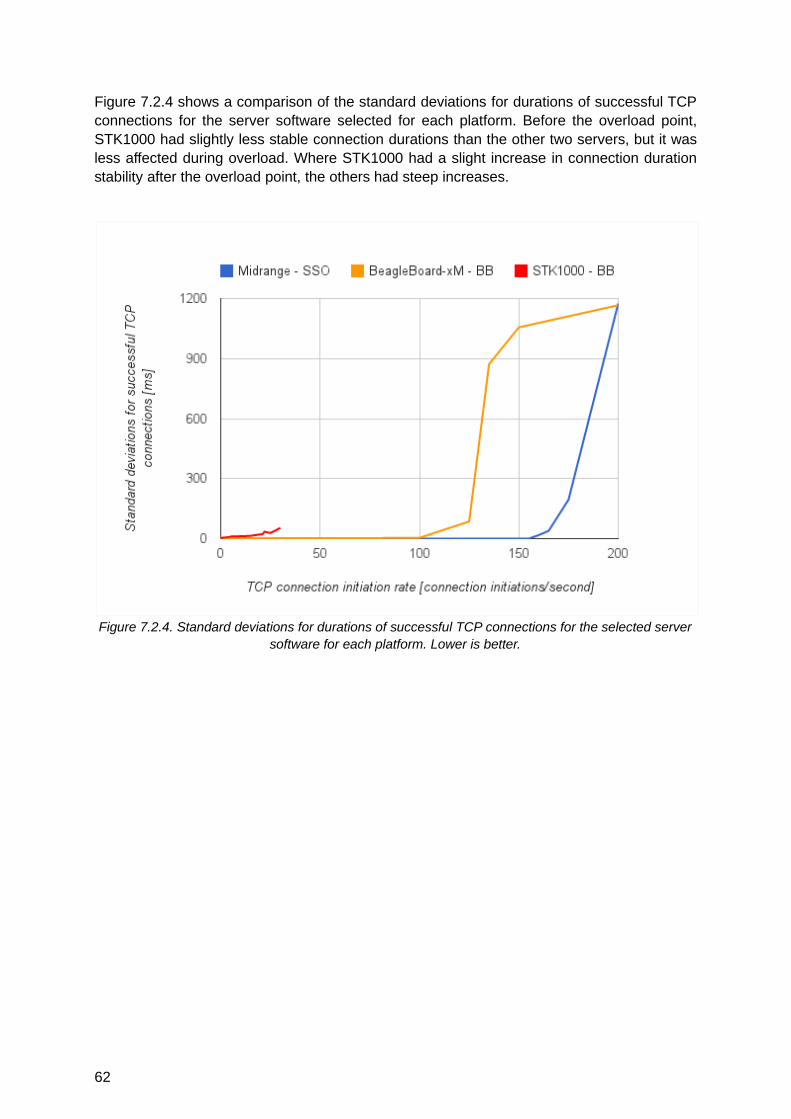
Figure 7.2.4 shows a comparison of the standard deviations for durations of successful TCPconnections for the server software selected for each platform. Before the overload point,STK1000 had slightly less stable connection durations than the other two servers, but it wasless affected during overload. Where STK1000 had a slight increase in connection durationstability after the overload point, the others had steep increases.
Figure 7.2.4. Standard deviations for durations of successful TCP connections for the selected serversoftware for each platform. Lower is better.
62

8. ConclusionsBeagleBoard-xM with BusyBox httpd had the best overall performance when running the testapplication. It had a high overload point, low connection durations when not overloaded, anda superior overload behavior. However, Midrange with SSO performed better when notoverloaded. STK1000 was far behind the other two platforms in terms of performance.
On the BeagleBoard-xM platform with BusyBox httpd it was possible to achieve an overloadpoint of 125 TCP connection initiations per second and average TCP connection durationsless than 10 milliseconds for lower loads. The same figures for Midrange with SSO was 155TCP connection initiations per second and 6 milliseconds. STK1000 with BusyBox httpdmanaged 21 TCP connection initiations per second and 35 milliseconds. See Figure 7.2.1and Figure 7.2.3 for more information.
The test results showed that the performance differed greatly between HTTP serversoftware. This was particularly apparent on the STK1000 platform. The fact that the leastpowerful hardware platform, Midrange, had the highest overload point and shortestconnection durations further emphasises the importance of the software.
Generally, HTTP server software with limited feature sets performed best. It is thereforeimportant to consider that a HTTP server software with a larger feature set may be lessefficient. Always be thorough when deciding which features that should be used, to avoidexcessive features.
The overload behavior differed greatly between the servers. Hence, the overload behavior isimportant to consider for applications that might experience loads above the server’soverload point. Significant differences could be seen in throughput, throughput stability,connection durations and connection duration stability during overload. BeagleBoard-xM withBusyBox httpd was for example able to sustain an average HTTP response rate duringoverload that was close to its maximum average rate, while both STK1000 with BusyBoxhttpd and Midrange with SSO showed steep decreases.
The efficiency of system resource usage - CPU, volatile memory and nonvolatile memory -differed by a considerable amount between the tested HTTP server software. The largestdifferences was measured on the BeagleBoard-xM. As an example, at 50 TCP connectioninitiations per seconds BusyBox httpd used about 36 percent less CPU than the other twoserver software and about 49 percent less volatile memory than Lighttpd. BusyBox httpdused 612 kilobytes of nonvolatile memory while Lighttpd used 164 and Cherokee 3063.
The experience from STK1000 with HTTP server software crashes due to insufficientmemory show the importance of being able to limit the HTTP server software’s resourceusage, in order to ensure availability during high loads.
63

9. DiscussionThe purpose of this thesis was to determine what was possible at the time in terms of HTTPserver performance on selected hardware platforms for embedded systems, regarding loadlimits, performance characteristics and system resource usage. It can be concluded that thechosen methodology and test implementation was successful in achieving interesting anduseful results worth considering when selecting a hardware platform for an embeddedsystem that should contain a HTTP server. Furthermore, this thesis adds knowledge to ascarcely researched area, as no similar studies were found during the literature study.
Those who are about to select a platform can draw valuable general conclusions from thisthesis, for example regarding the importance of software and differences in performancecharacteristics. However, the specific load limits may for example be different for other webapplications and/or load characteristics.
9.1 Future workThere are several possibilities for future work related to the subject of this thesis. Below aresome suggestions.
9.1.1 Complementary performance aspects
Complementary tests, using the same methodology as in this thesis, could expand theunderstanding of performance on the different platforms. One could for example perform testruns with longer durations, several days or months, to be able to determine the stability of thedifferent platforms under high load. Another interesting area to explore would be differentload characteristics, such as burstiness (discussed in chapter 3.2.4). Finally, the performanceimpact of different kinds of web applications could be studied, as well as the effects of usingencrypted traffic in the form of TLS.
9.1.2 Software tuning and alternatives
One of the conclusions of this thesis was the importance of software. It would therefore beinteresting to study how big performance gains that can be made by tuning of operatingsystem and HTTP server software settings. On top of this, one could also test othermethodologies for generation of web pages with dynamic content, such as FastCGI. Thesignificant performance differences between the tested server software indicates potentialbenefits of running tests with other server software and operating systems for each platform.Finally, this thesis focused solely on servers using the HTTP protocol, however, the relativelynew WebSocket protocol can potentially be more efficient in some use cases, and istherefore an interesting technology to research.
64
10. References
[1] IEEE 802.3 working groupIEEE Std 802.3™-2008http :// standards . ieee . org / getieee 802/ download /802.3-2008_ section 1. pdfhttp :// standards . ieee . org / getieee 802/ download /802.3-2008_ section 2. pdfhttp :// standards . ieee . org / getieee 802/ download /802.3-2008_ section 3. pdfhttp :// standards . ieee . org / getieee 802/ download /802.3-2008_ section 4. pdfhttp :// standards . ieee . org / getieee 802/ download /802.3-2008_ section 5. pdfRetrieved 2012-01-25.
[2] IEEE 802.3 working groupIEEE Std 802.3ba™-2010http :// standards . ieee . org / getieee 802/ download /802.3 ba -2010. pdfRetrieved 2012-01-26.
[3] IEEE 802.3 working groupIEEE Std 802.3at™-2009http :// standards . ieee . org / getieee 802/ download /802.3 at -2009. pdfRetrieved 2012-01-25.
[4] R Fielding, et al.Hypertext Transfer Protocol -- HTTP/1.1http :// tools . ietf . org / html / rfc 2616Retrieved 2012-01-25.
[5] L Doolittle, J NelsonBoa Webserver Documentationhttp :// www . boa . org / documentation /Retrieved 2012-03-07.
[6] J NelsonAn Overview of the Boa Web Serverhttp :// www . osnews . com / story /2217/ An _ Overview _ of _ the _ Boa _ Web _ ServerRetrieved 2012-03-07.
[7] L Doolittle, J NelsonBoa Webserver Newshttp :// www . boa . org / news . htmlRetrieved 2012-03-07.
[8] Free Software Foundation, Inc.GNU GENERAL PUBLIC LICENSE Version 1, February 1989http :// www . gnu . org / licenses / old - licenses / gpl -1.0- standalone . htmlRetrieved 2012-03-07.
65

[9] D Robinson, K CoarThe Common Gateway Interface (CGI) Version 1.1http :// tools . ietf . org / html / rfc 3875Retrieved 2012-03-07.
[10] T Dierks, E RescorlaThe Transport Layer Security (TLS) Protocol Version 1.2http :// tools . ietf . org / html / rfc 5246Retrieved 2012-03-07.
[11] uClibchttp :// www . uclibc . org /Retrieved 2012-03-07.
[12] Real Time LogicBarracuda Embedded Web Serverhttp :// barracudaserver . com /Retrieved 2012-03-08.
[13] Real Time LogicBarracuda Embedded Web Server Manualhttp :// barracudaserver . com / ba / doc /Retrieved 2012-03-08.
[14] yaSSLyaSSL Embedded Web Serverhttp :// www . yassl . com / yaSSL / Products - yassl - embedded - web - server . htmlRetrieved 2012-03-09.
[15] yaSSLyaSSL Embedded Web Server User Manualhttp :// www . yassl . com / documentation / yasslEWS - Manual . pdfRetrieved 2012-03-09.
[16] Mongoosehttp :// code . google . com / p / mongoose /Retrieved 2012-03-09.
[17] yaSSLCyaSSL Embedded SSL Libraryhttp :// www . yassl . com / yaSSL / Products - cyassl . htmlRetrieved 2012-03-09.
[18] Free Software Foundation, Inc.GNU GENERAL PUBLIC LICENSE Version 2, June 1991http :// www . gnu . org / licenses / old - licenses / gpl -2.0- standalone . htmlRetrieved 2012-03-09.
66
[19] Real Time LogicBarracuda Embedded Web Server SDK Price Listhttp :// barracudaserver . com / PriceList . htmlRetrieved 2012-03-09.
[20] KoanLogicKLonehttp :// www . koanlogic . com / klone /Retrieved 2012-03-09.
[21] The OpenSSL ProjectOpenSSLhttp :// www . openssl . org /Retrieved 2012-03-09.
[22] Unicoi Systems, Inc.Fusion EmbeddedTM HTTPShttp :// www . unicoi . com / product _ briefs / https . pdfRetrieved 2012-03-12.
[23] BusyBox - The Swiss Army Knife of Embedded Linuxhttp :// busybox . net / downloads / BusyBox . htmlRetrieved 2012-03-12.
[24] BusyBox HTTP Daemon (httpd)http :// wiki . openwrt . org / doc / howto / http . httpdRetrieved 2012-03-12.
[25] Free Software Foundation, Inc.Coreutils - GNU core utilitieshttp :// www . gnu . org / software / coreutils /Retrieved 2012-03-12.
[26] Embedthis SoftwareAppwebhttp :// appwebserver . org /Retrieved 2012-03-14.
[27] Embedthis SoftwareSandboxinghttp :// www . appwebserver . org / products / appweb /secure - web - servers . html # sandboxingRetrieved 2012-03-14.
[28] Embedthis SoftwareSandbox Directiveshttp :// www . appwebserver . org / products / appweb / doc / guide / appweb / users / dir /sandbox . htmlRetrieved 2012-03-14.
67
[29] Embedthis SoftwareOpen Source License Agreementhttp :// www . appwebserver . org / products / appweb / doc -4/ licenses / gpl . htmlRetrieved 2012-03-14.
[30] Embedthis SoftwareLicensinghttp :// www . appwebserver . org / products / appweb / doc -4/ licenses / index . htmlRetrieved 2012-03-14.
[31] Embedthis SoftwareEmbedthis Appweb™ Design Goalshttp :// appwebserver . org / products / appweb / doc -4/ guide / appweb / goals . htmlRetrieved 2012-03-15.
[32] Embedthis SoftwareAppweb Architecturehttp :// appwebserver . org / products / appweb / architecture . htmlRetrieved 2012-03-15.
[33] Embedthis SoftwareAppweb™ — for Dynamic Web Applicationshttp :// appwebserver . org / products / appweb / embedded - web - server . htmlRetrieved 2012-03-15.
[34] Embedthis SoftwareAppweb™ FAQhttp :// appwebserver . org / support / faq . htmlRetrieved 2012-03-15.
[35] Embedthis SoftwareUsing Ejscripthttp :// appwebserver . org / products / appweb / doc -4/ guide / appweb / users / ejs . htmlRetrieved 2012-03-16.
[36] Embedthis SoftwareUsing PHPhttp :// appwebserver . org / products / appweb / doc -4/ guide / appweb / users / php . htmlRetrieved 2012-03-16.
[37] Embedthis SoftwareEmbedded Gateway Interface™http :// appwebserver . org / products / appweb / doc -2/ guide / appweb / programmers / egi . htmlRetrieved 2012-03-16.
68
[38] Embedthis SoftwareUsing CGIhttp :// appwebserver . org / products / appweb / doc -4/ guide / appweb / users / cgi . htmlRetrieved 2012-03-16.
[39] Embedthis SoftwareEmbedded Server Pageshttp :// appwebserver . org / products / appweb / doc -4/ guide / esp / users / using . htmlRetrieved 2012-03-19.
[40] Embedthis SoftwareConfiguring SSLhttp :// appwebserver . org / products / appweb / doc -4/ guide / appweb / users / ssl . htmlRetrieved 2012-03-19.
[41] AuthenTec, Inc.PeerSec Networks MatrixSSL™http :// www . peersec . com / matrixssl . htmlRetrieved 2012-03-19.
[42] Embedthis SoftwareEmbedthis Appweb™ Featureshttp :// appwebserver . org / products / appweb / features . htmlRetrieved 2012-03-19.
[43] The Cherokee ProjectWhy Cherokee?http :// www . cherokee - project . com / doc / basics _ why _ cherokee . htmlRetrieved 2012-03-19.
[44] The Cherokee ProjectModules: Handlershttp :// www . cherokee - project . com / doc / modules _ handlers . htmlRetrieved 2012-03-20.
[45] The Cherokee ProjectRequirementshttp :// www . cherokee - project . com / doc / basics _ requirements . htmlRetrieved 2012-03-19.
[46] The Cherokee ProjectAdvanced Configurationhttp :// www . cherokee - project . com / doc / config _ advanced . htmlRetrieved 2012-03-20.
[47] The Cherokee ProjectOther: Frequently Asked Questionshttp :// www . cherokee - project . com / doc / other _ faq . htmlRetrieved 2012-03-19.
69

[48] Octalityhttp :// www . octality . com /Retrieved 2012-03-21.
[49] M BrownFastCGI Specificationhttp :// www . fastcgi . com / devkit / doc / fcgi - spec . htmlRetrieved 2012-03-21.
[50] N SchemenauerSCGI: A Simple Common Gateway Interface alternativehttp :// www . python . ca / scgi / protocol . txtRetrieved 2012-03-21.
[51] uWSGIhttp :// projects . unbit . it / uwsgi /Retrieved 2012-03-21.
[52] The Cherokee ProjectHandler: Server Side Includeshttp :// www . cherokee - project . com / doc / modules _ handlers _ ssi . htmlRetrieved 2012-03-21.
[53] yaSSLyaSSL Embedded Web Server, Features Overviewhttp :// www . yassl . com / yaSSL / Docs - yassl - embedded - web - server - Features . htmlRetrieved 2012-03-21.
[54] ACME Laboratoriesthttpd - tiny/turbo/throttling HTTP serverhttp :// www . acme . com / software / thttpd /Retrieved 2012-03-22.
[55] J Poskanzerthttpd man pagehttp :// www . acme . com / software / thttpd / thttpd _ man . htmlRetrieved 2012-03-22.
[56] J Poskanzerssi man pagehttp :// www . acme . com / software / thttpd / ssi _ man . htmlRetrieved 2012-03-22.
[57] ACME LaboratoriesConfiguration Optionshttp :// www . acme . com / software / thttpd / options . htmlRetrieved 2012-03-22.
70
[58] ACME LaboratoriesWeb Server Comparisonshttp :// www . acme . com / software / thttpd / benchmarks . htmlRetrieved 2012-03-22.
[59] Hewlett-Packard Development Company, L.P.httperfhttp :// www . hpl . hp . com / research / linux / httperf /Retrieved 2013-03-07.
[60] The Apache Software Foundationab - Apache HTTP server benchmarking toolhttp :// httpd . apache . org / docs /2.4/ programs / ab . htmlRetrieved 2013-03-07.
[61] The Apache Software FoundationApache JMeter™http :// jmeter . apache . org /Retrieved 2013-03-07.
[62] Nicolas NiclausseTsunghttp :// tsung . erlang - projects . org /Retrieved 2013-03-07.
[63] weighttphttp :// redmine . lighttpd . net / projects / weighttp / wikiRetrieved 2013-03-07.
[64] G Banga, P DruschelMeasuring the capacity of a web serverIn Proceedings of the USENIX Symposium on Internet Technologies and SystemsPages 61-71, Monterey, California, USA, December 1997
[65] J MidgleyThe Linux HTTP Benchmarking HOWTOhttp :// www . xenoclast . org / doc / benchmark / HTTP - benchmarking - HOWTO / HTTP - benchmarking - HOWTO . htmlPublished 2001-07-06, retrieved 2012-04-13.
[66] Web Performance, Inc.Load Testerhttp :// www . webperformance . com /Retrieved 2013-03-07.
71
[67] D Pariag, et al.Comparing the Performance of Web Server ArchitecturesIn Proceedings of the 2nd ACM SIGOPS/EuroSys European Conference onComputer Systems 2007Pages 231-243, Lisbon, Portugal, 2007
[68] C Coarfa, P Druschel, D Wallach Performance analysis of TLS Web serversIn ACM Transactions on Computer Systems, Vol. 24, No. 1Pages 39-69, ACM, New York, NY, USA, February 2006
[69] T VoigtOverload Behaviour and Protection of Event-driven Web ServersIn Revised Papers from the NETWORKING 2002 Workshops on Web Engineeringand Peer-to-Peer ComputingPages 147-157, Springer-Verlag, London, UK, UK, 2002
[70] G Banga, P DruschelMeasuring the capacity of a Web server under realistic loadsIn World Wide WebIssue 1, Volume 2, Pages 69-83, Springer Netherlands, 1999-06-16
[71] Paessler AGWebserver Stress Toolhttp :// www . paessler . com / webstressRetrieved 2013-03-07.
[72] L Titchkosky, M Arlitt, C WilliamsonA performance comparison of dynamic Web technologiesIn ACM SIGMETRICS Performance Evaluation ReviewIssue 3, Volume 31, Pages 2-11, ACM, New York, NY, USA, December 2003
[73] Hewlett-Packard Development Company, L.P.httperf Manual Page - version 0.9http :// www . hpl . hp . com / research / linux / httperf / httperf - man -0.9. txtRetrieved 2012-04-17.
[74] ARM Ltd.http :// www . arm . com /Retrieved 2012-12-13.
[75] Linux Kernel Organization, Inc.The Linux Kernel Archiveshttp :// www . kernel . org /Retrieved 2012-12-13.
72

[76] Alessandro AlinoneComet and Push Technologyhttp :// cometdaily . com /2007/10/19/ comet - and - push - technology /Published 2007-10-19, retrieved 2012-12-13.
[77] Syntronic ABhttp :// www . syntronic . seRetrieved 2012-12-13.
[78] Atmel CorporationAtmel AVR 8-bit and 32-bit microcontrollerhttp :// www . atmel . com / products / microcontrollers / avr / default . aspxRetrieved 2013-01-09.
[79] Intel CorporationIntel® Atom™ Processorhttp :// www . intel . com / content / www / us / en / processors / atom / atom - processor . htmlRetrieved 2013-01-09.
[80] ARM Ltd.Cortex-M3 Processorhttp :// www . arm . com / products / processors / cortex - m / cortex - m 3. phpRetrieved 2013-01-09.
[81] ARM Ltd.Cortex-M4 Processorhttp :// www . arm . com / products / processors / cortex - m / cortex - m 4- processor . phpRetrieved 2013-01-09.
[82] ARM Ltd.Cortex-A8 Processorhttp :// www . arm . com / products / processors / cortex - a / cortex - a 8. phpRetrieved 2013-01-09.
[83] ARM Ltd.Cortex-A9 Processorhttp :// www . arm . com / products / processors / cortex - a / cortex - a 9. phpRetrieved 2013-01-09.
[84] Arduinohttp :// www . arduino . cc /Retrieved 2013-01-09.
[85] I Fette, A MelnikovThe WebSocket Protocolhttp :// tools . ietf . org / html / rfc 6455Retrieved 2013-01-09.
73
[86] R Berjon, et al.HTML5http :// www . w 3. org / TR /2012/ CR - html 5-20121217/Retrieved 2013-01-09.
[87] Information Sciences Institute, University of Southern CaliforniaTRANSMISSION CONTROL PROTOCOLhttp :// tools . ietf . org / html / rfc 793Retrieved 2013-01-09.
[88] Lighttpdhttp :// www . lighttpd . net /Retrieved 2013-03-04.
[89] LighttpdRevised BSD licensehttp :// www . lighttpd . net / assets / COPYINGRetrieved 2013-03-04.
[90] Lighttpd Wiki - DocsConfiguration File Optionshttp :// redmine . lighttpd . net / projects / lighttpd / wiki / Docs _ ConfigurationOptionsRetrieved 2013-03-04.
[91] A Dunkels, L WoestenberglwIP - READMEhttp :// git . savannah . gnu . org / cgit / lwip . git / plain / READMERetrieved 2013-03-05.
[92] A Dunkelssys_arch interface for lwIP 0.6++http :// git . savannah . gnu . org / cgit / lwip . git / plain / doc / sys _ arch . txtRetrieved 2013-03-05.
[93] lwIPhttp :// savannah . nongnu . org / projects / lwip /Retrieved 2013-03-05.
[94] lwIPBasic HTTP server demonstrationhttp :// git . savannah . gnu . org / cgit / lwip / lwip - contrib . git / tree / apps / httpserverRetrieved 2013-03-05.
[95] lwIPHTTP server with CGI and SSIhttp :// git . savannah . gnu . org / cgit / lwip / lwip - contrib . git / tree / apps / httpserver _ rawRetrieved 2013-03-05.
74
[96] S OliveriSTR91x Ethernet demohttp :// developers . stf 12. net / Ethernet - demoRetrieved 2013-03-05.
[97] R Iakobashvili, M Mosercurl-loaderhttp :// curl - loader . sourceforge . net /Retrieved 2013-03-07.
[98] OpenSTAhttp :// opensta . org /Retrieved 2013-03-07.
[99] IxiaIxLoadhttp :// www . ixiacom . com / products / network _ test / applications / ixload / index . phpRetrieved 2013-03-07.
[100] Spirent CommunicationsSpirent Avalanchehttp :// www . spirent . com / Ethernet _ Testing / Software / AvalancheRetrieved 2013-03-07.
[101] BeagleBoard.orgBeagleBoard-xMhttp :// beagleboard . org / Products / BeagleBoard - xMRetrieved 2013-06-14.
[102] Atmel CorporationSTK1000http :// www . atmel . com / tools / MATURESTK 1000. aspxRetrieved 2013-06-14.
75