Performance Comparison of Neural Network Based Multi ...
12
CEAI, Vol.20, No.1 pp. 86-97, 2018 Printed in Romania Performance Comparison of Neural Network Based Multi Output SMPS with Improved Power Quality and Voltage Regulation. S. Malathi, J.Jayachandran, R. Murali Sachithanandam Department of EEE, School of Electrical & Electronics Engineering, SASTRA University,Thanjavur- 613401, Tamil Nadu, India (Tel:+91 9600441614 ; e-mail: {jj_mals, jj_chandru, murali} @eee.sastra.edu). Abstract: In this paper a neural network based Switched Mode Power Supply (SMPS) of 175W rating is designed with ±5V and ±12V employing various converter topologies and simulated in MATLAB to demonstrate improved power quality in terms of low total harmonic distortion of supply current, high power factor, distortion factor and displacement factor. The performance of SMPS is analyzed based on input power quality, output voltage regulation and transient response under varying source and load conditions. Comparison of performances with neural network and conventional controllers highlight the neural network control. The converter with superior performance is adopted for developing hardware. Keywords: Switched mode power supply, power quality, total harmonic distortion and power factor 1. INTRODUCTION Switched Mode Power Supplies (SMPS), Uninterruptible Power Supplies (UPS), battery chargers, electronic ballasts, Adjustable Speed Drives (ASDs) etc., extensively utilize the solid state AC-DC converters with High Frequency Transformer (HFT) isolation (Moore and Portugues, 2003). In conventional topology, the AC-DC converters are designed with two stages. The first stage of the topology incorporates Diode Bridge Rectifier (DBR) which rectifies input AC voltage into an uncontrolled DC voltage. The second stage of the circuit constitutes, a high frequency isolation transformer and a DC-DC converter which is cascaded with first stage. The two stage AC-DC converters introduce Power Quality (PQ) problems and increase the size of the DC capacitor in the first stage (Carlos et al., 2010). The major power quality issues are harmonic current injection into the AC mains, distortion of source voltage and decrease in power factor (PF) (Jingquan et al., 2006). Due to increased application of AC-DC converters, the researchers focused on the development of single stage converters which mitigate the PQ problems, improve the efficiency and reduce the overall cost of the system by employing less number of components (Shika Singh et al., 2015; Singh et al., 2003; Singh et al., 2011; Woo and Joo, 2011). The proposed single stage topology of AC-DC converter with HFT isolation overcomes all the drawbacks of two-stage converters and improves the PQ. This paper deals with the performance analysis of Artificial Neural Network (ANN) based Multiple Output Switched Mode Power Supply (MOSMPS) involving various converter topologies with HFT isolation. Various converter topologies like forward, sepic, cuk and flyback are designed and implemented with multiple outputs of ± 12 V and ± 5 V for a load rating of 175W mainly used in the PC power supply application. The HFT has a single primary winding and multiple number of secondary windings to accomplish four different outputs. The closed loop control employs a NN based weighted error approach for power quality improvement at the source side to meet the IEEE 519 and IEC 61000-3-2 standards and for output voltage regulation. The modeling and performance analysis of various converter topologies under varying source and load conditions are performed in MATLAB Simulink environment. The performance of various converter topologies are evaluated based on the PQ indices such as Total Harmonic Distortion (THD), Power factor, Displacement Power Factor (DPF) and Distortion Factor (DF) and output voltage regulation in terms of voltage ripple. The performance of the MOSMPS with neural network controller is compared with that of MOSMPS with conventional controller. The converter topology which performs better in all aspects of power quality indices and output voltage regulation is chosen and the prototype model is developed. The proposed NN based control strategy is implemented in hardware using FPGA processor. The results of the developed prototype model are compared with simulation results confirming the validity of the design. 2. SYSTEM CONFIGURATION The system configuration of SMPS with multiple isolated outputs is shown in Fig. 1. A DBR is employed at the input side of MOSMPS which rectifies the sinusoidal voltage V in of the ac mains. Fig. 1. System Configuration of MOSMPS.
Transcript of Performance Comparison of Neural Network Based Multi ...
CEAI, Vol.20, No.1 pp. 86-97, 2018 Printed in Romania
Performance Comparison of Neural Network Based Multi Output SMPS with Improved Power Quality and Voltage Regulation.
S. Malathi, J.Jayachandran, R. Murali Sachithanandam
Department of EEE, School of Electrical & Electronics Engineering, SASTRA University,Thanjavur- 613401, Tamil Nadu, India (Tel:+91 9600441614 ; e-mail: {jj_mals, jj_chandru, murali} @eee.sastra.edu).
Abstract: In this paper a neural network based Switched Mode Power Supply (SMPS) of 175W rating is designed with ±5V and ±12V employing various converter topologies and simulated in MATLAB to demonstrate improved power quality in terms of low total harmonic distortion of supply current, high power factor, distortion factor and displacement factor. The performance of SMPS is analyzed based on input power quality, output voltage regulation and transient response under varying source and load conditions. Comparison of performances with neural network and conventional controllers highlight the neural network control. The converter with superior performance is adopted for developing hardware.
Keywords: Switched mode power supply, power quality, total harmonic distortion and power factor
1. INTRODUCTION
Switched Mode Power Supplies (SMPS), Uninterruptible Power Supplies (UPS), battery chargers, electronic ballasts, Adjustable Speed Drives (ASDs) etc., extensively utilize the solid state AC-DC converters with High Frequency Transformer (HFT) isolation (Moore and Portugues, 2003). In conventional topology, the AC-DC converters are designed with two stages. The first stage of the topology incorporates Diode Bridge Rectifier (DBR) which rectifies input AC voltage into an uncontrolled DC voltage. The second stage of the circuit constitutes, a high frequency isolation transformer and a DC-DC converter which is cascaded with first stage. The two stage AC-DC converters introduce Power Quality (PQ) problems and increase the size of the DC capacitor in the first stage (Carlos et al., 2010). The major power quality issues are harmonic current injection into the AC mains, distortion of source voltage and decrease in power factor (PF) (Jingquan et al., 2006). Due to increased application of AC-DC converters, the researchers focused on the development of single stage converters which mitigate the PQ problems, improve the efficiency and reduce the overall cost of the system by employing less number of components (Shika Singh et al., 2015; Singh et al., 2003; Singh et al., 2011; Woo and Joo, 2011). The proposed single stage topology of AC-DC converter with HFT isolation overcomes all the drawbacks of two-stage converters and improves the PQ. This paper deals with the performance analysis of Artificial Neural Network (ANN) based Multiple Output Switched Mode Power Supply (MOSMPS) involving various converter topologies with HFT isolation. Various converter topologies like forward, sepic, cuk and flyback are designed and implemented with multiple outputs of ± 12 V and ± 5 V for a load rating of 175W mainly used in the PC power supply application. The HFT has a single primary winding and multiple number of secondary windings to accomplish four different outputs. The closed loop control employs a NN
based weighted error approach for power quality improvement at the source side to meet the IEEE 519 and IEC 61000-3-2 standards and for output voltage regulation. The modeling and performance analysis of various converter topologies under varying source and load conditions are performed in MATLAB Simulink environment. The performance of various converter topologies are evaluated based on the PQ indices such as Total Harmonic Distortion (THD), Power factor, Displacement Power Factor (DPF) and Distortion Factor (DF) and output voltage regulation in terms of voltage ripple. The performance of the MOSMPS with neural network controller is compared with that of MOSMPS with conventional controller. The converter topology which performs better in all aspects of power quality indices and output voltage regulation is chosen and the prototype model is developed. The proposed NN based control strategy is implemented in hardware using FPGA processor. The results of the developed prototype model are compared with simulation results confirming the validity of the design.
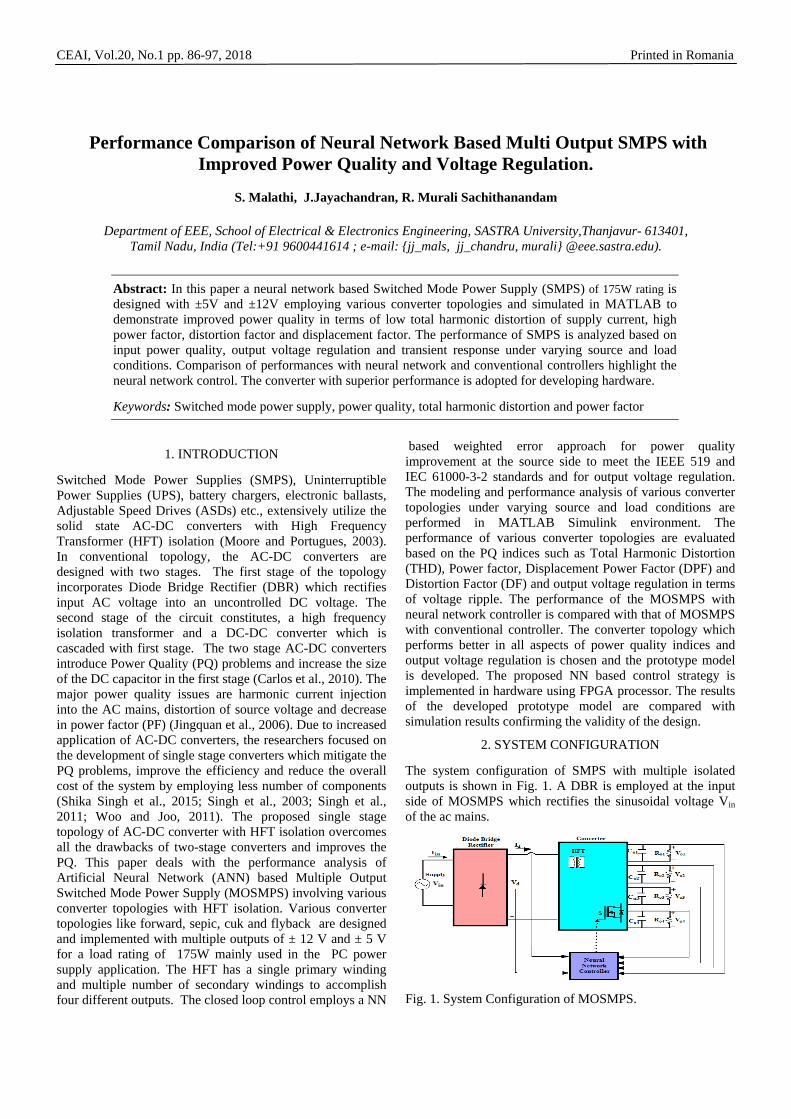
2. SYSTEM CONFIGURATION
The system configuration of SMPS with multiple isolated outputs is shown in Fig. 1. A DBR is employed at the input side of MOSMPS which rectifies the sinusoidal voltage Vin of the ac mains.
Fig. 1. System Configuration of MOSMPS.
CONTROL ENGINEERING AND APPLIED INFORMATICS 87
The unregulated output of the DBR is fed to a DC-DC converter in order to regulate the DC voltage. The regulated DC voltage is applied to a HFT, which helps in the isolation of various multiple DC outputs and voltage scaling. The four multiple output voltages V01, V02, V03 and V04 of MOSMPS are derived from the secondary windings of HFT. The performance of converter in terms of output voltage regulation and power quality improvement at the input side depends on the choice of the control strategy.
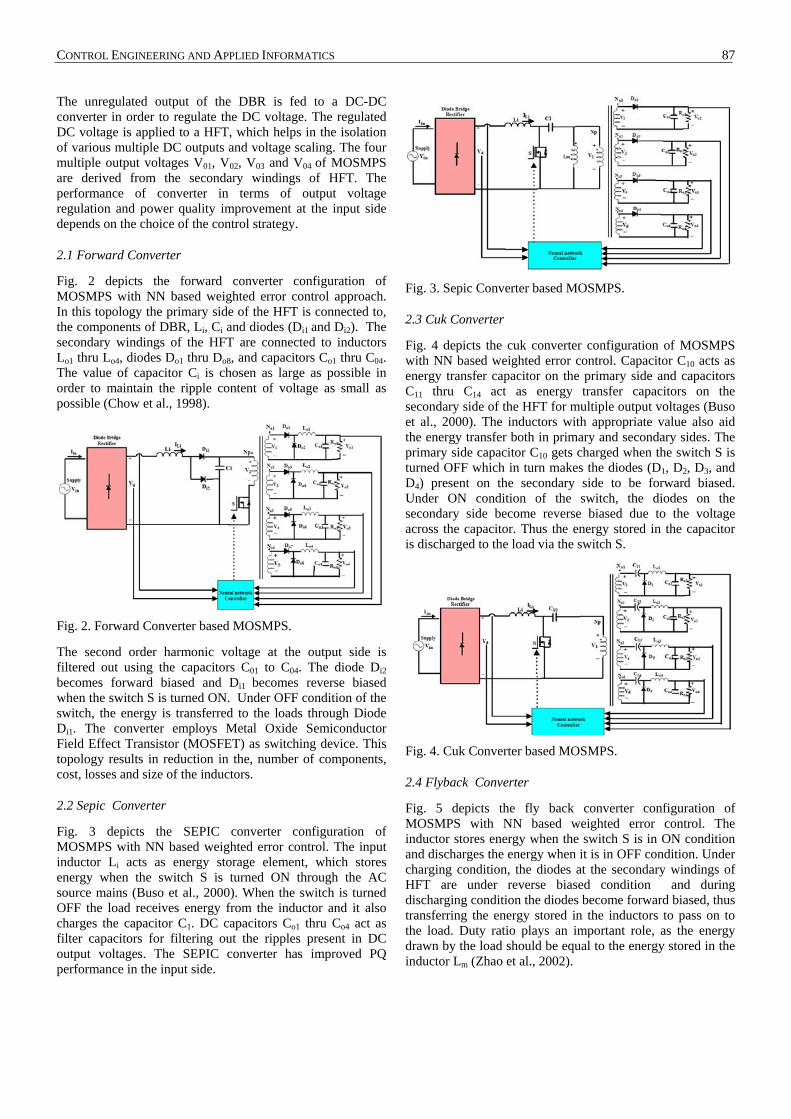
2.1 Forward Converter
Fig. 2 depicts the forward converter configuration of MOSMPS with NN based weighted error control approach. In this topology the primary side of the HFT is connected to, the components of DBR, Li, Ci and diodes (Di1 and Di2). The secondary windings of the HFT are connected to inductors Lo1 thru Lo4, diodes Do1 thru Do8, and capacitors Co1 thru C04. The value of capacitor Ci is chosen as large as possible in order to maintain the ripple content of voltage as small as possible (Chow et al., 1998).
Fig. 2. Forward Converter based MOSMPS.
The second order harmonic voltage at the output side is filtered out using the capacitors C01 to C04. The diode Di2 becomes forward biased and Di1 becomes reverse biased when the switch S is turned ON. Under OFF condition of the switch, the energy is transferred to the loads through Diode Di1. The converter employs Metal Oxide Semiconductor Field Effect Transistor (MOSFET) as switching device. This topology results in reduction in the, number of components, cost, losses and size of the inductors.
2.2 Sepic Converter
Fig. 3 depicts the SEPIC converter configuration of MOSMPS with NN based weighted error control. The input inductor Li acts as energy storage element, which stores energy when the switch S is turned ON through the AC source mains (Buso et al., 2000). When the switch is turned OFF the load receives energy from the inductor and it also charges the capacitor C1. DC capacitors Co1 thru Co4 act as filter capacitors for filtering out the ripples present in DC output voltages. The SEPIC converter has improved PQ performance in the input side.
Fig. 3. Sepic Converter based MOSMPS.
2.3 Cuk Converter
Fig. 4 depicts the cuk converter configuration of MOSMPS with NN based weighted error control. Capacitor C10 acts as energy transfer capacitor on the primary side and capacitors C11 thru C14 act as energy transfer capacitors on the secondary side of the HFT for multiple output voltages (Buso et al., 2000). The inductors with appropriate value also aid the energy transfer both in primary and secondary sides. The primary side capacitor C10 gets charged when the switch S is turned OFF which in turn makes the diodes (D1, D2, D3, and D4) present on the secondary side to be forward biased. Under ON condition of the switch, the diodes on the secondary side become reverse biased due to the voltage across the capacitor. Thus the energy stored in the capacitor is discharged to the load via the switch S.
Fig. 4. Cuk Converter based MOSMPS.
2.4 Flyback Converter
Fig. 5 depicts the fly back converter configuration of MOSMPS with NN based weighted error control. The inductor stores energy when the switch S is in ON condition and discharges the energy when it is in OFF condition. Under charging condition, the diodes at the secondary windings of HFT are under reverse biased condition and during discharging condition the diodes become forward biased, thus transferring the energy stored in the inductors to pass on to the load. Duty ratio plays an important role, as the energy drawn by the load should be equal to the energy stored in the inductor Lm (Zhao et al., 2002).

88 CONTROL ENGINEERING AND APPLIED INFORMATICS
Fig. 5. Flyback Converter based MOSMPS.
3. CONTROL STRATEGY
The power quality improvement at the input side during steady state and transient conditions depend upon the choice of control strategy used to regulate the output DC voltages in a MOSMPS. In this paper, neural network based weighted error control approach is proposed for PQ improvement in input side and output voltage regulation. In the proposed control approach depicted in Fig. 6, the sensed individual output voltage errors are summed up using a summer with a suitable weighting factor multiplied for each output voltage error. The output of the summer is fed as an input to the neural network block. The neural network controller which replaces the PI controller of conventional control strategy computes the magnitude of the reference current Imag. The weighting factors are responsible for computing the variation in the duty ratio based on the change in individual output. It also represents the impact of load variations in output terminals on the present load condition. The weighting factor for output voltages Vo1 to Vo4 are 0.528, 0.42, 0.009 and 0.06 respectively. In order to attain improved PQ at the AC mains in terms of power factor and % THD of source current, the source voltage is sensed from the input side and converted into a sine wave of unit amplitude. The reference current for the DC-DC converter is calculated by multiplying the magnitude of the input AC mains supply current Imag and unit amplitude of sine wave. The triggering pulse for the MOSFET switch in DC-DC converter is generated by comparing the reference current calculated and the actual sensed current from the ac mains.
4. DESIGN AND ARCHITECTURE OF ANN
The main component of ANN is neuron which is formed by the interconnection of non-linear information processing devices. At present in many power electronic applications, ANN is preferred because of its efficient computational tool. The performance of the AC-DC converter mainly depends upon the choice of the controller. The primary requirements of the controller are i) high dynamic response ii) less computation time for the calculation of reference current and iii) high accuracy in sensing the signals and calculation (Sabha Raj et al., 2014; Jayachandran and Murali, 2016). The performance of conventional controller is not satisfactory when compared to ANN technique under varying source and load conditions. Issues of PI controller reported in the literature include: i)Tuning the PI controller and its gains is hard at large sampling time ii) Instability in low voltage
applications and iii)Fluctuating dc link voltage(Jayachandran and Murali, 2015 b; Shuhui Li et al., 2014). The propounded ANN controller is robust and does not require a precise mathematical model. It expedites classification of real time data and processing and accommodates unpredictability due to implied non-linear modelling and built in function. Due to its adaptability and improved efficiency, ANN controllers are the choice of most of the researchers (Jayachandran and Murali, 2015 a,b). ANN controllers analyse the DC output voltages and source current continuously, adapt to the continuous observation and adjust controller parameters accordingly, for DC output voltage regulation and input power factor improvement. The ANN controller is trained to obtain lower values of settling time, steady state error and peak overshoot. In this paper, Back Propagation Neural Network (BPNN) is the proposed NN architecture. Input layer, hidden layer and output layer constitute the architecture of NN. The weighting factor of each of the output is multiplied with the respective output error, and their sum is considered as input vector which is fed to the input layer. The output of the input layer is transmitted to the consecutive hidden layer and then to the output layer through weighted connections. Each neuron in the output and hidden layers transfers the result through a non-linear activation function.
Table 1. Training Performance of NN Architecture.
Architecture MSE R2 1-10-1 0.03152 0.9907 1-12-1 0.01451 0.9908 1-14-1 0.01143 0.9939 1-16-1 0.00859 0.9931 1-18-1 0.00792 0.9940 1-20-1 0.00109 0.9991 1-22-1 0.00227 0.9979 1-24-1 0.00393 0.9971 1-26-1 0.00571 0.9958
The number of input vectors fed to the input layer is defined by the problem and the number of neurons in the output layer is based on the output of the problem. The number and size of the hidden layers mainly depend upon the problem defined. The performance error and training period decide the optimum choice of number of neurons in the hidden layer. Fig. 7 depicts the flow chart of ANN modeling and Fig. 8 represents the BPNN architecture. The parameter variation in the proposed control strategy is mainly non-linear in nature. To solve this the activation function selected are ‘tansig’ (tangent sigmoid function) for neurons in the input and hidden layers and Purelin (Linear activation function) for neurons in the output layers. ‘Dotprod’ and ‘Adaptwb’ are the functions adopted to adjust and tune respectively network weights and biases. Levenberg-Marquardt (LM) BP training algorithm ‘trainlm’ is found to be suitable for the specified problem considering the Mean Squared Error (MSE) for the L index values under varying source and load conditions, training time and overall accuracy. Table 1 depicts the training performance of NN architecture of forward converter based MOSMPS. It is inferred from Table 1 that, the number

CONTROL ENGINEERING AND APPLIED INFORMATICS 89
Fig. 6. Schematic Diagram of Neural Network based Weighted Error Approach.
of neurons in the hidden layer and MSE are not directly related in the training process. The highest value of R2 and minimum value of MSE are achieved when the number of neurons is 20 in the hidden layer. The details of ANN parameters of various converter topologies for training in MATLAB are listed in Table 2. The four axes shown in Fig. 9 represent training, validation, testing and total response of the data for NN control strategy in forward converter. The dotted line in each axis represents the perfect results where outputs = targets. The solid line represents the best fit linear regression line between outputs and targets. The R value is an indication of the relationship between the outputs and targets. It is the correlation coefficient between the outputs and targets and is calculated using Eq. 1. If R=1, it indicates that there is an exact linear relationship between outputs and targets. If R is zero, then there is no linear relationship between outputs and targets. The output tracks the target very well for training, testing and validation and the R-value is over 0.96 for the total response. Fig. 10 depicts the performance curve of NN control for forward converter and it is inferred that error decreases as the number of epochs increases and converges to a value of 0.00109 after 1000 epochs to reach the goal.
MSE
R 1 (1)
where
N
iii TO
NMSE
1
2
2
1
N
ii OO
N1
2
2
1
N
iiO
NO
1
1
iO and iT is the output and targeted value of the ANN for
n -th data set and N denotes number of data set.
Fig. 7. Flow chart of ANN modelling.
Fig. 8. Proposed BPNN architecture.
Fig. 9. (a) Training (b) Validation (c) Testing (d) Total response.
From the performance curve it can be inferred that, the results are reasonable because of the following considerations: i) The final mean square error is small, ii) The test set error and validation set error has similar characteristics and iii) No significant over fitting has occurred. The procedure followed in neural network formulation for all other converters remains the same.

90 CONTROL ENGINEERING AND APPLIED INFORMATICS
Fig. 10. The performance curve of NN Control for Forward Converter.
Table 2. ANN parameters of various converter topologies.
Parameter Values
1* 2* 3* 4*
No of Training samples 1000 1000 1000 1000
No of Testing samples 200 200 200 200
Input layer neurons 1 1 1 1
Hidden layer neurons 20 24 26 30
Output layer neurons 1 1 1 1
Training function LM Algorithm (trainlm)
Performance function Mean squared error (MSE) ( input /hidden/output)
Activation function tansig/ tansig/ purelin
Maximum no. of epochs 1000 920 210 920
Rate of Learning 0.05 0.05 0.05 0.05
Performance goal 1e-3
Normalized range -1 to 1
Accuracy of testing in % 99.1 99.23 99.21 99.23
1*- Forward converter, 2*-Sepic converter, 3*-Cuk converter & 4*-Flyback converter.
5. SIMULATION RESULTS AND DISCUSSIONS
To compare the performance of the multiple output SMPS of 175 W rating with different converter configurations, they are modeled as per the parameters specified in Table 3 and simulated using MATLAB /Simulink software. Power quality improvement at the input ac mains and output voltage regulations are achieved using the neural network controller. The simulation of the neural network based multi output SMPS with different converter configurations are carried out for validating their performance under i)steady state condition, ii) variable supply voltage and iii) varying loads. To validate the performance of the multiple output SMPS under varying source condition the source voltage is varied between 170V and 250V RMS and to highlight the performance under varying load condition the load at output terminal 2(Vo2) is increased from 50% to 100% at 0.5s of the simulation period.
Tables 4 and 5 illustrate, the power quality indices of MOSMPS in terms of %THD of the supply current, DF, DPF, PF at the supply side and output voltage ripple for all the four terminals with NN and conventional controller, at full load and 50% load condition respectively. Table 6 reports
the comparison of performance of SMPS at full load with neural network and conventional controllers in terms of settling time, overshoot and undershoot of the output voltage at terminal 1.
Table 3. Parameters of MOSMPS.
Sl.No. Parameters Values 1. Supply voltage Vin 170-250 V RMS 2. Switching frequency fs 50 kHz 3. Output voltage V01/Io1 12 V/6 A 4. Output voltage V02/Io2 5 V/18 A 5. Output voltage V03/Io3 -5 V/0.3 A 6. Output voltage V04/Io4 -12 V/0.8 A 7. Output power P0 175 W
5.1 Performance of forward converter based MOSMPS with NN controller
V01= +12 V
V02= +5 V
V03= -5 V
V04= -12 V
Output Voltage Waveforms
100% load condition
50% load condition Load change from50% to 100%
Io1=6A
Io2=18A
Io4=0.8AIo3=0.3A
Output Current Wave forms
THD= 3.5%
Fig. 11. Waveforms of forward converter based MOSMPS with Vin = 220V.Traces (a) Output voltages (V) (b) Output currents (A), (c) Vin/100 (V) and Iin (A), (d) %THD of Iin.
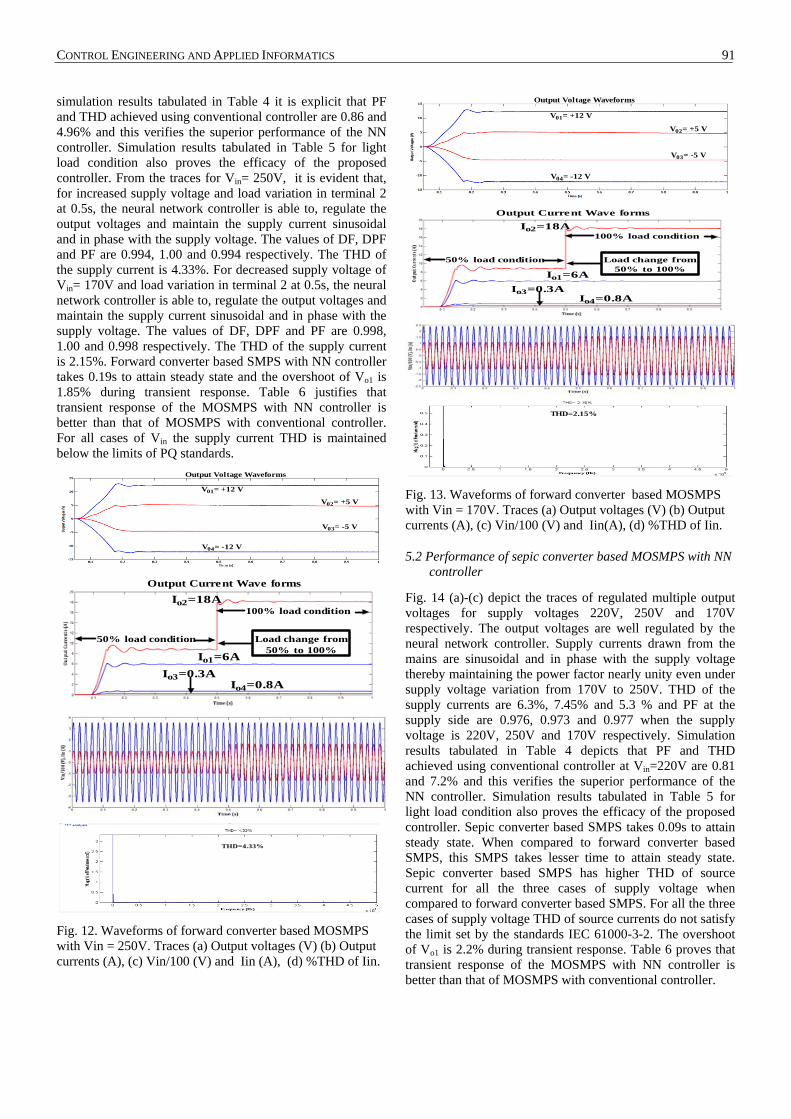
Fig.11,12 and 13 depict the traces of regulated multiple output voltages, output currents, supply voltage and current with load variation and %THD of Iin for supply voltages 220V, 250V and 170V respectively. The output voltages are well regulated by the neural network controller even under load variation at terminal 2 from 50% to 100% at 0.5s. From the source voltage and current waveforms for Vin= 220V, it is evident that supply current drawn from the mains is sinusoidal and in phase with the supply voltage thereby maintaining the power factor nearly unity. The values of DF, DPF and PF are 0.996, 1.00 and 0.996 respectively. The THD of the supply current is maintained at 3.5%. From the
CONTROL ENGINEERING AND APPLIED INFORMATICS 91
simulation results tabulated in Table 4 it is explicit that PF and THD achieved using conventional controller are 0.86 and 4.96% and this verifies the superior performance of the NN controller. Simulation results tabulated in Table 5 for light load condition also proves the efficacy of the proposed controller. From the traces for Vin= 250V, it is evident that, for increased supply voltage and load variation in terminal 2 at 0.5s, the neural network controller is able to, regulate the output voltages and maintain the supply current sinusoidal and in phase with the supply voltage. The values of DF, DPF and PF are 0.994, 1.00 and 0.994 respectively. The THD of the supply current is 4.33%. For decreased supply voltage of Vin= 170V and load variation in terminal 2 at 0.5s, the neural network controller is able to, regulate the output voltages and maintain the supply current sinusoidal and in phase with the supply voltage. The values of DF, DPF and PF are 0.998, 1.00 and 0.998 respectively. The THD of the supply current is 2.15%. Forward converter based SMPS with NN controller takes 0.19s to attain steady state and the overshoot of Vo1 is 1.85% during transient response. Table 6 justifies that transient response of the MOSMPS with NN controller is better than that of MOSMPS with conventional controller. For all cases of Vin the supply current THD is maintained below the limits of PQ standards.
V01= +12 V
V02= +5 V
V03= -5 V
V04= -12 V
Output Voltage Waveforms
100% load condition
50% load condition Load change from50% to 100%
Io1=6A
Io2=18A
Io4=0.8AIo3=0.3A
Output Current Wave forms
THD=4.33%
Fig. 12. Waveforms of forward converter based MOSMPS with Vin = 250V. Traces (a) Output voltages (V) (b) Output currents (A), (c) Vin/100 (V) and Iin (A), (d) %THD of Iin.
V01= +12 V
V02= +5 V
V03= -5 V
V04= -12 V
Output Voltage Waveforms
100% load condition
50% load condition Load change from50% to 100%
Io1=6A
Io2=18A
Io4=0.8AIo3=0.3A
Output Current Wave forms
THD=2.15%
Fig. 13. Waveforms of forward converter based MOSMPS with Vin = 170V. Traces (a) Output voltages (V) (b) Output currents (A), (c) Vin/100 (V) and Iin(A), (d) %THD of Iin.
5.2 Performance of sepic converter based MOSMPS with NN controller
Fig. 14 (a)-(c) depict the traces of regulated multiple output voltages for supply voltages 220V, 250V and 170V respectively. The output voltages are well regulated by the neural network controller. Supply currents drawn from the mains are sinusoidal and in phase with the supply voltage thereby maintaining the power factor nearly unity even under supply voltage variation from 170V to 250V. THD of the supply currents are 6.3%, 7.45% and 5.3 % and PF at the supply side are 0.976, 0.973 and 0.977 when the supply voltage is 220V, 250V and 170V respectively. Simulation results tabulated in Table 4 depicts that PF and THD achieved using conventional controller at Vin=220V are 0.81 and 7.2% and this verifies the superior performance of the NN controller. Simulation results tabulated in Table 5 for light load condition also proves the efficacy of the proposed controller. Sepic converter based SMPS takes 0.09s to attain steady state. When compared to forward converter based SMPS, this SMPS takes lesser time to attain steady state. Sepic converter based SMPS has higher THD of source current for all the three cases of supply voltage when compared to forward converter based SMPS. For all the three cases of supply voltage THD of source currents do not satisfy the limit set by the standards IEC 61000-3-2. The overshoot of Vo1 is 2.2% during transient response. Table 6 proves that transient response of the MOSMPS with NN controller is better than that of MOSMPS with conventional controller.

92 CONTROL ENGINEERING AND APPLIED INFORMATICS
V01= +12 V
V02= +5 V
V03= -5 V
V04= -12 V
V01= +12 V
V02= +5 V
V03= -5 V
V04= -12 V
V01= +12 V
V02= +5 V
V03= -5 V
V04= -12 V
Fig. 14. Output voltages (V) of sepic converter based MOSMPS at (a) Vin = 220V (b) Vin = 250V (c) Vin = 170V
5.3 Performance of cuk converter based MOSMPS with NN controller
Fig. 15 (a)-(c) depict the traces of regulated multiple output voltages for supply voltages 220V, 250V and 170V respectively. The output voltages are well regulated by the neural network controller. THD of the supply currents are 4.6%, 4.9% and 3.9 % and PF at the supply side are 0.976, 0.975 and 0.978 when the supply voltages are 220V, 250V and 170V respectively. Supply currents drawn from the mains are sinusoidal and in phase with the supply voltage thereby maintaining the power factor nearly unity when the supply voltage is varied from 170V to 250V.
V01= +12 VV02= +5 V
V03= -5 V
V04= -12 V
V01= +12 VV02= +5 V
V03= -5 V
V04= -12 V
V01= +12 VV02= +5 V
V03= -5 V
V04= -12 V
Fig. 15 Output voltages (V) of cuk converter based MOSMPS at (a) Vin = 220V (b) Vin = 250V (c) Vin = 170V
From the simulation results mentioned in Table 4 it is obvious that PF and THD achieved using conventional
controller are 0.81 and 6.4% at Vin=220V and this verifies the superior performance of the NN controller. Simulation results tabulated in Table 5 for light load condition also proves the efficacy of the proposed controller. Cuk converter based SMPS takes 0.23s to attain steady state. When compared to forward and sepic converter based SMPS, this SMPS takes more time to attain steady state. Cuk converter based SMPS has lower THD of source current for all the three cases of supply voltage when compared to sepic converter based SMPS. For all the three cases of supply voltage THD of source currents satisfy the limit set by the standards IEC61000-3-2. The overshoot of Vo1 is 2.2% during transient response. Performance comparisons listed in Table 6 demonstrate that transient response of the MOSMPS with NN controller is better than that of MOSMPS with conventional controller.
5.4 Performance of flyback converter based MOSMPS with NN controller
V01= +12 V
V02= +5 V
V03= -5 VV04= -12 V
Output Voltage Waveforms
V01= +12 V
V02= +5 V
V03= -5 VV04= -12 V
Output Voltage Waveforms
V01= +12 V
V02= +5 V
V03= -5 VV04= -12 V
Output Voltage Waveforms
Fig. 16 Output voltages (V) of flyback converter based MOSMPS at (a) Vin = 220V (b) Vin = 250V (c) Vin = 170V
Fig. 16 (a)-(c) depict the traces of regulated multiple output voltages for supply voltages 220V, 250V and 170V respectively. The output voltages are well regulated by the neural network controller. Supply currents drawn from the mains are sinusoidal and in phase with the supply voltage thereby maintaining the power factor nearly unity when the supply voltage is varied from 170V to 250V. THD of the supply currents are 5.2%, 6.3% and 4.96 % and PF at the supply side are 0.956, 0.953 and 0.9576 when the supply voltages are 220V, 250V and 170V respectively. From the simulation results tabulated in Table 4 it is explicit that PF and THD achieved using conventional controller are 0.79 and 7.8% at Vin=220V and this verifies the superior performance of the NN controller. Simulation results tabulated in Table 5 for light load condition also proves the efficacy of the proposed controller. Flyback converter based SMPS takes 0.24s to attain steady state. Flyback converter based SMPS takes more time to attain steady state when compared to other converter based SMPS. Flyback converter based SMPS has lower THD of source current for all the three cases of supply voltage when compared to sepic converter based SMPS but

CONTROL ENGINEERING AND APPLIED INFORMATICS 93
Table 4. Parameter values under different supply voltages and 100% load condition at load terminals.
Converter topology
Supply Voltage
(V)
DF DPF PF
% THD of Iin
Output voltage ripple
1* 2* 1* 2* V01
(%) V02
(%) V03
(%) V04
(%) Forward 170 0.998 1.00 0.998 0.84 2.15 3.87 1.6 1.9 1.3 1.0
220 0.996 1.00 0.996 0.86 3.5 4.96 250 0.994 1.00 0.994 0.82 4.33 5.66
Sepic 170 0.987 0.99 0.977 0.8 5.3 6.5 1.9 2.1 1.8 1.2 220 0.986 0.99 0.976 0.81 6.3 7.2 250 0.983 0.99 0.973 0.84 7.45 8.9
Cuk 170 0.988 0.99 0.978 0.77 3.9 5.5 1.8 2.3 1.6 1.6 220 0.986 0.99 0.976 0.81 4.6 6.4 250 0.985 0.99 0.975 0.82 4.9 8.97
Flyback 170 0.987 0.97 0.957 0.7 4.96 6.30 2.2 2.0 1.6 1.3 220 0.986 0.97 0.956 0.79 5.2 7.8 250 0.983 0.97 0.953 0.84 6.3 10.56
Table 5. Parameter values under different supply voltages and 50% load condition at load terminal 2.
Converter topology
Supply Voltage
(V)
DF DPF PF
% THD of Iin
Output voltage ripple
1* 2* 1* 2* V01
(%) V02
(%) V03
(%) V04
(%) Forward 170 0.998 0.99 0.988 0.75 4.36 5.86 1.3 1.5 1.2 1.0
220 0.996 0.99 0.986 0.78 5.00 7.07 250 0.994 0.99 0.984 0.80 6.23 9.54
Sepic 170 0.985 0.99 0.975 0.81 5.1 6.9 2.3 2.1 1.6 1 220 0.984 0.99 0.974 0.79 6.85 7.3 250 0.983 0.99 0.973 0.76 7.63 9.2
Cuk 170 0.987 0.99 0.977 0.76 4.1 6.2 0.9 1.3 1.2 1.2 220 0.983 0.99 0.973 0.83 5.3 7.8 250 0.981 0.99 0.971 0.80 6.8 9.3
Flyback 170 0.988 0.97 0.958 0.72 5.2 7.5 2.0 1.8 1.4 1.2 220 0.986 0.97 0.956 0.73 6.4 7.9 250 0.984 0.97 0.954 0.82 7.1 9.32
Table 6. Comparison of performance of SMPS at rated voltage with neural network and conventional controllers.
Converter topology
Power Density
Cost Settling Time (s)
Transient Response of Vo1with NN Control
Transient Response of Vo1with Conventional
Control 1* 2* Overshoot
(%) Undershoot
(%) Overshoot
(%) Undershoot
(%) Forward low medium 0.19 0.23 1.85 2.00 2.25 2.32
Sepic medium medium 0.09 0.14 2.2 2.34 2.9 2.83 Cuk medium Medium 0.23 0.25 2.2 2.3 2.9 2.67
Flyback low Low 0.24 0.26 2.3 2.52 2.85 2.86
1*-NN Controller, 2*-Conventional Controller
THD values of supply current do not satisfy the limit set by the standard IEC 61000-3-2. The overshoot of Vo1 is 2.3% during transient response. Performance comparisons listed in Table 6 demonstrate that transient response of the MOSMPS with NN controller is better than that of MOSMPS with conventional controller.
Inference: When the converter topologies for MOSMPS are compared based on their performances tabulated in Tables 4,5 and 6, it can be concluded that forward converter based MOSMPS with neural network controller performs better
compared to other converter topologies in the following aspects: i)The output voltages are well regulated with lower values of output voltage ripple for all the output voltages under varying load conditions. ii) The supply current drawn is sinusoidal and in phase with the supply voltage with PF value nearly unity. When the supply voltage is 220V, the values of DF, DPF and PF are 0.996, 1.00 and 0.996 respectively. NN based forward converter has higher values of DF, DPF and PF when compared to other converter topologies under varying source and load conditions. iii) THD of the source current is lesser when compared to other
94 CONTROL ENGINEERING AND APPLIED INFORMATICS
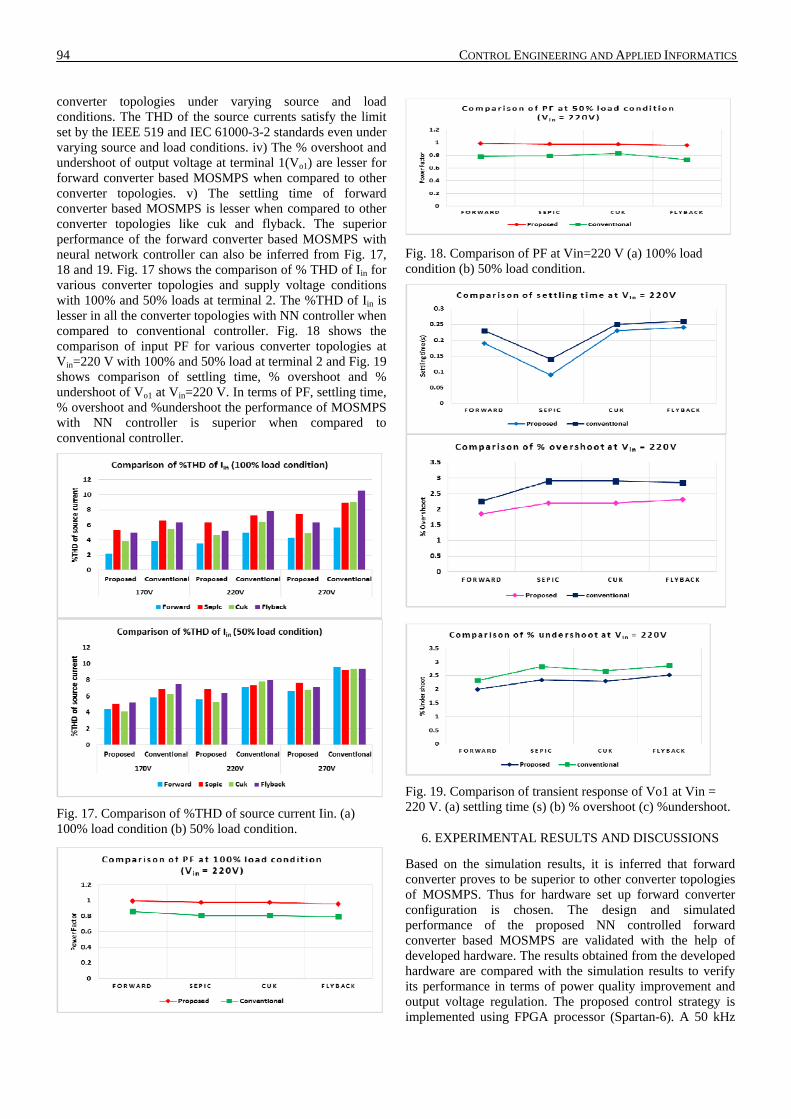
converter topologies under varying source and load conditions. The THD of the source currents satisfy the limit set by the IEEE 519 and IEC 61000-3-2 standards even under varying source and load conditions. iv) The % overshoot and undershoot of output voltage at terminal 1(Vo1) are lesser for forward converter based MOSMPS when compared to other converter topologies. v) The settling time of forward converter based MOSMPS is lesser when compared to other converter topologies like cuk and flyback. The superior performance of the forward converter based MOSMPS with neural network controller can also be inferred from Fig. 17, 18 and 19. Fig. 17 shows the comparison of % THD of Iin for various converter topologies and supply voltage conditions with 100% and 50% loads at terminal 2. The %THD of Iin is lesser in all the converter topologies with NN controller when compared to conventional controller. Fig. 18 shows the comparison of input PF for various converter topologies at Vin=220 V with 100% and 50% load at terminal 2 and Fig. 19 shows comparison of settling time, % overshoot and % undershoot of Vo1 at Vin=220 V. In terms of PF, settling time, % overshoot and %undershoot the performance of MOSMPS with NN controller is superior when compared to conventional controller.
Fig. 17. Comparison of %THD of source current Iin. (a) 100% load condition (b) 50% load condition.
Fig. 18. Comparison of PF at Vin=220 V (a) 100% load condition (b) 50% load condition.
Fig. 19. Comparison of transient response of Vo1 at Vin = 220 V. (a) settling time (s) (b) % overshoot (c) %undershoot.
6. EXPERIMENTAL RESULTS AND DISCUSSIONS
Based on the simulation results, it is inferred that forward converter proves to be superior to other converter topologies of MOSMPS. Thus for hardware set up forward converter configuration is chosen. The design and simulated performance of the proposed NN controlled forward converter based MOSMPS are validated with the help of developed hardware. The results obtained from the developed hardware are compared with the simulation results to verify its performance in terms of power quality improvement and output voltage regulation. The proposed control strategy is implemented using FPGA processor (Spartan-6). A 50 kHz

CONTROL ENGINEERING AND APPLIED INFORMATICS 95
switching frequency is adopted to reduce the size of the components and to have effective control of the switch. The isolation between the control circuit and power circuit is provided by means of IC TLP250. Output voltages are sensed using HCPL 7840. Fig. 20 shows the photograph of the developed hardware. The test results are recorded with the help of power analyser Yokogawa WT 1800 and Digital Storage Oscilloscope (DSO).
Power QualityAnalyzer DSO
1 Variac
FPGAProcessor
MOSMPS
Fig. 20. Experimental set up.
6.1 Performance at rated load and supply voltage condition.
The performance of the proposed NN controlled forward converter based MOSMPS at full load condition with a supply voltage of Vin= 220V is depicted in Fig. 21. Fig. 21 a depicts the source voltage and current waveforms at Vin= 220V with rated load which infers that the MOSMPS draws sinusoidal current from the AC mains. The supply current is maintained in phase with the supply voltage thereby maintaining the PF at 0.9998.From the results it is evident that THD of the supply current Iin is 2.944% which complies with the limits set by the International PQ standards. Fig. 21 b & c represent output voltages +12V, +5V, -12V and -5V and their corresponding output currents respectively. The constant output voltage waveforms clearly exhibit the output voltage regulation.
Vin
Iin
Vin: 300 V/divIin: 5 A/div
Fig. 21. (a) Traces of Vin, Iin with input power, PF and % THD of Iin at full load, (b) Traces of Vin, Iin, Vo1, Io1,Vo2 and Io2, (c) Traces of Vin, Iin, Vo3, Io3,Vo4 and Io4.
6.2 Performance under supply voltage variation with rated load.
When the proposed MOSMPS is supplied from the utility supply, it has to perform efficiently under supply voltage variations. To demonstrate its performance under varying source voltage conditions, the supply voltage is varied from 170V to 250V. When the supply voltage is reduced to 170V the PF and THD of the supply current are shown in Fig. 22 a. The THD of the supply current is maintained at 2.522%.When the supply voltage is increased to 250V the PF and THD of the supply current are represented in Fig. 22 b. Even when the supply voltage is increased to 250V, the THD is maintained 2.924% which is less than the limits suggested by PQ standards. During over voltage and under voltage conditions of the supply, PF is maintained close to unity. The performance of the MOSMPS is appreciable under varying supply voltage conditions.
Vin
Iin
Vin: 300 V/divIin: 5 A/div
Vin
Iin
Vin: 300 V/divIin: 5 A/div
Fig. 22. (a) Traces of Vin, Iin with input power,PF and % THD of Iin at Vin=170V, (b) Traces of Vin, Iin with input power,PF and % THD of Iin at Vin= 250 V.

96 CONTROL ENGINEERING AND APPLIED INFORMATICS
6.3 Performance under load variation with rated supply voltage.
To demonstrate the dynamic response of the proposed MOSMPS the load at Vo2 is varied. The change in load is represented in the Fig.23a with output current decreasing from 16 A to 8 A. There is a corresponding reduction in the supply current and the supply current is maintained sinusoidal even after load reduction as shown in Fig. 23 b. The PF and THD are maintained at 0.99 and 2.767% as shown in Fig. 23e for light load condition. Fig. 23c shows the increase in load at terminal Vo2 with an increase in load current from 8 A to 16 A. The traces of Fig. 23 d ensures that load current remains sinusoidal and in phase with the supply voltage thereby ensuring unity PF.
Vin
Iin
Vin: 300 V/divIin: 5 A/div
Vin
Iin
Vin: 300 V/divIin: 5 A/div
Vin
Iin
Vin: 300 V/divIin: 5 A/div
Fig. 23. (a) Load reduction in +5V (b) Traces of Vin & Iin(load reduction), (c) Load increment in +5V, (d) Traces of Vin & Iin (load increment), (e) Traces of Vin, Iin with input power,PF and % THD of Iin at light load condition.
Table 7 clearly highlights the superior performance of the experimental setup of the neural network based forward converter MOSMPS when compared to the conventional controller based forward converter MOSMPS.
Table 7. Performance analysis of the experimental setup.
Supply Voltage
(V)
PF
% THD of Iin
1* 2* 1* 2* 170 0.9996 0.8682 2.522 7.73 220 0.9998 0.7981 2.944 8.085 250 0.9997 0.8954 2.924 7.22
1*-NN Controller, 2*-Conventional Controller
The performance of the developed hardware validates the simulation results and its efficacy is proved in terms of input PQ improvement and output voltage regulation under varying source and load conditions.
7. CONCLUSIONS
Design, modeling, simulation and performance analysis of 175 W rated multi output SMPS with converter topologies like forward, sepic, cuk and flyback have been made to facilitate selection of suitable topology for the SMPS application. The performance of these topologies with conventional PI controller and proposed neural network controller has been analyzed, in terms of input power quality, output voltage regulation and transient response under variation in source and load conditions. The proposed neural network based weighted error approach calculates the impact of load variations in output terminals on the present load condition and thereby computes the variation in the duty ratio. Under varying source and load conditions, the proposed NN controller is very fast in determining the output as it can perform more number of iterations over derived period of time and thereby leading to fast settling time and low values of overshoot and undershoot. Simulation results and tabulated parameters, reveal that neural network controller performs better when compared to PI controller for all the converter topologies. Among the converter topologies Forward converter based MOSMPS with NN controller has been found to be the optimal choice for SMPS with THD of supply current 3.5%, distortion factor 0.996, displacement factor 1.00, power factor 0.996, output voltage ripple, overshoot and undershoot less than 2%. The proposed NN control strategy has been implemented in the prototype model using FPGA

CONTROL ENGINEERING AND APPLIED INFORMATICS 97
processor to obtain the experimental results. Simulation results and the experimental results illustrate the efficacy of the neural network controlled forward converter based multi output SMPS.
REFERENCES
Buso, S., Spiazzi, G., and Tagliavia, D. (2000). Simplified control technique for high power factor flyback Cuk and Sepic rectifiers operating in CCM, IEEE Trans. Ind. Appl., Vol. 36(5), pp. 1413-1418.
Carlos Alberto Gallo, Fernando Lessa Tofoli, and Joao Antonio Correa Pinto. (2010). Two-stage isolated switch-mode power supply with high efficiency and high input power factor, IEEE Trans. Ind. Electron., Vol. 57(11), pp. 3754–3766.
Chow, M.H.L., Siu, K.W., Tse, C.K., and Lee, Y.S. (1998). A novel method for elimination of line-current harmonics in single-stage PFC switching regulators, IEEE Trans. Power Electron., Vol. 13(1), pp. 75-83.
Jingquan Chen, Maksimovic, D., and Erickson, R.W. (2006). Analysis and design of a low stress buck-boost converter in universal-input PFC applications, IEEE Trans. Power Electron., Vol. 21(2), pp. 320–329.
Jayachandran, J., and Murali Sachithanandam, R. (2015). Neural network based control strategy for hybrid DSTATCOM in three phase four wire distribution system under non-ideal voltage source conditions and varying load conditions, International Review of Electrical Engineering, Vol. 10(3), pp. 421-433.
Jayachandran, J., and Murali Sachithanandam, R. (2015). Neural network based control algorithm for DSTATCOM under non ideal source voltage and varying load conditions, CJECE, Vol. 38(4), pp.307-317.
Jayachandran, J., and Murali Sachithanandam, R. (2016). ANN based controller for three phase four leg shunt active filter for power quality improvement, Ain Shams Engineering Journal, Vol. 7, pp. 275-292.
Moore, P.J., and Portugues, I.E. (2003). The influence of personal computer processing modes on line current harmonics, IEEE Trans. Power Delivery, Vol. 18(4), pp. 1363–1368.
Sabha Raj Arya, Bhim Singh, Ambrish Chandra and Kamal Al-Haddad. (2014). Learning –based anit-hebbian algorithm for control of distribution static compensator, IEEE Trans Ind. Electron., Vol. 61(11), pp. 6004–6012.
Shika Singh, Bhim Singh, Bhuvaneswari, G., Vashist Bist , Ambrish Chandra, and Kamal Al-Haddad. (2015). Improved power quality bridgeless converter based multiple output SMPS, IEEE Trans. Ind. Appl., Vol. 51(1), pp. 721–732.
Shuhui Li, Michael Fairbank, Cameron Johnson, Donald C. Wunsch, Eduardo Alonso and Julio L. Proaño. (2014). Artificial Neural Networks for Control of a Grid-Connected Rectifier/Inverter Under Disturbance, Dynamic and Power Converter Switching Conditions. IEEE Transactions on Neural Networks and Learning Systems, Vol. 25(4), pp. 738-750.
Singh, B., Singh, B.N., Chandra, A., Al-Haddad, A., Pandey, A., and Kothari, D.P. (2003). A review of single phase improved power quality AC-DC converters, IEEE Trans. Ind. Electron., Vol. 50(5), pp. 962–981.
Singh, B., Singh, S., Chandra A., and Al-Haddad, K. (2011). Comprehensive study of single phase AC-DC power factor corrected converters with high frequency isolation, IEEE Trans. Ind. Informatics, Vol. 7(4), pp. 540–556.
Woo-Young Choi and Joo-Seung Yoo. (2011). A bridgeless single stage half bridge ac/dc converter, IEEE Trans. Power Electron., Vol. 26(12), pp. 3884–3895.
Zhao, Q., Lee, F.C., and Tsai, F. (2002). Voltage and current stress reduction in single stage power factor correction AC-DC converters with bulk capacitor voltage feedback, IEEE Trans. Power Electron., Vol. 17(4), pp. 477-484.