Performance comparison of a dye-sensitized and a silicon...
131
Katrine Flarup Jensen Performance Comparison of a Dye-Sensitized and a Silicon Solar Cell under Idealized and Outdoor Conditions Master’s Thesis, September 2008
Transcript of Performance comparison of a dye-sensitized and a silicon...
Katrine Flarup Jensen
Performance Comparison of a Dye-Sensitized and a Silicon Solar Cell under Idealized and Outdoor Conditions
Master’s Thesis, September 2008


Katrine Flarup Jensen
Performance Comparison of a Dye-Sensitized and a Silicon Solar Cell under Idealized and Outdoor Conditions
Master’s Thesis, September 2008
2
Performance Comparison of a Dye-Sensitized and a Si licon Solar Cell under Idealized and Outdoor Conditions
This report was drawn up by: Katrine Flarup Jensen Supervisor(s): Esben Larsen (Technical University of Denmark) Hanne Lauritzen (Danish Technological Institute) Andreas Hinsch (Fraunhofer Institute for Solar Energy Systems ISE)
Release date:
August 29th, 2008
Category:
1 (public)
Edition:
1st edition
Comments:
This report is part of the requirements to achieve the Master of Science in Engineering (MSc) at the Technical University of Denmark.
This report represents 30 ECTS points.
Rights:
© Katrine Flarup Jensen, 2008

3
ABSTRACT
The present thesis investigates the performance of a dye-sensitized solar cell (DSC) compared to a silicon solar cell under both idealized and outdoor conditions. Due to the fundamental difference in cell structure of the DSC and the silicon cell, different electrical behaviour under varying conditions is expected. An understanding of the cell behaviour with respect to the performance parameters:
⋅ Irradiance Intensity
⋅ Operating Cell Temperature
⋅ Incidence Angle is sought by experimental investigations and a following data analysis. The work in this thesis is strongly based on experiments as well as a comparison of results with theoretical relations about electrical behaviour. The experimental investigations have been carried out in the laboratory under controlled conditions and the influence of one performance parameter could be determined. The cells investigated show very different electrical behavior under varying conditions. The DSC exhibits highest conversion efficiency under low light conditions, whereas the highest conversion efficiency for silicon cells is seen at high irradiance. Under high irradiance, the DSC shows positive dependence to elevated operating temperatures, whereas the efficiency for the silicon cells is negatively proportional to cell temperature. A beneficial ISC-generation is seen for the DSC for increasing incidence angles which may be interpreted as the effect of increased light path within the active layers. The silicon cells exhibits a reduction in relative ISC for increasing incidence angles due to the increased reflection at the surface of the top-glass. Outdoor measurements were used to verify if the results achieved in the laboratory were visible under realistic operating conditions. Both the irradiance- and temperature influence as identified in the lab was seen in the outdoor measurements, but the beneficial behaviour of the DSC related to incidence angle was not observed. This might be interpreted as influence of the surface reflectance at the top-glass. As characterization parameters, the irradiance intensity and cell temperature are therefore seen to hold greatest importance for the cell performance for both DSC and silicon cells, but also the influence of incidence angle due to reflection is an influential parameter for cell performance.

5
RESUME
Denne eksamensopgave undersøger ydelsen af en farvestofsolcelle (DSC) sammenlignet med en siliciumsolcelle under idealiserede og udendørs forhold. Grundet den fundamentale forskel i DSC- og siliciumcellens kemiske struktur er det forventeligt, at den elektriske opførsel under varierende forhold vil være forskellig. En forståelse for cellens opførsel med hensyn til ydelsesparametrene:
⋅ Indstrålingsintensitet ⋅ Cellens drifttemperatur ⋅ Indfaldsvinkel af indstråling
er søgt gennem eksperimentelle undersøgelser og en efterfølgende dataanalyse. Arbejdet med denne eksamensopgave er i høj grad baseret på eksperimentelt arbejde samt sammenligning af opnåede resultater med teoretiske relationer om den elektriske opførsel. De eksperimentelle undersøgelser er foretaget i laboratoriet under kontrollerede forhold, hvor betydningen af en enkelt ydelsesparameter kunne bestemmes. De undersøgte celler udviste stor forskellighed i elektrisk ydelse under varierende forhold. DSCen udviste højeste effektivitet ved lav lysintensitet, hvorimod den højeste effektivitet af siliciumcellen blev identificeret ved høj lysindstråling. Ved høj lysintensitet udviste DSCen positiv temperaturafhængighed ved øgede drifttemperaturer, hvorimod siliciumcellens effektivitet er negativt afhængig af celletemperatur. En positiv ISC-generering ved øget indfaldsvinkel blev observeret for DSCen, som kan tillægges effekten af øget lysvandring gennem de aktive lag. Den relative ISC for silicumcellen reduceres ved øget indfaldsvinkel, hvilket i høj grad skyldes den øgede lysreflektion på glasoverfladen. Udendørs målinger blev brugt til at undersøge, om de ydelsesafhængigheder der blev observeret i laboratoriet, også var synlige under solcellens normale driftssituation. Både den observerede indflydelse af lysintensitet og celletemperatur identificeret i laboratoriet blev set, men den gavnende DSC-ydelse ved høje indfaldsvinkler blev ikke observeret. Dette skyldes muligvis den overskyggende effekt af øget refleksion på glasoverfladen. Derfor anses indstrålingsintensitet og celletemperatur som de karakteriseringsparametre der har størst indflydelse på både DSC-og siliciumcellens ydelse, men også indfaldsvinkelens indflydelse grundet refleksionen har betydning for cellens ydelse..


7
FOREWORD
This master’s thesis was submitted to Technical University of Denmark (DTU) in partial fulfillment of the requirements for acquiring the degree of Master of Science in Engineering. The thesis represents 30 ECTS points out of the required 300 ECTS points and has run from February 2008 to the end of August 2008. The work was not part of an already established project so it has been interesting, challenging and inspiring to create contacts with people in the field and the test setups needed for the work. The thesis is aimed for people with interest and knowledge about solar energy and the functioning of solar cells. The main part of the work has been carried out at Technological Institute of Denmark (DTI) under the supervision of Dr. Hanne Lauritzen, whom I would like to thank for great guidance and inspiration. Supervision from DTU was provided by Lector Esben Larsen. I was given a great opportunity to perform the work with angular dependence at the Fraunhofer Institute for Solar Energy Systems ISE located in Freiburg, Germany, where I stayed for 2 months from May to July 2008. I had the honor to work for Dr. Andreas Hinsch and would like to thank him, Welmoed Veurman and the rest of the DSC-team for great supervision, and a study-related and enjoyable time. The nomenclature for references is [x.1], where x refers to the type of source.
Høje Taastrup, 29th of August 2008
Katrine Flarup Jensen

8

9
TABLE OF CONTENTS
Abstract............................................................................................................................ 3
Resume............................................................................................................................. 5
Foreword.......................................................................................................................... 7
List of Figures................................................................................................................ 11
List of Tables ................................................................................................................. 15
List of Symbols & Abbreviations ................................................................................ 17
1 Preface.................................................................................................................... 21 1.1 Problem Formulation ...................................................................................... 22 1.2 Method & Limitation...................................................................................... 23 1.3 Guide on how to read the report ..................................................................... 24
2 Introduction........................................................................................................... 27 2.1 The Dye-Sensitized Solar Cell........................................................................ 27 2.2 The Silicon Solar Cell..................................................................................... 29 2.3 Summary......................................................................................................... 30
3 Background ........................................................................................................... 31 3.1 Solar Irradiation .............................................................................................. 31 3.2 Characterization of Solar Cells ....................................................................... 33 3.3 Glass Transmittance........................................................................................ 37 3.4 Known Relations of Performance Dependency.............................................. 41 3.5 Summary......................................................................................................... 46
4 The test cells .......................................................................................................... 47 4.1 The DTI Dye-Sensitized Solar Cell ................................................................ 47 4.2 Reference cells used at DTI ............................................................................ 49 4.3 The Fraunhofer ISE Dye-Sensitized Solar Cell.............................................. 52 4.4 Reference modules used at Fraunhofer ISE.................................................... 54 4.5 Summary......................................................................................................... 56
5 Experimental work ............................................................................................... 57 5.1 Irradiance ........................................................................................................ 57 5.2 Cell Temperature ............................................................................................ 64
Table of Contents
10
5.3 Angle of Incidence ..........................................................................................77 5.4 Outdoor measurements....................................................................................90 5.5 Experimental determination of Glass Transmittance ....................................102 5.6 Comparison of results for the DSC-and Silicon Cells...................................107 5.7 Conclusion.....................................................................................................109
6 Suggestions for Further Studies.........................................................................111
7 Conclusion............................................................................................................113 7.1 Results ...........................................................................................................113 7.2 Perspectives ...................................................................................................114
Acknowledgements......................................................................................................115
References ....................................................................................................................117
A Method for calculating Angle of incidence............................................................121
B Calculation of VOC(G) expression...........................................................................123
C Results for temperature experiment under 0.1 Sun .............................................127
11
LIST OF FIGURES
Figure 1-1: Road-map for best Research-Cell Efficiencies [I 3]............................... 26
Figure 2-1: Illustration of DSC cell structure [I 4] .................................................... 27
Figure 2-2:Working principle of the DSC [I 6] .......................................................... 28
Figure 2-3 Display of the visual appearance of silicon cells..................................... 30
Figure 3-1: Annual averages of daily sum of global irradiation for south oriented surface, 0o [Wh/m2] .............................................................................. 32
Figure 3-2: Annual averages of daily sum of global irradiation for south oriented surface, 90o [Wh/m2] ............................................................................ 32
Figure 3-3: Definition of Incidence Angle................................................................... 33
Figure 3-4: The IV-curve, used to characterize solar cells [B 1].............................. 34
Figure 3-5: One-diode Model....................................................................................... 34
Figure 3-6: Refraction of light in glass [I 11]............................................................. 38
Figure 3-7: Refractive angle for float glass as function of AOI ................................ 40
Figure 3-8: Reflectance R for float glass as function of AOI .................................... 40
Figure 3-9: Transmittance T for float glass as function of AOI ............................... 41
Figure 3-10: Relative Efficiency as function or irradiance [A 7]............................. 43
Figure 3-11: Relative Efficiency for a DSC, CIGS and a-Si module[A 12]............. 44
Figure 3-12: Relative Conversion Efficiency as function of AOI for a DSC- and a silicon module[A 15]................................................................................. 45
Figure 3-13: Dependence of Irradiance on ISC, VOC and FF for a DSC[A 16].......................................................................................................................... 46
Figure 4-1: Production steps for manufacturing the DTI DSC cell......................... 48
Figure 4-2: The DTI DSC cell...................................................................................... 49
Figure 4-3: The DTI DSC master plate...................................................................... 49
Figure 4-4: IV-curve for DTI cells under 100 W/m2.................................................. 50
Figure 4-5: IV-curve for DTI cells under 1000 W/m2................................................ 50
Figure 4-6: Reference silicon cells: -from top to bottom: Si 1, Si 2, Si 3.................. 51
List of Figures
12
Figure 4-7: 30 cm x 30 cm Fr. ISE module [P 2]........................................................52
Figure 4-8: Production steps for the Fr. ISE DSC module [P 2] ..............................53
Figure 4-9: Fr. ISE DSC module..................................................................................53
Figure 4-10: Examples of different designs of Fr. ISE modules...............................54
Figure 4-11: IV-curves for ISE DSC modules under 1000 W/m2 .............................55
Figure 4-12: Front- and back side of a ISE DSC module..........................................55
Figure 4-13: The Shell module.....................................................................................56
Figure 5-1: Test setup with a DSC cell........................................................................58
Figure 5-2: Test setup – artificial light source............................................................58
Figure 5-3: Test setup with a DSC cell – backside with thermo couple...................58
Figure 5-4: Test setup with a Silicon cell.....................................................................58
Figure 5-5: Spectral distribution of Xenon lamp.......................................................59
Figure 5-6: ISC and relative ISC as function of irradiance G......................................60
Figure 5-7: VOC and relative VOC as function of irradiance G..................................61
Figure 5-8: FF and relative FF as function of irradiance G......................................61
Figure 5-9: Pmax and relative Pmax as function of irradiance G.................................62
Figure 5-10: ηηηη and relative ηηηη as function of irradiance G.........................................62
Figure 5-11: VOC as function of G: experimental results and fit to theoretical expression..........................................................................................64
Figure 5-12: Test set-up for variation of cell temperature .......................................65
Figure 5-13: ISC and relative ISC as function of cell temperature Tcell......................67
Figure 5-14: VOC and relative VOC as function of cell temperature Tcell ..................67
Figure 5-15: FF and relative FF as function of cell temperature Tcell ......................68
Figure 5-16:Pmax and relative Pmax as function of cell temperature Tcell ..................69
Figure 5-17: ηηηη and relative ηηηη as function of cell temperature Tcell............................69
Figure 5-18: IV-curve for DSC 1 & DSC 2 - 0.1 Sun.................................................70
Figure 5-19: IV-curve for DSC 1 & DSC 2 - 1 Sun....................................................70
Figure 5-20: Temperature coefficient for ISC..............................................................73
Figure 5-21: Temperature coefficient for VOC............................................................73
Figure 5-22: Temperature coefficient for FF..............................................................74
Figure 5-23: Temperature coefficient for Pmax ...........................................................74
Figure 5-24: Temperature coefficient for ηηηη.................................................................75
Figure 5-25:Outdoor test setup for AOI-investigation ..............................................78

List of Figures
13
Figure 5-26: ISC as function of AOI............................................................................. 79
Figure 5-27: VOC as function of AOI........................................................................... 80
Figure 5-28: Relative ISC as function of AOI.............................................................. 81
Figure 5-29: Relative ISC,DSC /Relative ISC,Si as function of AOI............................... 82
Figure 5-30: Schematic of indoor setup at Fraunhofer for measuring transmittance ....................................................................................................... 83
Figure 5-31: Spectral distribution of Xenon lamp, indoor AOI-setup .................... 84
Figure 5-32: Indoor AOI-setup at Fraunhofer ISE...................................................85
Figure 5-33: ISC and relative ISC as function of AOI ................................................. 86
Figure 5-34: VOC and relative VOC as function of AOI.............................................. 86
Figure 5-35: FF and relative FF as function of AOI................................................. 87
Figure 5-36: Pmax and relative Pmax as function of AOI............................................. 87
Figure 5-37: Outdoor test setup for measuring AOI-dependence of 3 DSC-modules and 1 mono-Si-module......................................................................... 90
Figure 5-38: 0o tilt: AOI as function of G before and after filter ing........................ 92
Figure 5-39: 45o tilt: AOI as function of G before and after filter ing...................... 92
Figure 5-40: 90o tilt: AOI as function of G before and after filter ing...................... 92
Figure 5-41: ISC as function of G - before and after filtering.................................... 93
Figure 5-42: VOC as function of G - before and after filtering.................................. 93
Figure 5-43: FF as function of G - before and after filtering .................................... 94
Figure 5-44: Pmax as function of G - before and after filtering................................. 94
Figure 5-45: ηηηη as function of G - before and after filtering....................................... 95
Figure 5-46: July 1st – Irradiance and Tmodule as function of local time................... 96
Figure 5-47: July 1st – Irradiance and incidence angle as function of local time ....................................................................................................................... 96
Figure 5-48: July 1st – Distribution of irradiance from solar tracker ...................... 97
Figure 5-49: July 1st - ISC and relative ISC as function of local time......................... 97
Figure 5-50: July 1st - G
ISC and relative G
ISC as function of local time........................ 98
Figure 5-51: July 1st - VOC and relative VOC as function of local time..................... 98
Figure 5-52: July 1st - FF and relative FF as function of local time......................... 99
Figure 5-53: July 1st - ηηηη and relative ηηηη as function of local time............................... 99
Figure 5-54: July 1st - Energy production per active area as function of local time ............................................................................................................ 100

List of Figures
14
Figure 5-55: Theoretical and measured transmittance T of glass without and with TCO as function of AOI ....................................................................103
Figure 5-56: Correction factor 1/T as function of AOI ............................................104
Figure 5-57: ISC and relative ISC as function of AOI – before and after correction ............................................................................................................105
Figure 5-58: July 1st - RelativeG
ISC as function of incidence angle..........................106

15
LIST OF TABLES
Table 4-1 Average performance parameters for the DTI DSC cells........................ 49
Table 4-2 Properties of test cells used at DTI............................................................. 51
Table 4-3 Performance parameters for the reference silicon cells........................... 51
Table 4-4 Performance parameters for the Fraunhofer ISE DSC cells................... 55
Table 5-1 Comparison of Theory and experimental results for silicon at 1000 W/m2 ............................................................................................................ 71
Table 5-2:Table of slopes from results for G at 100 W/m2 and 1000 W/m2 ............ 72
Table 5-3 Example of correction with temperature coefficient ................................ 76

17
LIST OF SYMBOLS & ABBREVIATIONS
Symbol Unit Definition
A [-] Absorbance
Aactive [m2] Active area of solar cell/module
Atotal [m2] Total area of solar cell/module
B [-] Variable used in determining Incidence Angle
c [V] Local Constant
∆Emax [J] Energy production under Max. Power Point Conditions
G [ 2mW ] Total Irradiance
Gdiffuse [ 2mW ] Diffuse Irradiance
Gdirect [ 2mW ] Direct Irradiance
Greflected [ 2mW ] Reflected Irradiance
I [A] Current
Io [A] Dark-Saturation Current
IL [A] Light Induced Current
Imax [A] Current at Pmax
ISC [A] Short-Circuit Current
ISC,0o [A] Short-Circuit Current at Incidence Angle 0o
ISC, θ [A] Short-Circuit Current at Incidence Angle θ
ISC corr, θ [A] Corrected Short-Circuit Current at Incidence Angle θ
k [ KJ ] Boltzmann’s Constant

List of Symbols & Abbreviations
18
K [-] Local Constant
lm [o] Longitude of Time Meridian
lst [o] Longitude
n [-] Ideality Constant / Day Number
ni [-] Refractive Index for Incident Media
nt [-] Refractive Index for Refractive Media
P [W] Power
Pmax [Wp] Maximum Power Output
Pmax, θ [Wp] Maximum Power Output at Incidence Angle θ
Pmax, cosine [Wp] Maximum Power Output related to cos(θ)
q [-] Absolute Value of Electronic Charge
R [-] / [Ω] Reflectance / Resistance
Rp [-] p-polarized Component of Total Reflectance
Rs [-] s-polarized Component of Total Reflectance
∆t [s] Time interval
T [-] / [K] Transmittance / Absolute Temperature
Tcell [oC] Cell Temperature
Tcell, STC [oC] Cell Temperature under Standard Test Conditions (25oC)
Tj [-] Equation of Time
Ts [-] True Solar Time
Tz [-] Local Time
Ttheoretical [-] Theoretical Transmittance for Float Glass
Tpilk,TCO,UV [-] Measured Transmittance for Pilkington Glass with TCO and UV-filter
Tθ [-] Transmittance at Incidence Angle θ
V [V] Voltage
Vmax [V] Voltage at Pmax
VOC [V] Open-Circuit Voltage
List of Symbols & Abbreviations
19
Greek Symbol Unit Definition
α [C
1o ] Temperature Coefficient
αs [o] Solar Height
αη [C
%o ] Temperature Coefficient for Conversion Efficiency
β [o] Tilt of Plane
δ [o] Declination
γ [o] Azimuth of Plane
η [-] / [%] Conversion Efficiency
ηactive [-] / [%] Conversion Efficiency for Active Area
ηSTC [-] / [%] Conversion Efficiency measured under Standard Test Conditions
ηtotal [-] / [%] Conversion Efficiency for Total Area
ϕ [o] Latitude of Place
ω [-] Hour Angle
θ [o] Incidence Angle
θcorr [o] Corrected Incidence Angle
θi [o] Incident Angle
θt [o] Refractive Angle
θz [o] Zenith

List of Symbols & Abbreviations
20
Abbreviation Unit Definition
AOI [o] Angle of Incidence
CIGS [-] Copper Indium Gallium Selenide
DSC [-] Dye-Sensitized Solar Cell
FF [-] / [%] Fill Factor
PV [-] Photo Voltaic
TCO [-] Transparent Conductor
Si [-] Silicon
STC [-] Standard Test Conditions
1 Sun [-] Refers to irradiance of 1000 W/m2

21
1 PREFACE
As the world develops rapidly, the energy demand follows. An increasing energy demand and the consequence of this increasing energy consumption is seen in climate changes all over the world as a reaction to the global warning due to the CO2-emission and pollution. The resources of fossil fuels (oil, coal, gas) are not unlimited, and with the expected energy consumption for the future, these supplies will be emptied within the next generations. Therefore it is already now necessary to supplement and replace the fossil fuels with renewable energy sources. Nuclear power, wind and hydro energy are already strong players, but also solar energy is increasing. Especially the photovoltaic cells (PV) are of interest, as they convert solar energy to electricity which is a primary energy source. The sun is an abundant source of energy, which in one hour actually provides Earth with as much energy as used annually by civilization today [A 1]. Further this energy is very clean with no CO2-emission. The majority of solar cells used today are made from crystalline silicon, and they amount for more than 90% of installed PVs today [I 1]. This technology is well established and the installed modules usually have an energy conversion efficiency of 15% [B 2], but this is continuously improved. The price and production time for silicon is high and therefore new alternatives to the silicon cell are sought. The dye-sensitized solar cell (DSC) was invented by Michael Grätzel and co-workers in the early 90s [A 2], and is known as a third generation solar cell. This type of solar cell differs greatly from the conventional silicon solar cell, as no silicon is needed in the manufacturing. The working principle of the DSC is like the plant photosynthesis, where a dye converts the solar energy to electricity. Cost/Production prices are expected to be very favorable as there are possibilities to make the production very effective without high-tech facilities needed. The DSC is presently still in the research stage as problems with long-term stability, encapsulation and degradation of chemical components are limiting the cell from commercialization. The research is performed in the lab where the scale is still mainly on

Preface
22
cell-level, but work is focused on up scaling to modules. Due to the problems mentioned long-term outdoor testing has only been seen for one study of outdoor exposure of a DSC for 2.5 years [A 3]. Due to these problems commercial companies have difficulties in promising stability of the modules. Further a definition of the DSC certification is needed before the DSC can be commercialized in wide-range. Presently only one company, G24i1 with a commercial DSC, is known of. The highest efficiency reported for a DSC produced in the laboratory is 11.1% reported by Sharp [A 4], but compared to other technologies it will be able to compete in price, aesthetics and possibilities to customize the modules and cleanliness of production. The price for a commercial DSC is estimated to be less than 1 USD/Wp
[P 1] in the future. In comparison, the current retail price for silicon modules is assumed to be 4.60 USD/Wp [I 2].
1.1 Problem Formulation As the technology of the DSC differs greatly from the conventional silicon cell the electrical behavior of the DSC when subjected to changing climate parameters will also differ from that of the silicon cell.
Presently the DSC is tested under the same conditions as all other solar cells, and from this standard test the conversion efficiency and yearly performance is estimated. The standard test conditions correspond to testing of the solar cell performed at 1 Sun (illumination of 1000 W/m2), spectral energy distribution equal to air mass AM 1.5 and a cell temperature of 25oC. Under realistic operation of the solar cells, the conditions will differ greatly from the standard test conditions, with lower irradiance, higher cell temperature and deviation in incidence angle. The benefit for the DSC lies within the chemical structure, which provides a huge light-harvesting volume compared to other solar cell technologies. The DSC is therefore thought to benefit from oblique incidence angles of irradiation as the path for the light photon is increased for increased incidence angles. Due to the assumed difference in performance dependency of the DSC and silicon cell with respect to Angle of Incidence AOI, irradiance intensity G, and cell temperature Tcell, it is expected that the DSC show higher performance than estimated with today’s standard test which does not represent realistic outdoor conditions.
1 www.g24i.com
Preface
23
This project will deal with the following issues:
• What correlations between cell performance and respectively Tcell, G and AOI are already known? - and do they correspond to experimental data?
• How can the performance comparison between the DSC and silicon cell be performed practically?
• Which parameters influence cell performance the most? The aim of the project will be:
Development of well-designed experiments and a subsequent analysis of the experimental results in order to gain understanding of the difference in performance characteristics for the DSC and silicon cell. The performance characteristics are defined by various weather conditions, with the parameters: Irradiance G, Cell Temperature Tcell and Incidence Angle AOI as investigation parameters.
1.2 Method & Limitation The basis for a comparison between the actual performance of the DSC cell and a conventional silicon solar cell is established by performing side-by side tests of a DSC- and a silicon solar cell. On basis of outdoor testing of a DSC- and a silicon module over a prolonged period and measurements of the DSC and the silicon cell under idealized and controlled conditions in the lab, it will be possible to compare cell performance of the two technologies. The work during this project will be strongly based on experimental data to substantiate already known correlations for electrical performance [B 1], [B 2] and to gain an understanding of the performance dependency of the parameters of interest. A literature survey has been carried out in order to obtain an understanding of these known performance-dependent relations. Text books and scientific articles have created the basis for this survey. As the work has been experimental, it has been time-consuming to think of, develop and create the different test setups needed. Further the amount of outdoor measurements has been limited by weather conditions and the duration of the project. Focus of this study has been to gain an overall understanding of the electrical behaviour of the DSC with respect to cell temperature, incident irradiance intensity and incidence
Preface
24
angle. Therefore the complexities of the chemical reactions are not accounted for in detail. A wide range of both internal and external parameters will have influence on the performance of the DSC such as chemical reactions and the qualities of light, environment etc. and the interaction of parameters. Due to the limitation of this Master’s thesis with respect to time and realistic view on what will be possible within this time period, only external factors which influence the performance of the DSC will be investigated. But also these factors have been limited to only include cell temperature, irradiance and angle of incidence. Humidity, ventilation and the spectral distribution of the irradiance are also extremely important parameters in the understanding of the performance of the DSC, but will not in this work be investigated.
1.3 Guide on how to read the report The report is the result of a work process which consists of literature study, experimental work and data analysis. The structure of the report will be accounted for in order to explain the underlying thoughts for the setup of the report. The report consists of 7 chapters, where the content will be shortly described. Further the report contains 3 appendixes. Ch. 1 is the preface where the background and necessity for the performed work is accounted for. The problem formulation, work methods and choices made for limiting and specifying the project are defined. Ch. 2 provides an introduction to the solar cells investigated. The structure and working principle of DSC is described. The silicon cell is introduced by an explanation of the different types. Ch. 3 sets the theoretical background for the investigations carried out. A definition of solar irradiation, transmittance and reflectance is given. Further the methods for characterizing a solar cell and relations used for modelling electrical behaviour of the solar cells is provided, as well as performance relations and studies found for the specific cell types investigated. Only the theory which has relevance for the work carried out has been included in this chapter. Ch. 4 introduces the test cells and modules used in the experimental work. The production steps of the DSCs are described as well as the electrical characteristics for both the reference silicon- and DSC cells/modules.
Preface
25
Ch. 5 concerns the experimental work carried out with respect to performance dependency for the parameters: Irradiance intensity, cell temperature and Incidence angle. A review of the tests and results is given for all experiments. A comparison of results and overall tendencies in electrical behaviour observed for the DSC and silicon cells is performed. The results from the outdoor tests are used to verify if the effects seen in the lab are also visible when the cells are tested under realistic operating conditions. Ch. 6 is based on the results achieved in the experimental work, where suggestions for further research areas are posed. Ch. 7 is the conclusion of the work carried out and is linked to the problem formulation for the thesis.
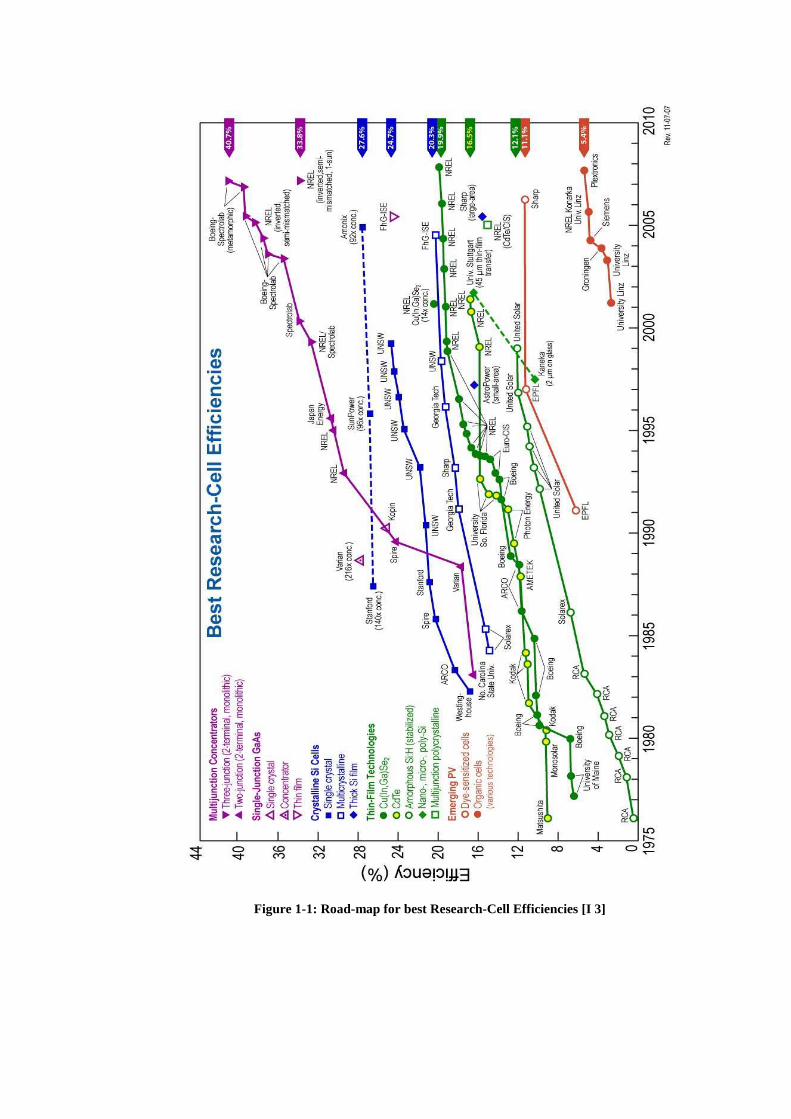
Figure 1-1: Road-map for best Research-Cell Efficiencies [I 3]
2 INTRODUCTION
In order to present the technologies used in this thesis, an introduction to the dye-sensitized solar cell and the types of silicon cells will be given. An overview of the different types of solar cells, as well as the highest achieved in-lab efficiencies reached is shown in the solar cell roadmap, Figure 1-1.
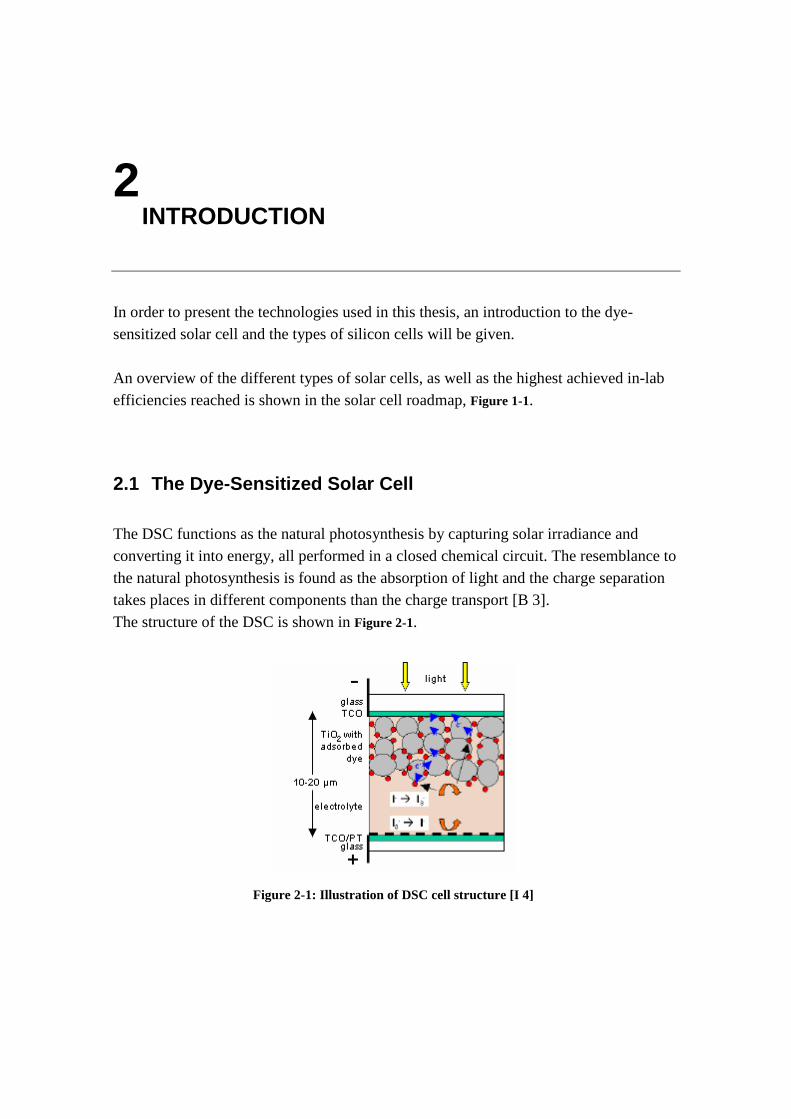
2.1 The Dye-Sensitized Solar Cell The DSC functions as the natural photosynthesis by capturing solar irradiance and converting it into energy, all performed in a closed chemical circuit. The resemblance to the natural photosynthesis is found as the absorption of light and the charge separation takes places in different components than the charge transport [B 3]. The structure of the DSC is shown in Figure 2-1.
Figure 2-1: Illustration of DSC cell structure [I 4]
Introduction
28
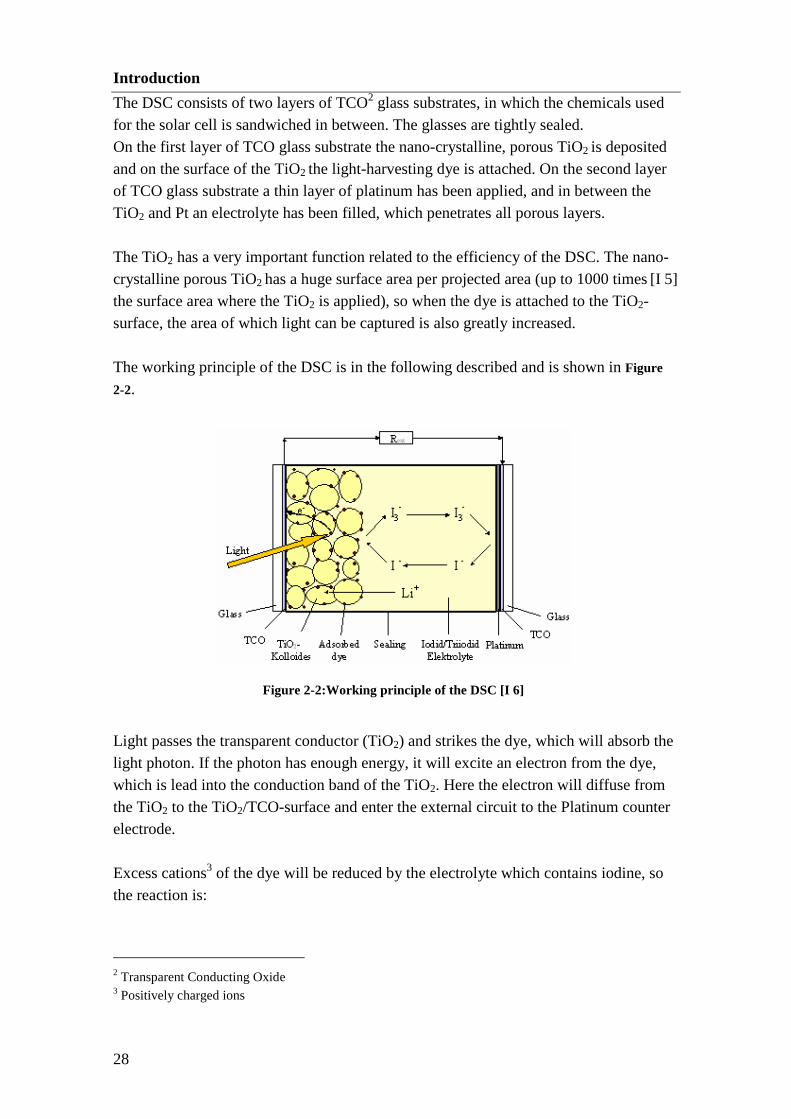
The DSC consists of two layers of TCO2 glass substrates, in which the chemicals used for the solar cell is sandwiched in between. The glasses are tightly sealed. On the first layer of TCO glass substrate the nano-crystalline, porous TiO2 is deposited and on the surface of the TiO2 the light-harvesting dye is attached. On the second layer of TCO glass substrate a thin layer of platinum has been applied, and in between the TiO2 and Pt an electrolyte has been filled, which penetrates all porous layers. The TiO2 has a very important function related to the efficiency of the DSC. The nano-crystalline porous TiO2 has a huge surface area per projected area (up to 1000 times [I 5] the surface area where the TiO2 is applied), so when the dye is attached to the TiO2-surface, the area of which light can be captured is also greatly increased. The working principle of the DSC is in the following described and is shown in Figure
2-2.
Figure 2-2:Working principle of the DSC [I 6]
Light passes the transparent conductor (TiO2) and strikes the dye, which will absorb the light photon. If the photon has enough energy, it will excite an electron from the dye, which is lead into the conduction band of the TiO2. Here the electron will diffuse from the TiO2 to the TiO2/TCO-surface and enter the external circuit to the Platinum counter electrode. Excess cations3 of the dye will be reduced by the electrolyte which contains iodine, so the reaction is:
2 Transparent Conducting Oxide 3 Positively charged ions
Introduction
29
−−− +→ eII 23 3
The generated −3I will diffuse to the Pt-electrode, where it will be reduced back to I-
from electrons introduced from the external circuit. Hereby the circuit is completed. The DSC suffers from losses due to the chemical build-up of the cell. These losses are defined as losses due to the chemical properties with diffusion limitation and recombination as well as charge transfer problems, caused by the distance from the conductor to the conductor bands, which leads to the external circuit [B 4]. The size of the losses is function of cell temperature and irradiance. They are important for the cell performance, but are not investigated further, as it is outside the scope of this thesis.
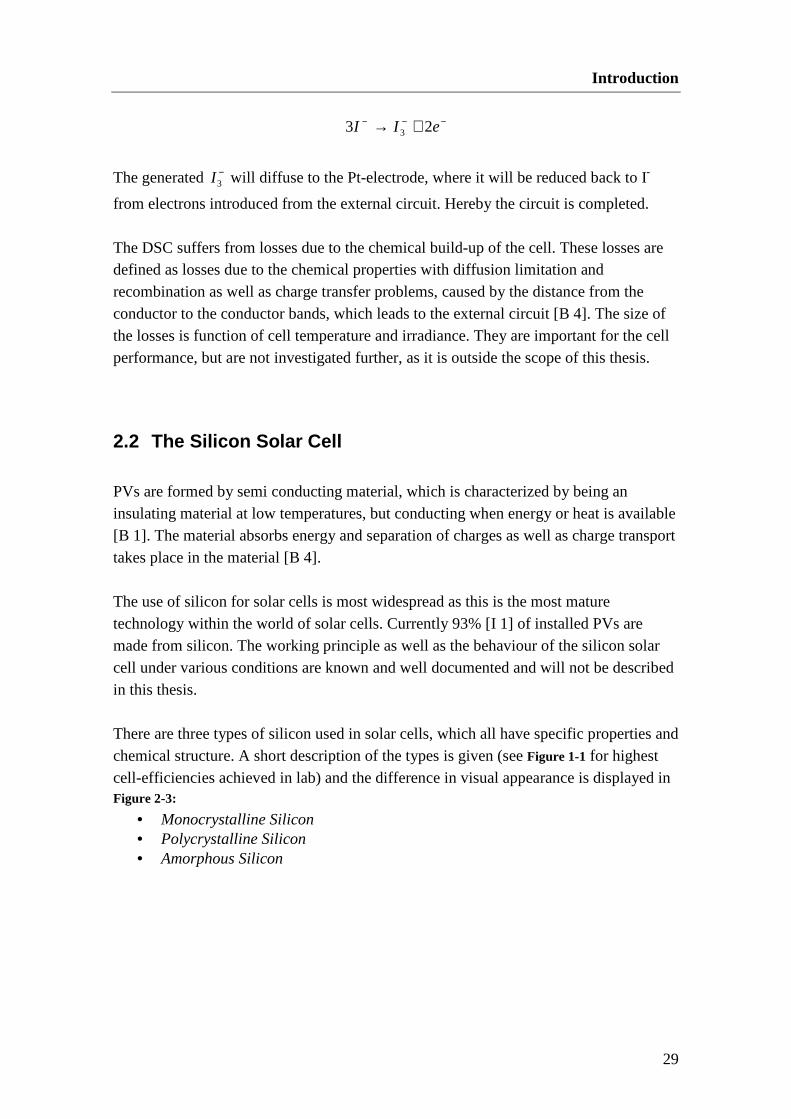
2.2 The Silicon Solar Cell PVs are formed by semi conducting material, which is characterized by being an insulating material at low temperatures, but conducting when energy or heat is available [B 1]. The material absorbs energy and separation of charges as well as charge transport takes place in the material [B 4]. The use of silicon for solar cells is most widespread as this is the most mature technology within the world of solar cells. Currently 93% [I 1] of installed PVs are made from silicon. The working principle as well as the behaviour of the silicon solar cell under various conditions are known and well documented and will not be described in this thesis. There are three types of silicon used in solar cells, which all have specific properties and chemical structure. A short description of the types is given (see Figure 1-1 for highest cell-efficiencies achieved in lab) and the difference in visual appearance is displayed in Figure 2-3:
• Monocrystalline Silicon • Polycrystalline Silicon • Amorphous Silicon

Introduction
30
a) Monocrystalline silicon solar cell [I 7]
b) Polycrystalline silicon solar cell [I 8]
c) Amorphous silicon solar cell [I 9]
Figure 2-3 Display of the visual appearance of silicon cells
The monocrystalline silicon, Figure 2-3 a) is the most expensive type of silicon, due to the ordered crystal structure which is obtained by a very slow growth of crystals. The uniformity of the crystal structures makes this the type of silicon which has the most uniform and predictable behaviour of cells from the same wafer [B 1]. The polycrystalline silicon, Figure 2-3 b) has a different structure and can be grown faster, but due to the crystalline structure the efficiency will be lower than that of monocrystalline silicon. Many crystals are formed within the structure and the orientation of the crystals is random. The crystals meet in a ‘grain boundary’ and these boundaries reduce the efficiency of silicon as conducting material. The structure of amorphous silicon, Figure 2-3 c) is random and there is no long-range order in structural arrangement of the atoms. Some of the atoms have dangling bonds4, resulting in undesired electrical behaviour. Only a very thin layer of silicon is required, approx. 1/100 of the thickness of mono-or polycrystalline cells, due to the production process where the silicon can be deposited on large areas by chemical vapour deposition. The disadvantages are lower performance and shorter lifetime, which has not been fully proven by long-term tests. Only the mono- and polycrystalline silicon cells have been used for comparison to the DSC in this thesis.
2.3 Summary An introduction to the dye-sensitized solar cell with respect to fundamental build-up as well as the working principle has been accounted for. Further the different types of silicon solar cells have been briefly accounted for.
4 A dangling bond is a broken covalent bond.

3 BACKGROUND
This section will provide definitions and background for the experimental work. A definition of solar irradiance is given as this is the essential part of a working solar cell. Further the method used for characterizing solar cells is described with a definition of the standard test conditions. The transmittance of glass holds importance for the functioning of the solar cell, so a theoretical determination of glass transmittance will be provided. Results from experimental work and studies providing theory and possible relations about performance dependency with respect to irradiance intensity, cell temperature and incidence angle that can be compared to the experimental results obtained in this thesis, is provided.
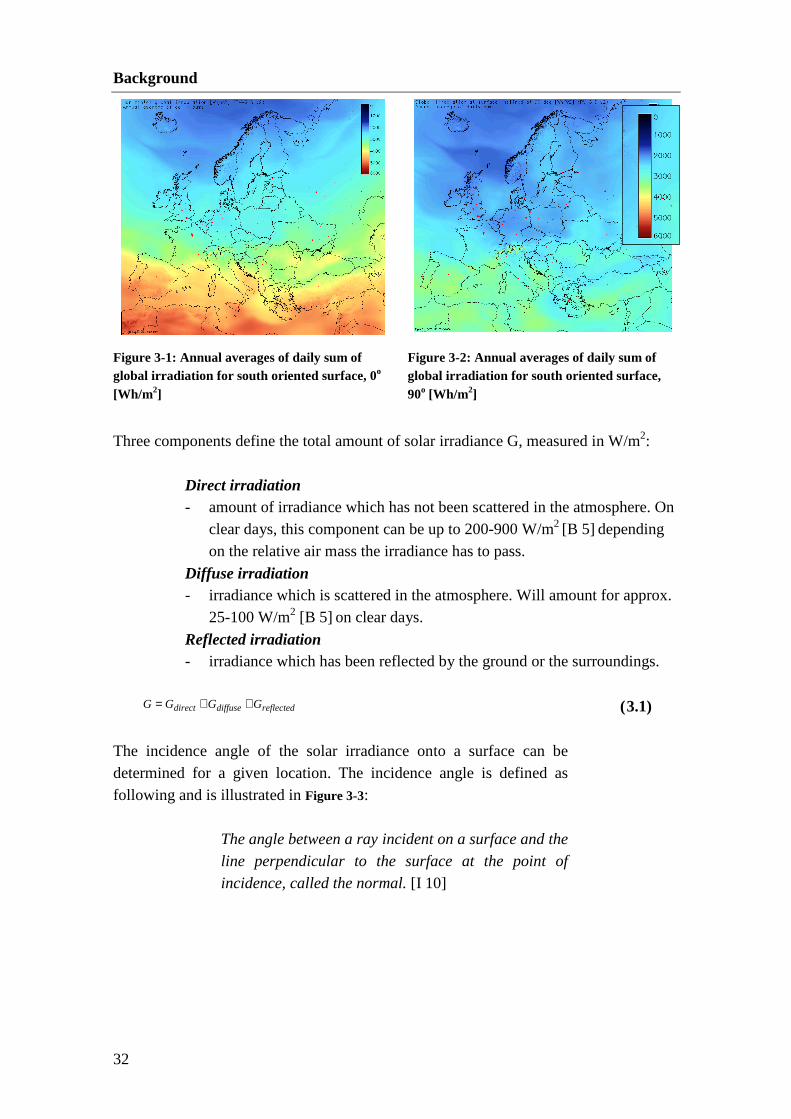
3.1 Solar Irradiation The energy from the sun in the form of photon energy is used by solar cells to generate electricity. The solar irradiation has a broad energy spectrum which is distributed into wavelengths. The irradiance as well as spectral distribution of the light depends on the distance the light has to travel through the atmosphere. The amount of solar irradiance available as well as the intensity will depend on the position of the sun. The irradiance in a plane therefore depends on orientation, tilt and location. This is illustrated for Europe in respectively Figure 3-1 and Figure 3-2, showing the averaged daily sum of irradiation on a horizontal and vertical south faced plane [A 5].
Background
32
Figure 3-1: Annual averages of daily sum of global irradiation for south oriented surface, 0o [Wh/m2]
Figure 3-2: Annual averages of daily sum of global irradiation for south oriented surface, 90o [Wh/m2]
Three components define the total amount of solar irradiance G, measured in W/m2:
Direct irradiation - amount of irradiance which has not been scattered in the atmosphere. On
clear days, this component can be up to 200-900 W/m2 [B 5] depending on the relative air mass the irradiance has to pass.
Diffuse irradiation - irradiance which is scattered in the atmosphere. Will amount for approx.
25-100 W/m2 [B 5] on clear days.
Reflected irradiation - irradiance which has been reflected by the ground or the surroundings.
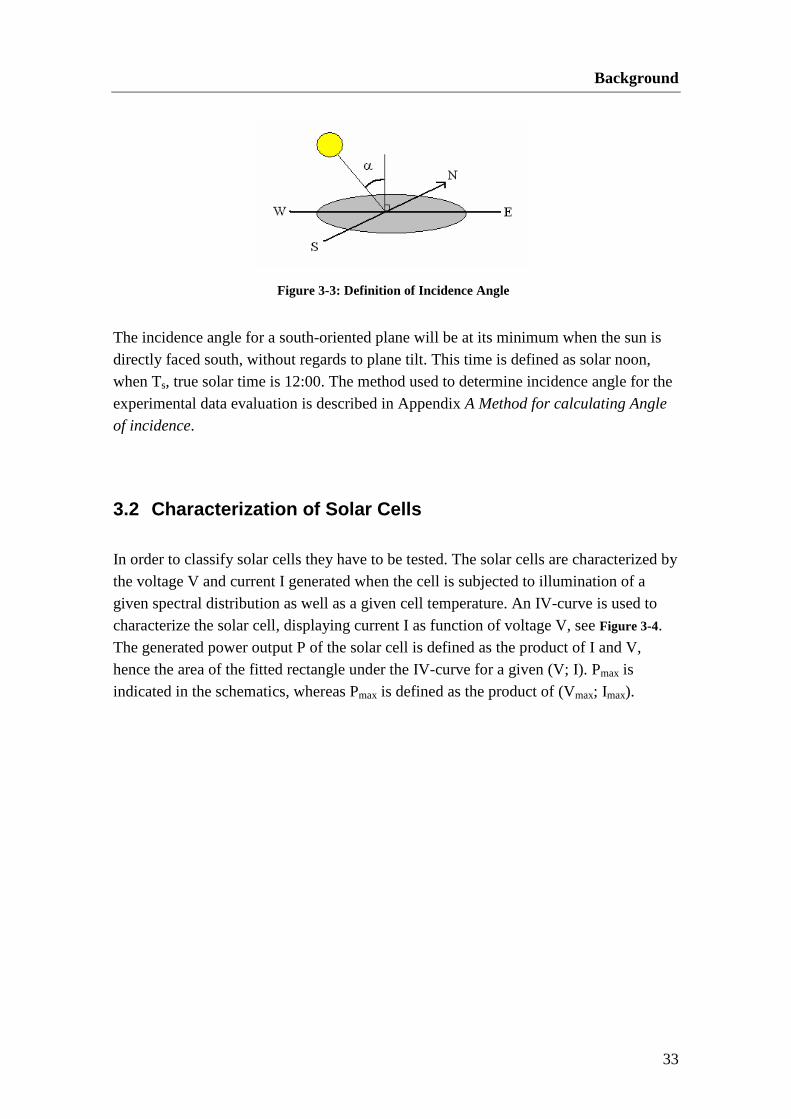
reflecteddiffusedirect GGGG ++= ( 3.1) The incidence angle of the solar irradiance onto a surface can be determined for a given location. The incidence angle is defined as following and is illustrated in Figure 3-3:
The angle between a ray incident on a surface and the
line perpendicular to the surface at the point of
incidence, called the normal. [I 10]
Background
33
Figure 3-3: Definition of Incidence Angle
The incidence angle for a south-oriented plane will be at its minimum when the sun is directly faced south, without regards to plane tilt. This time is defined as solar noon, when Ts, true solar time is 12:00. The method used to determine incidence angle for the experimental data evaluation is described in Appendix A Method for calculating Angle
of incidence.
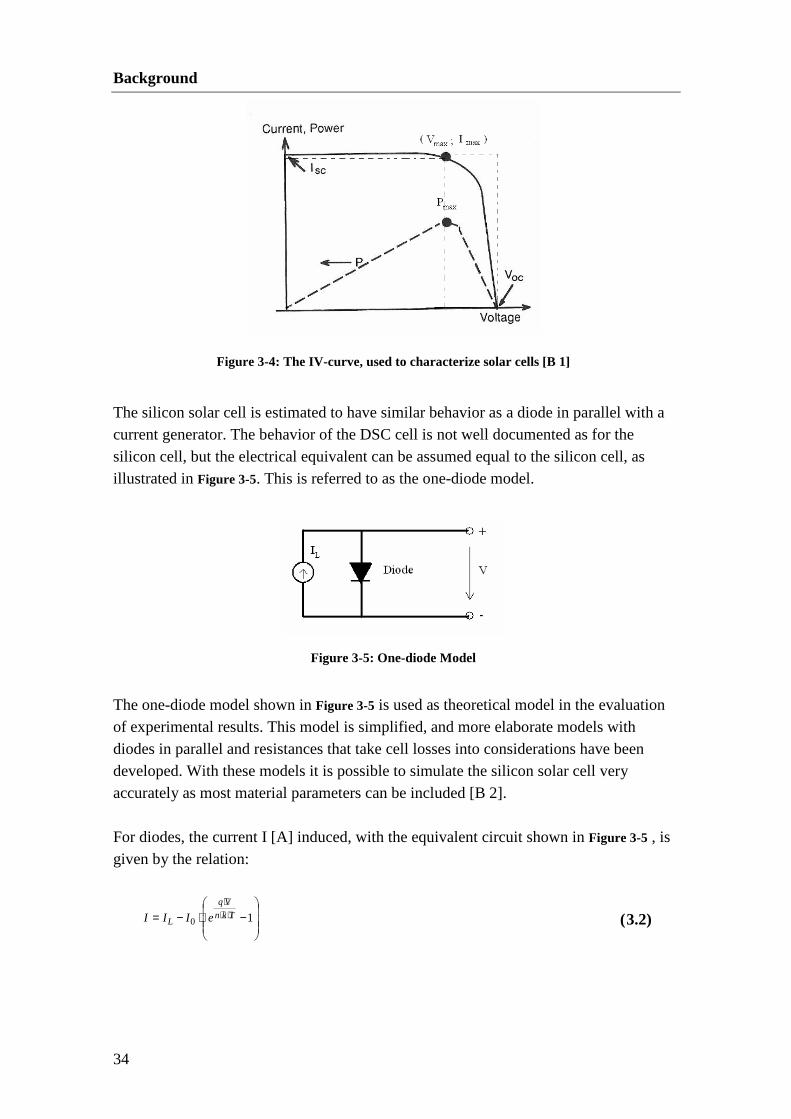
3.2 Characterization of Solar Cells In order to classify solar cells they have to be tested. The solar cells are characterized by the voltage V and current I generated when the cell is subjected to illumination of a given spectral distribution as well as a given cell temperature. An IV-curve is used to characterize the solar cell, displaying current I as function of voltage V, see Figure 3-4. The generated power output P of the solar cell is defined as the product of I and V, hence the area of the fitted rectangle under the IV-curve for a given (V; I). Pmax is indicated in the schematics, whereas Pmax is defined as the product of (Vmax; Imax).
Background
34
Figure 3-4: The IV-curve, used to characterize solar cells [B 1]
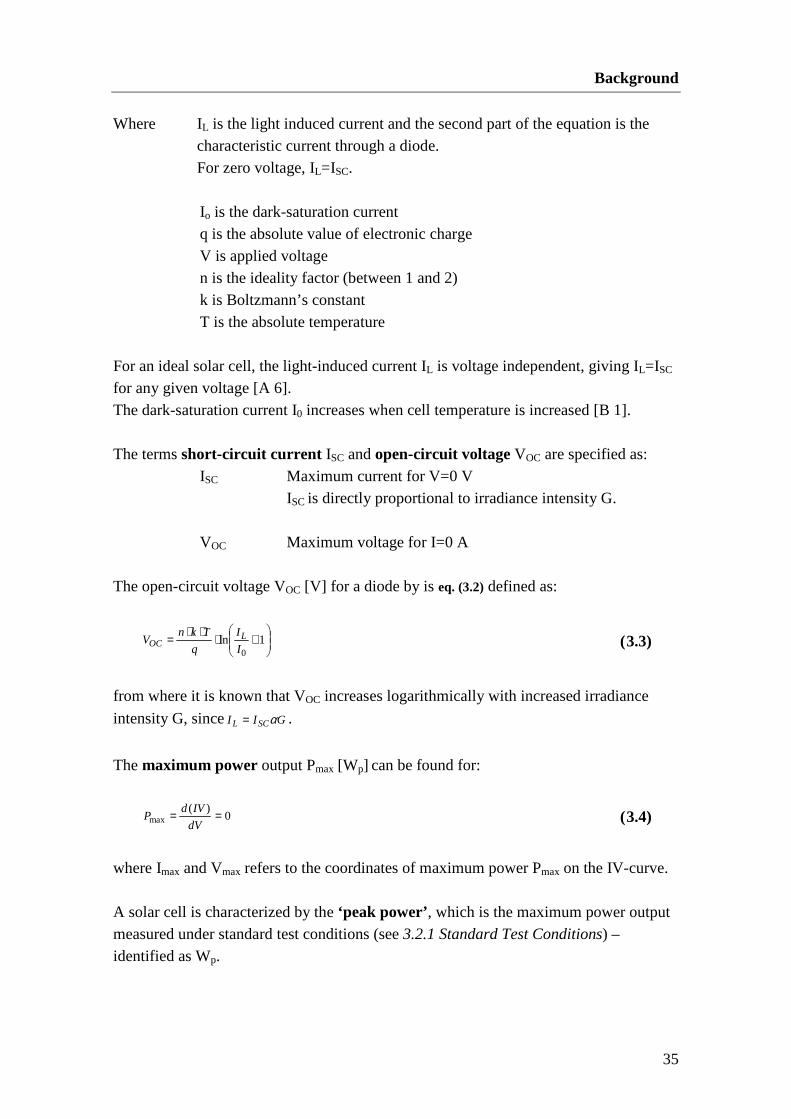
The silicon solar cell is estimated to have similar behavior as a diode in parallel with a current generator. The behavior of the DSC cell is not well documented as for the silicon cell, but the electrical equivalent can be assumed equal to the silicon cell, as illustrated in Figure 3-5. This is referred to as the one-diode model.
Figure 3-5: One-diode Model
The one-diode model shown in Figure 3-5 is used as theoretical model in the evaluation of experimental results. This model is simplified, and more elaborate models with diodes in parallel and resistances that take cell losses into considerations have been developed. With these models it is possible to simulate the silicon solar cell very accurately as most material parameters can be included [B 2]. For diodes, the current I [A] induced, with the equivalent circuit shown in Figure 3-5 , is given by the relation:
−⋅−= ⋅⋅
⋅
10Tkn
Vq
L eIII ( 3.2)
Background
35
Where IL is the light induced current and the second part of the equation is the characteristic current through a diode. For zero voltage, IL=ISC. Io is the dark-saturation current q is the absolute value of electronic charge V is applied voltage n is the ideality factor (between 1 and 2) k is Boltzmann’s constant T is the absolute temperature
For an ideal solar cell, the light-induced current IL is voltage independent, giving IL=ISC for any given voltage [A 6]. The dark-saturation current I0 increases when cell temperature is increased [B 1]. The terms short-circuit current ISC and open-circuit voltage VOC are specified as: ISC Maximum current for V=0 V ISC is directly proportional to irradiance intensity G. VOC Maximum voltage for I=0 A The open-circuit voltage VOC [V] for a diode by is eq. (3.2) defined as:
+⋅⋅⋅= 1ln
0I
I
q
TknV L
OC ( 3.3)
from where it is known that VOC increases logarithmically with increased irradiance
intensity G, since GII SCL α= .
The maximum power output Pmax [Wp] can be found for:
0)(
max ==dV
IVdP ( 3.4)
where Imax and Vmax refers to the coordinates of maximum power Pmax on the IV-curve.
A solar cell is characterized by the ‘peak power’, which is the maximum power output measured under standard test conditions (see 3.2.1 Standard Test Conditions) – identified as Wp.
Background
36
Another parameter utilized to specify the quality of the solar cell is the Fill Factor which relates to the IV-curve. The Fill Factor FF is a measure of how well the IV-curve
iterates the rectangle with area OCSC VI ⋅ , and should ideally be 1, see Figure 3-4 for
illustration of the rectangles for (Vmax; Imax) and (VOC;ISC). The Fill Factor, FF, [-] is calculated by:
OCSC VI
VIFF
⋅⋅
= maxmax ( 3.5)
The conversion efficiency of a solar cell defines how much of the irradiance is converted into electrical energy by the solar cell and therefore gives a measure of how efficient the solar cell functions.
The conversion efficiency η [%] is determined by:
100100 max ⋅⋅
=⋅⋅
⋅⋅=
activeactive
OCSC
AG
P
AG
FFVIη ( 3.6)
Where G is irradiance in the plane [W/m2] Aactive is active area of the solar cell [m2]
3.2.1 Standard Test Conditions
The performance of solar cells is evaluated under Standard Test Conditions (STC), referring to:
• Cell temperature of 25oC
• Irradiance in the plane of 1000 W/m2
• Spectral energy distribution according to the standard spectrum of Air Mass (AM) 1.5.
These conditions are also termed 1 Sun. The result of this test gives the electrical output and performance of the solar cell under these specific conditions and is generally used to compare different solar cell types and technologies. As the performance of solar cells are dependent on parameters such as cell temperature, irradiance intensity, spectral distribution and incidence angle of the light source it is possible that the solar cell works better under other conditions. The STC conditions correspond to an irradiation level of a clear sunny day, the module temperature of a clear winter day and the spectrum of a clear spring day [A 7].

Background
37
Therefore the test of solar cells under STC will not provide a realistic view on how much power output can be expected when working under realistic conditions [A 8].
3.2.2 Influence of Angle of Incidence
The incidence angle of the incoming irradiance on a solar cell will influence the power output. When regarding the power output Pmax this will be at its maximum when the irradiation is perpendicular to the plane as the illuminated area of the solar cell is
proportional to cosine to incidence angle, θ, defined in section 3.1 Solar Irradiation.
For the incidence angle, θ, the irradiance impinging the surface G(θ) is defined by the cosine law [A 9]:
( ) θθθ cos)0( ⋅== oGG ( 3.7)
3.3 Glass Transmittance As the solar cells are usually laminated when exposed outdoor, the properties of the top laminate is of importance to the angular performance dependence. The reflectance is dependent on incidence angle and the properties of materials used. Glass is the most common top laminate, and the reflectance of this material is increasing for increasing incidence angles. This results in less irradiance reaching the active solar cell at high incidence angles, than the irradiance estimated by the cosine law. The following relation for transmittance, absorbance and reflectance is given, eq. (3.8): ART ++=1 ( 3.8)
T Transmittance R Reflectance A Absorbance
3.3.1 Determination of reflectance and transmittanc e
The reflectance R between two media can be calculated when the refractive indices of the media, ni and nt are known.
Background
38
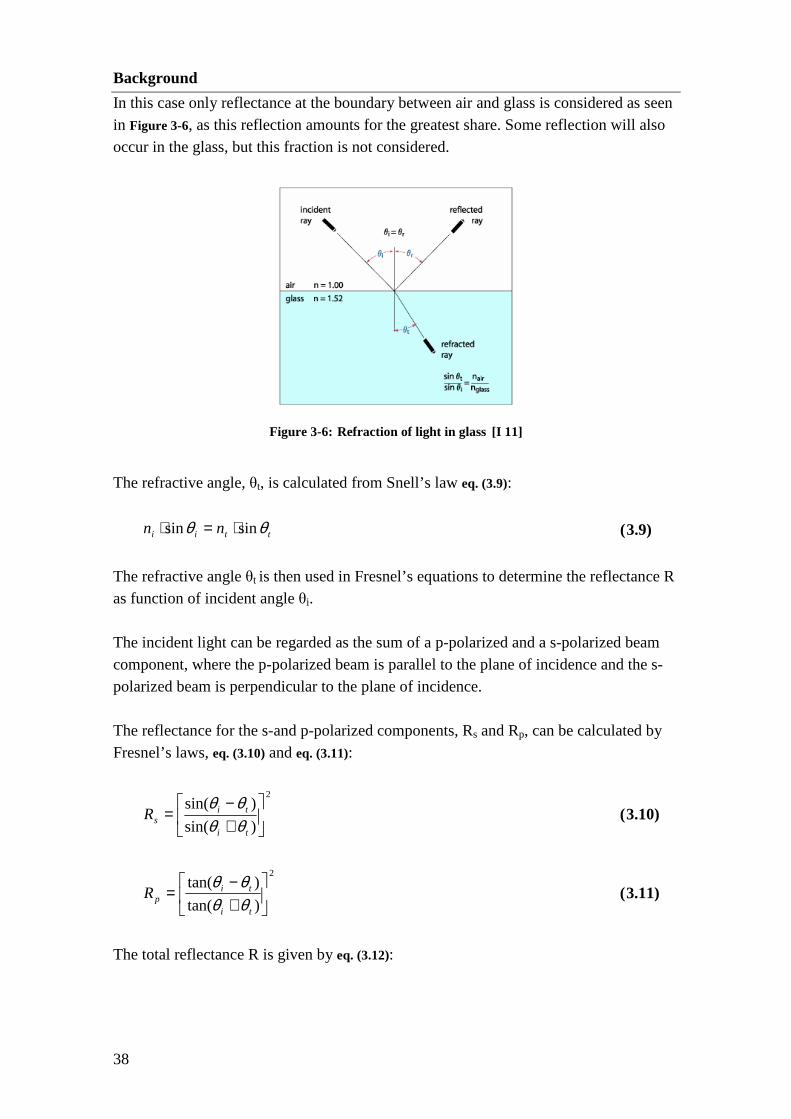
In this case only reflectance at the boundary between air and glass is considered as seen in Figure 3-6, as this reflection amounts for the greatest share. Some reflection will also occur in the glass, but this fraction is not considered.
Figure 3-6: Refraction of light in glass [I 11]
The refractive angle, θt, is calculated from Snell’s law eq. (3.9):
ttii nn θθ sinsin ⋅=⋅ ( 3.9)
The refractive angle θt is then used in Fresnel’s equations to determine the reflectance R as function of incident angle θi. The incident light can be regarded as the sum of a p-polarized and a s-polarized beam component, where the p-polarized beam is parallel to the plane of incidence and the s-polarized beam is perpendicular to the plane of incidence. The reflectance for the s-and p-polarized components, Rs and Rp, can be calculated by Fresnel’s laws, eq. (3.10) and eq. (3.11):
2
)sin(
)sin(
+−
=ti
tisR
θθθθ
( 3.10)
2
)tan(
)tan(
+−
=ti
tipR
θθθθ
( 3.11)
The total reflectance R is given by eq. (3.12):

Background
39
2
ps RRR
+= ( 3.12)
As the reflectance has been determined, the transmittance as function of AOI is given by eq. (3.8) as absorbance is neglected, resulting in eq. (3.13): RT −= 1 ( 3.13)
3.3.2 Theoretical transmittance of float glass
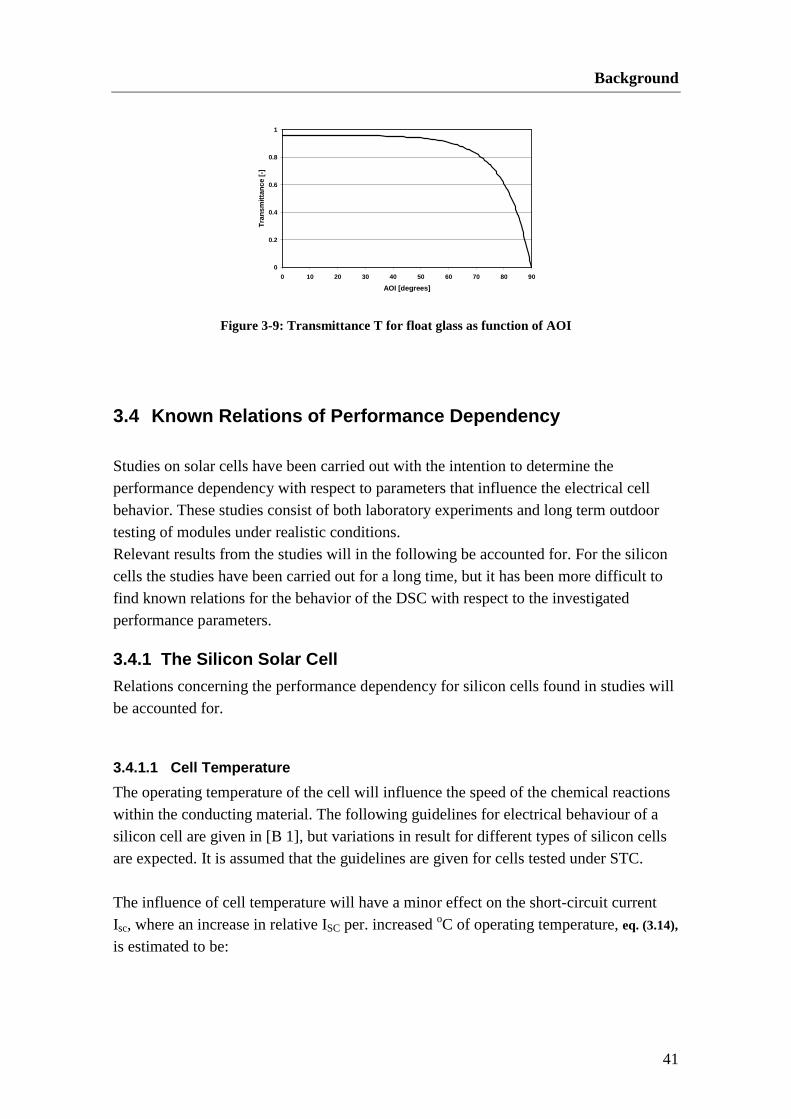
An understanding of light transmittance through the glass as function of incidence angle is desired. At high incidence angles the glass leads to a deduction of light in the cell which means that less light will be available for the chemical processes in the solar cell to take place. This means that the actual light intensity for high incidence angles is lower than what is assumed with the cosine relation and this will influence the output of the cell, which theoretically will be overestimated [A 10]. The glass used to laminate the DSC is coated with a TCO on the inner side where increased absorption and reflection within this layer can occur in comparison to normal float glass. The absorbance A of the TCO and the glass will not be regarded in the following as the reflection in the boundary between air and glass is assumed to be dominant. Based on the previous theoretical section, the transmittance for a standard float glass will be determined. The refractive indices are set to:
air: ni=1 float glass: nt=1.523.
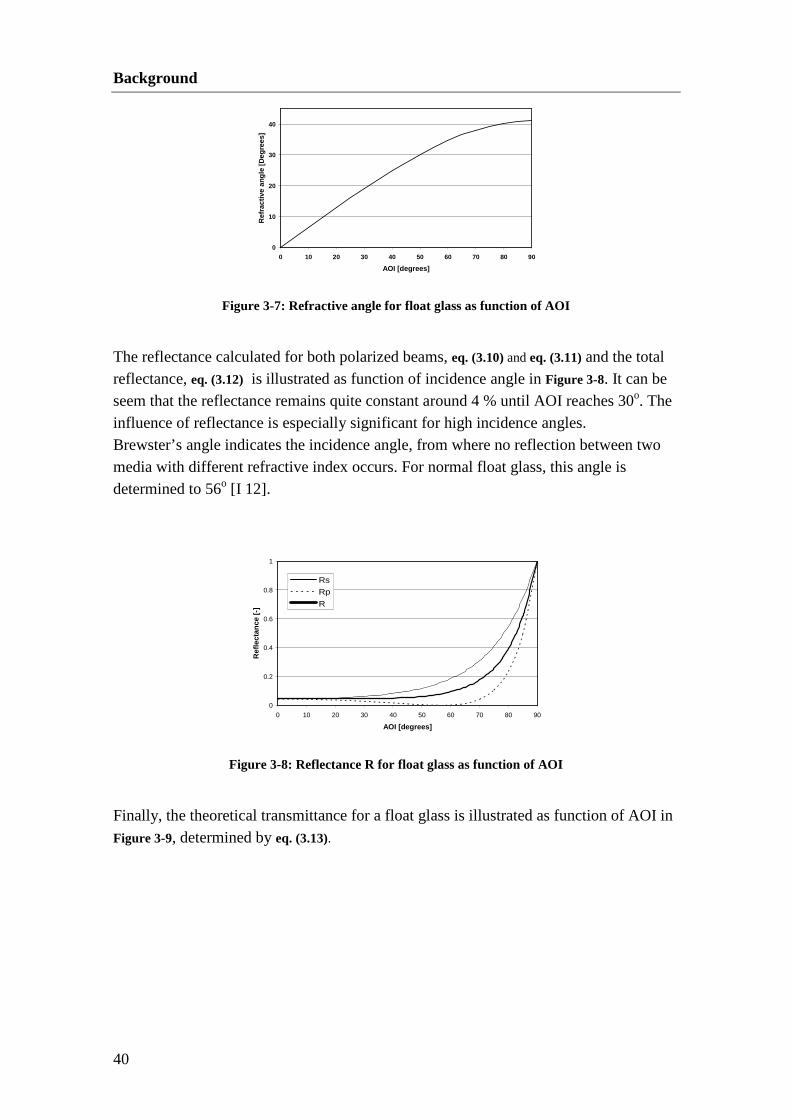
The refractive angle as function of incidence angle AOI as determined from eq. ( 3.9), is shown in Figure 3-7.
Background
40
0
10
20
30
40
0 10 20 30 40 50 60 70 80 90
AOI [degrees]R
efra
ctiv
e an
gle
[Deg
rees
]
Figure 3-7: Refractive angle for float glass as function of AOI
The reflectance calculated for both polarized beams, eq. (3.10) and eq. (3.11) and the total reflectance, eq. (3.12) is illustrated as function of incidence angle in Figure 3-8. It can be seem that the reflectance remains quite constant around 4 % until AOI reaches 30o. The influence of reflectance is especially significant for high incidence angles. Brewster’s angle indicates the incidence angle, from where no reflection between two media with different refractive index occurs. For normal float glass, this angle is determined to 56o [I 12].
0
0.2
0.4
0.6
0.8
1
0 10 20 30 40 50 60 70 80 90
AOI [degrees]
Ref
lect
ance
[-]
Figure 3-8: Reflectance R for float glass as function of AOI
Finally, the theoretical transmittance for a float glass is illustrated as function of AOI in Figure 3-9, determined by eq. (3.13).
Rs
Rp
R
Background
41
0
0.2
0.4
0.6
0.8
1
0 10 20 30 40 50 60 70 80 90
AOI [degrees]
Tra
nsm
ittan
ce [-
]
Figure 3-9: Transmittance T for float glass as function of AOI
3.4 Known Relations of Performance Dependency Studies on solar cells have been carried out with the intention to determine the performance dependency with respect to parameters that influence the electrical cell behavior. These studies consist of both laboratory experiments and long term outdoor testing of modules under realistic conditions. Relevant results from the studies will in the following be accounted for. For the silicon cells the studies have been carried out for a long time, but it has been more difficult to find known relations for the behavior of the DSC with respect to the investigated performance parameters.
3.4.1 The Silicon Solar Cell
Relations concerning the performance dependency for silicon cells found in studies will be accounted for.
3.4.1.1 Cell Temperature
The operating temperature of the cell will influence the speed of the chemical reactions within the conducting material. The following guidelines for electrical behaviour of a silicon cell are given in [B 1], but variations in result for different types of silicon cells are expected. It is assumed that the guidelines are given for cells tested under STC. The influence of cell temperature will have a minor effect on the short-circuit current Isc, where an increase in relative ISC per. increased oC of operating temperature, eq. (3.14),
is estimated to be:
Background
42
CdT
dI
Io
cell
SC
SC/0006.0
1 +≈⋅ ( 3.14)
The main effect of increasing cell temperature is seen in the linear reduction of the VOC, eq. (3.15) and is estimated to be:
CVdT
dV o
cell
OC / 002.0−≈ ( 3.15)
Due to the decrease in VOC, also the Fill Factor is reduced for increasing cell temperatures. This reduction for the relative FF per. increased oC of operating temperature, eq. (3.16), is estimated to be:
CdT
dFF
FFo
cell/ 0015.0
1 −≈⋅ ( 3.16)
The reduction in FF and VOC for increasing cell temperatures results in a reduction of Pmax, eq. (3.17):
CdT
dP
Po
cell/ )005.0 to004.0(
1 max
max−≈⋅ ( 3.17)
The overall effect of cell temperature for a mono crystalline silicon solar cell is a linear relation for cell temperature and efficiency [A 11] with a linear decrease in absolute conversion efficiency, eq. (3.18), estimated to:
CdT
d o
cell/% 06.0−≈η ( 3.18)
The conversion efficiency at cell temperature Tcell, eq. (3.19) is therefore estimated to:
( )STCcellcell
STCT TTdT
dcell
−⋅+=ηηη ( 3.19)
Theory poses a negative linear correlation between cell temperature and conversion efficiency. Commercial modules are specified with a linear negative temperature coefficient, obtained from experimental measurements.
3.4.1.2 Irradiance Intensity
As the silicon cells are estimated to show electrical behaviour like a diode in parallel with a current generator (see Figure 3-5), the short circuit current ISC is known to be directly proportional with the irradiance intensity G. The open-circuit voltage increases

Background
43
logarithmically for increasing G. The relations are given in section 3.2 Characterization
of Solar Cells, eq.(3.2) and eq. (3.3). The silicon solar cells show performance dependence on light intensity. The relative efficiency is seen to decrease markedly at low light levels which holds an important effect if the cells are installed in climates where the intensities of irradiance is low most year round. Results from an outdoor test of different silicon cell types indicate this negative dependence of conversion efficiency for lowered light levels showing efficiency losses up to 30% for an irradiance of 200 W/m2 [A 7], see Figure 3-10.
Figure 3-10: Relative Efficiency as function or irradiance [A 7]
From Figure 3-10 it is further seen, that the modules can differ greatly in performance, according to their optimum light level acceptance.
3.4.1.3 Angle of Incidence
The angle of incidence is linked to irradiance intensity as total irradiation G decreases by cosine to incidence angle, described in section 3.2.2 Influence of Angle of Incidence. Experimental tests show that the generated ISC which is shown to be directly proportional to irradiance G shows deviations from expected by the cosine relation at high incidence angles. The parameter that is estimated to hold the primary influence for this deviation is the reflectance at the cell surface [A 9], [A 10]. This additional loss in current-generation due to reflectance losses at high incidence angles acts to decrease the conversion efficiency. An experimental result of relative conversion efficiency as function of incidence angle measured for a silicon cell is seen in Figure 3-12, [A 15].
Background
44
3.4.2 The Dye-Sensitized Solar Cell
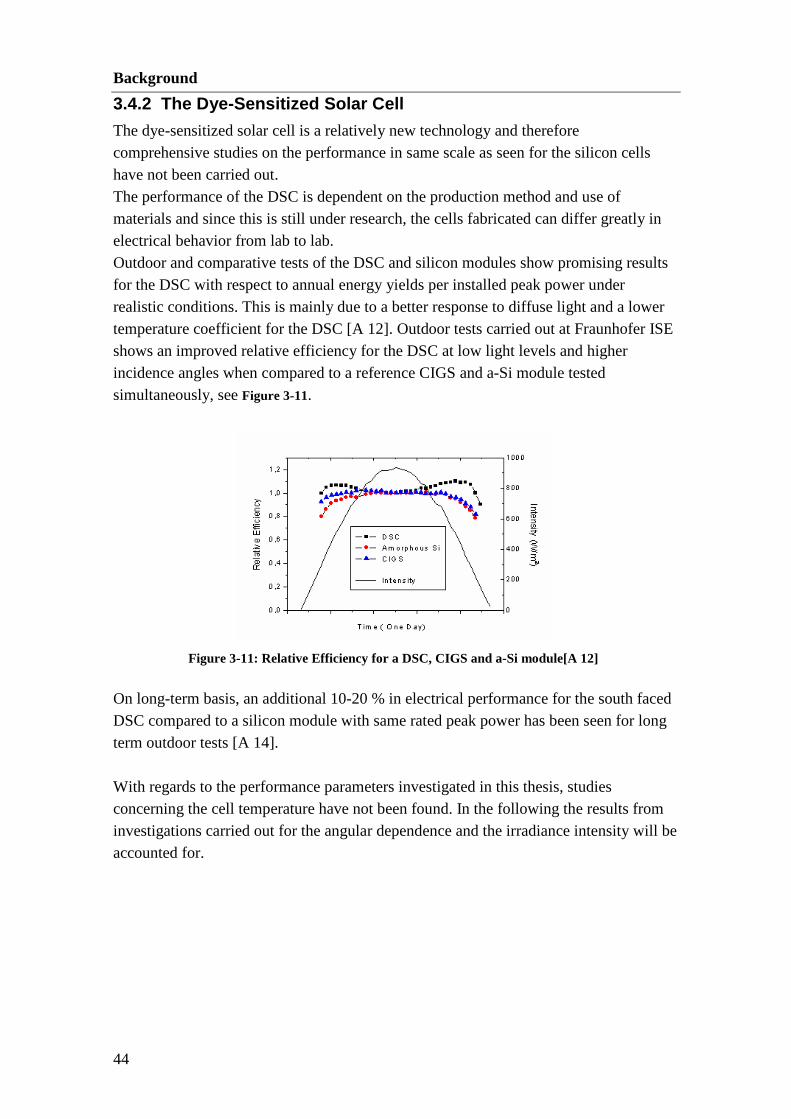
The dye-sensitized solar cell is a relatively new technology and therefore comprehensive studies on the performance in same scale as seen for the silicon cells have not been carried out. The performance of the DSC is dependent on the production method and use of materials and since this is still under research, the cells fabricated can differ greatly in electrical behavior from lab to lab. Outdoor and comparative tests of the DSC and silicon modules show promising results for the DSC with respect to annual energy yields per installed peak power under realistic conditions. This is mainly due to a better response to diffuse light and a lower temperature coefficient for the DSC [A 12]. Outdoor tests carried out at Fraunhofer ISE shows an improved relative efficiency for the DSC at low light levels and higher incidence angles when compared to a reference CIGS and a-Si module tested simultaneously, see Figure 3-11.
Figure 3-11: Relative Efficiency for a DSC, CIGS and a-Si module[A 12]
On long-term basis, an additional 10-20 % in electrical performance for the south faced DSC compared to a silicon module with same rated peak power has been seen for long term outdoor tests [A 14]. With regards to the performance parameters investigated in this thesis, studies concerning the cell temperature have not been found. In the following the results from investigations carried out for the angular dependence and the irradiance intensity will be accounted for.
Background
45
3.4.2.1 Angle of Incidence
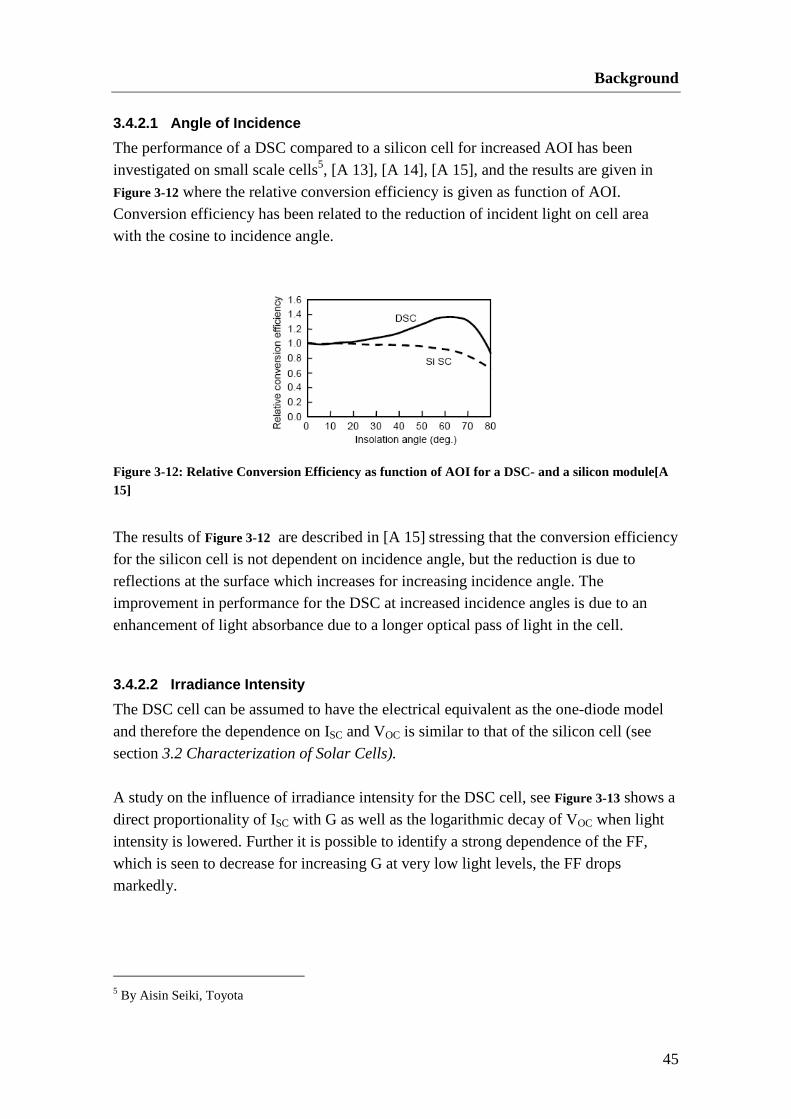
The performance of a DSC compared to a silicon cell for increased AOI has been investigated on small scale cells5, [A 13], [A 14], [A 15], and the results are given in Figure 3-12 where the relative conversion efficiency is given as function of AOI. Conversion efficiency has been related to the reduction of incident light on cell area with the cosine to incidence angle.
Figure 3-12: Relative Conversion Efficiency as function of AOI for a DSC- and a silicon module[A 15]
The results of Figure 3-12 are described in [A 15] stressing that the conversion efficiency for the silicon cell is not dependent on incidence angle, but the reduction is due to reflections at the surface which increases for increasing incidence angle. The improvement in performance for the DSC at increased incidence angles is due to an enhancement of light absorbance due to a longer optical pass of light in the cell.
3.4.2.2 Irradiance Intensity
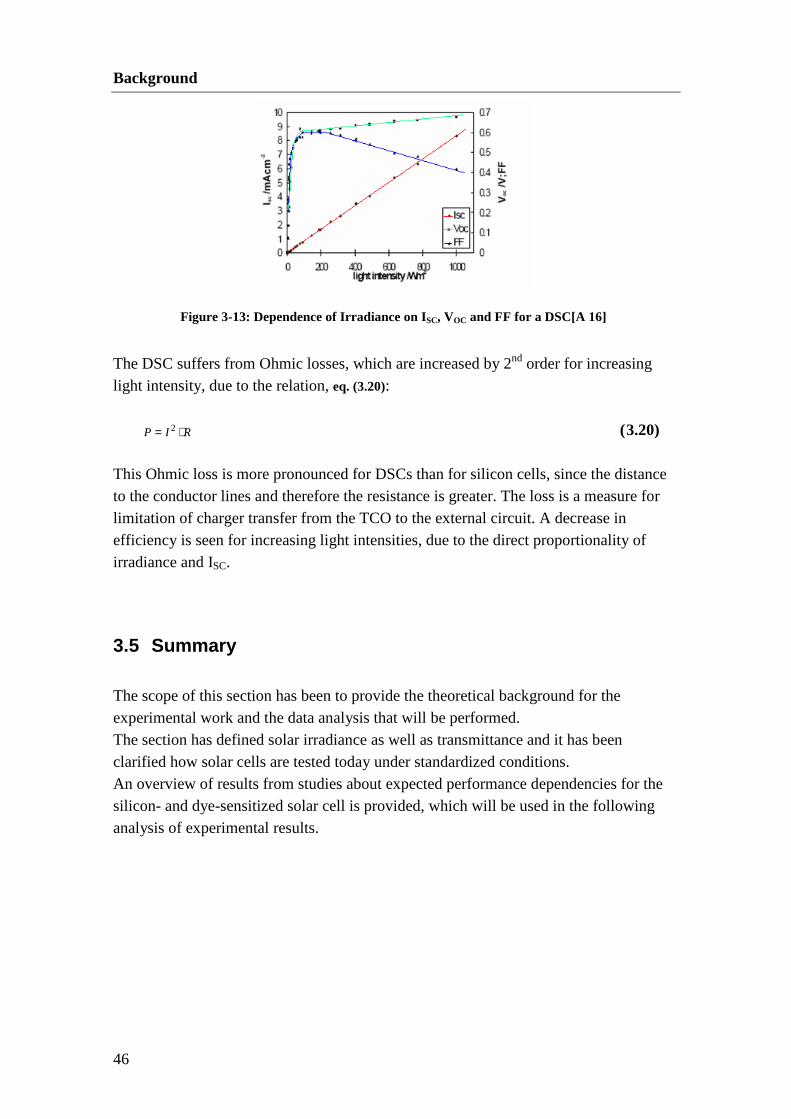
The DSC cell can be assumed to have the electrical equivalent as the one-diode model and therefore the dependence on ISC and VOC is similar to that of the silicon cell (see section 3.2 Characterization of Solar Cells). A study on the influence of irradiance intensity for the DSC cell, see Figure 3-13 shows a direct proportionality of ISC with G as well as the logarithmic decay of VOC when light intensity is lowered. Further it is possible to identify a strong dependence of the FF, which is seen to decrease for increasing G at very low light levels, the FF drops markedly.
5 By Aisin Seiki, Toyota
Background
46
Figure 3-13: Dependence of Irradiance on ISC, VOC and FF for a DSC[A 16]
The DSC suffers from Ohmic losses, which are increased by 2nd order for increasing light intensity, due to the relation, eq. (3.20): RIP ⋅= 2 ( 3.20) This Ohmic loss is more pronounced for DSCs than for silicon cells, since the distance to the conductor lines and therefore the resistance is greater. The loss is a measure for limitation of charger transfer from the TCO to the external circuit. A decrease in efficiency is seen for increasing light intensities, due to the direct proportionality of irradiance and ISC.
3.5 Summary The scope of this section has been to provide the theoretical background for the experimental work and the data analysis that will be performed. The section has defined solar irradiance as well as transmittance and it has been clarified how solar cells are tested today under standardized conditions. An overview of results from studies about expected performance dependencies for the silicon- and dye-sensitized solar cell is provided, which will be used in the following analysis of experimental results.
4 THE TEST CELLS
The fundamental production steps for the dye-sensitized solar cells used in the experimental work are explained in order to give an overview of the manufacturing principle of the DSC. As the production of DSCs is still investigated and improved, it is important to mark that there might be great difference in the electrical behaviour of cells produced in another lab, since the production is not standardized. The experimental work in this thesis has been carried out with DSCs produced at Danish Technological Institute (DTI) and Fraunhofer ISE. In order to perform the performance comparison of the DSC with respect to a conventional silicon cell, a reference silicon cell is needed. The performance dependency of the silicon cell with respect to the parameters: cell temperature, AOI and irradiation intensity has already been studied well, so the principles and behavior of the silicon should be well known. In order to verify the results, side by side tests of a DSC and a silicon solar cell is desired, in order to create the most similar conditions and hence basis for performance comparison.
4.1 The DTI Dye-Sensitized Solar Cell DTI has been working with the DSC since mid 90s and is one of the only Danish research institutes involved with the DSC. The work performed recently focuses on the stability of the cell with respect to encapsulation, up-scaling of cells to modules as well as the aesthetical and added values provided by the opportunities of the DSC with respect to building integration. The cells used for the experimental work has been produced by hand in the following steps, illustrated in Figure 4-1.

The test cells
48
1)
• Drilling of holes
• Washing
2)
• Plotting of silver lines
• Annealing at 650oC
3)
• Masking and doctor blading of TiO2
• Annealing at 450oC
• Performed for both transparent and
diffuse layer of TiO2
4)
• Masking and doctor blading of Pt
5)
• Sealing
• Dyeing
6)
• Filling of electrolyte
• End sealing of holes
Figure 4-1: Production steps for manufacturing the DTI DSC cell
A finished ‘standard’ cell will have the appearance as shown in Figure 4-2. DTI are currently working on up scaling the cells to master plates and changing the production process from manufacturing by hand to screen printing the active layers. One of the first master plates produced is shown in Figure 4-3.

The test cells
49
Figure 4-2: The DTI DSC cell Figure 4-3: The DTI DSC master plate
4.2 Reference cells used at DTI As the DTI DSC cells are handmade the electrical performance is not completely reproducible. The key parameters for the 5 DSCs used in the experimental work have been averaged and are given in Table 4-1 tested under an irradiance of 100 W/m2 and 1000 W/m2. The
average active area of the cells is 8.07⋅10 -4 m2.
Table 4-1 Average performance parameters for the DTI DSC cells
ISC
[mA]
VOC
[mV]
FF
[%]
Pmax
[mW]
η
[%]
G=100 W/m2 9.1 563.8 63.8 3.3 4.0
G=1000 W/m2 75.3 639.8 28.7 13.8 1.7 The IV-curves for the 5 DSC cells which were characterized at DTI, are shown for an irradiance of 100 W/m2 and 1000 W/m2, see Figure 4-4 and Figure 4-5.

The test cells
50
0
4
8
12
0 200 400 600
Voltage V [mV]
Cur
rent
I [m
A]
Figure 4-4: IV-curve for DTI cells under 100 W/m2
0
30
60
90
0 200 400 600
Voltage V [mV]
Cur
rent
I [m
A]
Figure 4-5: IV-curve for DTI cells under 1000 W/m2
A main reason for the bad FF seen at high irradiance when comparing Figure 4-4 and Figure 4-5 which also results in a markedly lower conversion efficiency is due to the charge transfer resistance in the DTI cells which is enhanced at high irradiance. This is caused by the long distance from the active area where light is harvested to the conductor lines (silver lines), see section 3.4.2.2 Irradiance Intensity. As the test setups at DTI are limited to the dimensions of the standard DSC cell, reference silicon cells with similar dimensions have been created to enable a performance comparison between the two technologies. The reference silicon cells consist of two polycrystalline cells cut from the same wafer but with different top glass, and one monocrystalline silicon cell, see Figure 4-6.
DSC 1
DSC 2
DSC 3
DSC 4
DSC 5
DSC 1
DSC 2
DSC 3
DSC 4
DSC 5

The test cells
51
Figure 4-6: Reference silicon cells: -from top to bottom: Si 1, Si 2, Si 3.
The properties of the all test cells are given in Table 4-2, and the key performance parameters for the three silicon cells tested under 1 Sun are given in Table 4-3.
Table 4-2 Properties of test cells used at DTI
Cell Type Laminate Dimensions, Aactive
[mm x mm] Aactive [m2]
Cell 1 DSC K-glass 62 x 14 8.68 ⋅ 10 -4
Cell 2 DSC K-glass 62 x 13 8.06 ⋅ 10-4
Cell 3 DSC K-glass 59 x 14 8.26 ⋅ 10-4
Cell 4 DSC K-glass 59 x 13 7.67 ⋅ 10-4
Cell 5 DSC K-glass 59 x 13 7.67 ⋅ 10-4
Si 1 Polycrystalline Si OptiWhite 69 x 15 10.35 ⋅ 10-4
Si 2 Polycrystalline Si K-glass 55 x 15 8.25 ⋅ 10-4
Si 3 Monocrystalline Si OptiWhite 71 x 13 (conductor line: 2 mm)
without conductor line:
7.81 ⋅ 10-4
(with: 9.23 ⋅ 10-4)
Table 4-3 Performance parameters for the reference silicon cells
G=1000 W/m2 ISC
[mA]
VOC
[mV]
FF
[%]
Pmax
[mW]
η
[%]
Si 1 279.6 525.9 67.5 99.3 9.6
Si 2 166.3 525.2 72.1 63.0 7.6
Si 3 300.1 581.6 65.1 113.6 14.6
The test cells
52
The DSC cells are laminated with K-glass applied with a TCO. The commercial silicon modules are commonly encapsulated in OptiWhite glass, which has low-iron content and a high transmittance of 0.9 [I 13]. In comparison a K-glass has light transmittance of 0.76 [I 14], so the amount of light at the active solar cell depends on top glass.
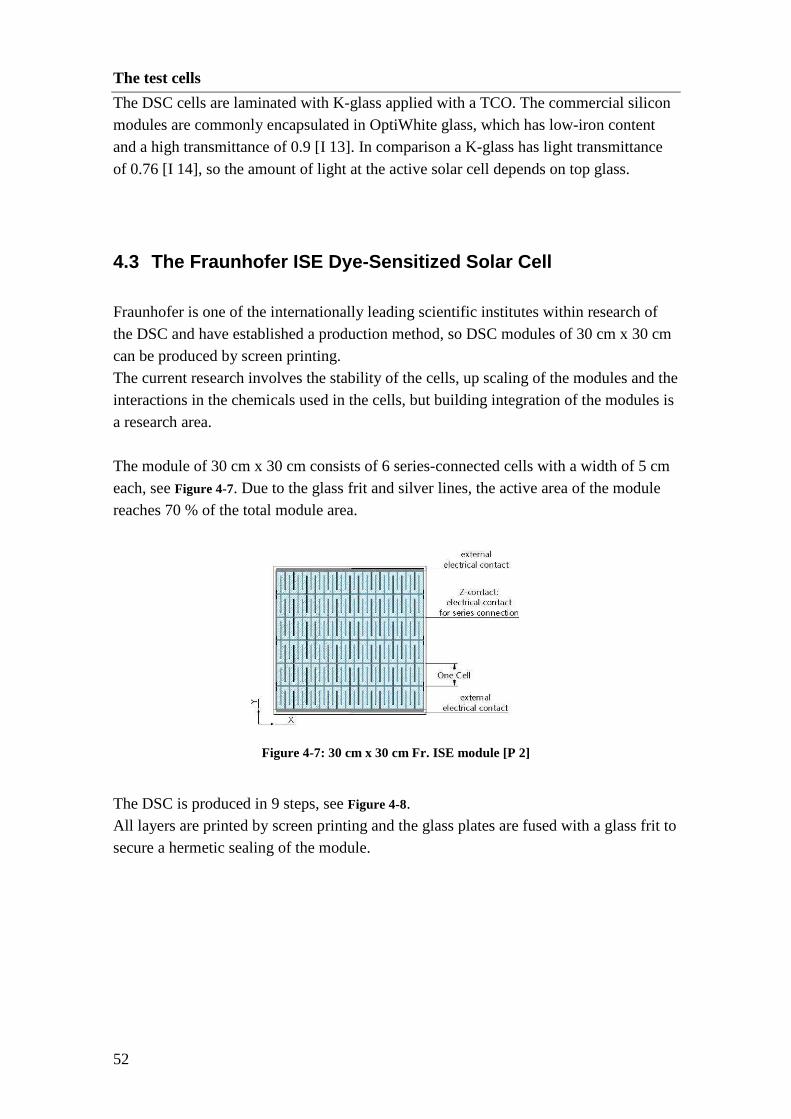
4.3 The Fraunhofer ISE Dye-Sensitized Solar Cell Fraunhofer is one of the internationally leading scientific institutes within research of the DSC and have established a production method, so DSC modules of 30 cm x 30 cm can be produced by screen printing. The current research involves the stability of the cells, up scaling of the modules and the interactions in the chemicals used in the cells, but building integration of the modules is a research area. The module of 30 cm x 30 cm consists of 6 series-connected cells with a width of 5 cm each, see Figure 4-7. Due to the glass frit and silver lines, the active area of the module reaches 70 % of the total module area.
Figure 4-7: 30 cm x 30 cm Fr. ISE module [P 2]
The DSC is produced in 9 steps, see Figure 4-8. All layers are printed by screen printing and the glass plates are fused with a glass frit to secure a hermetic sealing of the module.

The test cells
53
Figure 4-8: Production steps for the Fr. ISE DSC module [P 2]
The finished module will have the appearance as shown in Figure 4-9 and for a non-transparent module, the given electrical properties are thought reproducible for a 30 cm x 30 cm module.
VOC ~ 4,5 V
ISC ~ 0,9 A
FF ~ 55%
ηactive ~4,5 %
ηtotal ~3 %
Figure 4-9: Fr. ISE DSC module
The appearance of the module can be varied by applying scattering layers, hereby enabling the possibility for individual design and different degrees of transparencies. Examples of different designs are given in Figure 4-10. The degree of transparency will
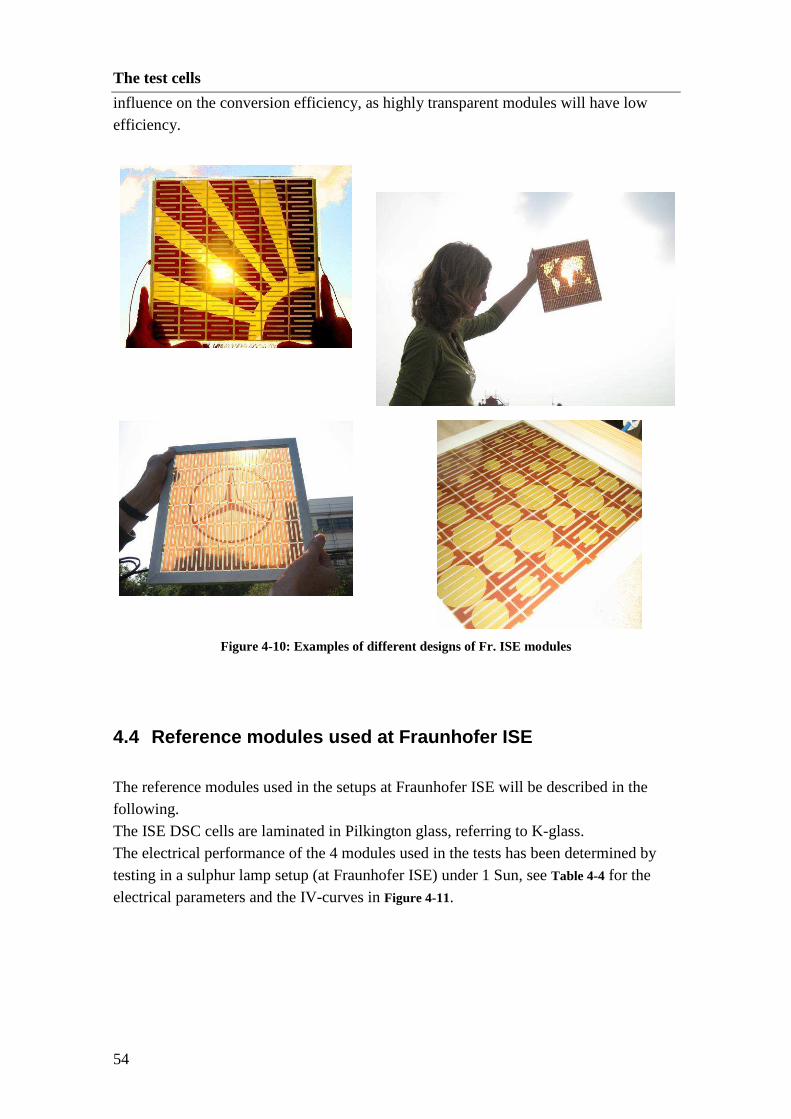
The test cells
54
influence on the conversion efficiency, as highly transparent modules will have low efficiency.
Figure 4-10: Examples of different designs of Fr. ISE modules
4.4 Reference modules used at Fraunhofer ISE The reference modules used in the setups at Fraunhofer ISE will be described in the following. The ISE DSC cells are laminated in Pilkington glass, referring to K-glass. The electrical performance of the 4 modules used in the tests has been determined by testing in a sulphur lamp setup (at Fraunhofer ISE) under 1 Sun, see Table 4-4 for the electrical parameters and the IV-curves in Figure 4-11.

The test cells
55
Table 4-4 Performance parameters for the Fraunhofer ISE DSC cells
ISC
[A]
VOC
[V]
FF
[%]
Pmax
[W]
ηηηηA active/ηηηηA total
[%]
ISE DSC 1 0.85 4.6 55.5 2.2 4.17 / 2.75
ISE DSC 2 0.88 4.6 62.0 2.5 4.8 / 3.17
ISE DSC 3 0.86 4.6 63.4 2.52 4.8 / 3.17
ISE DSC 4 0.87 4.5 59.4 2.33 4.48 / 2.95
Aactive : 0.052 m2
Atotal : 0.079 m2
0
0.3
0.6
0.9
0 1 2 3 4 5
Voltage V [V]
Cur
rent
I [A
]
Figure 4-11: IV-curves for ISE DSC modules under 1000 W/m2
The modules used had an additional scattering layer so the modules were not transparent, see Figure 4-12.
Figure 4-12: Front- and back side of a ISE DSC module
DSC 1
DSC 2
DSC 3
DSC 4

The test cells
56
The silicon module used is a commercial monocrystalline Shell Solar module, model SM6 S/N, see Figure 4-13. The top glass is of OptiWhite, so it has high transmittance and low iron-content.
Figure 4-13: The Shell module
The information provided by the manufacturer is:
Pmax : 6.0 Watts Max. syst. VOC: 30 Volts
Current ISC: 0.42 A Rated: 0.39 A
Voltage VOC: 19.5 V Rated: 15.0 V
Area (total): 0.05775 m2
The rated values are measured under Standard Test Conditions, resulting in the conversion efficiency under STC is 10.13 % and FF of 71.4 %.
4.5 Summary In the previous, an overview of the cells used in the experimental investigations has been described. As the reference cells for both silicon and DSC differs according to where the experimental work has been carried out, the production process for the DSCs and the electrical properties of all cells are provided.

5 EXPERIMENTAL WORK
The experimental work is performed with the objective to gain an understanding of the electrical performance with respect to the parameters: irradiance intensity, cell temperature and incidence angle. The experiments have been performed as side-by-side tests with DSC cells and silicon cells. The experimental work consists of initial tests performed in controlled lab-environment where it is possible to isolate one unknown parameter. An understanding of the cell behavior for variation of one parameter is therefore gained, and this knowledge will be used to evaluate outdoor measurements performed over a 3 week period. The tests will be presented in the following with a description of the setup and test, analysis of the results and a sub-conclusion. A comparison of observed tendencies will in the end be summarized, providing an overview of the dependencies and their importance.
5.1 Irradiance In order to investigate the influence of the incoming light intensity on cell performance, a series of experiments have been performed in which the irradiance was varied systematically from 1000 W/m2 to 70 W/m2. The corresponding IV-curves were created from where the following key performance parameters for the cells have been extracted:
ISC, VOC, FF, Pmax and η.
5.1.1 The test setup
The tests were performed in the laboratory at DTI with the set-up shown in Figure 5-1-Figure 5-4.

Experimental work
58
Figure 5-1: Test setup with a DSC cell Figure 5-2: Test setup – artificial light source
Figure 5-3: Test setup with a DSC cell – backside with thermo couple
Figure 5-4: Test setup with a Silicon cell
The setup consists of a Xenon lamp as light source, a water filter to imitate the atmosphere, a mirror to bend the beam, a diffusing plate to distribute the illumination to the test area and fans to avoid heating of the cells. The irradiance intensity at the test area is measured by a standard silicon pyranometer. Even though silicon cells have a different spectral response than DSCs, the silicon pyranometer is considered to give a reproducible measure for irradiance level at the test surface which ensures comparable test conditions for the cells. The spectral distribution of the Xenon lamp compared to solar irradiance at 1000 W/m2, AM1.5 [I 15] is shown in Figure 5-5. It should be noted that the values should only be regarded qualitatively, as the intensities have not been normalized. The peak of intensity for the Xenon Lamp is found around 550 nm, whereas the solar energy spectral distribution peaks at 450 nm.
Xenon Lamp
Water Filter
Diffusing Plate
Mirror
Test Area

Experimental work
59
Figure 5-5: Spectral distribution of Xenon lamp6
The intensity is changed by varying the distance between the light source and front glass of the cell and therefore it can be estimated that the spectral distribution of the light is comparable for each distance. The test setup has been created with the focus to develop a setup, where all other parameters that can influence the cell performance other than irradiance intensity is kept constant such as humidity and ambient temperature. The ambient and the temperature on the backside of the cells during testing are monitored. The typical variation in cell temperature was below 5oC, so it is assumed reasonable to estimate constant cell temperature.
5.1.2 Limitations
The setup holds a limitation in the intensities that can be investigated. It is possible to achieve intensities from approx. 70-1000 W/m2. The test area in which the irradiance is at constant intensity is also limited. The light beams are sent through a water filter and a diffusing plate, which results in diffuse light beams. Therefore the irradiance impinging the test area does not only consist of collimated beams which can have an influence on cell response, favouring some technologies over others.
6 Performed by Theis Brock Nannestad, University of Copenhagen

Experimental work
60
0
0.5
1
0 200 400 600 800 1000
G [W/m2]
Rel
ativ
e I S
C [-
]
0
100
200
300
0 200 400 600 800 1000
G [W/m 2]
I SC [m
A]
5.1.3 The test
5 DSC cells and 3 Si-reference cells with the properties given in Table 4-2 are tested and evaluated. Each cell was tested within the range of irradiance mentioned. For each measurement the IV-curve was created as well as the cell temperature was monitored. In order to test the reproducibility of results, the test with the stable silicon cells were repeated after 4 months where highly comparable results were achieved, with a maximum deviation in absolute efficiency of + 5%. As the results for the tested DSCs all show the same tendency, the average of the measured results for the 5 DSCs will be used to show the overall dependency of irradiance intensity for the DTI DSC cells. In this way the uncertainty in results caused by the fact that the cells are handmade will be minimized. IV-characterisation of the DTI cells showed some deviations, see section 4.2 Reference cells, Figure 4-4 and Figure
4-5.
5.1.4 Results and Discussion
Figure 5-6 - Figure 5-10 shows the performance of the tested cells with respect to the key
parameters ISC, VOC, FF, Pmax and η plotted as function of the irradiance intensity G, for absolute values and after scaling to results achieved under measurements at 1 Sun.
Figure 5-6: ISC and relative ISC as function of irradiance G
Figure 5-6 displays an increase in short-circuit current ISC for increasing irradiance G for both the DSC and the Silicon cells. The best fit is seen to be linear, which was also expected as ISC should be directly proportional to G. A possible inaccuracy in the measurement setup is seen around ISC of 100 mA, where the curves are seen to deviate from the linear tendency. The relative ISC is seen to be very similar for the silicon cells without respect to the difference in technology or top glass. The graph for the relative ISC of the DSC doesn’t show same approximation to a linear fit as for the silicon cells. This is due to the increasing deviation of ISC from the linear fit at high irradiance intensities.
DSC_average
Si 1
Si 2
Si 3

Experimental work
61
0
200
400
600
0 200 400 600 800 1000
G [W/m 2]
VO
C [m
V]
0.6
0.8
1
0 200 400 600 800 1000
G [W/m 2]
Rel
ativ
e V
OC [-
]
0
20
40
60
80
0 200 400 600 800 1000
G [W/m2]
FF
[%]
0
1
2
3
0 200 400 600 800 1000
G [W/m 2]
Rel
ativ
e F
F [-
]
Figure 5-7: VOC and relative VOC as function of irradiance G
Figure 5-7 shows an increase in open-circuit voltage VOC for increasing G for all cells. This increase is approaching linearity and constancy at high irradiance levels indicating that the VOC for the cells is almost independent of G. At low light levels VOC drops most obvious for the silicon cells and the decrease in relative VOC is most pronounced for the monocrystalline Si 3 at low light levels. The relative VOC is comparable for the Si 1 and Si 2, where it is seen that the difference in top-glass is not important. The cells were made of same wafer, but with different top-glass, 4.2 Reference cells. The drop in relative VOC for the DSC is comparable with the silicon cells until the limit of irradiance reaches approx. 400 W/m2. For irradiances below this limit, the drop in relative VOC is increased for the silicon cells.
Figure 5-8: FF and relative FF as function of irradiance G
The DSC performs better at low light conditions and as Figure 5-8 illustrates, the Fill Factor is increased when intensity is lowered due to the lowering in charge transfer resistance. The opposite tendency is seen for the silicon cells where the Fill Factor is decreased when the irradiance intensity goes below 300 W/m2. For intensities exceeding 300 W/m2 the Fill Factor for the silicon cells is almost constant and independent of irradiance intensity as seen for the slope of relative FF. The difference in FF for Si 1 and
DSC_average
Si 1
Si 2
Si 3
DSC_average
Si 1
Si 2
Si 3

Experimental work
62
0
40
80
120
0 200 400 600 800 1000
G [W/m 2]
Pm
ax [m
W]
0
0.5
1
0 200 400 600 800 1000
G [W/m2]
Rel
ativ
e P
max
[-]
0
5
10
15
0 200 400 600 800 1000
G [W/m 2]
Con
vers
ion
effic
ienc
y [%
]
0
1
2
3
0 200 400 600 800 1000
G [W/m2]
Rel
ativ
e ef
ficie
ncy
[-]
Si 2 due to different top glass is excluded when regarding the relative FF, where very comparable results are seen.
Figure 5-9: Pmax and relative Pmax as function of irradiance G
The maximum electrical output of the cells at various irradiance intensities is displayed in Figure 5-9. For the silicon cells, the increase in Pmax is almost linear growing, whereas the DSC shows a more logarithmic dependence for increasing G. Therefore the benefit of high intensity levels is greater for the silicon cells than for the DSC. The relative Pmax as function of G illustrates that the relative increase in Pmax for the silicon cells is very comparable without regards to cell technology and the best fit is linear. The results of relative Pmax for the DSC is not seen to approach linearity, mainly due to the behaviour of the FF for increasing G which is reduced for increased irradiance (see Figure 5-8).
Figure 5-10: ηηηη and relative ηηηη as function of irradiance G
As a measure for the cell performance the conversion efficiency of the solar cells is calculated. This takes into account the active area of the solar cell, the input power (G) and the output of the cell, as illustrated in Figure 5-10. The efficiency of the DSC as function of G shows that the cells perform best under low light conditions, hence the
DSC_average
Si 1
Si 2
Si 3
DSC_average
Si 1
Si 2
Si 3

Experimental work
63
highest conversion efficiency. For higher levels of irradiance the efficiency of the cell is continuously lowered, but with a smaller and smaller gradient. The relative efficiency
for the DSC under 0.1 Sun is approx. 2.5 times greater than under an illumination of 1 Sun, which indicates a charge transfer problem with this DSC cell under high irradiance. The silicon cells have highest efficiency at high irradiance levels and the efficiency drops at lower light intensities. The silicon cells are most likely optimized to have best efficiency for high irradiance intensities, creating a maximum peak at high G. The conversion efficiency is highest for the monocrystalline silicon cell, and the effect of glass type is also reflected in the efficiency determined for Si 1 and Si 2. The OptiWhite glass used in Si 1 has higher light transmittance than the K-glass used in Si 2, hence the higher efficiency for Si 1. When regarding the relative conversion efficiency the type of silicon and top glass does not have influence on the results, since
the graphs for relative η are convergent.
5.1.5 Comparison to theory
The experimental results are compared to the theoretical ideal behaviour of the one-diode model in order to see how well the experimental results match the theory, described in section 3.2 Characterization of Solar Cells. The measured ISC at different irradiance intensities show a good linear fit to G, which was also the expected behaviour related to theory. In order to investigate if the results for the VOC follow the expected logarithmical increase for increasing G, the experimental results have been used to determine the constants in the expression (eq. (3.2)):
+⋅⋅⋅= 1ln
0I
I
q
TknV L
OC
As all properties except irradiance intensity is assumed constant (n, k, T, q, Io), and IL=ISC the equation is simplified to:
+⋅= 1ln
0I
IcV SC
OC ( 5.1)
Where c and I0 are unknown constants. These constants are numerically determined for the silicon cell and the average of the DSCs with the data sets provided from the intensity experiments.
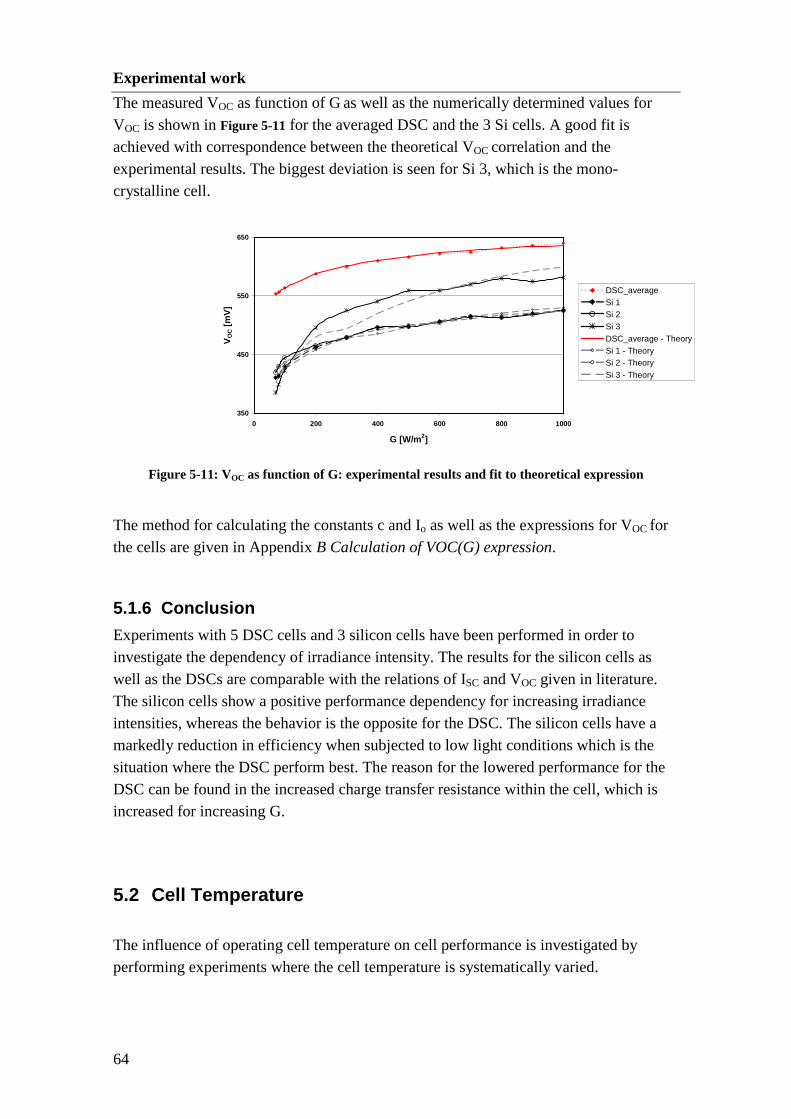
Experimental work
64
The measured VOC as function of G as well as the numerically determined values for VOC is shown in Figure 5-11 for the averaged DSC and the 3 Si cells. A good fit is achieved with correspondence between the theoretical VOC correlation and the experimental results. The biggest deviation is seen for Si 3, which is the mono-crystalline cell.
350
450
550
650
0 200 400 600 800 1000
G [W/m2]
VO
C [m
V]
Figure 5-11: VOC as function of G: experimental results and fit to theoretical expression
The method for calculating the constants c and Io as well as the expressions for VOC for the cells are given in Appendix B Calculation of VOC(G) expression.
5.1.6 Conclusion
Experiments with 5 DSC cells and 3 silicon cells have been performed in order to investigate the dependency of irradiance intensity. The results for the silicon cells as well as the DSCs are comparable with the relations of ISC and VOC given in literature. The silicon cells show a positive performance dependency for increasing irradiance intensities, whereas the behavior is the opposite for the DSC. The silicon cells have a markedly reduction in efficiency when subjected to low light conditions which is the situation where the DSC perform best. The reason for the lowered performance for the DSC can be found in the increased charge transfer resistance within the cell, which is increased for increasing G.
5.2 Cell Temperature The influence of operating cell temperature on cell performance is investigated by performing experiments where the cell temperature is systematically varied.
DSC_averageSi 1Si 2Si 3DSC_average - TheorySi 1 - TheorySi 2 - TheorySi 3 - Theory
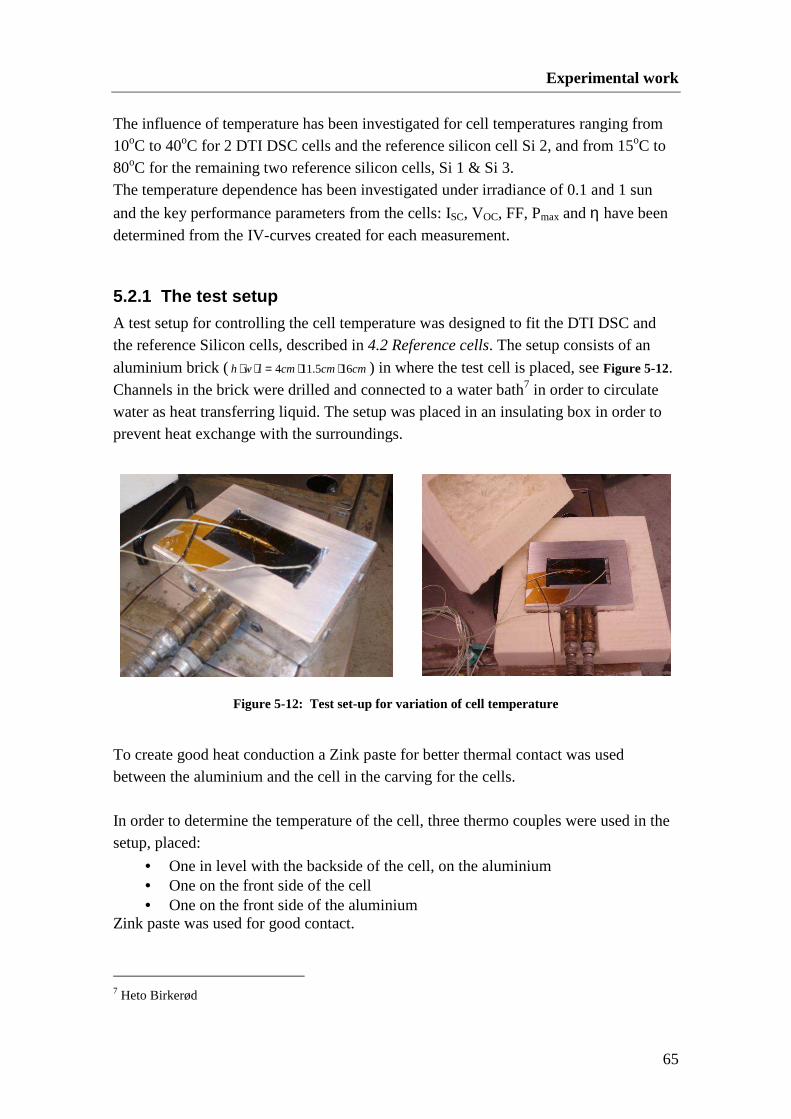
Experimental work
65
The influence of temperature has been investigated for cell temperatures ranging from 10oC to 40oC for 2 DTI DSC cells and the reference silicon cell Si 2, and from 15oC to 80oC for the remaining two reference silicon cells, Si 1 & Si 3. The temperature dependence has been investigated under irradiance of 0.1 and 1 sun
and the key performance parameters from the cells: ISC, VOC, FF, Pmax and η have been determined from the IV-curves created for each measurement.
5.2.1 The test setup
A test setup for controlling the cell temperature was designed to fit the DTI DSC and the reference Silicon cells, described in 4.2 Reference cells. The setup consists of an
aluminium brick ( cmcmcmlwh 165.114 ⋅⋅=⋅⋅ ) in where the test cell is placed, see Figure 5-12. Channels in the brick were drilled and connected to a water bath7 in order to circulate water as heat transferring liquid. The setup was placed in an insulating box in order to prevent heat exchange with the surroundings.
Figure 5-12: Test set-up for variation of cell temperature
To create good heat conduction a Zink paste for better thermal contact was used between the aluminium and the cell in the carving for the cells. In order to determine the temperature of the cell, three thermo couples were used in the setup, placed:
• One in level with the backside of the cell, on the aluminium • One on the front side of the cell • One on the front side of the aluminium
Zink paste was used for good contact.
7 Heto Birkerød

Experimental work
66
A Pico logger connected to a PC was used for monitoring the temperature to determine equilibrium temperature state of the system.
5.2.2 Limitations
The setup offers a limitation in temperature range. The water bath had to be replaced during the test period as it broke, so it was not possible to test the DSC cells and the Si 2 at higher temperatures than 40oC. The maximum temperature when testing the two silicon cells was 80oC. The number of experiments is very limited as problems in the production process of the DTI DSC cells occurred. Therefore only 2 DSC cells were tested once as the stability of the cells was then too low.
5.2.3 The Test
The temperature experiments were carried out at DTI using the setup of the solar simulator, described in section 5.1.1 The test setup. The cells were tested at 100 W/m2 and 1000 W/m2 for each temperature investigated. As the cell during the test will be exposed to the light source some heating of the surface will occur. Because the time for a test is relatively short (30 sec), the temperature gradient which will form in the cell is estimated to only be 1-1.5 oC due to the heat capacity of the glass. This has been estimated by calculating the temperature change of temperature-dependent conduction through a glass with the properties:
h=0.008 m ρ=2500 kg/m3 c= 750 J/(kg K) k=1.4 W/m K
using the Lumped Capacitance Method [B 6]. When testing a cell the temperature was raised by intervals of 10oC and for each temperature the cell was removed from the insulated box and tested under irradiance of 0.1 and 1 Sun. By carrying out the tests under these conditions it was possible to control the irradiance intensity and keep almost constant ambient air temperature. 2 DSC cells and 3 silicon cells were tested. The reference cell Si 1 and 3 were tested 2 times each in order to investigate the reproducibility of results. Good comparability in test results was seen for both cells with a maximum difference in absolute efficiency of 3.6 %. Therefore one data set is seen as representative for the cells.
5.2.4 Results and Discussion
The results are evaluated with respect to cell temperature, but are divided into 2 groups of an irradiance at G =100 W/m2 and G=1000 W/m2.
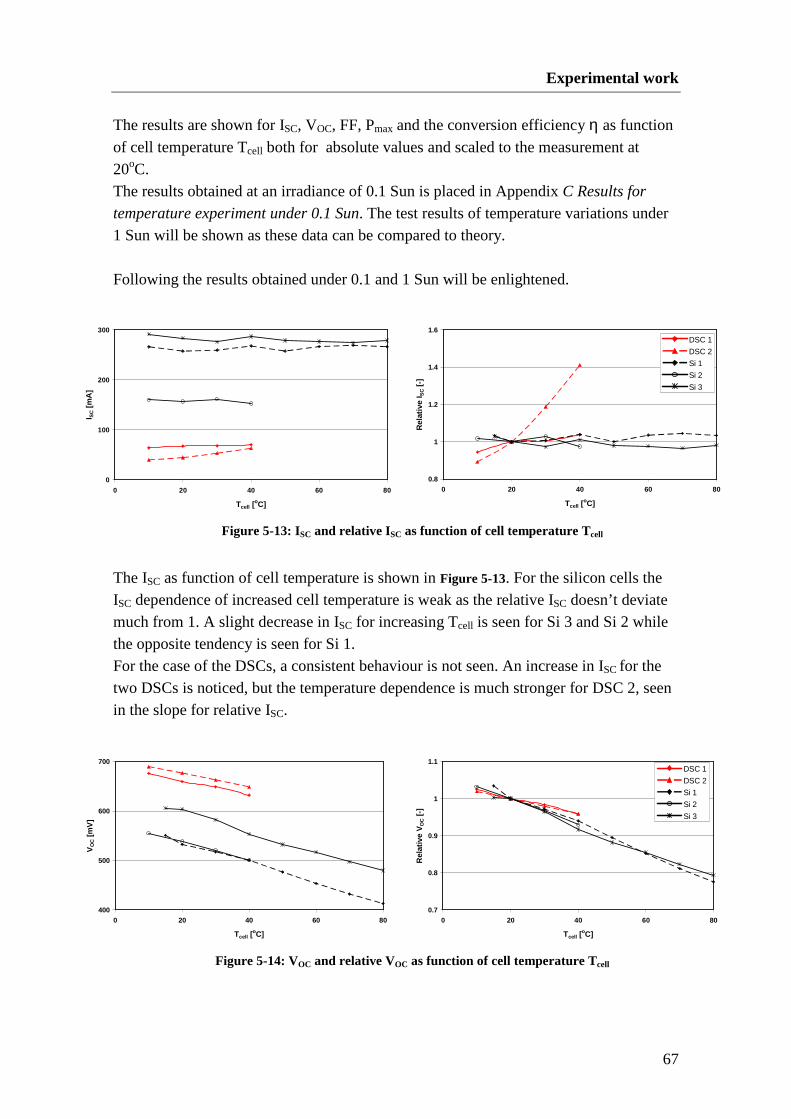
Experimental work
67
0
100
200
300
0 20 40 60 80
Tcell [oC]
I SC [m
A]
0.8
1
1.2
1.4
1.6
0 20 40 60 80
Tcell [oC]
Rel
ativ
e I S
C [-
]
400
500
600
700
0 20 40 60 80
Tcell [oC]
VO
C [m
V]
0.7
0.8
0.9
1
1.1
0 20 40 60 80
Tcell [oC]
Rel
ativ
e V
OC [-
]
The results are shown for ISC, VOC, FF, Pmax and the conversion efficiency η as function of cell temperature Tcell both for absolute values and scaled to the measurement at 20oC. The results obtained at an irradiance of 0.1 Sun is placed in Appendix C Results for
temperature experiment under 0.1 Sun. The test results of temperature variations under 1 Sun will be shown as these data can be compared to theory. Following the results obtained under 0.1 and 1 Sun will be enlightened.
Figure 5-13: ISC and relative ISC as function of cell temperature Tcell
The ISC as function of cell temperature is shown in Figure 5-13. For the silicon cells the ISC dependence of increased cell temperature is weak as the relative ISC doesn’t deviate much from 1. A slight decrease in ISC for increasing Tcell is seen for Si 3 and Si 2 while the opposite tendency is seen for Si 1. For the case of the DSCs, a consistent behaviour is not seen. An increase in ISC for the two DSCs is noticed, but the temperature dependence is much stronger for DSC 2, seen in the slope for relative ISC.
Figure 5-14: VOC and relative VOC as function of cell temperature Tcell
DSC 1
DSC 2
Si 1
Si 2
Si 3
DSC 1
DSC 2
Si 1
Si 2
Si 3

Experimental work
68
20
40
60
80
0 20 40 60 80
Tcell [oC]
FF
[%]
0.8
0.9
1
1.1
1.2
0 20 40 60 80
Tcell [oC]
Rel
ativ
e F
F [-
]
The cell temperature dependence of VOC is illustrated in Figure 5-14. For all cells a linear decrease is seen for increasing cell temperatures. The reduction in VOC for the Si-cells is slightly higher than for the DSCs, seen in the slope of the relative VOC as function of Tcell. The effect of difference in glass type for Si 1 and Si 2 is not seen in the VOC, as VOC is mainly affected by irradiance intensity.
Figure 5-15: FF and relative FF as function of cell temperature Tcell
The Fill Factor as function of cell temperature is given in Figure 5-15. For the silicon cells, a negative cell temperature dependence of FF is seen. A reduction in FF for increasing Tcell is seen for DSC 1, but the opposite dependence is seen for DSC 2 which might be caused by the irregularity seen for ISC (Figure 5-13). The trend for the temperature dependency of FF for the two DSCs is not comparable as the Fill Factor for DSC 1 increases for higher cell temperatures, but a decrease in FF for the DSC 2 is seen for the same properties. When looking at the absolute values of FF for the two types of technologies under high irradiance, the silicon cells has the highest FF with Si 2 having the highest FF. The FF for the DSCs is greatly reduced compared to the FF for the Silicon cells. Under the illumination of 0.1 Sun it is noticeable that the FF of the DSC is higher than for the Si cells, with Si 3 (monocrystalline) having the lowest FF, see Appendix C Results for
temperature experiment under 0.1 Sun. The reduction in DSC Fill Factor under high irradiance is attributed to the increased charge transfer resistance in the cell, which lowers the performance (see section 5.1.4 Results ).
DSC 1
DSC 2
Si 1
Si 2
Si 3
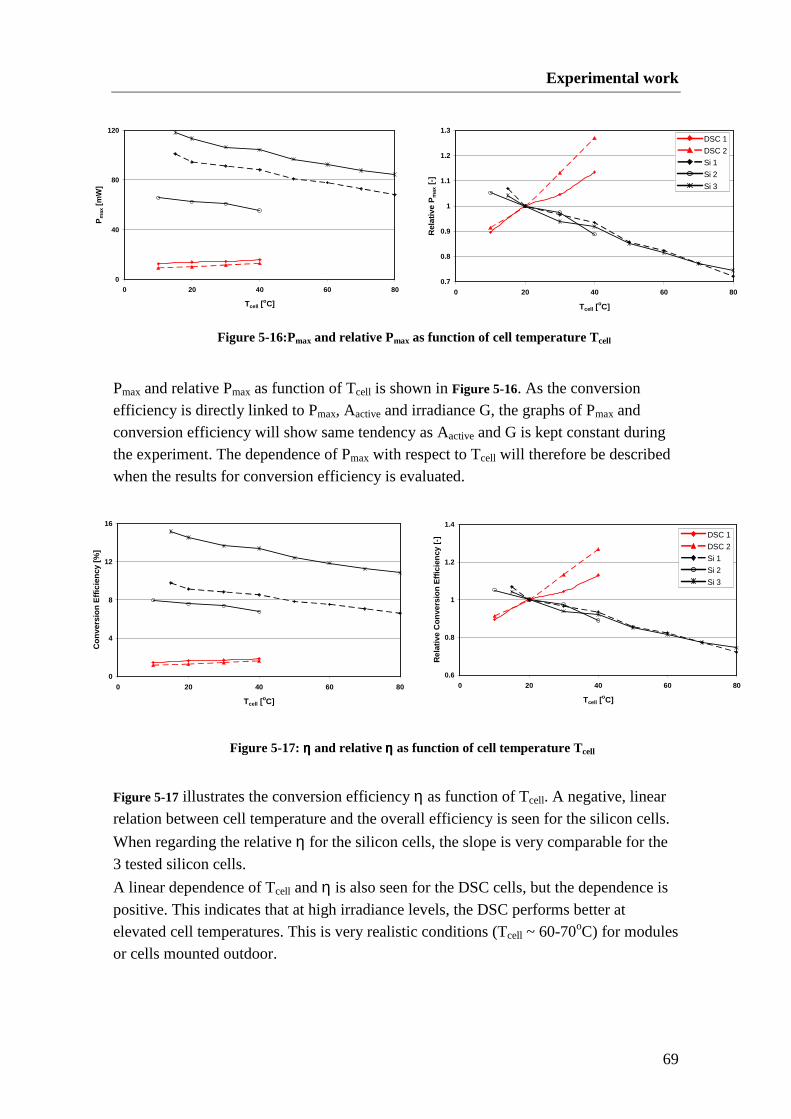
Experimental work
69
0
40
80
120
0 20 40 60 80
Tcell [oC]
Pm
ax [m
W]
0.7
0.8
0.9
1
1.1
1.2
1.3
0 20 40 60 80
Tcell [oC]
Rel
ativ
e P
max
[-]
0
4
8
12
16
0 20 40 60 80
Tcell [oC]
Con
vers
ion
Effi
cien
cy [%
]
0.6
0.8
1
1.2
1.4
0 20 40 60 80
Tcell [oC]
Rel
ativ
e C
onve
rsio
n E
ffici
ency
[-]
Figure 5-16:Pmax and relative Pmax as function of cell temperature Tcell
Pmax and relative Pmax as function of Tcell is shown in Figure 5-16. As the conversion efficiency is directly linked to Pmax, Aactive and irradiance G, the graphs of Pmax and conversion efficiency will show same tendency as Aactive and G is kept constant during the experiment. The dependence of Pmax with respect to Tcell will therefore be described when the results for conversion efficiency is evaluated.
Figure 5-17: ηηηη and relative ηηηη as function of cell temperature Tcell
Figure 5-17 illustrates the conversion efficiency η as function of Tcell. A negative, linear relation between cell temperature and the overall efficiency is seen for the silicon cells.
When regarding the relative η for the silicon cells, the slope is very comparable for the 3 tested silicon cells.
A linear dependence of Tcell and η is also seen for the DSC cells, but the dependence is positive. This indicates that at high irradiance levels, the DSC performs better at elevated cell temperatures. This is very realistic conditions (Tcell ~ 60-70oC) for modules or cells mounted outdoor.
DSC 1
DSC 2
Si 1
Si 2
Si 3
DSC 1
DSC 2
Si 1
Si 2
Si 3

Experimental work
70
0
3
6
9
0 200 400 600
Voltage V [mV]
Cur
rent
I [m
A]
0
20
40
60
80
0 200 400 600
Voltage [mV]
Cur
rent
I [m
A]
Difference in tendency for the DSC results obtained under 1 sun has been identified, but an explanation in the deviation can not be given. The results obtained under 0.1 sun shows very comparable tendencies, see Appendix C Results for temperature experiment
under 0.1 Sun. When considering the IV-curves measured under 0.1 and 1 Sun for the two DSC cells no great difference in performance is seen, see Figure 5-18 and Figure 5-19. The DSC 1 performs slightly better than DSC 2 under both light levels, but the difference is not great enough to exclude one cell. Since there is a lack of cells, the possible mistake in one data set cannot be identified.
Figure 5-18: IV-curve for DSC 1 & DSC 2 - 0.1 Sun Figure 5-19: IV-curve for DSC 1 & DSC 2 - 1 Sun
5.2.4.1 Comparison to theory
In the paragraph 3.4.1.1 Cell Temperature dealing with known relations of temperature dependence for the silicon cells, the estimated electrical behaviour of the silicon cells is given. In order to perform a comparison of the results achieved in the experimental work with the reference silicon cells, these results will be compared to the theoretical
expected behaviour with respect to ISC, VOC, FF, Pmax and conversion efficiency η. For the comparison of results for ISC, FF and Pmax the slope of the graphs for relative values is used. As two tests were performed for Si 1 and Si 3, the average of the slopes for each cell is used as the experimental result. It is only the results from the test carried out under an illumination of 1000 W/m2 which is compared to theory. The results are given in Table
5-1.
DSC 1
DSC 2

Experimental work
71
Table 5-1 Comparison of Theory and experimental results for silicon at 1000 W/m2
Slope
Relative ISC
Co1
VOC
CmV
o
Relative FF
Co1
Relative Pmax
Co1
Conversion
efficiency ηηηη
Co%
Si 1 +0.0003 -2.0 -0.0015 -0.005 -
Si 2 -0.0010 -1.8 -0.0009 -0.005 -
Si 3 -0.0007 -1.4 -0.0007 -0.0045 -0.07
THEORY
(see 3.4.1.1
Cell
Temperature)
+0.0006 -2 -0.0015 -0.004 to
-0.005
-0.06
(for mono-
crystalline)
As seen from Table 5-1, not complete similarity between experimental and theoretical values is achieved. Concerning the relative ISC with respect to cell temperature which only hold a minor effect, a good agreement between experimental results for Si 1 and theory is seen, but this is not the case for Si 2 and Si 3. This can be due to inaccuracies in the test setup as small inaccuracies in results can change the overall behaviour of the ISC as the temperature effect is very small. The VOC is expected to decrease 2 mV per oC increased cell temperature, and for all Si cells a decreasing VOC for increasing Tcell is obtained. The best agreement with theory is seen for Si 1, but the results for Si 2 and Si 3 are also within range of theory. As well as for the previous result comparisons, the temperature dependence of the FF is in best agreement with theory for Si 1, while a smaller negative temperature dependence of the FF is seen for Si 2 and 3. The Pmax dependence of cell temperature is in good accordance with theory, where a decrease in relative Pmax is expected to be between -0.004 to -0.005 per oC increased cell temperature. Even though ISC, VOC and FF did not correspond completely to theory, the overall output fits theory well. An estimation of the overall conversion efficiency is only given for a mono-crystalline silicon solar cell, corresponding to the reference cell Si 3. Good agreement between experimental results and theory is seen for this cell. The fact that the results deviate for Si 1 and Si 2 which are made from the same wafer might be found in the fact that the Si 1 is laminated in OptiWhite glass while Si 2 is laminated in K-glass, which has lower transmittance and a possible greater influence of the spectral light distribution impinging the cell, see description of cells in section 4.2
Reference cells. The enhanced transmittance for OptiWhite glass might also affect the
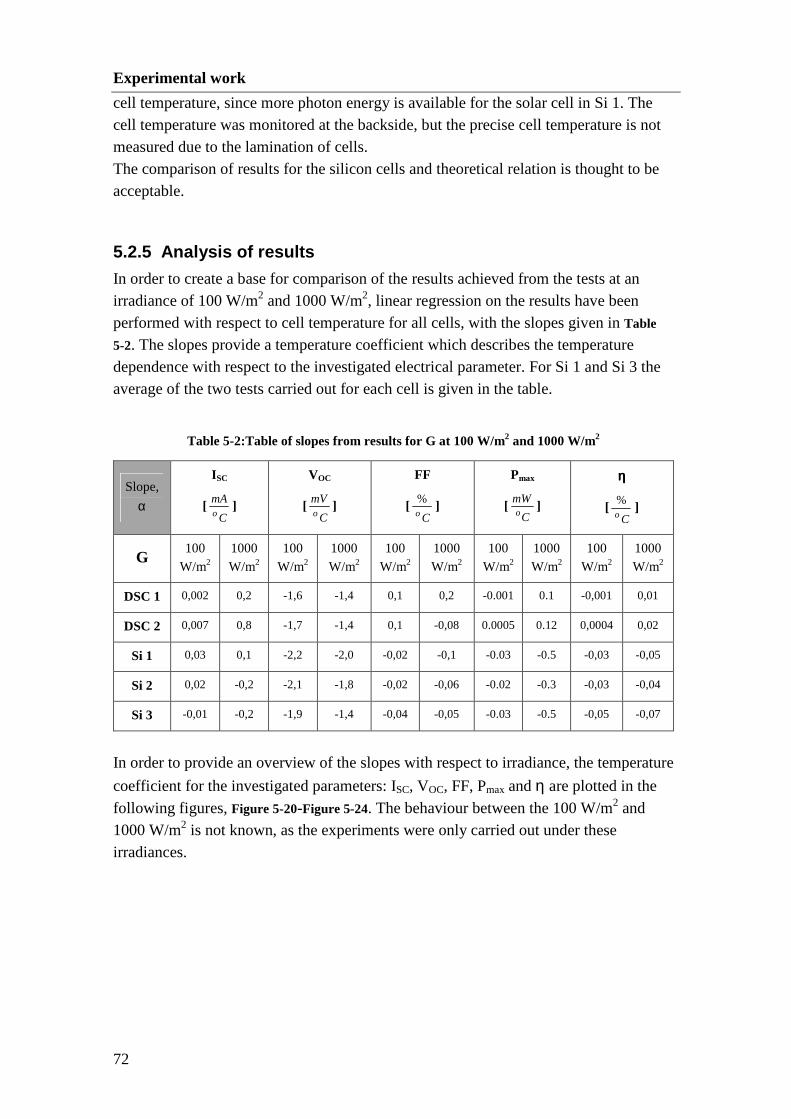
Experimental work
72
cell temperature, since more photon energy is available for the solar cell in Si 1. The cell temperature was monitored at the backside, but the precise cell temperature is not measured due to the lamination of cells. The comparison of results for the silicon cells and theoretical relation is thought to be acceptable.
5.2.5 Analysis of results
In order to create a base for comparison of the results achieved from the tests at an irradiance of 100 W/m2 and 1000 W/m2, linear regression on the results have been performed with respect to cell temperature for all cells, with the slopes given in Table
5-2. The slopes provide a temperature coefficient which describes the temperature dependence with respect to the investigated electrical parameter. For Si 1 and Si 3 the average of the two tests carried out for each cell is given in the table.
Table 5-2:Table of slopes from results for G at 100 W/m2 and 1000 W/m2
Slope,
α
ISC
[C
mAo
]
VOC
[C
mVo
]
FF
[Co
% ]
Pmax
[C
mWo
]
ηηηη
[Co
% ]
G 100
W/m2
1000
W/m2
100
W/m2
1000
W/m2
100
W/m2
1000
W/m2
100
W/m2
1000
W/m2
100
W/m2
1000
W/m2
DSC 1 0,002 0,2 -1,6 -1,4 0,1 0,2 -0.001 0.1 -0,001 0,01
DSC 2 0,007 0,8 -1,7 -1,4 0,1 -0,08 0.0005 0.12 0,0004 0,02
Si 1 0,03 0,1 -2,2 -2,0 -0,02 -0,1 -0.03 -0.5 -0,03 -0,05
Si 2 0,02 -0,2 -2,1 -1,8 -0,02 -0,06 -0.02 -0.3 -0,03 -0,04
Si 3 -0,01 -0,2 -1,9 -1,4 -0,04 -0,05 -0.03 -0.5 -0,05 -0,07
In order to provide an overview of the slopes with respect to irradiance, the temperature
coefficient for the investigated parameters: ISC, VOC, FF, Pmax and η are plotted in the following figures, Figure 5-20-Figure 5-24. The behaviour between the 100 W/m2 and 1000 W/m2 is not known, as the experiments were only carried out under these irradiances.

Experimental work
73
-0.4
-0.2
0
0.2
0.4
0.6
0.8
1
DSC 1 DSC 2 Si 1 Si 2 Si 3
Tem
pera
ture
coe
ffici
ent,
IS
C [m
A/o
C]
Figure 5-20: Temperature coefficient for ISC
As seen from Figure 5-20, it is difficult to conclude an overall behaviour of the temperature coefficient with respect to ISC for the DSCs. When comparing the DSC at 100 W/m2 and 1000 W/m2 the ISC-dependence of cell temperature is more positive at high irradiance levels. For the silicon cells the ISC-dependence is increasingly negative at 1 Sun for Si 2 and Si 3, and the temperature coefficient for Si 2 develop from being positive at low light levels to being negative for increased light intensity. A positive temperature effect on the ISC at G=1000 W/m2 is on the other hand seen for Si 1, which is minimized at low light intensity. The temperature coefficient only results in a minor change in ISC, as seen from the scale of the temperature coefficients determined for ISC.
-2.5
-2
-1.5
-1
-0.5
0DSC 1 DSC 2 Si 1 Si 2 Si 3
Tem
pera
ture
coe
ffici
ent,
VO
C [m
V/o
C]
Figure 5-21: Temperature coefficient for VOC
The influence of cell temperature on VOC is seen in Figure 5-21 for both an irradiance of 0.1 and 1 Sun where an increasing cell temperature will have a negative influence on the VOC. The negative temperature effect is seen to be reduced under high irradiance for both the DSC- and silicon cells when comparing the results for G=100W/m2 and G=1000 W/m2.
100 W/m2
1000 W/m2
100 W/m2
1000 W/m2

Experimental work
74
-0.2
-0.1
0
0.1
0.2
0.3
DSC 1 DSC 2 Si 1 Si 2 Si 3T
empe
ratu
re c
oeffi
cien
t, F
F [%
/oC
]
Figure 5-22: Temperature coefficient for FF
In Figure 5-22 the values for the temperature coefficient related to FF is illustrated. The dependence of cell temperature is seen to be negative for the silicon cells and for less than 1 Sun the negative dependence is seen to be increased especially for Si 1. A consistent relation between the temperature coefficient and irradiance level is not seen for the DSCs. For DSC 1, the positive temperature dependence on the fill factor is seen to be enhanced under greater illumination level, but the opposite tendency is seen for DSC 2, which is greatly reduced and negative for G=1000 W/m2. This deviation in result cannot be explained but it would be desired to carry out more experiments to identify a possible error measurement.
-0.6
-0.4
-0.2
0
0.2
DSC 1 DSC 2 Si 1 Si 2 Si 3
Tem
pera
ture
coe
ffici
ent,
Pm
ax [m
W/o
C]
Figure 5-23: Temperature coefficient for Pmax
The influence of cell temperature on power output at different irradiance intensities is shown in Figure 5-23. For the DSCs a well-corresponding tendency of increased positive temperature dependence under high illumination is seen. The difference in tendency for the DSCs is greatly reduced compared to the development of ISC and FF.
100 W/m2
1000 W/m2
100 W/m2
1000 W/m2
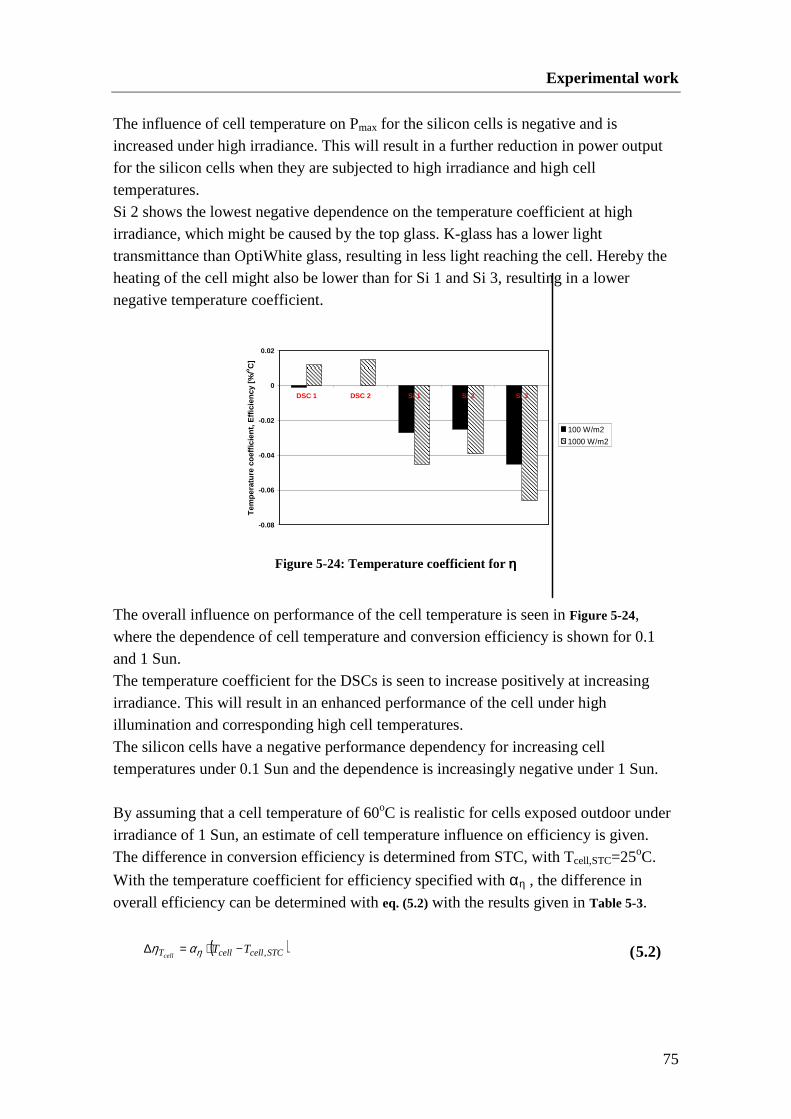
Experimental work
75
The influence of cell temperature on Pmax for the silicon cells is negative and is increased under high irradiance. This will result in a further reduction in power output for the silicon cells when they are subjected to high irradiance and high cell temperatures. Si 2 shows the lowest negative dependence on the temperature coefficient at high irradiance, which might be caused by the top glass. K-glass has a lower light transmittance than OptiWhite glass, resulting in less light reaching the cell. Hereby the heating of the cell might also be lower than for Si 1 and Si 3, resulting in a lower negative temperature coefficient.
-0.08
-0.06
-0.04
-0.02
0
0.02
DSC 1 DSC 2 Si 1 Si 2 Si 3
Tem
pera
ture
coe
ffici
ent,
Effi
cien
cy [%
/oC
]
Figure 5-24: Temperature coefficient for ηηηη
The overall influence on performance of the cell temperature is seen in Figure 5-24, where the dependence of cell temperature and conversion efficiency is shown for 0.1 and 1 Sun. The temperature coefficient for the DSCs is seen to increase positively at increasing irradiance. This will result in an enhanced performance of the cell under high illumination and corresponding high cell temperatures. The silicon cells have a negative performance dependency for increasing cell temperatures under 0.1 Sun and the dependence is increasingly negative under 1 Sun. By assuming that a cell temperature of 60oC is realistic for cells exposed outdoor under irradiance of 1 Sun, an estimate of cell temperature influence on efficiency is given. The difference in conversion efficiency is determined from STC, with Tcell,STC=25oC.
With the temperature coefficient for efficiency specified with αη , the difference in overall efficiency can be determined with eq. (5.2) with the results given in Table 5-3.
( )STCcellcellT TTcell ,−⋅=∆ ηαη ( 5.2)
100 W/m2
1000 W/m2

Experimental work
76
Table 5-3 Example of correction with temperature coefficient
G=1000 W/m2
Tcell=60oC DSC 1 DSC 2 Si 1 Si 2 Si 3
cellTη∆ [%] +0.42 +0.53 -1.56 -1.37 -2.32
100⋅∆
STC
Tcell
ηη
[%] +26.1 +41.7 -16.3 -18.0 -15.9
In Table 5-3 the effect of increased cell temperature related to STC is seen. For the DSCs a markedly increase in efficiency is seen, but the silicon cells show a negative temperature dependence which acts to minimize the conversion efficiency. The difference in conversion efficiency has been related to the standard test conditions, and it is clear that the DSC benefit under these more realistic cell temperatures.
5.2.6 Conclusion
The results from the experiments performed with respect to temperature dependence of the performance for DSC- and silicon cells indicate a positive dependence on the performance of the DSC under high illumination and increasing cell temperatures. The temperature coefficient with respect to conversion efficiency is seen to be negative for the tested silicon cells, which is enhanced under high irradiance levels. As the number of experiments carried out is very limited, it would be desired to carry out more experiments to investigate the reproducibility of results. The future tests should also be performed for more irradiance levels, as the electrical behaviour of the cells is not known between the irradiance of 100 W/m2 and 1000 W/m2. When relating the results for the silicon cells with posed relations of expected behaviour given in literature, good correspondence to Pmax at 1000 W/m2 is seen. Some deviations for ISC and VOC for the different cells are seen, but the overall output follows the temperature coefficients for Pmax and conversion efficiency. The results obtained in this investigation provide an indication of the temperature dependency of a DSC- and a silicon solar cell. When relating the results achieved it is clear that the tests carried out when classifying the solar cells under standard test conditions (see paragraph 3.2.1 Standard Test Conditions) favour the silicon cells, as the cell temperature is kept at 25oC. When considering realistic conditions, the cell temperature will likely be higher that 25oC when subjected to an irradiance of 1000 W/m2. Therefore the realistic conditions would give the DSC a better performance due to the positive temperature dependence under these light levels.
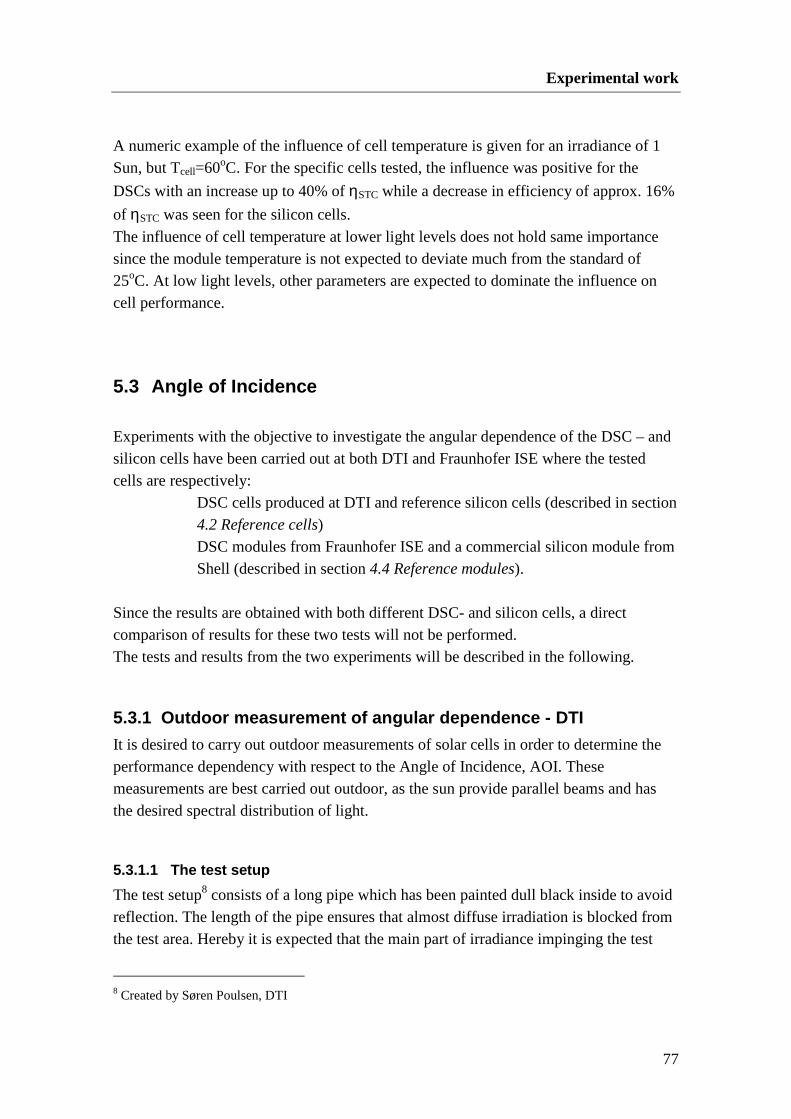
Experimental work
77
A numeric example of the influence of cell temperature is given for an irradiance of 1 Sun, but Tcell=60oC. For the specific cells tested, the influence was positive for the
DSCs with an increase up to 40% of ηSTC while a decrease in efficiency of approx. 16%
of ηSTC was seen for the silicon cells. The influence of cell temperature at lower light levels does not hold same importance since the module temperature is not expected to deviate much from the standard of 25oC. At low light levels, other parameters are expected to dominate the influence on cell performance.
5.3 Angle of Incidence Experiments with the objective to investigate the angular dependence of the DSC – and silicon cells have been carried out at both DTI and Fraunhofer ISE where the tested cells are respectively:
DSC cells produced at DTI and reference silicon cells (described in section 4.2 Reference cells) DSC modules from Fraunhofer ISE and a commercial silicon module from Shell (described in section 4.4 Reference modules).
Since the results are obtained with both different DSC- and silicon cells, a direct comparison of results for these two tests will not be performed. The tests and results from the two experiments will be described in the following.
5.3.1 Outdoor measurement of angular dependence - D TI
It is desired to carry out outdoor measurements of solar cells in order to determine the performance dependency with respect to the Angle of Incidence, AOI. These measurements are best carried out outdoor, as the sun provide parallel beams and has the desired spectral distribution of light.
5.3.1.1 The test setup
The test setup8 consists of a long pipe which has been painted dull black inside to avoid reflection. The length of the pipe ensures that almost diffuse irradiation is blocked from the test area. Hereby it is expected that the main part of irradiance impinging the test
8 Created by Søren Poulsen, DTI
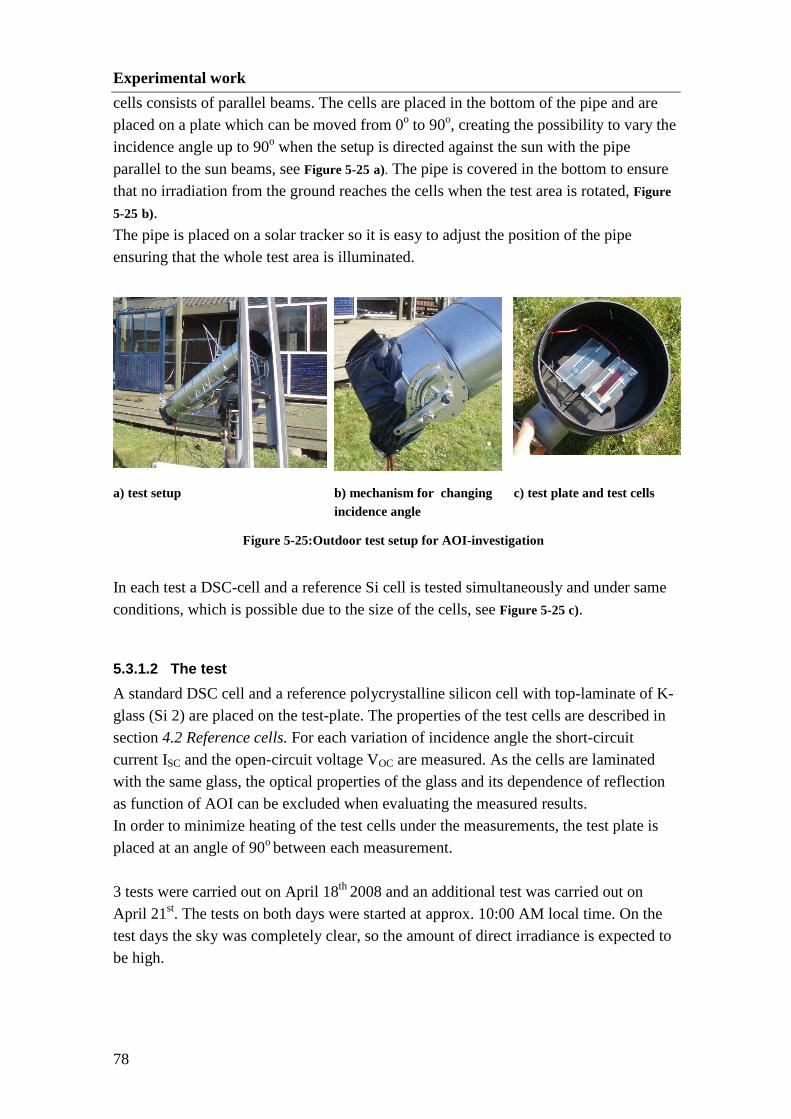
Experimental work
78
cells consists of parallel beams. The cells are placed in the bottom of the pipe and are placed on a plate which can be moved from 0o to 90o, creating the possibility to vary the incidence angle up to 90o when the setup is directed against the sun with the pipe parallel to the sun beams, see Figure 5-25 a). The pipe is covered in the bottom to ensure that no irradiation from the ground reaches the cells when the test area is rotated, Figure
5-25 b). The pipe is placed on a solar tracker so it is easy to adjust the position of the pipe ensuring that the whole test area is illuminated.
a) test setup b) mechanism for changing incidence angle
c) test plate and test cells
Figure 5-25:Outdoor test setup for AOI-investigation
In each test a DSC-cell and a reference Si cell is tested simultaneously and under same conditions, which is possible due to the size of the cells, see Figure 5-25 c).
5.3.1.2 The test
A standard DSC cell and a reference polycrystalline silicon cell with top-laminate of K-glass (Si 2) are placed on the test-plate. The properties of the test cells are described in section 4.2 Reference cells. For each variation of incidence angle the short-circuit current ISC and the open-circuit voltage VOC are measured. As the cells are laminated with the same glass, the optical properties of the glass and its dependence of reflection as function of AOI can be excluded when evaluating the measured results. In order to minimize heating of the test cells under the measurements, the test plate is placed at an angle of 90o between each measurement. 3 tests were carried out on April 18th 2008 and an additional test was carried out on April 21st. The tests on both days were started at approx. 10:00 AM local time. On the test days the sky was completely clear, so the amount of direct irradiance is expected to be high.
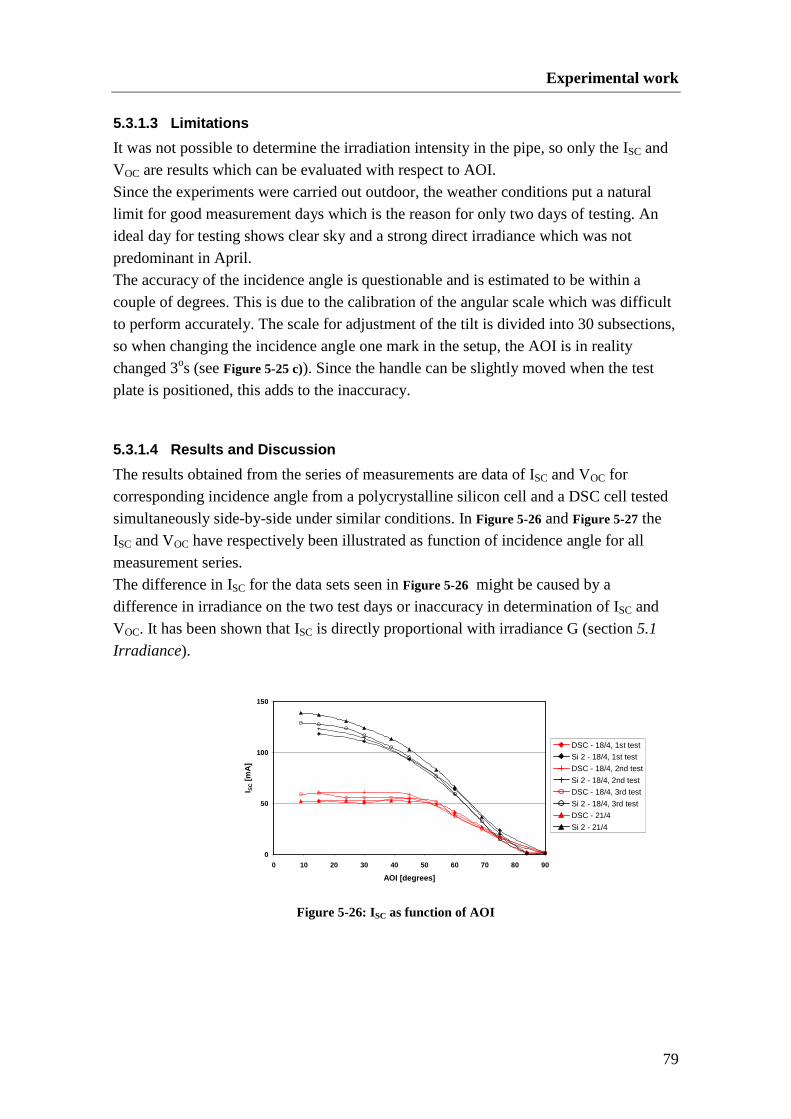
Experimental work
79
5.3.1.3 Limitations
It was not possible to determine the irradiation intensity in the pipe, so only the ISC and VOC are results which can be evaluated with respect to AOI. Since the experiments were carried out outdoor, the weather conditions put a natural limit for good measurement days which is the reason for only two days of testing. An ideal day for testing shows clear sky and a strong direct irradiance which was not predominant in April. The accuracy of the incidence angle is questionable and is estimated to be within a couple of degrees. This is due to the calibration of the angular scale which was difficult to perform accurately. The scale for adjustment of the tilt is divided into 30 subsections, so when changing the incidence angle one mark in the setup, the AOI is in reality changed 3os (see Figure 5-25 c)). Since the handle can be slightly moved when the test plate is positioned, this adds to the inaccuracy.
5.3.1.4 Results and Discussion
The results obtained from the series of measurements are data of ISC and VOC for corresponding incidence angle from a polycrystalline silicon cell and a DSC cell tested simultaneously side-by-side under similar conditions. In Figure 5-26 and Figure 5-27 the ISC and VOC have respectively been illustrated as function of incidence angle for all measurement series. The difference in ISC for the data sets seen in Figure 5-26 might be caused by a difference in irradiance on the two test days or inaccuracy in determination of ISC and VOC. It has been shown that ISC is directly proportional with irradiance G (section 5.1
Irradiance).
0
50
100
150
0 10 20 30 40 50 60 70 80 90
AOI [degrees]
I SC [m
A]
Figure 5-26: ISC as function of AOI
DSC - 18/4, 1st test
Si 2 - 18/4, 1st test
DSC - 18/4, 2nd test
Si 2 - 18/4, 2nd test
DSC - 18/4, 3rd test
Si 2 - 18/4, 3rd test
DSC - 21/4
Si 2 - 21/4
Experimental work
80
0
200
400
600
0 10 20 30 40 50 60 70 80 90
AOI [degrees]
VO
C [m
V]
Figure 5-27: VOC as function of AOI
Figure 5-27 illustrates that the VOC does not show great dependence of G but is reduced at high incidence angles corresponding to low light levels. Since variations in VOC is seen from an incidence angle of 75o and higher, it is thought that the data for incidence angles exceeding 75o are too uncertain and will therefore not be included in the further data analysis. The irradiance intensity G will decrease with cosine to incidence angle, which results in a decrease of measured ISC. By determining the relative ISC between the experimental
results ISC, α scaled to )cos(0, θ⋅oSCI , it can be investigated if the generated ISC follows the
cosine relation. o
SCI 0, has been determined from the experimental measurement of ISC at the lowest AOI,
according to eq. (3.7):
)cos(,
0, θθSCo
SCI
I =
The relative ISC as function of AOI is shown in Figure 5-28, given by:
)cos(
, Relative
0, αα
oSC
SCSC
I
II = ( 5.3)
DSC - 18/4, 1st test
Si 2 - 18/4, 1st test
DSC - 18/4, 2nd test
Si 2 - 18/4, 2nd test
DSC - 18/4, 3rd test
Si 2 - 18/4, 3rd test
DSC - 21/4
Si 2 - 21/4

Experimental work
81
0.4
0.6
0.8
1
1.2
1.4
1.6
1.8
0 10 20 30 40 50 60 70
AOI [degrees]
Rel
ativ
e I S
C [-
]
Figure 5-28: Relative ISC as function of AOI
From Figure 5-28 it is seen that the DSC perform better than expected from the cosine relation at increased incidence angles, since the relative ISC exceeds 1. This beneficial behaviour is thought to be caused by the oblique incidence angle, resulting in an elongated photon path in the active cell. The silicon cell shows a small increase in ISC for increased AOI until an incidence angle exceeding approx. 55o, which corresponds well with the critical incidence angle, Brewster’s Angle which is approx. 56o for float glass (see section 3.3.2 Theoretical
transmittance of float glass). For higher incidence angles, the relative ISC for the silicon cell is seen to drop for increasing incidence angles which is mainly due to the increased reflection of light at the cell surface. The relative ISC exceeding 1 was not expected from theory, and indicates the uncertainty in measurements. The results for the silicon cell are very similar, but variation in relative ISC for the DSC is seen. Therefore it is difficult to give a direct measure for how much better the DSC perform with respect to the silicon cell. In order to exclude the effect of reflection, the performance of the DSC and silicon cell is compared by taking the relation between relative ISC, DSC and relative ISC, Si. The results can be seen in Figure 5-29. From the graph it is possible to see an increasing advantage for the DSC cell over the silicon cell for increasing incidence angles. As the graphs deviate in results for increasing AOIs, it is difficult to give an estimate of the additional advantage of the ISC for the DSC at high incidence angles, but the result of the experiment indicate an advantage at increased incidence angles for the DSC over the silicon cell.
DSC - 18/4, 1st test
Si 2 - 18/4, 1st test
DSC - 18/4, 2nd test
Si 2 - 18/4, 2nd test
DSC - 18/4, 3rd test
Si 2 - 18/4, 3rd test
DSC - 21/4
Si 2 - 21/4
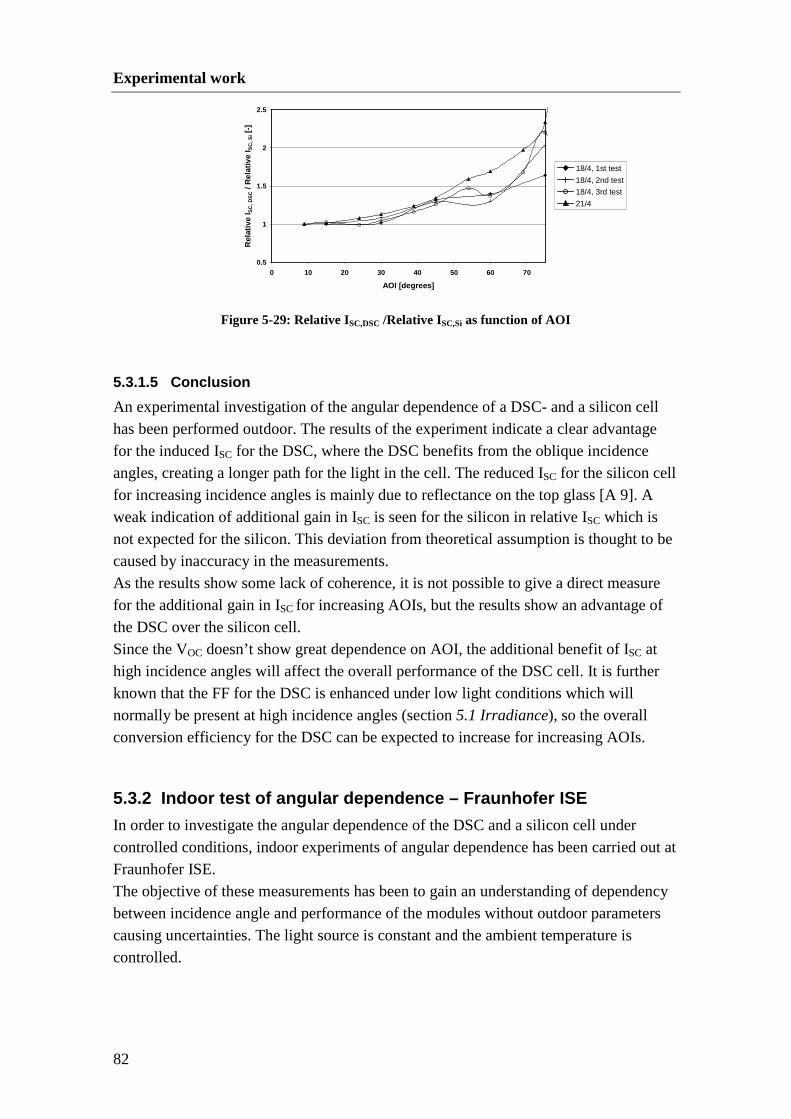
Experimental work
82
0.5
1
1.5
2
2.5
0 10 20 30 40 50 60 70
AOI [degrees]
Rel
ativ
e I S
C, D
SC /
Rel
ativ
e I S
C, S
i [-]
Figure 5-29: Relative ISC,DSC /Relative ISC,Si as function of AOI
5.3.1.5 Conclusion
An experimental investigation of the angular dependence of a DSC- and a silicon cell has been performed outdoor. The results of the experiment indicate a clear advantage for the induced ISC for the DSC, where the DSC benefits from the oblique incidence angles, creating a longer path for the light in the cell. The reduced ISC for the silicon cell for increasing incidence angles is mainly due to reflectance on the top glass [A 9]. A weak indication of additional gain in ISC is seen for the silicon in relative ISC which is not expected for the silicon. This deviation from theoretical assumption is thought to be caused by inaccuracy in the measurements. As the results show some lack of coherence, it is not possible to give a direct measure for the additional gain in ISC for increasing AOIs, but the results show an advantage of the DSC over the silicon cell. Since the VOC doesn’t show great dependence on AOI, the additional benefit of ISC at high incidence angles will affect the overall performance of the DSC cell. It is further known that the FF for the DSC is enhanced under low light conditions which will normally be present at high incidence angles (section 5.1 Irradiance), so the overall conversion efficiency for the DSC can be expected to increase for increasing AOIs.
5.3.2 Indoor test of angular dependence – Fraunhofe r ISE
In order to investigate the angular dependence of the DSC and a silicon cell under controlled conditions, indoor experiments of angular dependence has been carried out at Fraunhofer ISE. The objective of these measurements has been to gain an understanding of dependency between incidence angle and performance of the modules without outdoor parameters causing uncertainties. The light source is constant and the ambient temperature is controlled.
18/4, 1st test
18/4, 2nd test
18/4, 3rd test
21/4
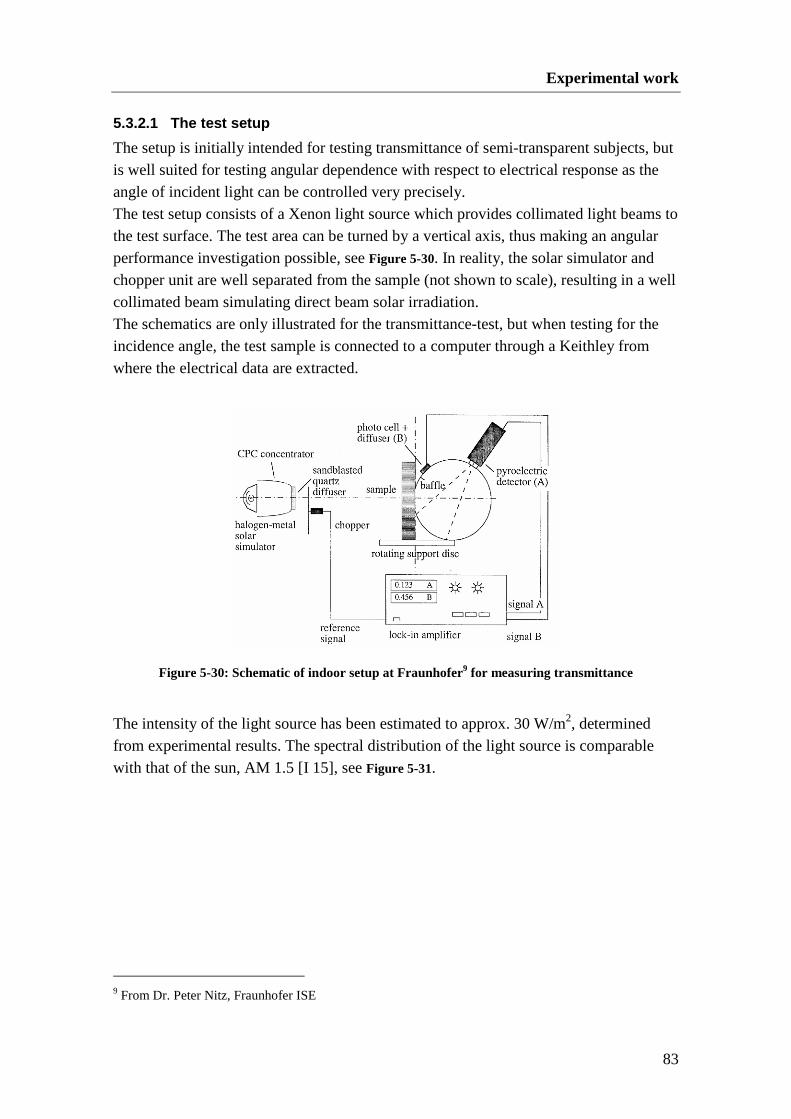
Experimental work
83
5.3.2.1 The test setup
The setup is initially intended for testing transmittance of semi-transparent subjects, but is well suited for testing angular dependence with respect to electrical response as the angle of incident light can be controlled very precisely. The test setup consists of a Xenon light source which provides collimated light beams to the test surface. The test area can be turned by a vertical axis, thus making an angular performance investigation possible, see Figure 5-30. In reality, the solar simulator and chopper unit are well separated from the sample (not shown to scale), resulting in a well collimated beam simulating direct beam solar irradiation. The schematics are only illustrated for the transmittance-test, but when testing for the incidence angle, the test sample is connected to a computer through a Keithley from where the electrical data are extracted.
Figure 5-30: Schematic of indoor setup at Fraunhofer 9 for measuring transmittance
The intensity of the light source has been estimated to approx. 30 W/m2, determined from experimental results. The spectral distribution of the light source is comparable with that of the sun, AM 1.5 [I 15], see Figure 5-31.
9 From Dr. Peter Nitz, Fraunhofer ISE

Experimental work
84
0
0.5
1
1.5
2
2.5
0 200 400 600 800 1000 1200 1400 1600
Wavelength [nm]
Dis
trib
utio
n [a
rbitr
ary
units
]
Figure 5-31: Spectral distribution of Xenon lamp, indoor AOI-setup
In the test setup the electrical characteristics of the test module will be determined from the configured IV-curve from where the key performance parameters: ISC, VOC, FF and Pmax can be extracted. The conversion efficiency is not determined as the irradiance intensity has only been estimated. Further, the module temperature on the backside is monitored by a thermo couple attached to a multimeter. Good thermal connection between thermo couple and the module is ensured by using heat conducting paste.
5.3.2.2 Limitations
The irradiance intensity at the test surface is limited to approx. 30 W/m2. As various solar cell technologies respond differently to the irradiance intensity, the possibility to test the modules at higher irradiance would be desired. The silicon cells have a lower limit for acceptance of light, which is seen in the dramatic drop in efficiency under low light conditions (seen in section 3.4.1.2 Irradiance Intensity) whereas the DSC on the other hand performs well under these low light conditions. Therefore it is desired that the angular effect for the two types of solar cells should also be determined under high irradiance.
5.3.2.3 The test
4 DSC modules and a commercial monocrystalline module, described in 4.4 Reference
modules were tested in the setup, see Figure 5-32.
Xenon lamp
sun - AM 1.5
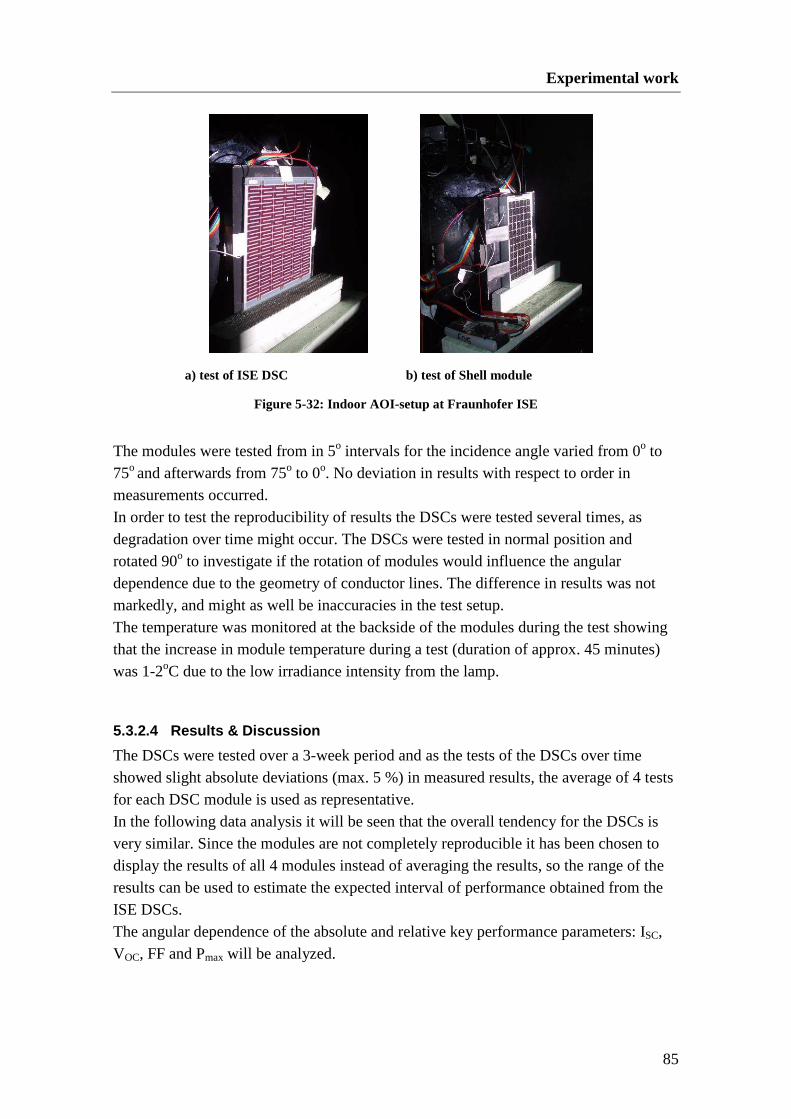
Experimental work
85
a) test of ISE DSC b) test of Shell module
Figure 5-32: Indoor AOI-setup at Fraunhofer ISE
The modules were tested from in 5o intervals for the incidence angle varied from 0o to 75o and afterwards from 75o to 0o. No deviation in results with respect to order in measurements occurred. In order to test the reproducibility of results the DSCs were tested several times, as degradation over time might occur. The DSCs were tested in normal position and rotated 90o to investigate if the rotation of modules would influence the angular dependence due to the geometry of conductor lines. The difference in results was not markedly, and might as well be inaccuracies in the test setup. The temperature was monitored at the backside of the modules during the test showing that the increase in module temperature during a test (duration of approx. 45 minutes) was 1-2oC due to the low irradiance intensity from the lamp.
5.3.2.4 Results & Discussion
The DSCs were tested over a 3-week period and as the tests of the DSCs over time showed slight absolute deviations (max. 5 %) in measured results, the average of 4 tests for each DSC module is used as representative. In the following data analysis it will be seen that the overall tendency for the DSCs is very similar. Since the modules are not completely reproducible it has been chosen to display the results of all 4 modules instead of averaging the results, so the range of the results can be used to estimate the expected interval of performance obtained from the ISE DSCs. The angular dependence of the absolute and relative key performance parameters: ISC, VOC, FF and Pmax will be analyzed.

Experimental work
86
0
0.01
0.02
0.03
0 20 40 60 80
AOI [Degrees]
I SC [A
]
0.7
0.8
0.9
1
1.1
1.2
0 20 40 60 80
AOI [Degrees]
Rel
ativ
e I S
C [-
]
0
4
8
12
16
0 20 40 60 80
AOI [Degrees]
VO
C [V
]
0.8
0.9
1
0 20 40 60 80
AOI [Degrees]
Rel
ativ
e V
OC [-
]
The relative ISC and relative Pmax is scaled according to the cosine relation, described in 3.2.2 Influence of Angle of Incidence, as the irradiance intensity is expected to decay with cosine to incidence angle. The remaining relative values are scaled to measurements at an incidence angle of 0o.
Figure 5-33: ISC and relative ISC as function of AOI
Figure 5-33 illustrates the angular dependence of ISC for the tested modules. It is interesting to consider the relative ISC which is seen to decrease at high incidence angles for the silicon module and does not exceed 1 in relative ISC. The DSCs show a different behaviour in generated ISC for increased AOIs, where the relative ISC is seen to be above 1 until an incidence angle of approx. 70o. The DSC benefits from the oblique incidence angles, which is expected to be caused by the longer path of light within the active cell. The maximum relative ISC, ranging from 1.05 to 1.11 for the DSCs is found at an AOI of approx. 55o, well-corresponding to Brewster’s Angle, where reflection from the p-polarized component is zero (section 3.3.2 Theoretical transmittance of float glass).
Figure 5-34: VOC and relative VOC as function of AOI
When considering the VOC as function of AOI, not a great dependence is seen. The relative decay in VOC is highest for the silicon cell, which can be related to the
ISE DSC 1
ISE DSC 2
ISE DSC 3
ISE DSC 4
Shell
ISE DSC 1
ISE DSC 2
ISE DSC 3
ISE DSC 4
Shell

Experimental work
87
60
65
70
75
0 20 40 60 80
AOI [Degrees]
FF
[%]
0.85
0.9
0.95
1
0 20 40 60 80
AOI [Degrees]
Rel
ativ
e F
F [-
]
0
4
8
12
0 20 40 60 80
AOI [Degrees]
Pm
ax [W
]
0.5
0.6
0.7
0.8
0.9
1
1.1
0 20 40 60 80
AOI [Degrees]
Rel
ativ
e P
max
[-]
logarithmic decrease in VOC under low light conditions. The negative VOC-dependence of irradiance is not as markedly for the DSCs. These results are not compared to the theoretical VOC-expression, as the test conditions differs from STC.
Figure 5-35: FF and relative FF as function of AOI
The Fill Factor is seen to decrease as incidence angle is increased for both the silicon- and the DSC modules, Figure 5-35 which is due to the very low light level of the test setup.
Figure 5-36: Pmax and relative Pmax as function of AOI
The power output of the modules is function of the investigated parameters: ISC, VOC and FF. For increasing incidence angles, Pmax, Figure 5-36, is seen to decrease due to the reduction of ISC, VOC and FF and hence the input power in the form of irradiance is reduced, when AOI is increased. The relative Pmax is determined by the following due to the expected cosine dependence of reduction in incident irradiance for increasing incidence angles.
ISE DSC 1
ISE DSC 2
ISE DSC 3
ISE DSC 4
Shell
ISE DSC 1
ISE DSC 2
ISE DSC 3
ISE DSC 4
Shell

Experimental work
88
[ ] )cos()cos( Re
0max,
max,
0
max,
cosmax,
max,max θθ
θθθ⋅
=⋅⋅⋅
==oo P
P
FFVI
P
P
PPlative
OCSCine ( 5.4)
The relative Pmax will also reflect the relative conversion efficiency, since the reduction in illumination is taken into account. The decrease in relative Pmax is greater for the silicon cell than for the DSCs. This can be attributed to the ISC-dependence for increasing incidence angles, which was seen to be continuously reduced for the silicon cell. The DSCs showed a positive ISC-dependence to incidence angles up to 70o which results in a relative Pmax exceeding 1 until an incidence angle of approximately 55o. For incidence angles higher than 55o it is assumed that the influence of reflection at the top glass is more dominant than the benefit of longer path for the photon in the DSC. The difference in relative Pmax for the silicon- and the DSC modules is markedly and increases for increasing incidence angles reaching up to approx. 28 % at the incidence angle of 75o.
5.3.2.5 Conclusion
An investigation of the angular dependence for 4 DSC modules and one commercial monocrystalline module has been carried out indoor under controlled conditions. The incidence angle has been varied with very good accuracy due to the mechanisms of the test setup. The results obtained indicate the performance dependency of ISC, VOC, FF and Pmax with respect to incidence angle for the two types of solar cell technologies. Since the test has been carried out under a very low illumination (approx. 30 W/m2) it is not known if the results are affected by the test conditions which might benefit the DSC. The result for ISC as function of incidence angle is seen to decrease for the silicon cell due to enhanced reflection of the top glass for increasing AOIs. The DSCs show a beneficial behavior under oblique incidence angles, where the relative ISC scaled to the cosine relation is seen to be above 1 for incidence angles up to 70o. As the relative VOC and FF is seen to decrease for increasing AOIs for both the silicon and DSC modules, the difference in relative Pmax for the two types of modules is due to the different dependence of ISC. The relative Pmax is seen to differ up to 28% for the DSCs and silicon module at the highest measured AOI (75o), with the advantage to the DSC. The reflectance of glass is seen to hold a prominent influence at high incidence angles, reducing the expected power output up to 20 % for the DSC and 40% for the Shell module.

Experimental work
89
5.3.3 Conclusion of experiments for angular depende nce
Two experiments with the objective to investigate the performance dependency of incidence angle for DSC and silicon cells have been carried out. This will be a collective conclusion for the two experiments where only the overall tendencies will be compared for the two experiments. As the cells tested are not similar, a direct comparison of absolute values is not thought to be relevant. Further the irradiance level and conditions were very different. One experiment was performed in a controlled lab environment and the DSC modules available showed good reproducible results. Four DSC modules and one commercial monocrystalline silicon module was tested. The other experiment was performed outdoor where one DSC and one small-scale silicon cell were tested. The overall tendency seen for DSC behaviour with respect to ISC indicate that this technology benefit from the oblique incidence angles, as the path for light penetrating the active layer of the solar cell is elongated. Therefore the relative ISC is above 1 until high incidence angles occur. For the silicon a decrease in relative ISC is seen for increasing incidence angles mainly affected by the enhanced reflection of the top glass at high incidence angles. This result for ISC is in good correspondence with experimental results posed in the literature, where the same beneficial effect of ISC for increasing incidence angles was seen for a tested DSC (described in section 3.4.2.1 Angle of Incidence). For both experiments a reduction in VOC for enhanced incidence angles is seen for DSC and silicon cells with the strongest dependence seen for the silicon cells. The overall performance seen in the results for the indoor experiment gives the DSC an advantage in relative generated power Pmax as well as conversion efficiency when scaled to the expected cosine dependence. The influence of the reflection from the top glass is evident at high incidence angle which results in a lowering of expected power output, due to the enhanced reflection. This also results in minimizing the effect of longer path for the photon in the DSC at oblique incidence angles so the beneficial results in reality are not very dominant.

Experimental work
90
5.4 Outdoor measurements In order to create a base for comparison of a silicon- and DSC module under realistic operating conditions as well as achieving an understanding of DSC performance for modules at different tilts, an outdoor setup was prepared and installed. The objective with the setup was to achieve measurements over a prolonged period under realistic conditions so the results from the individual, controlled experiments could be compared, in order to verify if the results obtained under idealized conditions is seen in performance under realistic operating conditions. The outdoor setup was established at Fraunhofer ISE, where the measurements were started mid June 2008 and has been running continuously. The data set has been evaluated from June 16th 2008 until July 9th 2008, due to the time limitation of the thesis.
5.4.1 The test setup
The outdoor setup, see Figure 5-37 consists of 3 ISE DSC modules positioned in 0o, 45o and 90o and a reference mono crystalline module positioned in an angle of 45o. The modules are described in section 4.4 Reference modules.
Figure 5-37: Outdoor test setup for measuring AOI-dependence of 3 DSC-modules and 1 mono-Si-module
The setup is south-oriented and placed on the roof of Fraunhofer ISE (latitude: 48.0106o N, longitude: 7.8358o E).
DSC, 45o
DSC, 0o
Shell, 45o
DSC, 90o
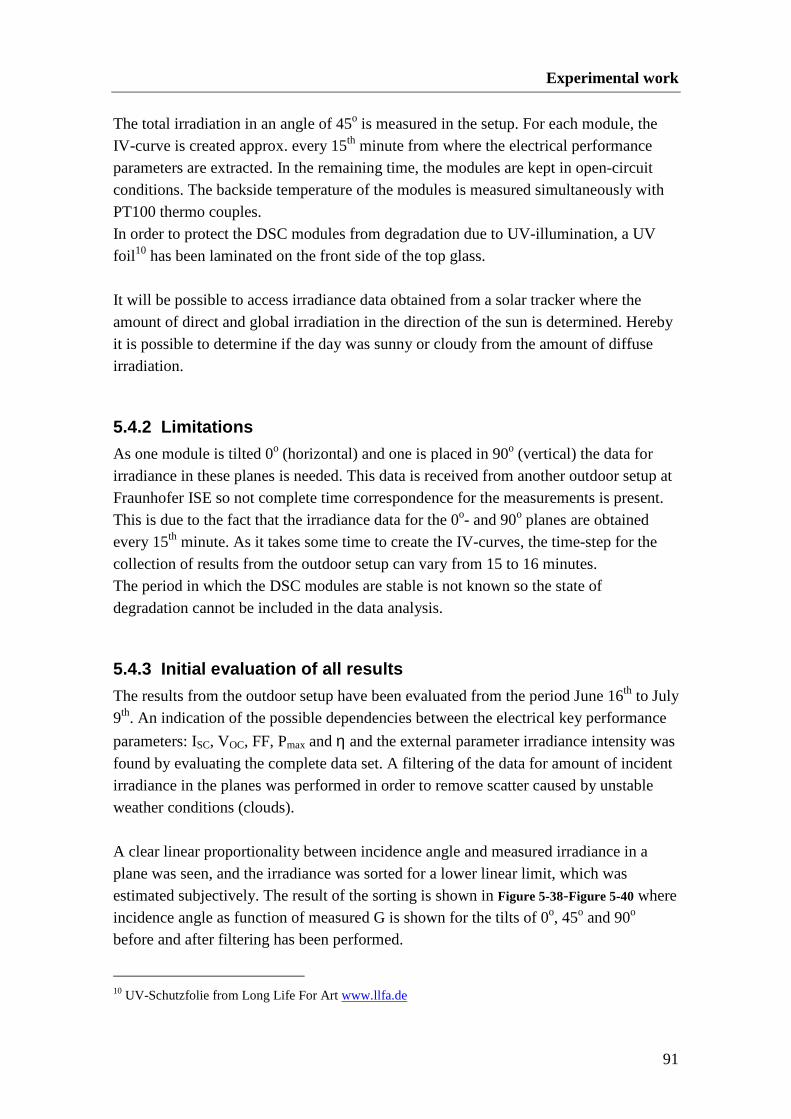
Experimental work
91
The total irradiation in an angle of 45o is measured in the setup. For each module, the IV-curve is created approx. every 15th minute from where the electrical performance parameters are extracted. In the remaining time, the modules are kept in open-circuit conditions. The backside temperature of the modules is measured simultaneously with PT100 thermo couples. In order to protect the DSC modules from degradation due to UV-illumination, a UV foil 10 has been laminated on the front side of the top glass. It will be possible to access irradiance data obtained from a solar tracker where the amount of direct and global irradiation in the direction of the sun is determined. Hereby it is possible to determine if the day was sunny or cloudy from the amount of diffuse irradiation.
5.4.2 Limitations
As one module is tilted 0o (horizontal) and one is placed in 90o (vertical) the data for irradiance in these planes is needed. This data is received from another outdoor setup at Fraunhofer ISE so not complete time correspondence for the measurements is present. This is due to the fact that the irradiance data for the 0o- and 90o planes are obtained every 15th minute. As it takes some time to create the IV-curves, the time-step for the collection of results from the outdoor setup can vary from 15 to 16 minutes. The period in which the DSC modules are stable is not known so the state of degradation cannot be included in the data analysis.
5.4.3 Initial evaluation of all results
The results from the outdoor setup have been evaluated from the period June 16th to July 9th. An indication of the possible dependencies between the electrical key performance
parameters: ISC, VOC, FF, Pmax and η and the external parameter irradiance intensity was found by evaluating the complete data set. A filtering of the data for amount of incident irradiance in the planes was performed in order to remove scatter caused by unstable weather conditions (clouds). A clear linear proportionality between incidence angle and measured irradiance in a plane was seen, and the irradiance was sorted for a lower linear limit, which was estimated subjectively. The result of the sorting is shown in Figure 5-38-Figure 5-40 where incidence angle as function of measured G is shown for the tilts of 0o, 45o and 90o before and after filtering has been performed.
10 UV-Schutzfolie from Long Life For Art www.llfa.de
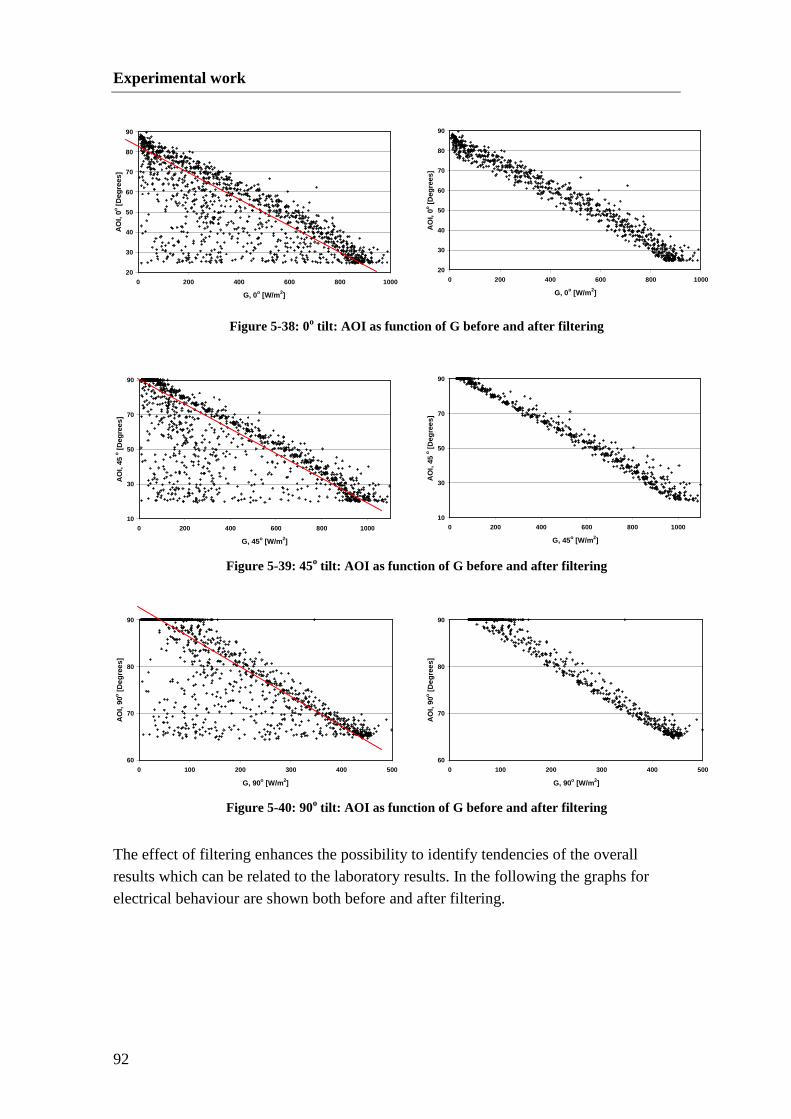
Experimental work
92
20
30
40
50
60
70
80
90
0 200 400 600 800 1000
G, 0o [W/m 2]
AO
I, 0
o [Deg
rees
]
10
30
50
70
90
0 200 400 600 800 1000
G, 45o [W/m2]
AO
I, 45
o [D
egre
es]
10
30
50
70
90
0 200 400 600 800 1000
G, 45o [W/m2]
AO
I, 45
o [D
egre
es]
60
70
80
90
0 100 200 300 400 500
G, 90o [W/m2]
AO
I, 90
o [D
egre
es]
60
70
80
90
0 100 200 300 400 500
G, 90o [W/m2]
AO
I, 90
o [D
egre
es]
20
30
40
50
60
70
80
90
0 200 400 600 800 1000
G, 0o [W/m 2]
AO
I, 0o [D
egre
es]
Figure 5-38: 0o tilt: AOI as function of G before and after filter ing
Figure 5-39: 45o tilt: AOI as function of G before and after filter ing
Figure 5-40: 90o tilt: AOI as function of G before and after filter ing
The effect of filtering enhances the possibility to identify tendencies of the overall results which can be related to the laboratory results. In the following the graphs for electrical behaviour are shown both before and after filtering.

Experimental work
93
0
0.5
1
1.5
0 200 400 600 800 1000 1200
G [W/m2]
I SC [A
]
0
0.5
1
1.5
0 200 400 600 800 1000 1200
G [W/m 2]
I SC [A
]
0
5
10
15
20
25
0 200 400 600 800 1000 1200
G [W/m 2]
VO
C [V
]
0
5
10
15
20
25
0 200 400 600 800 1000 1200
G [W/m 2]
VO
C [V
]
Figure 5-41: ISC as function of G - before and after filtering
ISC is seen to be directly proportional with irradiance G for all modules measured, Figure
5-41. The measured ISC as function of G for the DSC modules is very comparable with an indication that the DSC90
o has a slightly higher short-circuit current than the other
DSC modules.
Figure 5-42: VOC as function of G - before and after filtering
VOC as function of G, shown in Figure 5-42, indicates the logarithmic dependence of VOC as function of G for the Shell module since a decay in VOC under low light levels is identified. The open-circuit voltage for the DSC modules is low compared to the silicon module and the overall view of VOC for the DSCs shows an independence of irradiance level G.
DSC_0 deg
DSC_45 deg
DSC_90 deg
Shell_45 deg
DSC_0 deg
DSC_45 deg
DSC_90 deg
Shell_45 deg
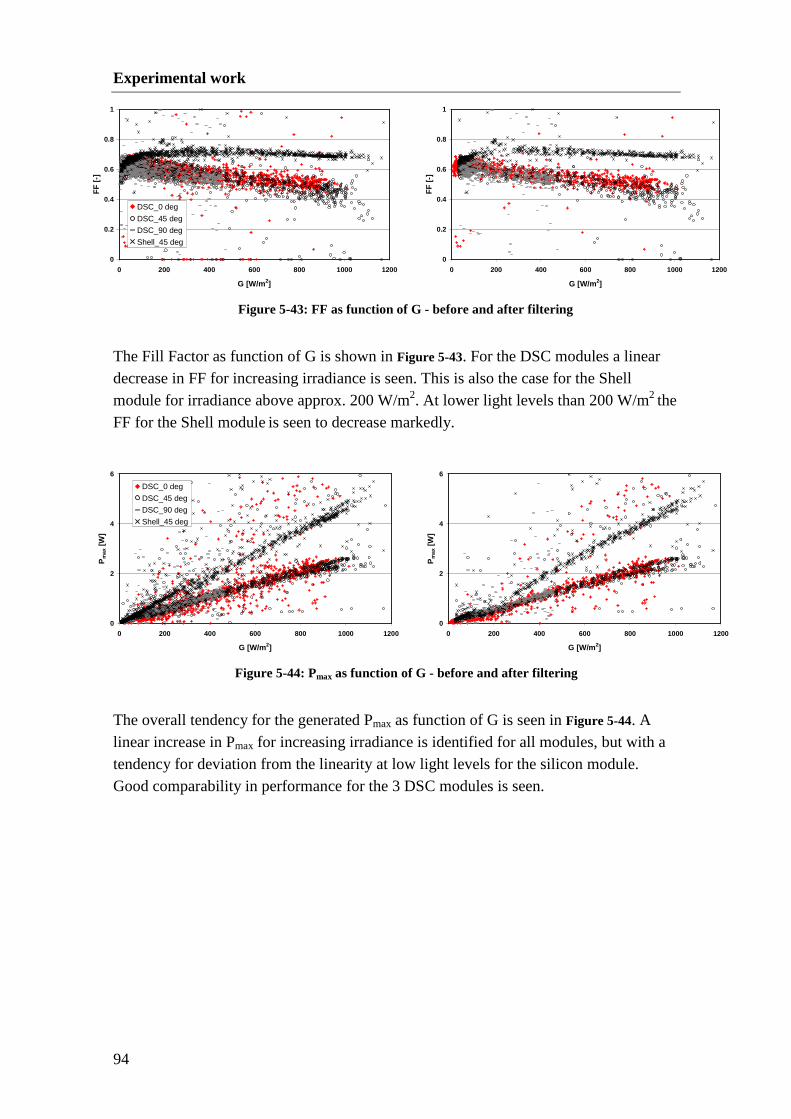
Experimental work
94
0
0.2
0.4
0.6
0.8
1
0 200 400 600 800 1000 1200
G [W/m 2]
FF
[-]
0
0.2
0.4
0.6
0.8
1
0 200 400 600 800 1000 1200
G [W/m2]
FF
[-]
0
2
4
6
0 200 400 600 800 1000 1200
G [W/m2]
Pm
ax [W
]
0
2
4
6
0 200 400 600 800 1000 1200
G [W/m 2]
Pm
ax [W
]
Figure 5-43: FF as function of G - before and after filtering
The Fill Factor as function of G is shown in Figure 5-43. For the DSC modules a linear decrease in FF for increasing irradiance is seen. This is also the case for the Shell module for irradiance above approx. 200 W/m2. At lower light levels than 200 W/m2 the FF for the Shell module is seen to decrease markedly.
Figure 5-44: Pmax as function of G - before and after filtering
The overall tendency for the generated Pmax as function of G is seen in Figure 5-44. A linear increase in Pmax for increasing irradiance is identified for all modules, but with a tendency for deviation from the linearity at low light levels for the silicon module. Good comparability in performance for the 3 DSC modules is seen.
DSC_0 deg
DSC_45 deg
DSC_90 deg
Shell_45 deg
DSC_0 deg
DSC_45 deg
DSC_90 deg
Shell_45 deg

Experimental work
95
0
5
10
15
0 200 400 600 800 1000 1200
G [W/m 2]
Con
vers
ion
Effi
cien
cy [%
]
0
5
10
15
0 200 400 600 800 1000 1200
G [W/m 2]
Con
vers
ion
Effi
cien
cy [%
]
Figure 5-45: ηηηη as function of G - before and after filtering
As a final measure for module performance the conversion efficiency as function of irradiance G is seen in Figure 5-45. The effect of filtering is seen to hold great importance, as the dependencies between conversion efficiency and G is clearer. The efficiency for the silicon module is seen to be greatest under high irradiance and decreases logarithmically under lowered light levels. The same dependence is not identified for the DSC modules, where the efficiency is seen to be slightly higher under reduced light levels (less than 0.5 Sun) than seen under full sun. A markedly increase in efficiency under light levels below 100 W/m2 is seen for the DSC modules, but since the amount of scatter is great and these low light levels causes greater uncertainty in the accuracy of the measurements, this behaviour has to be investigated further.
5.4.4 Evaluation of one sunny day
One sunny day from the data set has been evaluated to enable a qualitative comparison of the module performance with respect to technology and position. The selected day is July 1st as this day exhibits the least variation in measured irradiance. The distribution of irradiance, ambient temperature as well as module temperature measured for 0o, 45o and 90o tilt is shown in Figure 5-46. Further, the calculated incidence angles in the three planes are shown in Figure 5-47. The incidence angle has been calculated by the method described in Appendix A Method for calculating Angle of
incidence.
DSC_0 deg
DSC_45 deg
DSC_90 deg
Shell_45 deg

Experimental work
96
0
200
400
600
800
1000
0 4 8 12 16 20 24
Local time [hours]
G [W
/m2 ]
0
20
40
60
80
100
T [
oC
]
0
200
400
600
800
1000
0 4 8 12 16 20 24
Local time [hours]
G [W
/m2 ]
10
30
50
70
90
AO
I [D
egre
es]
Figure 5-46: July 1st – Irradiance and Tmodule as function of local time
Figure 5-47: July 1st – Irradiance and incidence angle as function of local time
From Figure 5-46 it is seen that the maximum irradiance is measured in the plane of 45o, but the amount of irradiance in the 0o tilted plane exceeds that in the morning and afternoon. The irradiance measured in the vertical plane is markedly lower than seen for the other planes. It is seen that the temperature distribution doesn’t follow the irradiance completely. The peak for maximum irradiance and maximum module temperature is found at the same time, but the module temperature decreases less in the afternoon, due to the higher ambient temperature. Figure 5-47 illustrates the relation between incidence angle and measured irradiance where it is seen that the lowest incidence angle is found at solar noon, where the irradiance is also at its maximum for all planes. In order to clarify that the day was sunny, the distribution of solar irradiance is looked upon. A sunny day is characterized by a very low amount of diffuse irradiance, since not much irradiance is scattered by to clouds, as described in section 3.1 Solar
Irradiation. The distribution of solar irradiance on July 1st has been obtained from a solar tracker and is shown in Figure 5-48. The measured irradiance cannot be compared to the other measurements of irradiance in the setup, as the pyranometer in the setup is fixed facing south. From the distribution seen in Figure 5-48, the amount of diffuse irradiance is below 100 W/m2 the entire day, so the day is assumed to be a sunny day with clear sky.
G_0 deg
G_45 deg
G_90 deg
AOI, 0 deg
AOI, 45 deg
AOI, 90 deg
G_0 deg
G_45 deg
G_90 deg
Tmodule, 0 deg
Tmodule, 45 deg
Tmodule, 90 deg
Tambient
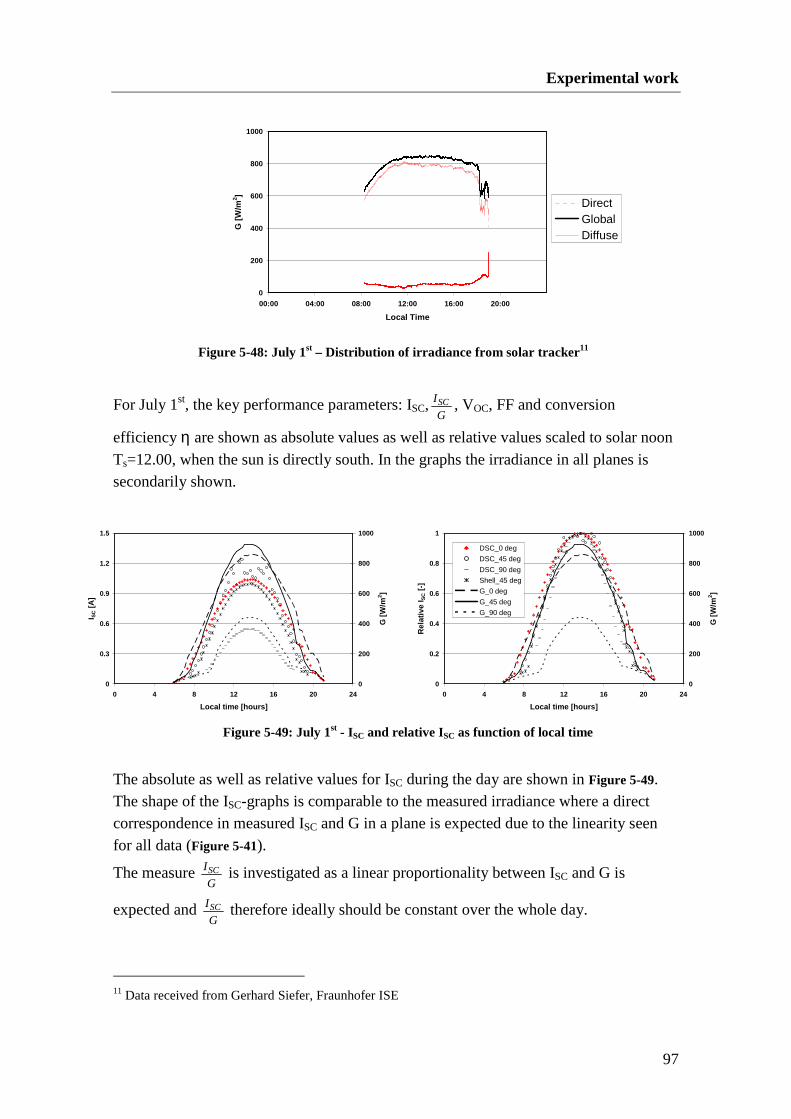
Experimental work
97
0
0.3
0.6
0.9
1.2
1.5
0 4 8 12 16 20 24
Local time [hours]
I SC [A
]
0
200
400
600
800
1000
G [W
/m2 ]
0
0.2
0.4
0.6
0.8
1
0 4 8 12 16 20 24
Local time [hours]
Rel
ativ
e I S
C [-
]
0
200
400
600
800
1000
G [W
/m2 ]
0
200
400
600
800
1000
00:00 04:00 08:00 12:00 16:00 20:00
Local Time
G [W
/m2 ]
Figure 5-48: July 1st – Distribution of irradiance from solar tracker 11
For July 1st, the key performance parameters: ISC,G
ISC , VOC, FF and conversion
efficiency η are shown as absolute values as well as relative values scaled to solar noon Ts=12.00, when the sun is directly south. In the graphs the irradiance in all planes is secondarily shown.
Figure 5-49: July 1st - ISC and relative ISC as function of local time
The absolute as well as relative values for ISC during the day are shown in Figure 5-49. The shape of the ISC-graphs is comparable to the measured irradiance where a direct correspondence in measured ISC and G in a plane is expected due to the linearity seen for all data (Figure 5-41).
The measure G
ISC is investigated as a linear proportionality between ISC and G is
expected and G
ISC therefore ideally should be constant over the whole day.
11 Data received from Gerhard Siefer, Fraunhofer ISE
DirectGlobalDiffuse
DSC_0 deg
DSC_45 deg
DSC_90 deg
Shell_45 deg
G_0 deg
G_45 deg
G_90 deg

Experimental work
98
0
0.0003
0.0006
0.0009
0.0012
0.0015
0 4 8 12 16 20 24
Local time [hours]
I SC/G
[A/(
W/m
2 )]
0
200
400
600
800
1000
G [W
/m2 ]
0.2
0.4
0.6
0.8
1
1.2
0 4 8 12 16 20 24
Local time [hours]
Rel
ativ
e I S
C/G
[-]
0
200
400
600
800
1000
G [W
/m2 ]
0
4
8
12
16
20
0 4 8 12 16 20 24
Local time [hours]
VO
C [V
]
0
200
400
600
800
1000
G [W
/m2 ]
0.9
0.95
1
1.05
1.1
1.15
0 4 8 12 16 20 24
Local time [hours]
Rel
ativ
e V
OC [-
]
0
200
400
600
800
1000
G [W
/m2 ]
Figure 5-50: July 1st - G
ISC and relative G
ISC as function of local time
Figure 5-50 illustrates both G
ISC and relative G
ISC as function of time. The expected
constancy is not seen as G
ISC decreases almost symmetrically around solar noon. This is
due to increased reflection at the top-glass of the modules when the incidence angle is increased. Less light will therefore reach the active solar cell, resulting in a deviation from the linear proportionality between ISC and G. The tendency of the graphs is quite
similar for all modules as seen in the graphs for relativeG
ISC .
Figure 5-51: July 1st - VOC and relative VOC as function of local time
The VOC during the day is seen in Figure 5-51. The Shell module has a high open-circuit voltage compared to the DSCs and also exhibits greater variations in VOC than the DSCs over the day. In the morning/evening situation where low irradiance levels occur the VOC is seen to decrease for both DSCs and the silicon module. For all modules it is seen that the relative VOC is highest in the morning, and then seems to decrease over the day. This is suspected to be due to the temperature dependence on VOC, which decreases for increasing module temperatures, identified in section 5.2 Cell
DSC_0 deg
DSC_45 deg
DSC_90 deg
Shell_45 deg
G_0 deg
G_45 deg
G_90 deg
DSC_0 deg
DSC_45 deg
DSC_90 deg
Shell_45 deg
G_0 deg
G_45 deg
G_90 deg
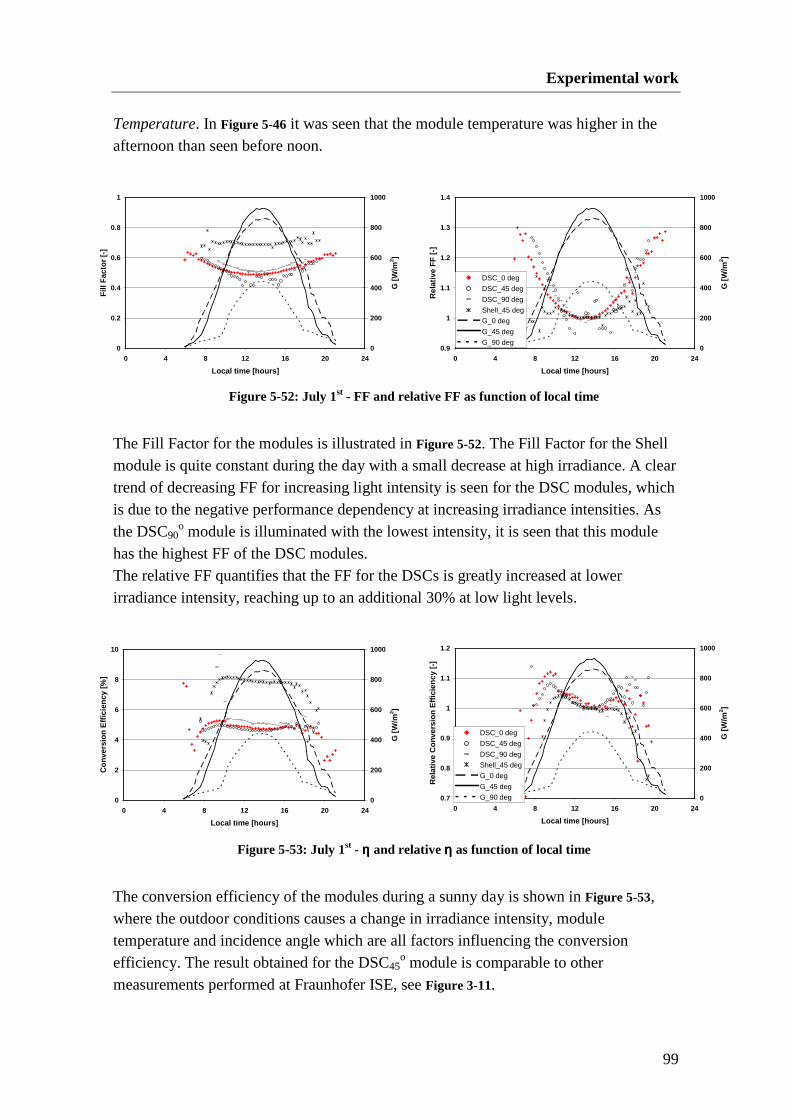
Experimental work
99
0
0.2
0.4
0.6
0.8
1
0 4 8 12 16 20 24
Local time [hours]
Fill
Fac
tor
[-]
0
200
400
600
800
1000
G [W
/m2 ]
0.9
1
1.1
1.2
1.3
1.4
0 4 8 12 16 20 24
Local time [hours]
Rel
ativ
e F
F [-
]
0
200
400
600
800
1000
G [W
/m2 ]
0
2
4
6
8
10
0 4 8 12 16 20 24
Local time [hours]
Con
vers
ion
Effi
cien
cy [%
]
0
200
400
600
800
1000
G [W
/m2 ]
0.7
0.8
0.9
1
1.1
1.2
0 4 8 12 16 20 24
Local time [hours]
Rel
ativ
e C
onve
rsio
n E
ffici
ency
[-]
0
200
400
600
800
1000
G [W
/m2 ]
Temperature. In Figure 5-46 it was seen that the module temperature was higher in the afternoon than seen before noon.
Figure 5-52: July 1st - FF and relative FF as function of local time
The Fill Factor for the modules is illustrated in Figure 5-52. The Fill Factor for the Shell module is quite constant during the day with a small decrease at high irradiance. A clear trend of decreasing FF for increasing light intensity is seen for the DSC modules, which is due to the negative performance dependency at increasing irradiance intensities. As the DSC90
o module is illuminated with the lowest intensity, it is seen that this module has the highest FF of the DSC modules. The relative FF quantifies that the FF for the DSCs is greatly increased at lower irradiance intensity, reaching up to an additional 30% at low light levels.
Figure 5-53: July 1st - ηηηη and relative ηηηη as function of local time
The conversion efficiency of the modules during a sunny day is shown in Figure 5-53, where the outdoor conditions causes a change in irradiance intensity, module temperature and incidence angle which are all factors influencing the conversion efficiency. The result obtained for the DSC45
o module is comparable to other measurements performed at Fraunhofer ISE, see Figure 3-11.
DSC_0 deg
DSC_45 deg
DSC_90 deg
Shell_45 deg
G_0 deg
G_45 deg
G_90 deg
DSC_0 deg
DSC_45 deg
DSC_90 deg
Shell_45 deg
G_0 deg
G_45 deg
G_90 deg
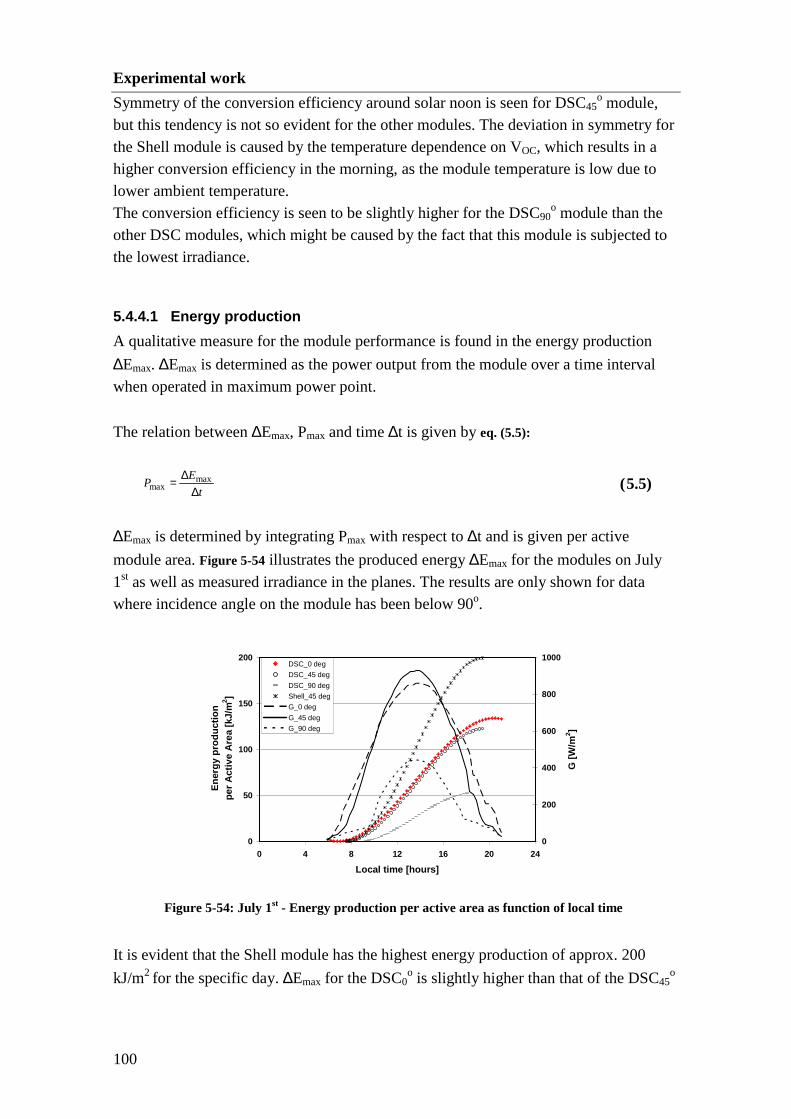
Experimental work
100
Symmetry of the conversion efficiency around solar noon is seen for DSC45o module,
but this tendency is not so evident for the other modules. The deviation in symmetry for the Shell module is caused by the temperature dependence on VOC, which results in a higher conversion efficiency in the morning, as the module temperature is low due to lower ambient temperature. The conversion efficiency is seen to be slightly higher for the DSC90
o module than the other DSC modules, which might be caused by the fact that this module is subjected to the lowest irradiance.
5.4.4.1 Energy production
A qualitative measure for the module performance is found in the energy production
∆Emax. ∆Emax is determined as the power output from the module over a time interval when operated in maximum power point.
The relation between ∆Emax, Pmax and time ∆t is given by eq. (5.5):
t
EP
∆∆= max
max ( 5.5)
∆Emax is determined by integrating Pmax with respect to ∆t and is given per active
module area. Figure 5-54 illustrates the produced energy ∆Emax for the modules on July 1st as well as measured irradiance in the planes. The results are only shown for data where incidence angle on the module has been below 90o.
0
50
100
150
200
0 4 8 12 16 20 24
Local time [hours]
Ene
rgy
prod
uctio
n pe
r A
ctiv
e A
rea
[kJ/
m2 ]
0
200
400
600
800
1000
G [W
/m2 ]
Figure 5-54: July 1st - Energy production per active area as function of local time
It is evident that the Shell module has the highest energy production of approx. 200
kJ/m2 for the specific day. ∆Emax for the DSC0o is slightly higher than that of the DSC45
o
DSC_0 deg
DSC_45 deg
DSC_90 deg
Shell_45 deg
G_0 deg
G_45 deg
G_90 deg

Experimental work
101
and amount for respectively approx. 130 kJ/m2 and 120 kJ/m2 on a daily basis. The 90o-tilted DSC module has the lowest energy production just exceeding 50 kJ/m2. The energy production for the tested DSC modules is markedly lower than seen for the silicon panel, resulting in an energy production for the DSC0
o and DSC45o accounting
for approx. 65% and 60% of the energy produced by the Shell module. The vertical DSC module performs 25% of the 45o tilted silicon module and around 40% of the horizontal or 45o tilted DSC module.
5.4.5 Conclusion on outdoor results
An analysis of outdoor measurements performed at Fraunhofer ISE for a period from June 16th to July 9th has been carried out. The objective of the measurements was to create a base for comparison of the silicon- and DSC module with respect to performance under realistic conditions. The complete data set was used to gain an overall understanding of the dependencies between electrical performance and external parameters that the modules were subjected to under outdoor conditions. As the data set included results from all weather conditions data filtering was performed. Hereby the dependencies between irradiance level to ISC, VOC, FF, Pmax and conversion efficiency was identified. Linearity in irradiance level and measured ISC was seen for both the tested DSC and silicon modules. The generated VOC for the silicon module was seen to be influenced by irradiance level which showed a logarithmic decreasing VOC for lowered light levels. The Fill Factor was seen to decrease for both the silicon and the DSC modules for increasing irradiance, most pronounced for the DSC modules. The best fit to Pmax as function of G for all modules was seen to be linear. By regarding the conversion efficiency a tendency of increased efficiency for decreasing irradiance is seen for the DSC. This is not the case for the silicon module, which exhibits higher efficiency at higher light levels. By evaluating results from one sunny day, a qualitative analysis of energy production was performed. Further a more specific analysis of performance dependency with respect to irradiance and module temperature could be performed. The results showed that the top-glass of the modules hold great importance for performance as the reflection of light is increased for increasing incidence angles. The
decrease in G
ISC seen for the modules which was expected to be constant is contributed
to the increased reflectance at the glass surface. The additional ISC-contribution for the DSC which was seen in the indoor experiments for angular dependence (section 5.3
Angle of Incidence) has not been identified in the outdoor measurements.
Experimental work
102
The effect of module temperature on VOC for the silicon module was seen to result in a decrease of VOC for high module temperatures. The tendency was not noticeable for the DSCs The Fill Factor for the DSC was seen to benefit under low light conditions, resulting in a relative FF scaled to solar noon Ts=12.00 reaching up to 1.3 under low irradiance. The efficiency for the DSCs was seen to increase when moving away from solar noon, and the additional gain in efficiency was up to 10% when scaled to efficiency at Ts=12.00 due to better performance under low light levels. The Shell module showed highest conversion efficiency in the morning which is attributed to the temperature influence on VOC. The produced energy of the modules when operated in maximum power point for one sunny day has been determined and a markedly larger energy production for the silicon module per active area is seen. The performance of the DSC0
o and DSC45o is
comparable and accounts for more than 60% of energy per active area from the silicon module. The vertical module is the module with the lowest energy production due to the relatively low irradiance in the vertical plane.
5.5 Experimental determination of Glass Transmittance In the section 3.3.2 Theoretical transmittance of float glass the transmittance of float glass was determined in a simplified manner, as assumptions were made about the absorbance being neglective and only reflectance between the air-glass surface was considered. By determining the transmittance of glass with and without TCO-glass experimentally a good measure for the actual light transmittance through the glass will be available. As the measurements are only possible for an air-glass-air setup, the refraction of light will still differ from the actual situation, as a module consists of more layers (for the DSC: TiO2, electrolyte, back glass). The results of the transmittance-measurements can be used to correct the results for a lower limit of available light entering the cell.
5.5.1 The test
The test setup used is shown in section 5.3.2.1 The test setup, Figure 5-30. Measurements of transmittance for the following glass types (thickness of 3 mm) have been carried out:
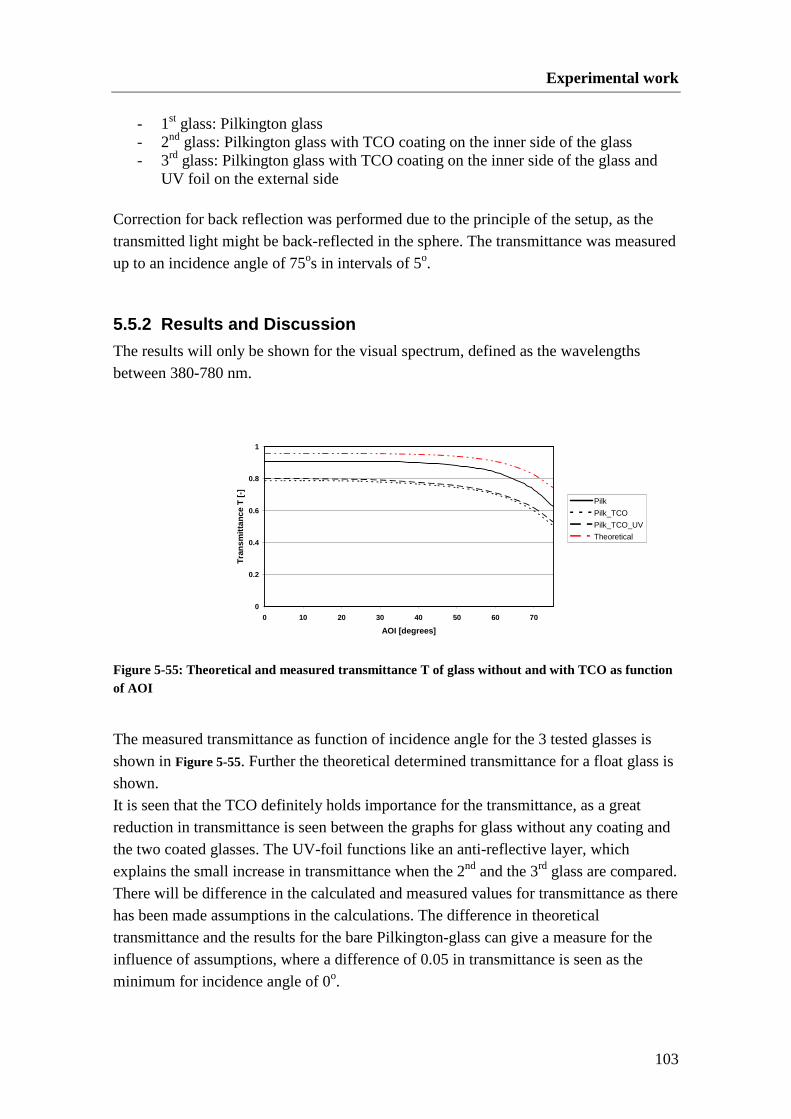
Experimental work
103
- 1st glass: Pilkington glass - 2nd glass: Pilkington glass with TCO coating on the inner side of the glass - 3rd glass: Pilkington glass with TCO coating on the inner side of the glass and
UV foil on the external side Correction for back reflection was performed due to the principle of the setup, as the transmitted light might be back-reflected in the sphere. The transmittance was measured up to an incidence angle of 75os in intervals of 5o.
5.5.2 Results and Discussion
The results will only be shown for the visual spectrum, defined as the wavelengths between 380-780 nm.
0
0.2
0.4
0.6
0.8
1
0 10 20 30 40 50 60 70
AOI [degrees]
Tra
nsm
ittan
ce T
[-]
Figure 5-55: Theoretical and measured transmittance T of glass without and with TCO as function of AOI
The measured transmittance as function of incidence angle for the 3 tested glasses is shown in Figure 5-55. Further the theoretical determined transmittance for a float glass is shown. It is seen that the TCO definitely holds importance for the transmittance, as a great reduction in transmittance is seen between the graphs for glass without any coating and the two coated glasses. The UV-foil functions like an anti-reflective layer, which explains the small increase in transmittance when the 2nd and the 3rd glass are compared. There will be difference in the calculated and measured values for transmittance as there has been made assumptions in the calculations. The difference in theoretical transmittance and the results for the bare Pilkington-glass can give a measure for the influence of assumptions, where a difference of 0.05 in transmittance is seen as the minimum for incidence angle of 0o.
Pilk
Pilk_TCO
Pilk_TCO_UV
Theoretical

Experimental work
104
The knowledge about transmittance as function of AOI can be used to correct the results obtained in the AOI tests by multiplying the results with the reciprocal value of the transmittance, ex.:
)(
1,.,, AOIT
II AOISCAOIcorrSC ⋅= ( 5.6)
Hereby the increase in reflectance is taken into account and it can be investigated, if the experimentally measured ISC follows the expected cosine relation. The function for the correction factor 1/T can be used to correct data for the different properties of cover glass. As the transmittance decreases for increasing AOI, see Figure
5-55 the results will benefit from this correction especially at high incidence angles. Polynomial regression has been performed on the calculated transmittance and the experimentally determined transmittance for a Pilkington glass with TCO and the UV-foil. A good fit is found by fitting a four degree polynomial function and hereby a function of the correction factor with respect to AOI is given. The fitted equations are given as eq. (5.7) and eq. (5.8).
0
0.5
1
1.5
2
0 10 20 30 40 50 60 70
AOI [degrees]
1/T
[-]
Figure 5-56: Correction factor 1/T as function of AOI
05.1101.3100.31071071 3243648 +⋅⋅−⋅⋅+⋅⋅−⋅⋅= −−−− AOIAOIAOIAOI
T ltheoretica ( 5.7)
3.1103.8100.71021021 3243547
__+⋅⋅−⋅⋅+⋅⋅−⋅⋅= −−−− AOIAOIAOIAOI
T UVTCOpilk ( 5.8)
Theoretical
pilk_TCO_UV
Poly. (pilk_TCO_UV)
Poly. (Theoretical)

Experimental work
105
0.000
0.010
0.020
0.030
0.040
0 10 20 30 40 50 60 70
AOI [Degrees]
I SC [A
]
0.8
0.9
1
1.1
1.2
1.3
1.4
0 10 20 30 40 50 60 70
AOI [Degrees]
Rel
ativ
e I S
C [-
]
As the experimental determination does not correlate exactly to the build-up of the DSC, the experimental correction factor is used as an upper limit for correcting the data and the theoretical correction factor is used as the lower correction limit.
5.5.2.1 Example of correction for transmittance
One example of the ISC before and after correction for transmittance is given. The data used for the example is from an indoor experiment for the angular dependence (3rd ISE DSC module, 2nd test.) The relative ISC as function of incidence angle is shown for the measurements before and after the correction. The relative ISC is scaled to the cosine relation regarding incidence angle.
Figure 5-57: ISC and relative ISC as function of AOI – before and after correction
Figure 5-57 displays an example of relative ISC as function of incidence angle before and after correcting for the decreased transmittance. The upper limit of corrected ISC is performed on basis of the experimental measurement of transmittance for a Pilkington glass with TCO and UV-foil. The lower limit is theoretically determined for a float glass. As seen for relative ISC for increasing AOI the corrected values gives a clear benefit for ISC scaled to the cosine relation, where an additional current-generation up to 40% is seen. The lower limit for correction gives a benefit in ISC to up to 20%. The transmittance is therefore of great importance for the conversion efficiency, as an initial reduction in light transmittance can account for more than 20 % (at AOI=0o) and is further reduced at higher incidence angles. This was seen in the experimental results for the Pilkington-TCO coated glass (Figure 5-55).
No correction
T, Theoretical
T, pilk_TCO_UV
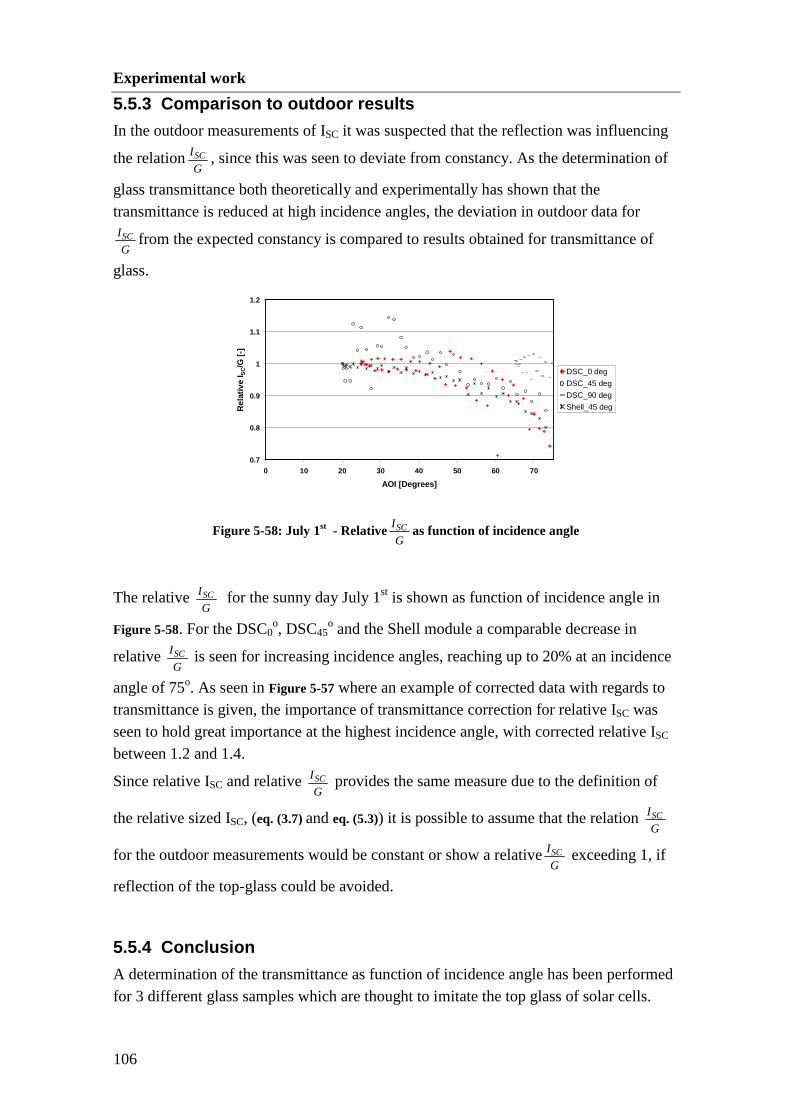
Experimental work
106
5.5.3 Comparison to outdoor results
In the outdoor measurements of ISC it was suspected that the reflection was influencing
the relationG
ISC , since this was seen to deviate from constancy. As the determination of
glass transmittance both theoretically and experimentally has shown that the transmittance is reduced at high incidence angles, the deviation in outdoor data for
G
ISC from the expected constancy is compared to results obtained for transmittance of
glass.
0.7
0.8
0.9
1
1.1
1.2
0 10 20 30 40 50 60 70
AOI [Degrees]
Rel
ativ
e I S
C/G
[-]
Figure 5-58: July 1st - RelativeG
ISC as function of incidence angle
The relative G
ISC for the sunny day July 1st is shown as function of incidence angle in
Figure 5-58. For the DSC0o, DSC45
o and the Shell module a comparable decrease in
relative G
ISC is seen for increasing incidence angles, reaching up to 20% at an incidence
angle of 75o. As seen in Figure 5-57 where an example of corrected data with regards to transmittance is given, the importance of transmittance correction for relative ISC was seen to hold great importance at the highest incidence angle, with corrected relative ISC
between 1.2 and 1.4.
Since relative ISC and relative G
ISC provides the same measure due to the definition of
the relative sized ISC, (eq. (3.7) and eq. (5.3)) it is possible to assume that the relation G
ISC
for the outdoor measurements would be constant or show a relativeG
ISC exceeding 1, if
reflection of the top-glass could be avoided.
5.5.4 Conclusion
A determination of the transmittance as function of incidence angle has been performed for 3 different glass samples which are thought to imitate the top glass of solar cells.
DSC_0 deg
DSC_45 deg
DSC_90 deg
Shell_45 deg
Experimental work
107
The determined transmittance has been used to form correction factors in which measurements can be corrected for the increasing reflection at high incidence angles. One example of corrected ISC for an ISE DSC module measured in the indoor setup for testing angular dependence is given. From the results it is seen that the correction for transmittance is influential on the relative ISC at high incidence angles where an additional benefit in relative ISC of 20-40% scaled to the cosine relation is seen. In reality, the outdoor exposed cells will always be laminated in glass or a polymer, in order to protect the cells from the changing weather conditions. Therefore it is not relevant to correct the obtained outdoor data for this increased transmittance as function of incidence angles, but it is noticeable that the properties of the top glass can hold such a great influence in cell performance.
5.6 Comparison of results for the DSC-and Silicon Cells Based on side-by side tests of representative DSC-and silicon cells, the performance dependency with respect to irradiance intensity, cell temperature and incidence angle has been investigated. The test conditions have been desired to be as similar as possible. The experimental work was performed both in laboratory and outdoor, so a comparison in results and tendencies seen for the two test-environments could be performed. Different types of both DSC- and silicon cells were used in the experimental work, depending on place of testing. Therefore only the general tendencies seen are pointed out, as it is difficult to give a quantitative measure due to difference in cells.
5.6.1 Irradiance Intensity
Irradiance intensity holds great influence for cell performance. With respect to irradiance dependency, the DSC and silicon cells are each others opposite. The experimental results seen for the DSCs favor low irradiance where the highest conversion efficiency is identified for both in-lab and outdoor results. This is mainly due to a loss reduction in the cell under low irradiance where the number of recombinations and the charge transfer resistance is low. This amounts in a relative high Fill Factor for the DSCs at low irradiance. A direct proportionality between ISC and irradiance is identified. Since the VOC-dependence is seen to be very weak and a dominant decay is only seen under low light levels, the conversion efficiency for the DSC is influenced by the Fill Factor-dependence of irradiance level. The silicon cells are seen to perform best under high illumination. A direct proportionality between ISC and irradiance G is identified and the VOC-dependence of G

Experimental work
108
follows theory with a logarithmic decrease at low light levels. This drop in VOC is more pronounced for the silicon than seen for the DSCs and since the Fill Factor is seen to be almost independent of G, the VOC-dependence holds greatest influence for the conversion efficiency. The tendencies identified are very coherent for both in-lab- and outdoor measurements and is evaluated to be the performance parameter to influence on cell performance the most.
5.6.2 Cell Temperature
The operating temperature of the solar cell affects the speed of chemical reactions within the cell. A systematic investigation of temperature dependency is only performed for the laboratory experiments as the outdoor data set is influenced by other external parameters. The decrease of VOC seen for increasing cell temperatures is visible for both DSC-and silicon cells, but with greater negative dependence seen for the silicon cell. Whereas the generated power output is seen to follow the VOC-dependence for the silicon, Pmax is seen to increase for the DSCs at elevated cell temperatures. Therefore the final result for conversion efficiency increases linearly for increased cell temperatures in the case of the DSC, but a linear decrease in cell efficiency is identified for the silicon cells. A numerical example of temperature influence on efficiency is provided on basis of the experimental results, and the importance of a cell temperature at 60oC is estimated to more than 20% of the cell efficiency determined under STC. The temperature dependence on VOC was identified for the outdoor measurements, where the highest VOC for the silicon module was found before solar noon. With the knowledge about irradiance symmetry around solar noon, the explanation in dissymmetry of measured VOC was found in the temperature dependence.
5.6.3 Incidence Angle
The influence of incidence angle on cell performance has been investigated both outdoor in simultaneous side-by-side tests and in an indoor setup. Since the structure of the DSC-and silicon cells differ, an advantage for the DSC at high incidence angles was expected due to a volume-absorption of incident light instead of restricted to the surface like the silicon. A beneficial ISC-contribution for increasing incidence angles has been identified for the DSCs when tested in the lab, whereas the silicon cells are seen to react according to the cosine relation until incidence angles exceeding approx. 55o. This critical angle could be identified as Brewster’s Angle for where reflectance from the p-polarized component is zero. All cells are affected by the increased surface reflectance at increasing incidence angles. As increased incidence angle is connected with a lowering of irradiance with cosine to
Experimental work
109
incidence angle and a logarithmic VOC-decay has been shown for both DSC and silicon cells under low light levels the benefit that the DSC might have due to angular dependence is not markedly in the final output. The angular effect of increased relative ISC as function of incidence angle is not seen in the long-term outdoor measurements, which can be interpreted as the influence of surface reflectance.
5.7 Conclusion On basis of the obtained experimental results with comparison to theory and expected performance behavior a conclusion can be drawn. Great differences between the investigated DSCs and silicon cells have been seen with respect to performance dependencies. Results obtained in the lab provide an isolated measure for cell behavior under variation of one parameter, but under realistic conditions it is the weather conditions that set the standard for performance of the cells. The parameters investigated have been irradiance intensity, cell temperature and incidence angle. Under realistic conditions these parameters cannot be seen as isolated parameters as they all influence each other. The results obtained in the lab provide an understanding of cell performance under controlled conditions. The results for both the DSC and silicon cell performance indicate that the most favorable conditions will in reality work against each other. The DSC performs best under low-light conditions, but has a positive temperature coefficient at high irradiance. This indicates that the DSC benefits at elevated cell temperatures, which is most likely to occur at high irradiance, where the lowest efficiency is observed. The silicon cell exhibits low efficiency at lowered irradiance which is increased at high illumination. The silicon has a negative temperature coefficient resulting in a lowering of efficiency when the operating temperature is high which will occur at strong irradiance. Therefore the parameters investigated are all seen to interact and work against each others benefit. A beneficial ISC-generation at increasing incidence angles has been identified for the DSCs compared to the silicon cell when tested in the lab, but the angular effect of increased relative ISC as function of incidence angle is not observed in the outdoor measurements, which might be due to the influence of reflectance at the surface. As characterization parameters, the irradiance intensity and cell temperature is therefore seen to hold greatest importance for the cell performance for both DSC and silicon cells, but also the influence of incidence angle due to reflection is an influential parameter for cell performance.
Experimental work
110
The performance of the silicon is markedly higher than seen for the DSC based on the outdoor measurements, but the outdoor test has only operated under summer conditions. Based on the investigation results, the DSC is expected to perform better at other seasons where the weather conditions are different. The optimum placement of the silicon cells will be directly against the sun where the highest irradiance will be present, since efficiency is seen to decrease under lower light levels. The temperature effect will reduce the performance under these conditions, but cannot measure up to the benefit of high irradiance. The purpose of the cells should be considered as they show very different behaviour and the most appropriate application of the solar cell should benefit from the strengths of the specific technology.
6 SUGGESTIONS FOR FURTHER STUDIES
Based on the knowledge gained during this work process, an outlook for future research areas will be given. As the DSC is still in the development stage, the DSCs produced worldwide are not similar. The experimental work carried out in this thesis was based on two different DSC cells, where clear performance difference was seen. A comparative and simultaneously study of different types of DSCs would be interesting to perform in order to gain understanding about their performance limitations and differences. As seen in the achieved results, the DSC and silicon cell shows many contradicting performance dependencies. The DSC performs best under low light conditions, whereas the highest conversion efficiency for silicon cells is seen at high irradiance. Under high illumination, the DSC shows positive dependence to elevated operating temperatures, whereas the efficiency for the silicon cells is negatively proportional to cell temperature. Therefore the realistic operating conditions are thought to benefit the DSC. A need for revising the standard test conditions when determining cell performance is identified, since the present STC highly favour the silicon cells. The STC might function to compare cells within a specific technology but the estimation of yearly performance can not be based on this test. In order to estimate the yearly performance a specific electrical model for the DSC needs to be developed, since the electrical behaviour under various test conditions is seen to differ greatly from the silicon cell. The model should include the performance characteristics of the cell as well as the external parameters influencing cell performance in form of weather conditions.This thesis has enlightened some of the performance parameters which hold influence, but a specific model needs to be based on further experimental work performed in depth. The correlation between temperature coefficient and irradiance level would be very interesting to investigate further, as the experimental results indicate that the influence of cell temperature depends on irradiance. The influence of spectral energy distribution has not been dealt with in this thesis, but will hold importance for cell performance due to different cell response according to the light energy distribution. This factor needs to be considered when creating the electrical model for the DSC.

Suggestions for Further Studies
112
The DSC is seen to have many potential advantages over the silicon cell such as a positive temperature coefficient at high irradiance, high performance under low light levels and the expected low production price. One essential parameter which acts to reduce the DSC performance is the charge transfer resistance which works against the beneficial temperature dependence under high irradiance. Therefore this loss for the DSC needs to be reduced so relatively high conversion efficiency can also be achieved under full sun. If this limitation can be solved for the DSC a further benefit in yearly performance is expected, minimizing the difference between silicon- and DSC performance when operating under realistic conditions. The influence of top glass and reflection at the glass surface is seen to hold importance for the amount of light reaching the active area of the solar cell. Since it is not realistic to have cells without a top-laminate, further studies on how to reduce the reflectance could act to enhance the cell performance.
7 CONCLUSION
The objective of this thesis was to perform a comparison of a DSC- and a silicon cell with respect to performance when subjected to varying conditions. The difference in electrical behaviour between the two solar cell technologies under varying operating conditions was experimentally investigated and linked to already known theoretical relations.
7.1 Results Great differences in electrical behavior of the investigated DSCs and silicon cells have been identified. The results obtained in the lab provide an understanding of cell performance under conditions which can be highly controlled and can be related to theory. Good correspondence between theoretical expected behavior and experimental results was achieved. The experimental results show that the cell efficiency is strongly influenced by irradiance, as a reduction in overall cell performance for the DSC was seen for increasing irradiance levels. This is interpreted as losses in the DSC which increases for increasing irradiance due to charge transport limitation. The silicon on the other hand exhibits positive performance dependence with highest efficiency at high irradiance levels. The operating cell temperature is seen to hold influence for the conversion efficiency where the DSC benefit from elevated cell temperatures under high illumination in contrast to the silicon cells which shows a negative temperature dependence in efficiency. An indication of dependence between cell temperature and irradiance level is seen, as the temperature coefficient determined under low light levels holds minor influence on the efficiency. A beneficial ISC-generation is seen for the DSC at increasing incidence angles. The experimental results from indoor tests indicate an additional ISC-gain of 10-60% in relative ISC at high incidence angles for the DSC, which can be interpreted as an effect of the increased light path within the active layers of the cell. The silicon cells exhibits a reduction in relative ISC for increasing incidence angles due to the increased reflection at the surface of the top-glass.
Conclusion
114
Outdoor measurements were used to verify if the results achieved in the lab were visible under realistic operating conditions, where the parameters investigated: G, Tcell and AOI are strongly correlated. Both the irradiance- and temperature influence as identified in the lab was seen in the outdoor measurements, but the beneficial behavior of the DSC related to incidence angle was not observed, which might be an effect of the surface reflectance at the top-glass. As characterization parameters, the irradiance intensity and cell temperature is therefore seen to hold greatest importance for the cell performance for both DSC and silicon cells. But the incidence angle also holds influence on cell performance due to the decreased light transmittance at oblique incidence angles.
7.2 Perspectives Based on the knowledge gained about the difference in performance characteristics of a DSC and a silicon cell it is evident that the application of the cells should be considered. The cells investigated show very different electrical behavior under varying weather conditions and therefore a specific cell technology should be chosen from the type of application desired. An estimation of the DSC performance from the present Standard Test Conditions, which highly favor the silicon cell, is believed to underestimate the DSC performance. A need for development of a specific electrical model of the DSC is seen, so a realistic estimate of the electrical behavior can be determined. The model should include the performance characteristics of the cell as well as the external parameters influencing cell performance in form of weather conditions. The importance of the performance parameters: Irradiance, Cell temperature and Incidence angle has in this work been investigated, but further studies needs to be performed in order to create the electrical model which can characterize the DSC fully. The results achieved indicate a promising future for the DSC if the problems dealt with today: Mechanical and chemical stability, encapsulation and up scaling, can be overcome. Hopefully this work will function as an encouragement for the future work of characterizing and improving the dye-sensitized solar cell.

ACKNOWLEDGEMENTS
There are so many people who have helped me during this project, providing great guidance and sharing their theoretical as well as practical knowledge for which I am truly appreciative of. Dr. Hanne Lauritzen (DTI) for great supervision and being a source of inspiration, both personally and work-related. Søren Poulsen (DTI) for professional guidance, patience and great personality. Dr. Andreas Hinsch (Fr. ISE) for giving me the opportunity to do part of my experimental work at Fraunhofer and providing guidance and literature in the project. Welmoed Veurman (Fr. ISE) for comments, practical solutions and good correspondence. Henning Brandt (Fr. ISE) for practical help and my ISE DSC modules. Dr. Peter Nitz (Fr. ISE) for introduction and help with the test setup and measurements of transmittance. Stefan Brachmann (Fr. ISE) for help with the outdoor setup and providing me with data. Esben Larsen (DTU) for supervision and practical help with equipment for the test setups. Thomas Laursen for the help with creating the temperature setup at DTI and general helpfulness. Peter Poulsen for the manufacturing of the small reference silicon cells. Theis Brock Nannestad (University of Copenhagen) for measuring spectral distribution. Gerhard Siefer (Fr. ISE) for irradiance data.


REFERENCES
Articles
[A 1] Morton, O., Solar energy: A new day dawning?: Silicon Valley sunrise, Nature , no. 443, 7 September 2006, p. 19-22
[A 2] O’Regan, B; Grätzel, M., A low-cost, high-efficiency solar cell based on dye-
sensitized colloidal TiO2 films, Nature, vol. 353, 1991, p. 737-739 [A 3] Kato, N. et Al, Degradation Analysis of Dye-Sensitized Solar Cell Module
After Long-Term Stability Test under Outdoor Working Condition, 17th
International PhotoVoltaic Science and Engineering Conference, 3-7 December 2007, Fukuoka, Japan
[A 4] Kroon, J. M. et. Al, Nanocrystalline dye-sensitized solar cells having
maximum performance, Prog. Photovolt. Res. Appl. 2007, no. 15, p. 1-18, [A 5] Šúri M., Huld T.A., Dunlop E.D. Ossenbrink H.A., Potential of solar electricity
generation in the European Union member states and candidate countries. Solar Energy, vol. 81, 2007, p. 1295–1305
http://re.jrc.ec.europa.eu/pvgis/ [A 6] Koster, L. J. A., Mihailetchi, V. D., Ramaker, R. & Blom, P. W. M. Light
intensity dependence of open-circuit voltage of polymer : fullerene solar cells. Applied Physics Letters, vol. 86 (12), 2005.
[A 7] Bücher, K. et al., Photovoltaic Modules in Buildings: Performance and Safety
Renewable Energy, vol. 15, 1998, p. 545-551 [A 8] Bücher, K., Site dependence of the energy collection of PV modules, Solar
Energy Materials and Solar Cells, vol. 47, 1997 p. 85-94.

References
118
[A 9] Balenzategui, J. L; Chenlo, F., Measurement and analysis of angular response of bare and encapsulated silicon solar cells, Solar Energy Materials & Solar
Cells, vol. 86, 2005, p. 53-83 [A 10] Seibert, G., Solar Cell Output as a Function of Angle of Incidence for both
Unpolarized and Linear Polarized Light, Energy Conversion, vol. 8, 1968, p. 121-123.
[A 11] Gonzalez, M. C.; Caroll, J. J., Solar Cells Efficiency variations with varying
atmospheric conditions, Solar Energy, vol. 53, no. 5, 1994, pp. 395-402 [A 12] Hinsch, A. et Al, Dye Solar modules for façade applications: recent results
from Project ColorSol 17th, International Photovoltaic science and engineering
conference, 3-7 December 2007, Fukuoka, Japan [A 13] Toyoda, T. et Al, The Outdoor Performance of large scale DSC modules,
Journal of Photochemistry and Photobiology A: Chemistry, vol. 164, 2004, p. 203-207.
[A 14] Toyoda, T. et Al, The present status of Dye-sensitized solar cell modules
Renewable Energy, 2006, proceedings [A 15] Doi, S. et Al Development of dye-sensitized solar modules to meet artistic
designs 1. Wall-integrated panels for TOYOTA Dream House: “PAPI”, Proceedings of WCWRF 2005, Hamamatsu, Japan
[A 16] E. Rijnberg et Al., Long-term stability of Nanocrystalline Dye-sensitized solar
cells, 2nd World Conference and Exhibition on Photovoltaic Solar Energy
Conversion, 6-10 July, 1998, Vienna, Austria.
Text Books
[B 1] Wenham, S. R; Green, M. A.; Watt, M.E., Applied Photovoltaics, Centre for PhotoVoltaic Devices and Systems, University of NSW, ISBN 0 86758 909 4.
[B 2] Edited by Luque, A.; Hegedus, S., Handbook of Photovoltaic Science and
Engineering, Wiley, 2003. [B 3] Veurman, W., Long-Term Stability of dye sensitized solar cells, Part of the
Master in Applied Physics, Rijks Universiteit Groningen, September 2006-April 2007.
References
119
[B 4] Edited by Soga, T., Nanostructured Materials for Solar Energy Conversion,
Elsevier, 2006. [B 5] Jensen, J. M., Eksamensprojekt: Notat om Solstråling, Laboratoriet for
varmeisolering, Danmarks Tekniske Højskole, forår 1993 [B 6] Incropera et Al, Fundamentals of Heat and Mass Transfer, Wiley, sixth
edition, 2007. [B 7] Svendsen, S., Solstråling, Lecture note, 11111 Bygningsenergi & 11732
Bygningsinstallationer, BYG.DTU, Aug. 1998.
Internet
[I 1] http://www.solarbuzz.com/Technologies.htm [I 2] http://www.solarbuzz.com [I 3] http://www.internet-public-library.org/carbon-reduction/advanced-solar-cell-
developments-2007.jpg [I 4] http://i160.photobucket.com/albums/t175/jcwinni/dye-sensitized-solar-cell.gif [I 5] http://www.fmf2.uni-
freiburg.de/projekte/pg_anorg/projekt_fsz/dsc_basics.htm [I 6] http://www.fmf2.uni-
freiburg.de/projekte/pg_anorg/projekt_fsz/pics/dsc/basics/scheme_dsc.gif [I 7] http://www.risen-lighting.com/login/cp/spci/20073231552494812.gif [I 8] http://www.goldmine-elec-products.com/images/G4538B.jpg [I 9] http://www.solarserver.de/images/sharp_prototyp_triple_junct.jpg [I 10] http://en.wikipedia.org/wiki/Angle_of_incidence [I 11] http://www.mellesgriot.com/products/optics/images/fig5_1.gif [I 12] http://en.wikipedia.org/wiki/Brewster%27s_angle
References
120
[I 13] http://www.pilkington.com/resources/databladdkoptiwhite.pdf [I 14] http://www.pilkington.com/resources/databladdkkglass.pdf [I 15] http://rredc.nrel.gov/solar/spectra/am1.5/ASTMG173/ASTMG173.html
Presentations
[P 1] Tulloch, G., Opportunities for DSC in the Solar Dream, Dyesol, Industrialization of DSC, Canberra, Australia 2006, Feb. 10th.
[P 2] Veurman, W., Mechanical & Chemical Stability of DSC modules, Results from
Outdoor Tests, Fraunhofer Institut Solare Energisysteme, FMF Seminar, 2008, Feb. 5th
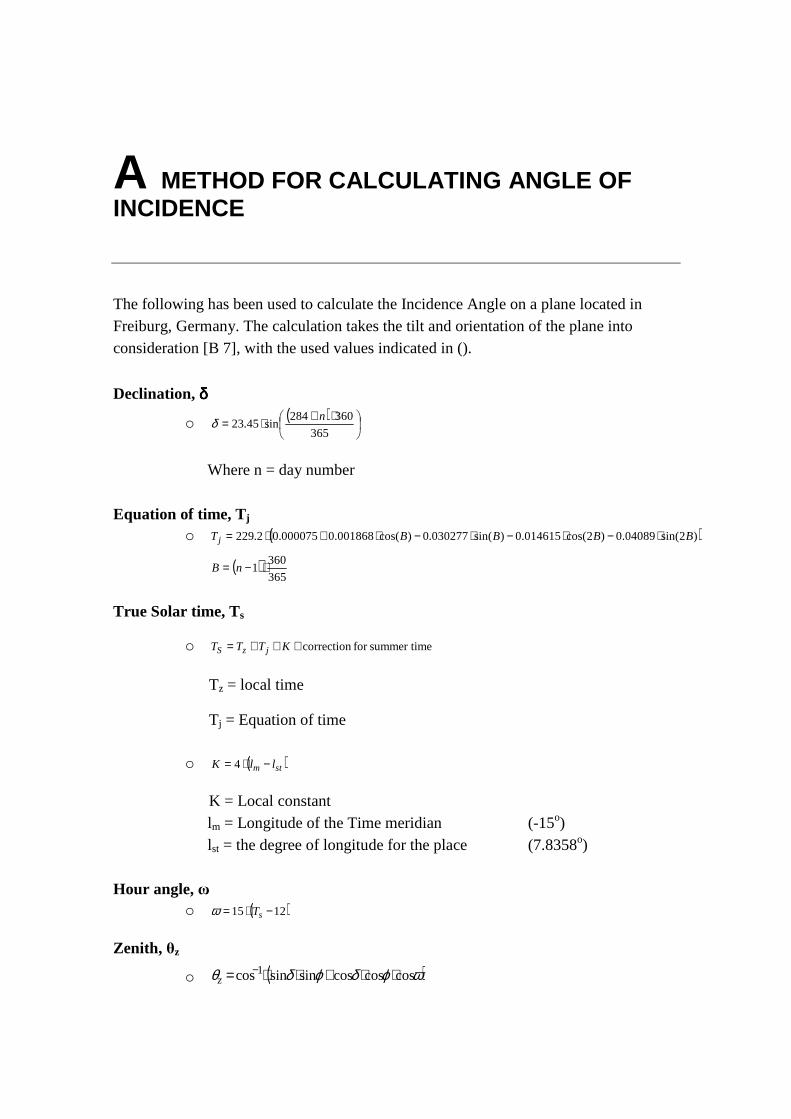
A METHOD FOR CALCULATING ANGLE OF INCIDENCE
The following has been used to calculate the Incidence Angle on a plane located in Freiburg, Germany. The calculation takes the tilt and orientation of the plane into consideration [B 7], with the used values indicated in ().
Declination, δδδδ
o ( )
⋅+⋅=365
360284sin45.23
nδ
Where n = day number
Equation of time, Tj o ( ))2sin(04089.0)2cos(014615.0)sin(030277.0)cos(001868.0000075.02.229 BBBBTj ⋅−⋅−⋅−⋅+⋅=
( )365
3601 ⋅−= nB
True Solar time, Ts
o esummer timfor correction+++= KTTT jzS
Tz = local time
Tj = Equation of time
o ( )stm llK −⋅= 4
K = Local constant lm = Longitude of the Time meridian (-15o) lst = the degree of longitude for the place (7.8358o)
Hour angle, ω
o ( )1215 −⋅= sTω
Zenith, θz
o ( )ωϕδϕδθ coscoscossinsincos1 ⋅⋅+⋅⋅= −z

Method for calculating Angle of incidence
122
Where φ = latitude for the place (48.0106o N)
Solar height, αs
o ( )ωϕδϕδα coscoscossinsinsin1 ⋅⋅+⋅⋅= −s
Incidence angle, θ
o ( )
( )ωγβωγβϕωβϕδγβϕβϕδθ
sinsinsincoscossinsincoscoscoscos
cossincoscossinsincos
⋅⋅+⋅⋅⋅+⋅⋅⋅+⋅⋅−⋅⋅=
o Where β is tilt of plane (0o, 45o and 90o)
γ is the azimuth of the plane (0o for south-oriented)
Corrected Incidence angle, θcorr
o If θθθθ otherwise90 then 90 ==> corro
corro
It is the corrected incidence angle which has been used in the data analysis, as it is not possible to have incidence angles exceeding 90o.
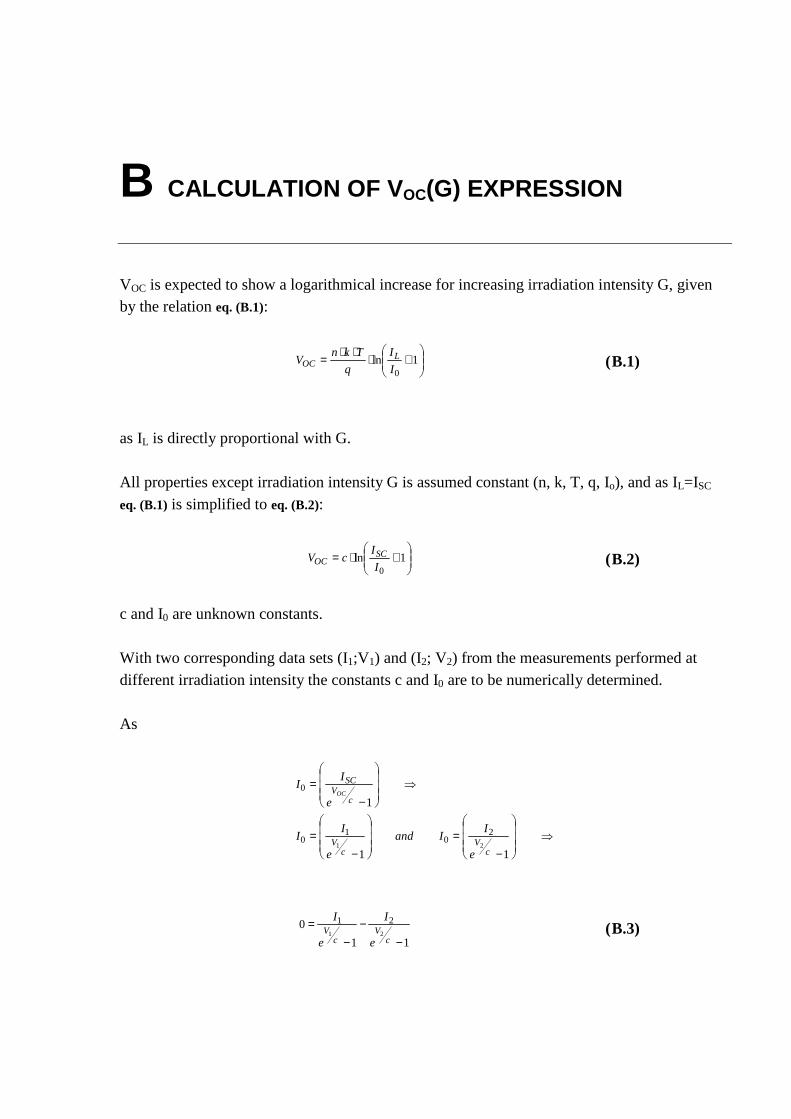
B CALCULATION OF V OC(G) EXPRESSION
VOC is expected to show a logarithmical increase for increasing irradiation intensity G, given by the relation eq. (B.1):
+⋅⋅⋅= 1ln
0I
I
q
TknV L
OC ( B.1)
as IL is directly proportional with G.
All properties except irradiation intensity G is assumed constant (n, k, T, q, Io), and as IL=ISC eq. (B.1) is simplified to eq. (B.2):
+⋅= 1ln
0I
IcV SC
OC ( B.2)
c and I0 are unknown constants. With two corresponding data sets (I1;V1) and (I2; V2) from the measurements performed at different irradiation intensity the constants c and I0 are to be numerically determined. As
⇒
−=
−=
⇒
−=
11
1
21
20
10
0
cV
cV
cV
SC
e
IIand
e
II
e
II
OC
11
021
21
−−
−=
cV
cV
e
I
e
I ( B.3)

Calculation of VOC(G) expression
124
Eq. (B.3) is solved with regards to c by performing bisection by iterating c to the point where the equation changes sign. For the three silicon cells as well as the average for the DSCs, c has been determined by three different data sets in order to see which gives the best fit in the end. With the determined c, I0 is determined. I0 is determined for the whole measurement set which range from 70 W/m2 to 1000 W/m2 and the average I0 is then used in the final equation for VOC
eq. (B.2). The experimental results as well as the theoretical expression for VOC which has been fitted from the experimental data are shown in (VOC; ISC) - graphs. Only the best fit is shown. The constants and determined expression are given in Table B-1.
Table B-1: Expressions for VOC as function of ISC
c
[mV]
I0
[mA]
Expression for VOC
[mV]
DSCaverage 34.15 6.19⋅10-7
+⋅
⋅= − 11019.6
ln15.34)(7mA
ImVIV SC
SCOC
Si 1 44.20 1.74⋅10-3
+⋅
⋅= − 11074.1
ln20.44)(3mA
ImVIV SC
SCOC
Si 2 37.69 1.51⋅10-4
+⋅
⋅= − 11051.1
ln69.37)(4mA
ImVIV SC
SCOC
Si 3 83.99 2.39⋅10-1
+⋅
⋅= − 11039.2
ln99.83)(1mA
ImVIV SC
SCOC
The experimental results and the fit of the logarithmic relation are illustrated in the following graphs, Figure B-2 – Figure B-5, where the absolute deviation is also shown in %. The graphs can be identified by the given graphical display, shown in Figure B-1.
VOC, measured
VOC, fitted- THEORY
Absolute deviation
Figure B-1: Identification for the graphs

Calculation of VOC(G) expression
125
400
450
500
550
0 200 400 600 800 1000
G [W/m2]
VO
C [m
V]
0
0.8
1.6
2.4
Abs
olut
e de
viat
ion
[%]
550
600
650
0 200 400 600 800 1000
G [W/m2]
VO
C [m
V]
0.00
0.25
0.50
Abs
olut
e de
viat
ion
[%]
400
450
500
550
0 200 400 600 800 1000
G [W/m 2]
VO
C [m
V]
0
0.6
1.2
1.8
Abs
olut
e de
viat
ion
[%]
400
500
600
0 200 400 600 800 1000
G [W/m 2]
VO
C [m
V]
0
3
6
Abs
olut
e de
viat
ion
[%]
Figure B-2: DSCaverage Figure B-3: Si 1
Figure B-4: Si 2 Figure B-5: Si 3
A very good agreement for the DSC cells is seen, with deviations under 1%. The worst fit is seen for the monocrystalline cell, Si 3, where the maximum deviation reaches approx. 6 %. But this is still found to be within acceptable deviation.

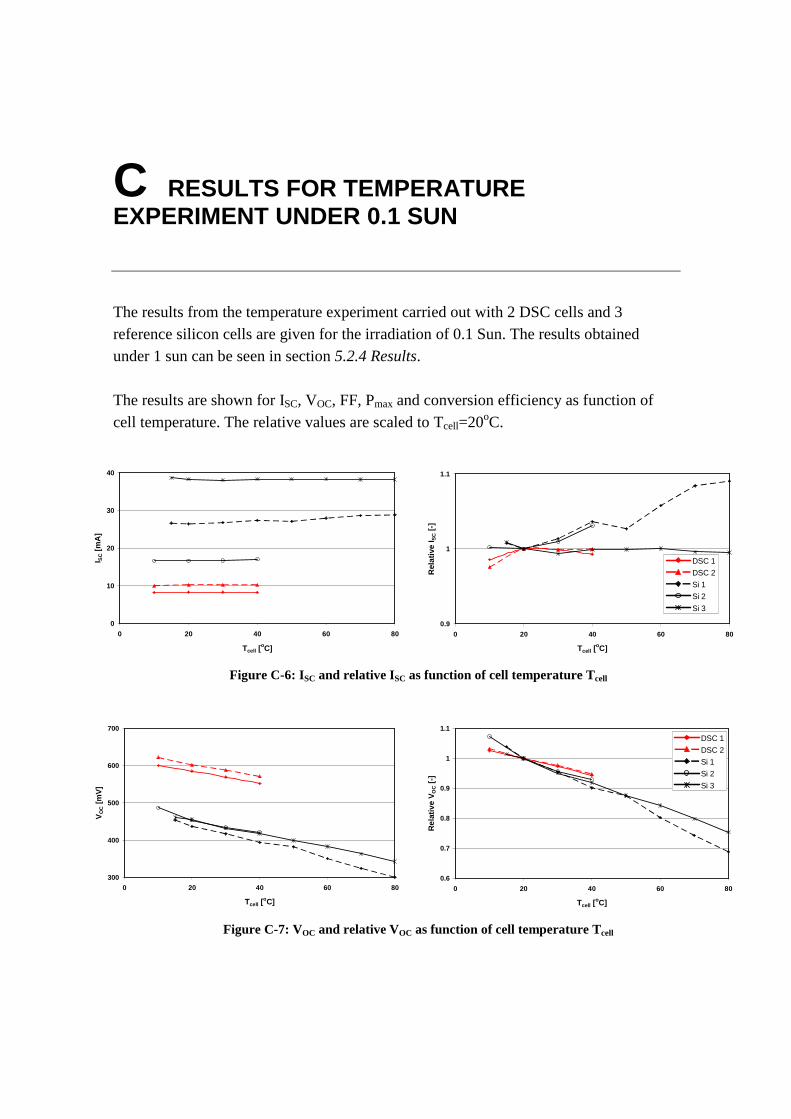
0
10
20
30
40
0 20 40 60 80
Tcell [oC]
I SC [m
A]
0.9
1
1.1
0 20 40 60 80
Tcell [oC]
Rel
ativ
e I S
C [-
]
0.6
0.7
0.8
0.9
1
1.1
0 20 40 60 80
Tcell [oC]
Rel
ativ
e V
OC [-
]
300
400
500
600
700
0 20 40 60 80
Tcell [oC]
VO
C [m
V]
C RESULTS FOR TEMPERATURE EXPERIMENT UNDER 0.1 SUN
The results from the temperature experiment carried out with 2 DSC cells and 3 reference silicon cells are given for the irradiation of 0.1 Sun. The results obtained under 1 sun can be seen in section 5.2.4 Results. The results are shown for ISC, VOC, FF, Pmax and conversion efficiency as function of cell temperature. The relative values are scaled to Tcell=20oC.
Figure C-6: ISC and relative ISC as function of cell temperature Tcell
Figure C-7: VOC and relative VOC as function of cell temperature Tcell
DSC 1
DSC 2
Si 1
Si 2
Si 3
DSC 1
DSC 2
Si 1
Si 2
Si 3

Results for temperature experiment under 0.1 Sun
128
40
50
60
70
0 20 40 60 80
Tcell [oC]
FF
[%]
0.9
1
1.1
0 20 40 60 80
Tcell [oC]
Rel
ativ
e F
F [-
]
2
4
6
8
0 20 40 60 80
Tcell [oC]
Pm
ax [m
W]
0.7
0.8
0.9
1
1.1
0 20 40 60 80
Tcell [oC]
Rel
ativ
e P
max
[-]
2
4
6
8
10
0 20 40 60 80
Tcell [oC]
Con
vers
ion
Effi
cien
cy [%
]
0.7
0.8
0.9
1
1.1
0 20 40 60 80
Tcell [oC]
Rel
ativ
e C
onve
rsio
n E
ffici
ency
[-]
Figure C-8: FF and relative FF as function of cell temperature Tcell
Figure C-9: Pmax and relative Pmax as function of cell temperature Tcell
Figure C-10: ηηηη and relative ηηηη as function of cell temperature Tcell
DSC 1
DSC 2
Si 1
Si 2
Si 3
DSC 1
DSC 2
Si 1
Si 2
Si 3
DSC 1
DSC 2
Si 1
Si 2
Si 3

www.elektro.dtu.dk Department of Electrical Engineering Technical University of Denmark Ørsteds Plads Building 348 DK-2800 Kgs. Lyngby Denmark Tel: (+45) 45 25 38 00 Fax: (+45) 45 93 16 34 Email: [email protected]