PERFORMANCE BENCHMARKING OF INTERACTION ROUTINES MANAGING … · PERFORMANCE BENCHMARKING OF...
12
PERFORMANCE BENCHMARKING OF INTERACTION ROUTINES – MANAGING TRADE-OFFS IN SERVICE CO- CREATION WITH THE DATA ENVELOPMENT ANALYSIS Becker, Joerg, University of Muenster – ERCIS, Leonardo-Campus 3, 48149 Muenster, Ger- many, [email protected] Beverungen, Daniel, University of Muenster – ERCIS, Leonardo-Campus 3, 48149 Muenster, Germany, [email protected] Breuker, Dominic, University of Muenster – ERCIS, Leonardo-Campus 3, 48149 Muenster, Germany, [email protected] Dietrich, Hanns-Alexander, University of Muenster – ERCIS, Leonardo-Campus 3, 48149 Muenster, Germany, [email protected] Rauer, Hans Peter, University of Muenster – ERCIS, Leonardo-Campus 3, 48149 Muenster, Germany, [email protected] Abstract The co-creation of value involving service provider and service customer is one of the most widely acknowledged properties of ‘service’. From an operations view, a central challenge is to organize the co-creation of service(s) in the most efficient way. Previous literature in supply chain management and economics is focused on developing various simulation approaches and analytical models, but takes insufficient account of the basic properties of service. The purpose of this article is to conceptu- alize service co-creation as performed in stable interaction routines between service providers and customers that can be purposefully designed and optimized for efficiency. We argue that finding the most efficient interaction routine is subject to solving a trade-off decision between a set of perfor- mance factors such as service quality, cost, and customer involvement. This trade-off decision can be resolved with the Data Envelopment Analysis (DEA), allowing service providers to optimize their in- teractions with their customers by shifting activities in the service process towards the customer, into the service provider’s front stage, or into the service provider’s back stage. We demonstrate that the proposed approach is usable in this context, discuss its theoretical properties, and suggest research directions for its further development. Keywords: Service Science, Service Blueprinting, Performance Feedback Theory, Behavioral Theory of the Firm, Data Envelopment Analysis. Proceedings of the 21st European Conference on Information Systems 1
Transcript of PERFORMANCE BENCHMARKING OF INTERACTION ROUTINES MANAGING … · PERFORMANCE BENCHMARKING OF...

PERFORMANCE BENCHMARKING OF INTERACTION
ROUTINES – MANAGING TRADE-OFFS IN SERVICE CO-
CREATION WITH THE DATA ENVELOPMENT ANALYSIS
Becker, Joerg, University of Muenster – ERCIS, Leonardo-Campus 3, 48149 Muenster, Ger-
many, [email protected]
Beverungen, Daniel, University of Muenster – ERCIS, Leonardo-Campus 3, 48149 Muenster,
Germany, [email protected]
Breuker, Dominic, University of Muenster – ERCIS, Leonardo-Campus 3, 48149 Muenster,
Germany, [email protected]
Dietrich, Hanns-Alexander, University of Muenster – ERCIS, Leonardo-Campus 3, 48149
Muenster, Germany, [email protected]
Rauer, Hans Peter, University of Muenster – ERCIS, Leonardo-Campus 3, 48149 Muenster,
Germany, [email protected]
Abstract
The co-creation of value involving service provider and service customer is one of the most widely
acknowledged properties of ‘service’. From an operations view, a central challenge is to organize the
co-creation of service(s) in the most efficient way. Previous literature in supply chain management
and economics is focused on developing various simulation approaches and analytical models, but
takes insufficient account of the basic properties of service. The purpose of this article is to conceptu-
alize service co-creation as performed in stable interaction routines between service providers and
customers that can be purposefully designed and optimized for efficiency. We argue that finding the
most efficient interaction routine is subject to solving a trade-off decision between a set of perfor-
mance factors such as service quality, cost, and customer involvement. This trade-off decision can be
resolved with the Data Envelopment Analysis (DEA), allowing service providers to optimize their in-
teractions with their customers by shifting activities in the service process towards the customer, into
the service provider’s front stage, or into the service provider’s back stage. We demonstrate that the
proposed approach is usable in this context, discuss its theoretical properties, and suggest research
directions for its further development.
Keywords: Service Science, Service Blueprinting, Performance Feedback Theory, Behavioral Theory
of the Firm, Data Envelopment Analysis.
Proceedings of the 21st European Conference on Information Systems
1

1 Introduction
The emergence and proliferation of the service economy is fuelled by two interwoven developments.
First, there is a global trend for an increased specialization of resources and competencies. Companies
across borders and industries outsource business processes that they have formerly performed them-
selves. Second, customers increasingly insist on integrated solutions that are custom-fit to their prob-
lems, often composed of a seamless combination of physical goods, services, and software. As an um-
brella term for such offerings, the notion of ‘service’ has been coined as “the application of specialized
competences, through deeds, processes, and performances for the benefit of another entity or the entity
itself” (Vargo and Lusch, 2004). To generate superior returns, companies specialize on their core re-
sources and core competencies, but at the same time need to satisfy complex business needs of their
clients. On an operations level, companies are faced with the need to design and operate the processes
needed to create ‘service’ with their clients. Although there is profound disagreement on the question
how value is created in service systems and if services have characteristics that set them apart from
physical goods—such as the IHIP criteria (intangibility, heterogeneity, inseparability, perishability)
proposed by Zeithaml, Parasuraman and Berry (1985) that are challenged by Vargo et al. (2010)—
there seems to be agreement that the co-creation of value is constitutive for service(s). Service pro-
cesses need to account for the perspective of both the customer and the provider, as well as for their
coordination. However, method support that can be used by service providers to design their interfaces
towards external stakeholders on an activity level is still limited, at best (Becker et al., 2012a).
In authoritative literature in organization science, an organizational routine conceptualizes “behavioral
regularities, which denote recurring analytic processes embedded in firms and performed by groups of
individuals” (Salvato and Rerup, 2011; Winter, 1964). Organizational routines involving actors from
networked organizational units are conceptualized as interaction routines (Becker, 2004). If applied to
service systems we posit, in line with Becker et al. (2012b), that interaction routines can be used as a
theoretical lens to identify recurring analytic processes embedded into service systems that are jointly
performed by service providers and service customers in order to co-create ‘service’.
A crucial question for service firms is which organizational routines they should put in place in order
to make their service co-creation as efficient as possible. Essentially, this is a matter of the variation,
selection, and retention (Campbell, 1965; Feldman and Pentland, 2003) of the most efficient interac-
tion routines. In the context of the service system as the ‘basic abstraction’ of service science (Maglio
et al., 2009), we formulate the following research question: What are the theoretical underpinnings for
selecting efficient interaction routines in service systems with the Data Envelopment Analysis?
We approach this research question with a theoretical paper in order to conceptualize and theorize
upon method support that service firms can use to address this management problem. The idea is to
build on the theoretical foundations of Data Envelopment Analysis (DEA), a performance manage-
ment approach with some thirty years of history (Cook and Seiford, 2009), in order to identify and
selectively retain (Campbell, 1965; Feldman and Pentland, 2003) the most efficient interaction rou-
tines in a service system.
The remainder of the paper is organized as follows. In Section 2, an overview is provided on related
work about modeling interaction routines in service systems, performance benchmarking with the
Data Envelopment Analysis in the service sector, and theoretical underpinnings of decision making in
organizations itself. In Section 3, we conceptualize the management of interaction routines in service
systems as a decision problem that necessitates the execution of alternative interaction routines (varia-
tion), specifying performance calculi and select the most efficient interaction routines (selection), and
implementing the most efficient routines into the organization (retention). Since performance metrics
for estimating the efficiency of the service processes can be inherently contradictory, we argue that the
organization is forced to manage trade-offs and favor some productivity factors over others with re-
spect to contingency factors in the environment of the service system. We argue that the DEA can be
applied as a method to resolve the identified trade-offs without bias, since the trade-offs are being
Proceedings of the 21st European Conference on Information Systems
2

resolved based on the data, but with no a priori assumption being made. Therefore, DEA seems nicely
suited to gather performance feedback on interaction routines. In Section 4, we discuss the properties
of this approach from the viewpoint of authoritative theory related to performance management and
decision making in organizations. This is done in order to discuss the organizational embedding of the
method into service systems. Section 5 provides a conclusion and research outlook.
2 Research Background
2.1 Modeling interaction routines in service systems
Research in service science, management, and engineering (SSME) is focused on the creation of ser-
vice in service systems. A service is a provider-client interaction that creates and captures value for
those parties involved (Katzan, 2008). The service system is conceptualized as “a configuration of
people, technologies, and other resources that interact with other service systems to create mutual val-
ue” (Maglio et al., 2009) and is considered as the basic abstraction in SSME. It constitutes the organi-
zational frame in which the creation of value is performed. Information Systems is one of the central
disciplines engaged with service research (Bardhan et al., 2010).
Service Blueprinting, originally proposed by Shostack (1982) and further developed, amongst others,
by Zeithaml and Bitner (1996), is an approach originating from a service marketing perspective de-
signed to depict and analyze service processes at the customer interface. Recently, it was extended to
account for the needs of network-based value creation of service companies and manufacturing firms
(Becker et al., 2012a; Beverungen, Knackstedt and Winkelmann, 2012). The service blueprint pro-
vides modeling constructs for activities in a service process, confined by ‘lines’, most notably the ‘line
of interaction’ (separating activities carried out by service providers from activities carried out by cus-
tomers) and the ‘line of visibility’ (separating activities of providers that are visible to customers—the
front stage—from activities not visible to customers—the back stage). By modeling a service process
with the blueprint, service providers make decisions on how ‘service’ will be co-created between pro-
vider and customer. Thus, the question on which layer to put an activity impacts on the actual process-
es of value creation.
We utilize the service blueprint as to depict and analyze interaction routines in a service system. From
a service science viewpoint, we conceptualize interaction routines as a theoretical construct to identify
recurring analytic processes embedded into service systems that are jointly performed by service pro-
viders and service customers in order to co-create service(s) (see Section 1). Based on distinguishing
structure and agency, Feldman and Pentland (2003) prominently argue that routines consist of an os-
tensive (the abstract idea or concept of a routine) and a performative aspect (enactments of the routine
by real workers in real settings). Both perspectives influence each other, since the idea of a routine
shapes actual performances, whereas ostensive routines emerge from the sum of performances in an
organization. In this paper, we take the perspective of an organization evaluating the efficiency of a set
of performances in order to identify which routines it should select and retain as ostensive routines.
Although interaction routines have long been discussed in the organization science discipline, surpris-
ingly few authors have discussed the concept in a service context, some notable exceptions being Alter
(2012) and Becker et al. (2012b). While Alter (2012) develops a meta-model from an operational view
of service system analysis and design, Becker et al. (2012b) design a method and tool support for the
collaborative design of interaction routines in service networks.
2.2 Service performance benchmarking with the data envelopment analysis
Performance measurement requires a clear definition of the unit of assessment as well as the objective
of the investigation (Emrouznejad and De Witte, 2010). To reflect the objective, it is crucial to identify
appropriate productivity figures. Productivity is determined by outputs and inputs. Inputs refer to re-
sources that are transformed by the unit of assessment into outcomes, referred to as outputs. In a ser-
Proceedings of the 21st European Conference on Information Systems
3

vice context, this transformation process is characterized through participation of not only the service
provider but also the customer. In line with this dyadic view on service productivity, Grönroos and
Ojasalo (2004) proposed a service productivity model (cf. Figure 1). Inputs can be contributed by ei-
ther customers or by service providers. The internal efficiency (or cost efficiency) is determined by
how well these resources are used in a service process. The service process is performed either by the
service provider alone, in interaction with the customer, or even by the customer alone.
INPUTS
SERVICE PROCESS
Service Provider producing the
service in insolation from
Customer (back office)
Service Provider and Customer
producing the service in
interaction (service encounter)
Customer producing the Service
in isolation from the Service
Provider
OUTPUTS
I
m
a
g
e
Service Provider’s
Inputs:
- Personnel
- Technology
- Systems
- Information
- Time, etc.
Customers’ Inputs:
- Own participation
- Participation by
fellow customer
Output Quantity
Ouput
Quality:
- Outcome
- Process
Customer
Perceived
Quality
Figure 1. Service productivity model, adapted from Grönroos and Ojasalo (2004)
After inputs and outputs have been identified, a method to calculate the actual performance benchmark
has to be chosen. In this context we define a benchmark as a best-in-class unit that has a high efficien-
cy when transforming inputs to outputs and serves as a comparison against which inefficient units can
be measured (Cook and Seiford, 2009). Against the backdrop of the abovementioned productivity
model, a service benchmarking method capable of handling multiple inputs and outputs simultaneous-
ly is required. In addition, inputs and outputs can be heterogeneous, rendering simple ratio calculations
inappropriate. In particular, these techniques of benchmarking that rely on single, monetary input or
output measures are inadequate because for each resulting ratio it is possible to identify a different
firm with the highest value (Athanassopoulos and Ballantine, 1995). Methods relying on production
frontiers are a viable method and account for the abovementioned requirements. They can be catego-
rized into parametric and non-parametric approaches (Emrouznejad and De Witte, 2010). Parametric
frontier approaches require a production function to be specified in advance of the performance calcu-
lation. They use parameters (or weights) to balance the inputs and outputs. However, the parameters
and the production function itself have to be determined by the analyst. In contrast, non-parametric
frontier techniques estimate the parameters and the production function based on the data themselves
and a set of weak assumptions but require more data for these estimations.
The data envelopment analysis (DEA) is a non-parametric frontier analysis approach and is widely
used (Cook and Seiford, 2009). The basic idea is to construct a production frontier from performance
data, defining the trade-offs for using multiple substitutable inputs to create multiple substitutable
outputs. To account for this, the inputs and outputs are assigned weights in such a way that each
benchmarked entity (called decision making unit, DMU) is evaluated in the best way possible. The
result of the DEA is a relative efficiency metric between 0 and 100% for each DMU. Importantly, the
DEA is inclusive of almost any inputs and outputs (e.g., service quality, number of ideas generated),
provided that sufficient data is available based on which the benchmarking can be performed. There-
fore, DEA has been found particularly useful for benchmarking in the service sector (Becker et al.,
2012c; Cook and Seiford, 2009).
DEA can be used especially to resolve trade-offs in performance measurement systems by identifying
the optimal production frontier. Performance benchmarking should account for such trade-off deci-
sion, e.g., if two firms may achieve the same performance goals using different strategies (Day et al.,
1995). Utilizing the DEA for resolving trade-off decisions has the following five advantages in com-
parison to using parametric performance benchmarking approaches (Becker et al., 2012c): First, the
subjectivity of choosing weights based on the beliefs of managers is replaced by the deduction of
Proceedings of the 21st European Conference on Information Systems
4

weights from the data. Second, the DEA shows each DMU in the best light possible and thereby
avoids bias in choosing weights. Third, further development of the benchmark does not necessitate a
re-evaluation of the weights, as they are computed automatically. Fourth, no hidden re-pricing of the
weights occurs that could degrade a champion in one distinct performance measure. Fifth, the ap-
proach is flexible enough to adapt to every potential trade-off solution of each DMU that is achievable
with the given sets of inputs and outputs.
2.3 Search processes and decision making
When analyzing how performance evaluation and organizational change is embedded into decision
making we take a behavioral view, along lines of thought introduced in Cyert and March’s (1963)
classic “A behavioral theory of the firm”. In particular, we build upon work of Greve (2003), who
analyzed in detail how performance feedback affects the organization and how learning processes and
change are being triggered. Within this framework, decision makers in firms are the basic actors.
These decision makers, of which there are many, belong to different parts of a firm whose perfor-
mance is measured with any suitable measure, e.g., a financial ratio. Decision makers then have a so
called aspiration level, which constitutes the critical level of performance that should be achieved. The
concept of satisficing means that any decision will be acceptable as long as it leads to performance
above the aspiration level (Simon, 1979). There is no need to find a global optimum.
Whenever performance is below the aspiration level, a decision maker perceives this as a problem.
This triggers search processes with the goal of finding an acceptable solution. Naturally, the search
process should not be conceptualized as a structured mathematical optimization problem but rather as
a more unstructured process based on heuristics and incomplete information (Cyert and March, 1963).
This is called problemistic search and is an important cause of organizational change.
However, other causes of change should be considered. A second important one is based on slack
which means excess resources available to decision makers. In the behavioral theory of the firm, slack
enables innovation and thus change. An even stronger point is made by the resource based view of the
firm, according to which slack does not only enable but also drive innovation, since decision makers
strive to make the most out of what is given (Pitelis, 2007). Consequently, change will not only take
place if performance is below the aspiration level (problemistic search) but also if it is above, provided
that slack resources are available.
While both types of changes may be observed, they are not the same. Each change process comes with
a certain risk. A project may not deliver the desired outcome or may simply fail. Taking prospect theo-
ry (Kahneman and Tversky, 1979) into account, one can reason about the nature of change processes
with respect to risk. With the aspiration level being the reference point of the decision maker, prospect
theory says he or she will likely be risk-averse for gains and risk-seeking when it comes to losses. This
idea is picked up in performance feedback theory, as it means that problemistic search processes will
likely involve more risk than those triggered by slack (Greve, 2008).
An important part of describing change due to performance feedback is investigating how aspiration
levels are being set. Once a suitable performance measure is chosen, the aspiration level with respect
to this measure is often conceptualized as a function depending on different factors (Cyert and March,
1963). The first important factor is historical aspiration levels, which means that decision makers ex-
pect performance to change incrementally instead of a expecting a sudden huge jump (Levinthal and
March, 1981). Secondly, there is also a social component involved in aspiration level formation. A
decision maker will compare himself/herself to peers and will adjust his/her level to some extent to
their performance (Greve, 1998). Thirdly, the current performance is also influencing the aspiration
level (Cyert and March, 1963).
On an aggregate level, managing the interplay of the aspiration levels of all decision makers in a firm
is performed based on combining individual aspiration levels. Traditionally, this is conceptualized as a
top to bottom process in which higher levels of the organization set goals that define the goals of lower
Proceedings of the 21st European Conference on Information Systems
5

levels. There is however no guarantee for consistency, as lower levels may decide to substitute what
has been imposed on them by self-defined goals, both with respect to performance measures as well as
desirable aspiration levels (Greve, 1998). Thus, the performance feedback system is the result of com-
plex negotiation processes between decision makers or groups of them (Locke and Latham, 2002).
3 Modeling Front Stage/Back Stage Interaction Routines as a Trade-Off Decision in Service Co-Creation
In this section we conceptualize the management of ostensive interaction routines in service systems
as a decision problem of selecting and retaining the most efficient performances of an interaction rou-
tine. Since performance metrics for estimating the efficiency of interaction routines in service systems
are subject to resolving trade-offs in the performance calculus, the DEA is well suited for this purpose.
As suggested by literature on service blueprinting, processes in service systems can be conceptualized
with three layers, including a service provider’s front and back stage as well as the customer. In the
front stage, capacity must match customers’ peak demand as production planning is inherently inexact.
In the back stage, production planning can be matched to resource availability. Consequently, the front
stage exhibits a high task uncertainty (Chaset and Tansik, 1983). The question of which layer to put an
activity into is essentially a trade-off rationale about “…moving some services from the front stage to
the back stage (or vice versa), replacing or augmenting a person-to-person service with self-service, or
eliminating it completely through automation,…” (Glushko & Tabas 2009, p. 418). The service blue-
print frames how the co-creation of value is performed in interaction of service provider and customer.
Activity 1
Activity 2 Activity 5
Activity 3 Activity 4
Activity 6
Activity 7 Activity 8
3: Strategy
Industrialize front-
stage activities by
standardization and
streamline them for
efficiency.
Strategy 2: Adapt
activities formerly
carried out in the
back-stage for
customers.
Strategy 1:
Outsource
activities to
customers (self-
service concept)
Strategy 4: Grow
business by
incorporating
adjacencies into
customer solutions.
Cu
sto
me
r’s
acti
vit
ies
Fro
nt
sta
ge a
cti
vit
ies
Bac
k s
tag
e
acti
vit
ies
Figure 2. Service blueprint and strategies for re-designing the co-creation of service(s), adapted
from Beverungen (2010)
The decisions about ‘moving activities between layers’ can be classified by employing the framework
depicted in Figure 2. It is based on the service blueprint and reads as follows. Imagine a service pro-
cess consisting of activities 1 to 8, each assigned to one layer of the service blueprint. A service man-
ager might now want to improve this outline. One possible strategy might be moving activities form
the front stage to the customer (Strategy 1). This strategy, sometimes denoted as outsourcing tasks to
the customer, is frequently performed in self-service scenarios. The provider’s share at the co-
production is lowered, the customers’ share increased. Consequently, as argued by Glushko and Tabas
(2009), this can lower costs for service providers by employing the customer as an ‘employee’ free of
charge (Sousa, 2006). On the other hand, current research highlights, that some customer groups are
prone for neglecting self-services (Meuter et al., 2005). Another example for a Strategy-1-type is a
system to provide inter-customer support. This may help to attain cost benefits and improve customer
Proceedings of the 21st European Conference on Information Systems
6
satisfaction (Rosenbaum and Massiah, 2007). However, such behavior requires skilled and motivated
customers. Furthermore, quality is at risk and efforts must be invested to motivate customers
(Hohnsbehn, 2012). Another option is shifting activities from the back stage to the front stage (Strate-
gy 2). This strategy brings about the benefits of employing experts for particular tasks, yielding more
customer individualization, flexibility and responsiveness. However, if labor intensive activities are
conducted in the front stage, these activities decrease the overall efficiency of the service system. The
decision to remove activities form the front stage (Strategy 3), yields the efficiency potential of back
office activities but denies the sales opportunities related to front office activities (Chase et al., 1984).
In addition, such a strategy enables “production efficiencies and economies of scale” but “simplifies or
constrains what can be offered in the front stage services” (Glushko & Tabas 2009, p. 414). As a con-
sequence, service businesses are struggling with the trade-off between improving service to customers
and cutting costs by using less (expensive) back stage labor (Rust and Huang, 2012). Finally, the
fourth option is relieving the customer from certain activities by conducting them in the front stage
(Strategy 4). In some cases, customers may want to have certain efforts done by someone else or ac-
tivities can be done more efficient by the provider’s own employees (Frei, 2006). This classic accom-
modation approach—though not usually desirable—can be favorable if customers exhibit a willing-
ness to pay and if front stage employees cope well with service variability.
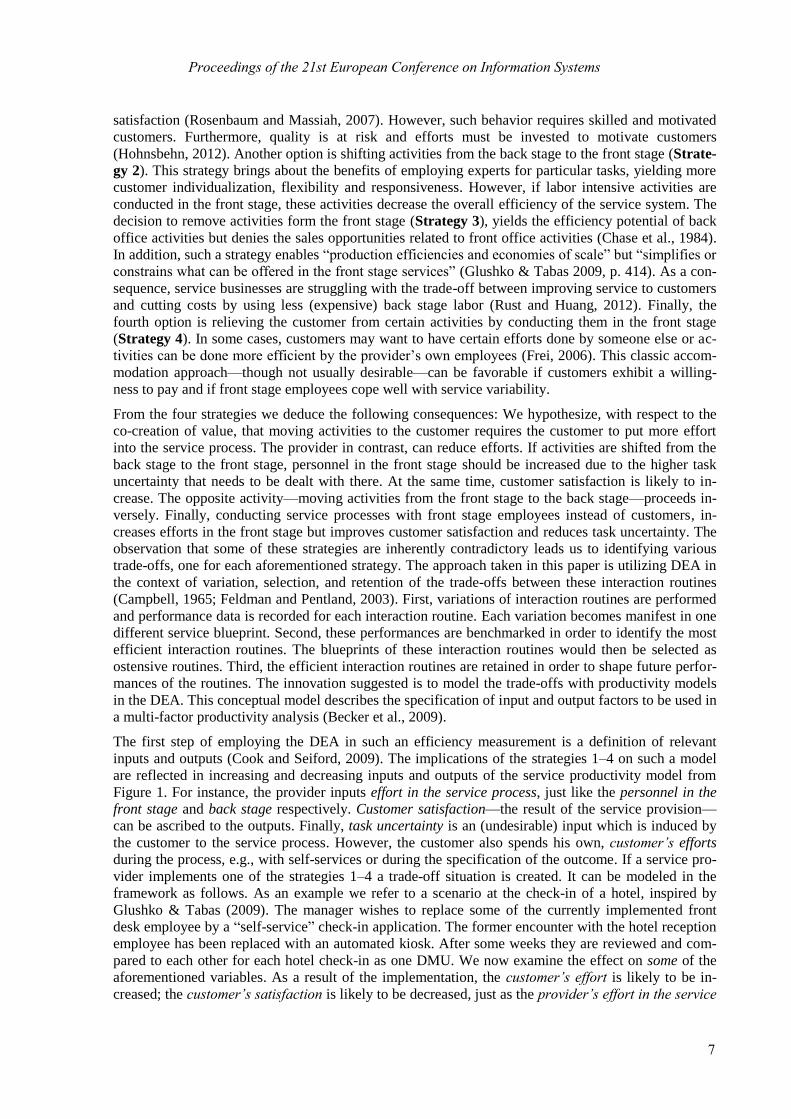
From the four strategies we deduce the following consequences: We hypothesize, with respect to the
co-creation of value, that moving activities to the customer requires the customer to put more effort
into the service process. The provider in contrast, can reduce efforts. If activities are shifted from the
back stage to the front stage, personnel in the front stage should be increased due to the higher task
uncertainty that needs to be dealt with there. At the same time, customer satisfaction is likely to in-
crease. The opposite activity—moving activities from the front stage to the back stage—proceeds in-
versely. Finally, conducting service processes with front stage employees instead of customers, in-
creases efforts in the front stage but improves customer satisfaction and reduces task uncertainty. The
observation that some of these strategies are inherently contradictory leads us to identifying various
trade-offs, one for each aforementioned strategy. The approach taken in this paper is utilizing DEA in
the context of variation, selection, and retention of the trade-offs between these interaction routines
(Campbell, 1965; Feldman and Pentland, 2003). First, variations of interaction routines are performed
and performance data is recorded for each interaction routine. Each variation becomes manifest in one
different service blueprint. Second, these performances are benchmarked in order to identify the most
efficient interaction routines. The blueprints of these interaction routines would then be selected as
ostensive routines. Third, the efficient interaction routines are retained in order to shape future perfor-
mances of the routines. The innovation suggested is to model the trade-offs with productivity models
in the DEA. This conceptual model describes the specification of input and output factors to be used in
a multi-factor productivity analysis (Becker et al., 2009).
The first step of employing the DEA in such an efficiency measurement is a definition of relevant
inputs and outputs (Cook and Seiford, 2009). The implications of the strategies 1–4 on such a model
are reflected in increasing and decreasing inputs and outputs of the service productivity model from
Figure 1. For instance, the provider inputs effort in the service process, just like the personnel in the
front stage and back stage respectively. Customer satisfaction—the result of the service provision—
can be ascribed to the outputs. Finally, task uncertainty is an (undesirable) input which is induced by
the customer to the service process. However, the customer also spends his own, customer’s efforts
during the process, e.g., with self-services or during the specification of the outcome. If a service pro-
vider implements one of the strategies 1–4 a trade-off situation is created. It can be modeled in the
framework as follows. As an example we refer to a scenario at the check-in of a hotel, inspired by
Glushko & Tabas (2009). The manager wishes to replace some of the currently implemented front
desk employee by a “self-service” check-in application. The former encounter with the hotel reception
employee has been replaced with an automated kiosk. After some weeks they are reviewed and com-
pared to each other for each hotel check-in as one DMU. We now examine the effect on some of the
aforementioned variables. As a result of the implementation, the customer’s effort is likely to be in-
creased; the customer’s satisfaction is likely to be decreased, just as the provider’s effort in the service
Proceedings of the 21st European Conference on Information Systems
7

process. Thus the two customer variables are likely to feature a negative correlation. As the DEA is
able to incorporate these changes in the same model (along with other factors from Figure 1), the un-
derlying trade-off is depicted by means of the DEA. The next step of the analysis encompasses the
computation of efficiency-values for the two alternatives. Therefore, customer satisfaction scores (to
measure customer’s satisfaction) along with accounting data (to measure the provider’s effort in the
service process) and customer processing time (to measure customer’s effort) etc. is necessary. By
comparing the efficiency values the most efficient trade-off options are identified.
4 Research Directions
To understand the effects of applying a benchmarking method such as the one described before in an
actual organization, a thorough theoretical analysis is necessary. In line with our research question, we
outline underpinnings that arise in this context from the perspective of behaviorism. We focus our
predictions on the effect of a DEA-based service benchmarking mainly on two aspects: Search pro-
cesses as well as aspiration levels and satisficing.
4.1 Search processes
Consistent with the behavioral theory of the firm, there are two fundamental processes triggering in-
novation: Problemistic search and slack search (see section 2.3). Bearing in mind the scenario given in
this paper, there is a close connection to measuring performance with DEA. Due to the very nature of
the DEA there will always be several 100% efficient DMUs, and 100% efficiency is the most that can
be achieved. Consequently, the aspiration level of the corresponding decision makers will be met, no
matter what the performance level of the entire population is. As a result, problemistic search will
never be triggered in these efficient DMUs, but it is desirable to innovate. Without pressure of falling
short with respect to aspiration, only slack can drive search processes. This kind of innovation is nec-
essary if the firm ever wants to push the boundaries of what is possible with its current technology.
This suggests the DEA might in fact inhibit innovation if performance is managed solely by DEA
target scores. To counteract, slack resources must be made available to inefficient DMUs. Possibly,
they could be provided in form of rewards for excellent performance. Another possibility is to create
dedicated research and development units. Thereby, the efficient frontier can be challenged. The ques-
tion is how management schemes reflecting this theoretical logic can be implemented.
Starting points investigating how such routines could be implemented can be found in the literature.
For instance, Nohria and Gulati (1996) hypothesize an inverse U-shaped relationship between slack
and innovation. This means neither too few nor too many resources should be made available to pro-
voke search processes. The rationale is that, while too few resources limit slack search processes, too
many resources will reduce managerial discipline, leading to inferior results. Decision makers need to
feel a certain pressure, yet how strong it should be is not easily determined. Further empirical research
may provide valuable insights both into appropriate levels of pressure as well as how to exert it. Other
studies investigated to which degree there is a direct effect of slack on innovation (Geiger and Cashen,
2002). In general, the question is not if the effect exists but rather in which conditions it is strongest
(Argote and Greve, 2007). This needs to be investigated for service processes, in particular.
4.2 Aspiration levels and satisficing
Another question deserving attention is how individual aspiration levels of decision makers come into
being. Several aspects are of particular interest. As a starting point, it is important to identify under
which conditions aspiration levels can be managed at all. As discussed in section 2.3, they are the re-
sult of complex negotiation processes. Therefore, these processes need to be understood to manage
them. In particular, it is important to identify the factors determining whether a decision maker adopts
performance measures and goals defined by superiors. Only then superiors can hope to influence be-
havior, as this is the prerequisite for managing through problemistic search. To approach this question,
Proceedings of the 21st European Conference on Information Systems
8
the process of aspiration level formation requires attention, decomposed into two parts: First, a per-
formance measure is chosen; second the aspiration level with respect to this measure is formed.
Regarding the first part there exists a huge body of research investigating how performance measures
should be designed (Gibbs et al., 2009). For instance, the degree to which the variation in the perfor-
mance measure is controllable by decision makers can have a huge impact on acceptance (Baker,
2002). If decision makers have only few control over the outcome, they may perceive striving for im-
provement as too risky and thus not worth the effort. In terms of the DEA, there are numerous sensi-
tivity analyses evaluating the stability of its results (Charnes et al., 1984; Cooper et al., 2001;
Jahanshahloo, 2004). While results are generally positive, meaning that efficiencies do not change
very much when small changes are made to the data, an extensive analysis is yet to be performed. The
question is, if DEA allows defining performance measures that decision makers are willing to accept.
Another popular quality criterion is whether a measure actually provokes desired behavior or if actors
can game the system (Kerr, 1975). While such distorted performance measures would trigger problem-
istic search if accepted by decision makers, they could do more bad than good. For measuring perfor-
mance of service processes in a front stage/back stage scenario, it is unclear how performance should
be measured. Research discussed above can provide starting points and a framework in which candi-
date measures could be developed, compared, and evaluated. As for the DEA, there exists a body of
research investigating the agency perspective, beginning with Banker (1980) and later Bogetoft (2000)
and Agrella et al. (2002). Starting with this literature, the question is on how to align performance
measures—that are based on DEA—with incentives.
As for the second part of setting the aspiration level, several factors influencing it have been discussed
in section 2.3. In the light of the social aspect, which says aspiration levels are influenced by the per-
formance of similar decision makers, DEA appears a particularly suitable method of performance
measurement. As a benchmarking method, evaluation relative to peers is built in. This could make
setting target values easier, as those factors do not require designated attention.
Even though the social component is virtually eliminated, the basic problem remains: How can man-
agers set suitable target efficiency values for inefficient DMUs such that aspiration levels of subordi-
nate decision makers are influenced in a beneficial way? Again, there is solid theory to work with.
Goal setting theory (Locke, 1968) is the study of how peoples’ behavior is affected by setting them
goals. It deals with describing the ways in which behavior is changed (e.g., see Locke and Latham
(2002)) but also investigates the effect of goal setting on task performance (Locke et al., 1981) and
also moderating effects such as goal acceptance (Erez and Kanfer, 1983). This research may inform
design decisions of concrete performance management systems in order to embed a DEA efficiency
measure into management processes. Especially the aspect of goal acceptance will have several inter-
action points with the question of performance measure acceptance as discussed above.
For instance, goal setting theory has implications for determining the target value managers should
define with respect to a performance measure. If the target is too ambitious in the sense that the deci-
sion maker is very unlikely to achieve an acceptable outcome, goal setting theory predicts bad perfor-
mance, whereas a goal too easy to achieve will not result in good performance either. Best perfor-
mance is achieved if moderately hard, challenging goals are set (Locke and Latham, 2002). The impli-
cation for DEA target efficiencies is that asking people to do their best is insufficient as long as no
point of reference identifies whether this goal has been achieved (Bryan and Locke, 1967). However,
requiring each DMU to be 100% efficient may give decision makers the impression of being asked to
achieve the impossible, resulting in goal rejection. Thus, proper target levels have to be determined for
each DMU separately, by performing a negotiation process to ensure commitment.
Theories of organizational commitment of managers might be of interest when designing a perfor-
mance measurement system. In contemporary work, it is structured into different types. Cohen (2007)
distinguishes instrumental and affective commitment. The former is commitment stemming from ben-
efits the organization provides to the individual. Performance measures and incentive systems based
thereupon can have a strong influence on it. The latter is commitment stemming from emotional at-
Proceedings of the 21st European Conference on Information Systems
9
tachment and is considered important as it is a resource not easy to imitate (Gong et al., 2009). Thus, it
is even more important to assess to effects of performance measures on affective commitment.
5 Conclusion and Outlook
In this paper, we conceptualize service co-creation as interaction routines involving service providers
and customers. In order to selectively retain the most efficient interaction routines, service providers
have to implement a method that allows them to distinguish between efficient and non-efficient inter-
action routines. A crucial factor for service process design is to assign activities in the process to the
customer, the service provider’s front stage, or the service provider’s back stage. Since there are plenty
of arguments to put an activity on each of these layers, we conceptualize this problem as a trade-off
decision. Data Envelopment Analysis (DEA) is a powerful method for resolving trade-off decisions
based on an efficiency calculus. Therefore, we argue that DEA can be applied to selectively retain
efficient interaction routines, by using performances of interaction routines as DMUs. The approach
can be applied in all scenarios in which sufficient data can be accessed. However, it seems more ame-
nable to scenarios with low variation and high reliance on IT than to complex interaction scenarios, in
which data is scarce and performances lack comparability, inhibiting the suitability of benchmarking
approaches. Once the efficient routines have been retained, they can guide future performances as
patterns that lead to increased efficiency; on the other hand, authoritative literature reminds us that
individuals can and will adapt ostensive routines when performing them in their daily business
(Feldman and Pentland, 2003), thereby creating new variations that challenge the established way of
performing service processes. This can enable continuous learning processes.
The proposed approach opens up an array of interesting research vistas to be investigated in quantita-
tive studies, design research studies, or behavioral research. In this paper, we discussed some promis-
ing questions based on the behavioral theory of the firm (Cyert and March, 1963). With respect to
search processes, we identified problemistic search and slack search as most important approaches.
Regarding aspiration levels set by decision makers, we discussed choosing appropriate performance
measures and setting appropriate goals with respect to these measures. Several related theories such as
goal setting theory or the resource-based view are decisive to that end.
Acknowledgements
The German Federal Ministry of Education and Research (BMBF) funded this work in the scope of
the research project ServDEA, promotion sign 01FL10015. In addition, we gratefully acknowledge the
support provided by the project management agency German Aerospace Center (PT-DLR).
References
Agrella J P, Bogetoft, P. and Tind, J. (2002). Incentive plans for productive efficiency, innovation and
learning. International Journal of Production Economics, 78 (1), 1–11.
Alter, S. (2012). Metamodel for Service Analysis and Design Based on an Operational View of
Service and Service Systems. Service Science, 4 (3), 218–235.
Argote, L. and Greve, H.R. (2007). A Behavioral Theory of the Firm--40 Years and Counting:
Introduction and Impact. Organization Science, 18 (3), 337–349.
Athanassopoulos, A.D. and Ballantine, J. (1995). Ratio and Frontier Analysis for Assessing Corporate
Performance: Evidence from the Grocery Industry in the UK. J. of the OR Soc., 46 (4), 427–440.
Baker, G. (2002). Distortion and Risk in Optimal Incentive Contracts. The Journal of Human
Resources, 37 (4), 728–751.
Banker, R.D. (1980). A game theoretic approach to measuring efficiency. European Journal Of
Operational Research, 5 (4), 262–266.
Bardhan, I.R. et al. (2010). An Interdisciplinary Perspective on IT Services Management and Service
Science. Journal of Management Information Systems, 26 (4), 13–64.
Proceedings of the 21st European Conference on Information Systems
10

Becker, J. et al. (2012a). Bridging the Gap Between Manufacturing and Service Through IT-Based
Boundary Objects. IEEE Transactions on Engineering Management, in print .
Becker, J. et al. (2012b). Designign Interaction Routines in Service Networks: A Modularity and
Social Construction-Based Approach. Scandinavian Journal of Information Systems, forthcomin .
Becker, J. et al. (2009). Model-Based Decision Support for the Customer-Specific Configuration of
Value Bundles. EMISA, 4 (1), 26–38.
Becker, J. et al. (2012c). Resolving Trade-offs in Service Performance Benchmarking Using Data
Envelopment Analysis. In Proceedings of the PACIS 2012. Ho-Chi-Minh-City.
Becker, M.C. (2004). Organizational routines: a review of the literature. Industrial and Corporate
Change, 13 (4), 643–678.
Beverungen, D. (2010). Implementing Value-Driven Service Management – Towards an IT Artifact-
Based Approach for Managing Customer Solutions. In Proceedings of the Proceedings of the 10th
European Academy of Management Conference. Rome, Italy.
Beverungen, D., Knackstedt, R. and Winkelmann, A. (2012). Identifying e-Service Potential from
Business Process Models – A Theory Nexus Approach. e-Service Journal, 8 (1), 45–74.
Bogetoft, P. (2000). DEA and activity planning under asymmetric information. Journal of Productivity
Analysis, 13 (1), 7–48.
Bryan, J.F. and Locke, E.A. (1967). Goal setting as a means of increasing motivation. The Journal of
applied psychology, 51 (3), 274–277.
Campbell, D.T. (1965). Variation and selective retention in socio-cultural evolution H. R. Barringer,
G. I. Blanksten, and R. W. Mack, eds. Social Change in Developing Areas: A Reinter-pretatioof
Evolutionary Theory, 19–48.
Charnes, A. et al. (1984). Sensitivity and stability analysis in DEA. Annals of OR 1, 2 (1), 139–156.
Chase, R., Northcraft, G.. and Wolf, G. (1984). Designing high-contact service systems: application to
branches of a savings and loan. Decision Sciences, 15 (4), 542–569.
Chaset, R.B. and Tansik, D.A. (1983). The Customer Contact Model for Organization Design.
Management Science, 29 (9), 1037–1051.
Cohen, A.J. (2007). Commitment before and after: An reconceptualization of organizational
commitment. Hum. Res. Manage, 17 , 336–354.
Cook, W.D. and Seiford, L.M. (2009). Data envelopment analysis (DEA) – Thirty years on. European
Journal Of Operational Research, 192 (1), 1–17.
Cooper, W.W. et al. (2001). Sensitivity and Stability Analysis in DEA: Some Recent Developments.
Journal of Productivity Analysis, 15 (3), 217–246.
Cyert, R. and March, J.G. (1963). A Behavioral Theory of the Firm New Jersey, Prentice Hall.
Day, D.L., Lewin, A.Y. and Li, H. (1995). Strategic leaders or strategic groups: A longitudinal data
envelopment analysis of the U.S. brewing industry. European Journal of OR, 80 (3), 619–638.
Emrouznejad, A. and Witte, K. De (2010). COOPER-framework: A unified process for non-
parametric projects. European Journal of Operational Research, 207 (3), 1573–1586.
Erez, M. and Kanfer, F.H. (1983). The role of goal acceptance in goal setting and task performance.
Academy of management review Academy of Management, 8 (3), 454–463.
Feldman, M.. and Pentland, B.. (2003). Reconceptualizing organizational routines as a source of
flexibility and change. Administrative Science Quarterly, 48 (1), 94–118.
Frei, F.X. (2006). Breaking the trade-off between efficiency and service. Harv. Bus. Review, 84 (11).
Geiger, S.W. and Cashen, L.H. (2002). A multidimensional examination of slack and its impact on
innovation. Journal of Managerial Issues, 14 (1), 68–84.
Gibbs, M.J. et al. (2009). Performance Measure Properties and Incentive System Design. Industrial
Relations A Journal of Economy and Society, 48 (2), 237–264.
Glushko, R.J. and Tabas, L. (2009). Designing service systems by bridging the “front stage” and “back
stage”. Information Systems and e-Business Management, 7 (4), 407–427.
Gong, Y. et al. (2009). Human resources management and firm performance: The differential role of
managerial affective and continuance commitment. J. of Applied Psychology, 94 (1), 263–275.
Greve, H.R. (2003). Organizational Learning from Performance Feedback - A Behavioral Perspective
on Innovation and Change Cambridge, UK, Cambridge Univ Press.
Proceedings of the 21st European Conference on Information Systems
11

Greve, H.R. (2008). Organizational routines and performance feedback M. C. Becker, ed. Handbook
of organizational routines, 187–204.
Greve, H.R. (1998). Performance, Aspirations, and Risky Organizational Change. Administrative
Science Quarterly, 43 (1), 58–86.
Grönroos, C. and Ojasalo, K. (2004). Service productivity – Towards a conceptualization of the
transformation of inputs into economic results in services. J. of Bus. Research, 57 (4), 414–423.
Hohnsbehn, R. (2012). “Kunden helfen Kunden”-Ansätze im Kundenservice. Marketing und
Multimedia Blog.
Jahanshahloo, G. (2004). Sensitivity and stability analysis in DEA with interval data. Applied
Mathematics and Computation, 156 (2), 463–477.
Kahneman, D. and Tversky, A. (1979). Prospect theory: An analysis of decision under risk.
Econometrica, 47 (2), 263–291.
Katzan, H. (2008). Service Science: Concepts, Technology, Management – A Guide to Service
Science for academicians and practitioners Bloomington, IN, USA, iUniverse.
Kerr, S. (1975). On the Folly of Rewarding A, While Hoping for B. Academy of Man. J., 18 (4), 769.
Levinthal, D. and March, J.G. (1981). A model of adaptive organizational search. Journal of Economic
Behavior & Organization, 2 (4), 307–333.
Locke, E.A. et al. (1981). Goal setting and task performance: 1969-1980. G. A. Peschek, C. Obinger,
and G. Renger, eds. Psychological Bulletin, 90 (1), 125–152.
Locke, E.A. (1968). Toward a Theory of Task Motivation and Incentives. Organizational Behavior
and Human Performance, 3 (2), 157–189.
Locke, E.A. and Latham, G.P. (2002). Building a practically useful theory of goal setting and task
motivation: A 35-year odyssey. American Psychologist, 57 (9), 705–717.
Maglio, P.P. et al. (2009). The service system is the basic abstraction of service science. Information
Systems and E-Business Management, 7 (4), 395–406.
Meuter, M.L. et al. (2005). Choosing Among Alternative Service Delivery Modes: An Investigation of
Customer Trial of Self-Service Technologies. Journal of Marketing, 69 (2), 61–83.
Nohria, N. and Gulati, R. (1996). Is Slack Good or Bad for Innovation? Academy of Man. Journal, 39
(5), 1245–1264.
Pitelis, C.N. (2007). A Behavioral Resource-Based View of the Firm: The Synergy of Cyert and
March (1963) and Penrose (1959). Organization Science, 18 (3), 478–490.
Rosenbaum, M.S. and Massiah, C. a. (2007). When Customers Receive Support From Other
Customers: Exploring the Influence of Intercustomer Social Support on Customer Voluntary
Performance. Journal of Service Research, 9 (3), 257–270.
Rust, R.T. and Huang, M. (2012). Optimizing Service Productivity. J. of Marketing, 76 (2), 47–66.
Salvato, C. and Rerup, C. (2011). Beyond collective entities: multilevel research on organizational
routines and capabilities. Journal of Management, 37 (2), 468–490.
Shostack, G.L. (1982). How to design a service. European Journal of Marketing, 16 (1), 49–63.
Simon, H.A. (1979). Models of Thought Yale University Press.
Sousa, R. (2006). Service Quality in Multichannel Services Employing Virtual Channels. Journal of
Service Research, 8 (4), 356–371.
Vargo, S.L. and Lusch, R.F. (2004). Evolving to a new dominant logic for marketing. The Journal of
Marketing, 68 (1), 1–17.
Vargo, S.L., Lusch, R.F. and Archpru, A. (2010). Advancing Service Science with Service-Dominant
Logic - Clarifications and Conceptual Development P. . Maglio, C. . Kieliszewski, and J. . Spohrer,
eds. Handbook of Service Science: Research and Innovations in the Service Economy, 133–156.
Winter, S.G. (1964). Economic “natural selection” and the theory of the firm. Yale Economic Essays,
4 (1), 225–272.
Zeithaml, V. and Bitner, M.J. (1996). Services Marketing New York, NY, McGraw-Hill.
Zeithaml, V.A., Parasuraman, A. and Berry, L.L. (1985). Problems and strategies in services
marketing. J. Marketing, 49 (2), 33–46.
Proceedings of the 21st European Conference on Information Systems
12