PERFORMANCE BENCHMARKING IN THE PUBLIC · PDF filePERFORMANCE BENCHMARKING IN THE PUBLIC...
43
1 PERFORMANCE BENCHMARKING IN THE PUBLIC SECTOR: THE UNITED KINGDOM EXPERIENCE by Jeremy Cowper and Dr. Martin Samuels Next Steps Team, Office of Public Services Cabinet Office, United Kingdom Introduction There has been significant reform of the public sector in the UK since 1979. A wide range of initiatives has affected every area of activity, including central government, the National Health Service and local government. A common feature of these initiatives is the drive to improve value for money. Amongst the more important individual initiatives have been the creation of Next Steps Agencies to undertake many of the executive functions of central government, market testing and compulsory competitive tendering of many operational functions throughout the public sector, the transfer of previously public businesses into the private sector where this was feasible, and the creation of internal markets, such as in health and education, to replicate competitive environments. This quest for improved value for money has led to the development of a range of efficiency tools. Within this context, “benchmarking” is one of the several tools which are increasingly recognised as particularly valuable. “Benchmarking” as an efficiency tool is based on the principle of measuring the performance of one organisation against a standard, whether absolute or relative to other organisations. It can be used to: - assess performance objectively; - expose areas where improvement is needed; - identify other organisations with processes resulting in superior performance, with a view to their adoption; - test whether improvement programmes have been successful. Benchmarking can be effective at all levels of operation, from the conduct of individual processes, such as invoice handling, to the operational performance of organisations with tens of thousands of staff, such as a welfare benefits delivery agency. Benchmarking as a family of techniques has three main aspects. Using the terminology adopted in a paper presented to the November 1995 PUMA Performance Management meeting by Dr Sylvie Trosa and Suzanne Williams in their paper on the Australian experience of benchmarking, these are: - Standards benchmarking -- setting a standard of performance which an effective organisation could be expected to achieve. The publication of a challenging standard can motivate staff and demonstrate a commitment to improve the service provided. Information on an organisation's
Transcript of PERFORMANCE BENCHMARKING IN THE PUBLIC · PDF filePERFORMANCE BENCHMARKING IN THE PUBLIC...
1
PERFORMANCE BENCHMARKING IN THE PUBLIC SECTOR:THE UNITED KINGDOM EXPERIENCE
by Jeremy Cowper and Dr. Martin SamuelsNext Steps Team, Office of Public Services
Cabinet Office, United Kingdom
Introduction
There has been significant reform of the public sector in the UK since 1979. A wide range ofinitiatives has affected every area of activity, including central government, the National Health Serviceand local government. A common feature of these initiatives is the drive to improve value for money.
Amongst the more important individual initiatives have been the creation of Next Steps Agenciesto undertake many of the executive functions of central government, market testing and compulsorycompetitive tendering of many operational functions throughout the public sector, the transfer ofpreviously public businesses into the private sector where this was feasible, and the creation of internalmarkets, such as in health and education, to replicate competitive environments. This quest for improvedvalue for money has led to the development of a range of efficiency tools. Within this context,“benchmarking” is one of the several tools which are increasingly recognised as particularly valuable.
“Benchmarking” as an efficiency tool is based on the principle of measuring the performance ofone organisation against a standard, whether absolute or relative to other organisations. It can be used to:
− assess performance objectively; − expose areas where improvement is needed; − identify other organisations with processes resulting in superior performance, with a view to
their adoption; − test whether improvement programmes have been successful.
Benchmarking can be effective at all levels of operation, from the conduct of individualprocesses, such as invoice handling, to the operational performance of organisations with tens ofthousands of staff, such as a welfare benefits delivery agency.
Benchmarking as a family of techniques has three main aspects. Using the terminology adoptedin a paper presented to the November 1995 PUMA Performance Management meeting by Dr Sylvie Trosaand Suzanne Williams in their paper on the Australian experience of benchmarking, these are:
− Standards benchmarking -- setting a standard of performance which an effective organisationcould be expected to achieve. The publication of a challenging standard can motivate staff anddemonstrate a commitment to improve the service provided. Information on an organisation's
2
performance against the standard can be used as a monitoring tool by its principals --ministers or councillors.
− Results benchmarking -- comparing the performance of a number of organisations providing asimilar service. In the public sector, this technique can serve to allow the public to judgewhether their local provider makes effective use of its resources, compared to other similarproviders. In the absence of the competitive pressures which operate in the private sector, thiscan provide a significant incentive to improve efficiency.
− Process benchmarking -- undertaking a detailed examination within a group of organisationsof the processes which produce a particular output, with a view to understanding the reasonsfor variations in performance and incorporating best practice.
The emphasis of this paper is on the use of benchmarking within UK central government.However, it also examines examples of the use of all three aspects of benchmarking within the publicsector in the UK, seeking to outline the philosophies behind the approaches used, to give brief details ofthe methodologies adopted, to highlight issues and problems which have arisen, and to consider the extentto which the results of benchmarking have been used in decision making.
Philosophy
At the heart of many of the public sector reform initiatives in the UK has been the philosophythat value for money can be best achieved by a separation of roles between those who set the policy andthose who deliver it -- between the purchaser and the provider. This shift to a more contract-based systemgives managers freedom to manage the operational delivery of services, within the policy and resourcesframework established by the political authorities. Greater clarity of roles and responsibilities has provedto be a key feature in facilitating improved performance.
Within this framework, however, managers must have incentives to use their freedoms toimprove the efficiency and effectiveness of their organisations. In the private sector, this incentive issupplied by the competitive nature of the market -- low quality organisations will go out of business. Themajority of public sector services, by contrast, do not operate in a competitive environment and thereforedo not experience this pressure to improve.
A significant strand of the UK Government’s drive to improve the performance of the publicsector has been the creation of alternative means of replicating the pressure to improve which exists in theprivate sector. This has included requirements set by central government for local authorities to put certainactivities out to competitive tender and for all public services to consider areas of work for transfer out tothe private sector.
As experience with these initiatives grows, the focus is shifting from specifying the use ofparticular efficiency tools towards allowing organisations to select the techniques most appropriate to theirparticular circumstances, though they may be challenged to justify their choices. This freedom, however,is within the context of moving towards measuring and publishing organisations’ performance, as a meansto identify good practice and encourage the pursuit of improvements -- i.e. benchmarking. Through thisapproach, the UK seeks to achieve continuous improvement of public services, while retaining publicaccountability for service provision.
3
Standards Benchmarking (1) -- Next Steps Agencies
Background
In October 1995, the Deputy Prime Minister, Michael Heseltine, announced his intention tobenchmark the performance of central government Next Steps Executive Agencies against both the privatesector and, in due course, public services in other countries.
It is expected that the restructuring element in the Next Steps project, launched in 1988, willshortly be completed. Currently, 375,000 civil servants -- 71% of the total -- work in the 125 Next Stepsagencies, or organisations operating fully on Next Steps lines. Benchmarking performance on such a scaleis a very major task. It was therefore decided to begin the process with a pilot exercise to test one possibleapproach.
Methodology
Next Steps Agencies perform most of the executive functions of central government, rangingfrom the payment of welfare benefits to the provision of forensic services to the police, and frompreserving official records to protecting fish stocks. As a general rule, each Agency is unique within itsown area of business, making direct comparison between the performance of different Agencies -- resultsbenchmarking -- problematic.
Following research and consultation with Agencies, it was decided that the pilot exercise shouldseek to measure the total activity of Agencies. By stepping back from the specific activities undertaken byeach Agency, it would be possible to examine performance in key areas, such as people management,which are common to all organisations, regardless of their area of business. This approach has theadvantage of allowing comparisons to be made between Agencies and complements work to assess betterthe tasking and the business results of Agencies which is the subject of a parallel Government initiative.
Tenders were invited from consultants to undertake the pilot exercise. The proposals receivedwere broadly divided into those which intended to develop a methodology specifically for benchmarkingNext Steps Agencies and those which applied an existing model. Since a key objective of the exercise wasto facilitate benchmarking with the private sector, an existing methodology was selected, allowingcomparison with existing data on other organisations. The tender which met the requirements most fullywas the proposal from the British Quality Foundation to use its ASSESS RapidScore product to undertakestandards benchmarking.
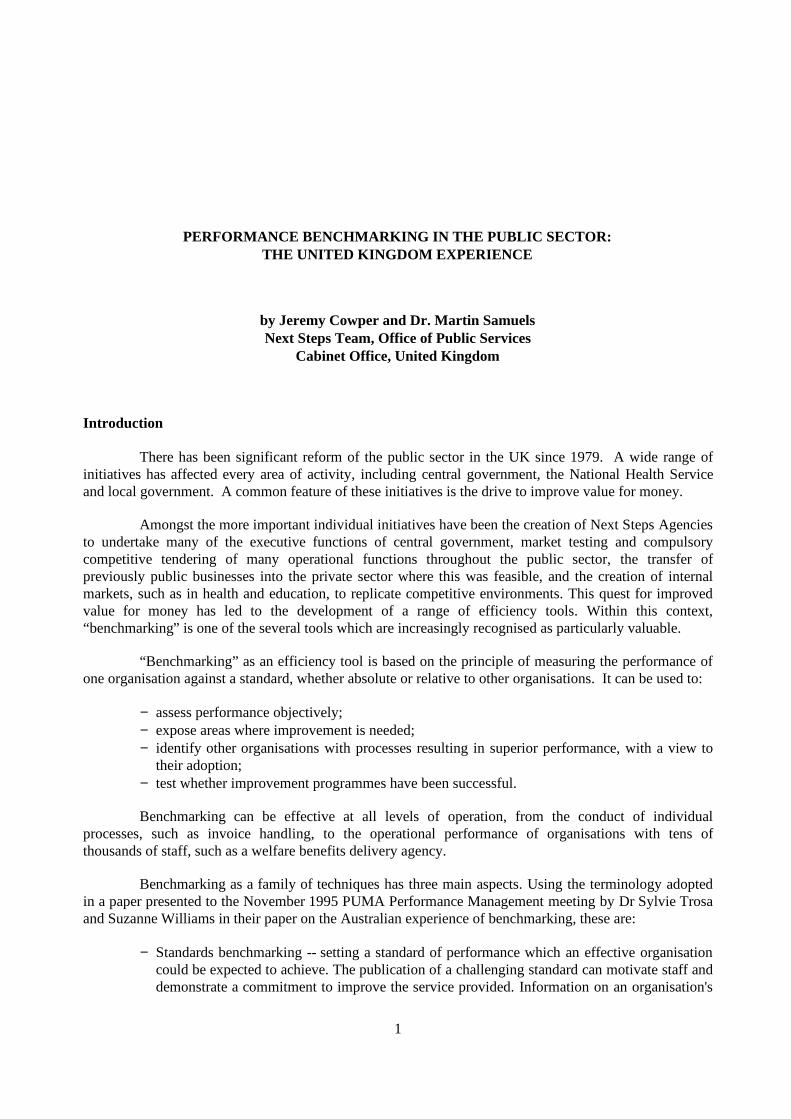
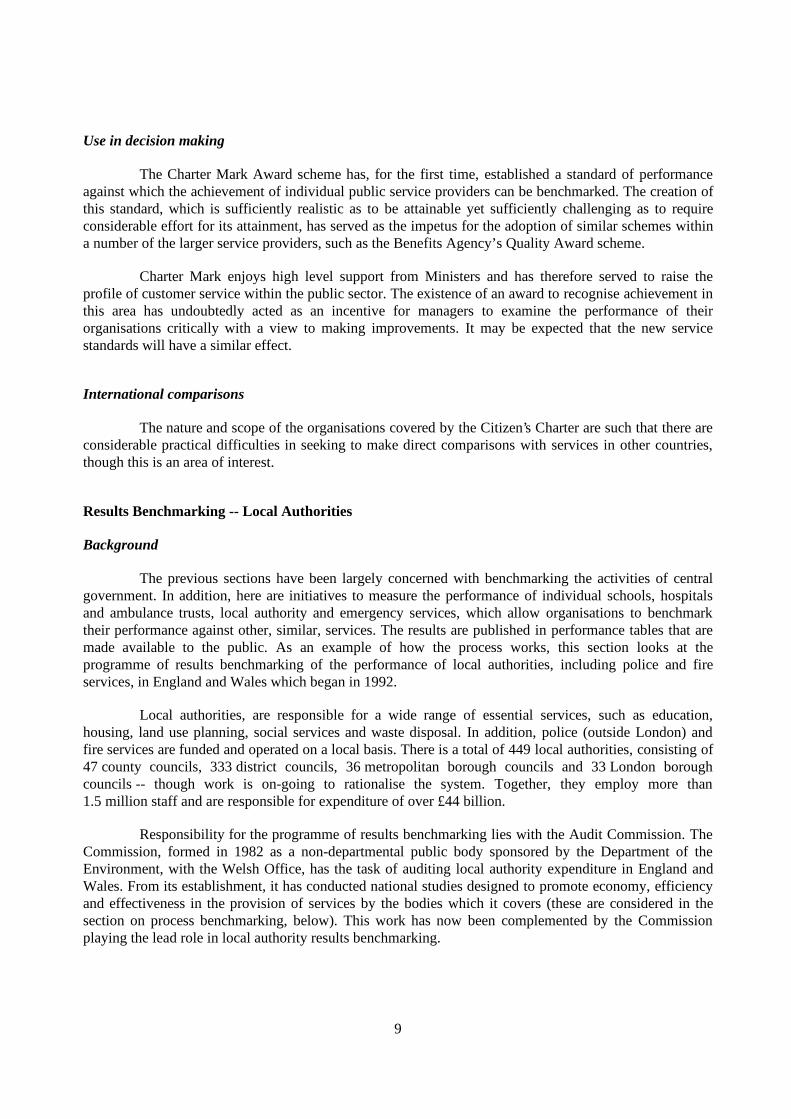
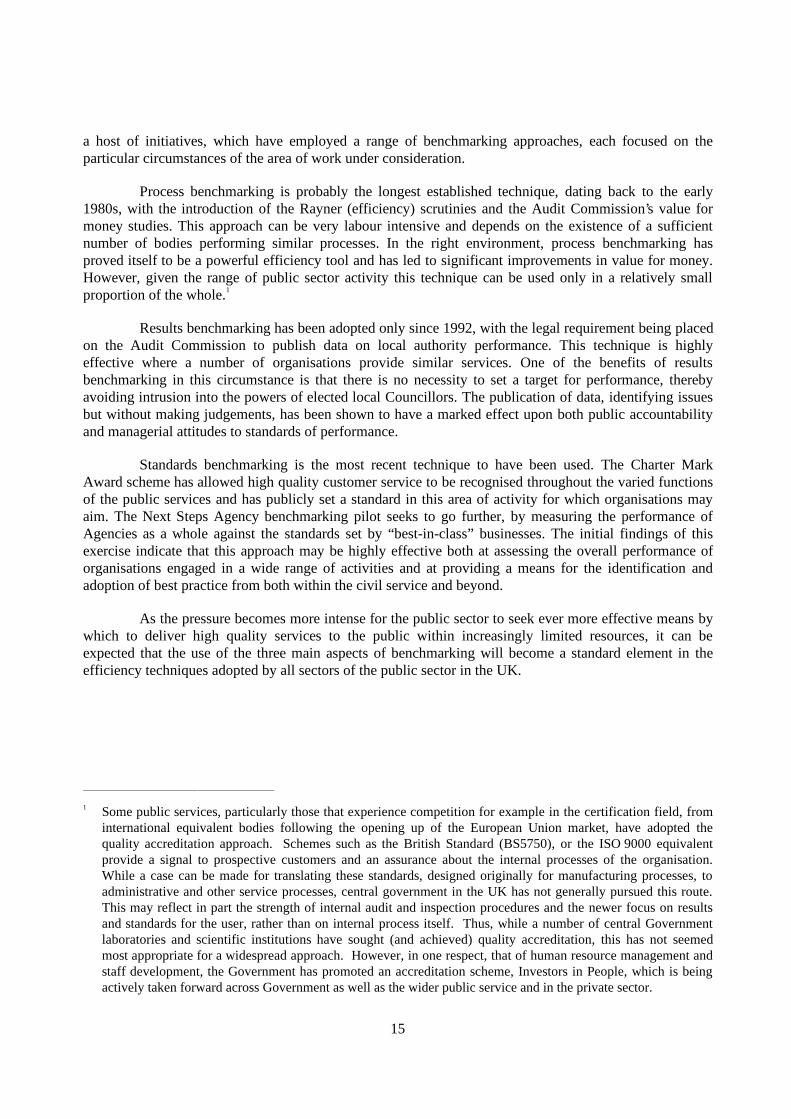
The British Quality Foundation (BQF) was established in 1992 to promote the principles of totalquality management throughout British industry. One of its key roles is to act as the intellectual custodianwithin the UK of the Business Excellence Model (BEM), developed by the European Foundation forQuality Management (EFQM) during 1988-1991. The BQF uses the model as the basis for the UK QualityAwards, which recognise British businesses of outstanding quality. The model setting out its nine criteriais reproduced at Annex A.
A full assessment of an organisation’s performance against the BEM is a significant undertaking,requiring considerable effort and resource from senior management. The BQF has recently developed itsASSESS RapidScore product as a simple approach to assessment, which is designed to encouragebusinesses to use the BEM and so become involved in the culture of continuous improvement which itrepresents.
4
RapidScore provides the means for organisations to use self-assessment to derive measurable andcomparable data on their performance against the BEM. It contains 91 questions, linked to the nine criteriaof the model, which explore the approach, deployment and results achieved in key areas. This simplemethodology allows realistic assessments to be made while reducing the demands on senior managementtime. In order to improve calibration of scores against the model, consultancy support has been provided tothe Agencies undertaking the self-assessments.
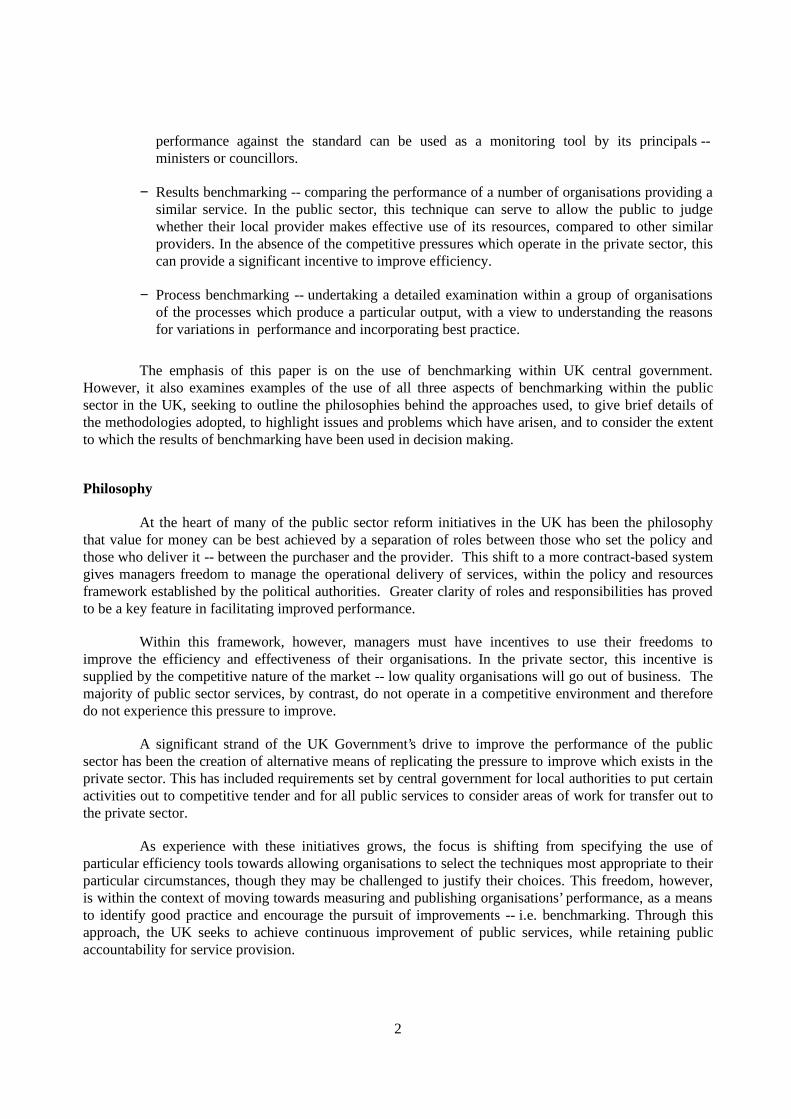
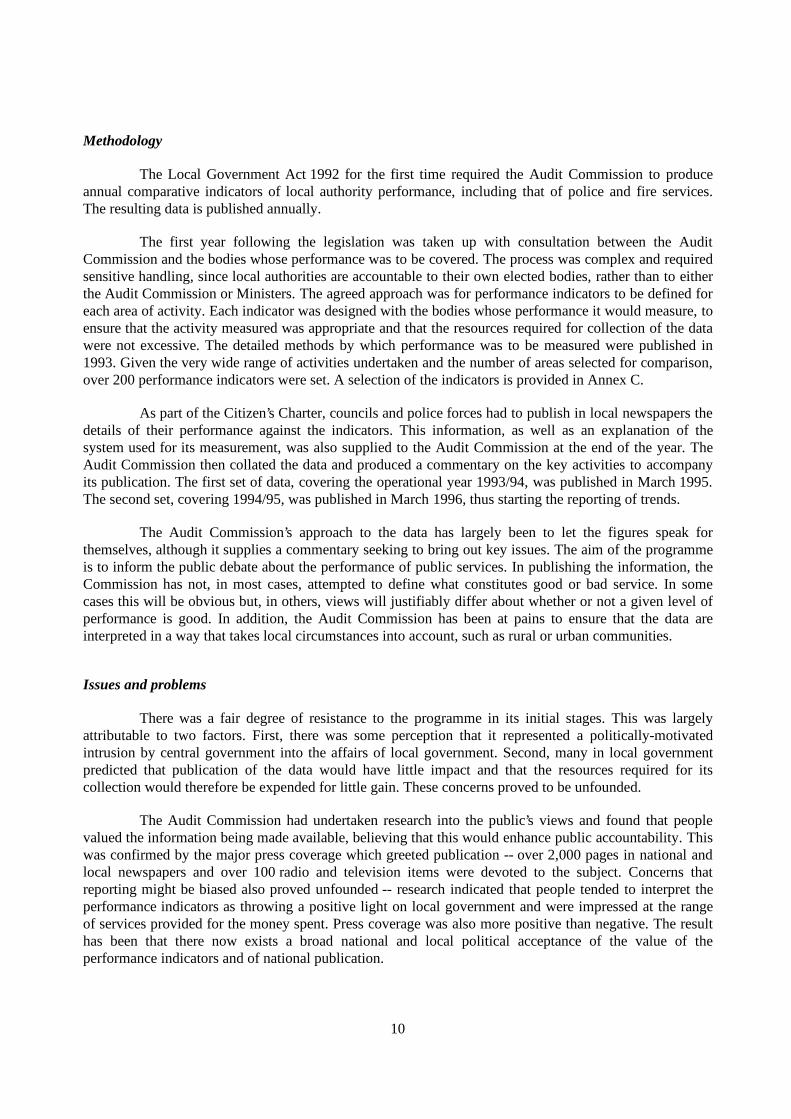
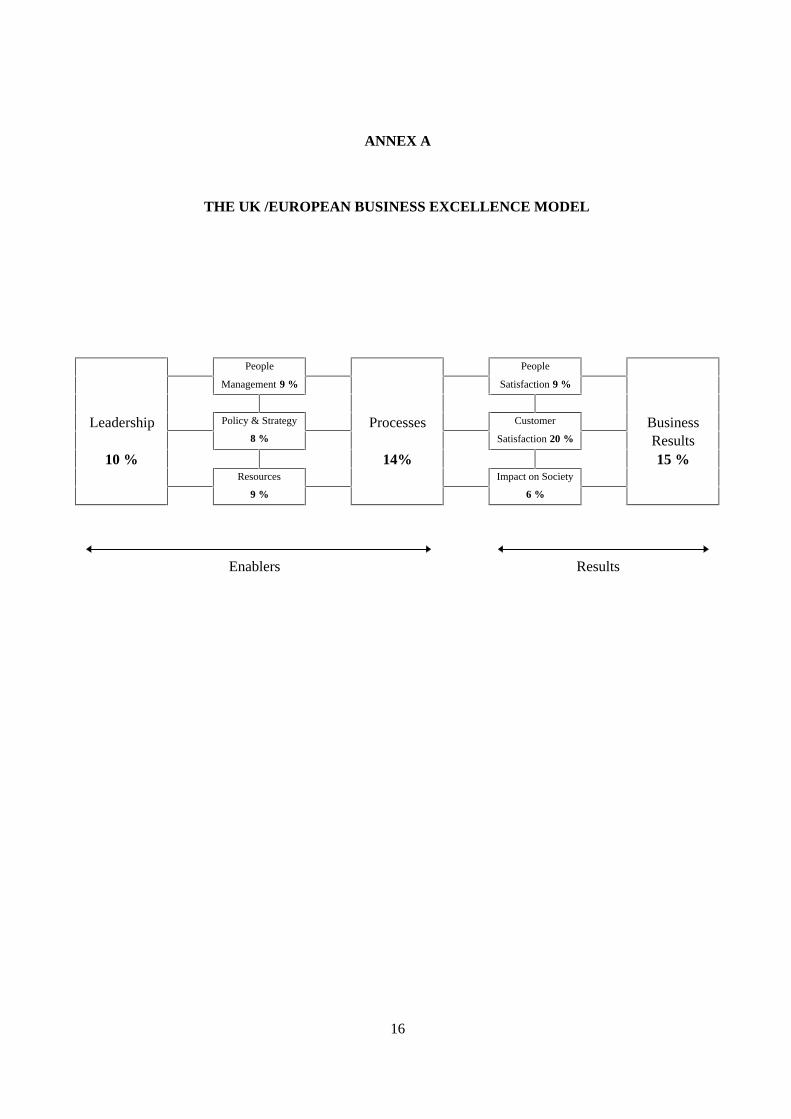
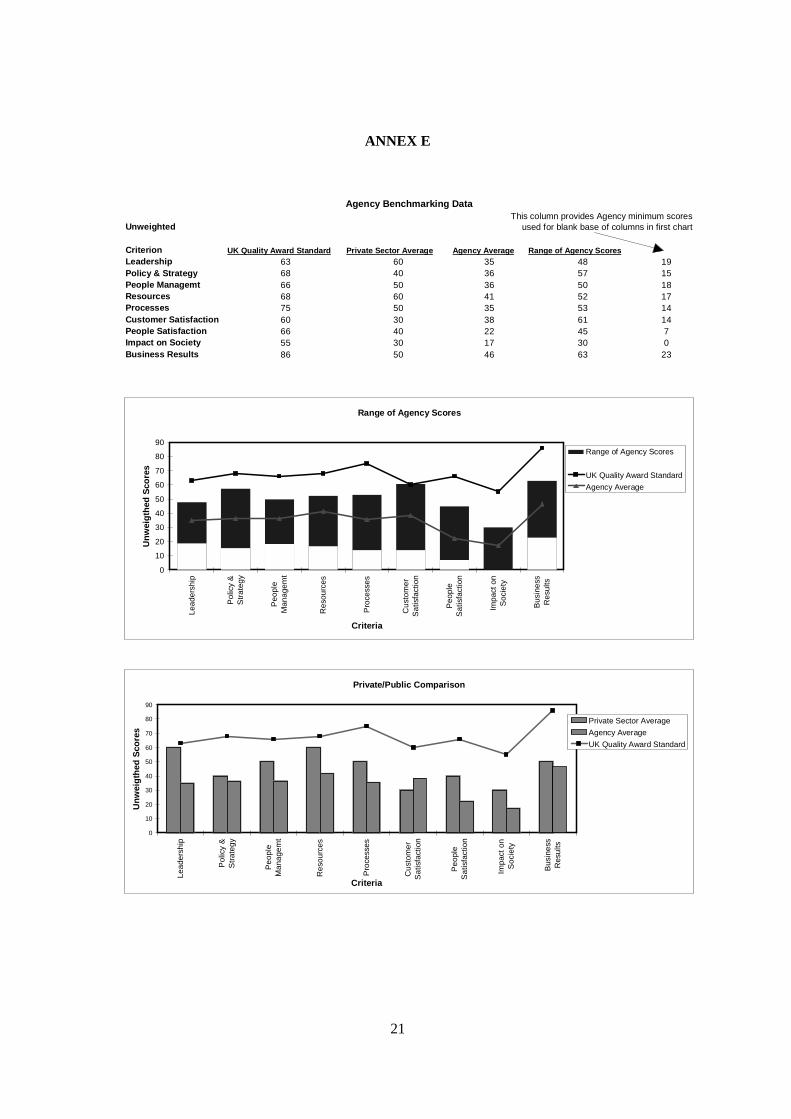
A total of 30 Agencies, covering almost 200,000 staff (Annex B), will undertake self-assessmentusing RapidScore. Since involvement in the pilot was voluntary, they are not a representative sample,tending to include a higher proportion of the largest Agencies. Several other Agencies with experience ofusing the BEM are associated with the project. The first Agencies began the self-assessment in June 1996,and the last will complete by the end of the year. The results for 26 Agencies are summarised in the chartin Annex E. The summary in Annex E gives the highest, lowest and average scores recorded in each of thenine categories and compares them to the standard set by the UK Quality Award winners. Since the projectis still underway, results and interpretation are only preliminary.
In general, the scores achieved indicate that Agencies are performing to a respectable standard,with few scores giving obvious cause for concern. The best scoring Agencies are within sight of the UKQuality Award standard in due course. However, it should be borne in mind that the scores are the resultof self-assessment, facilitated by external consultants, and may therefore not be as robust as scoresachieved by award winners, which are externally validated.
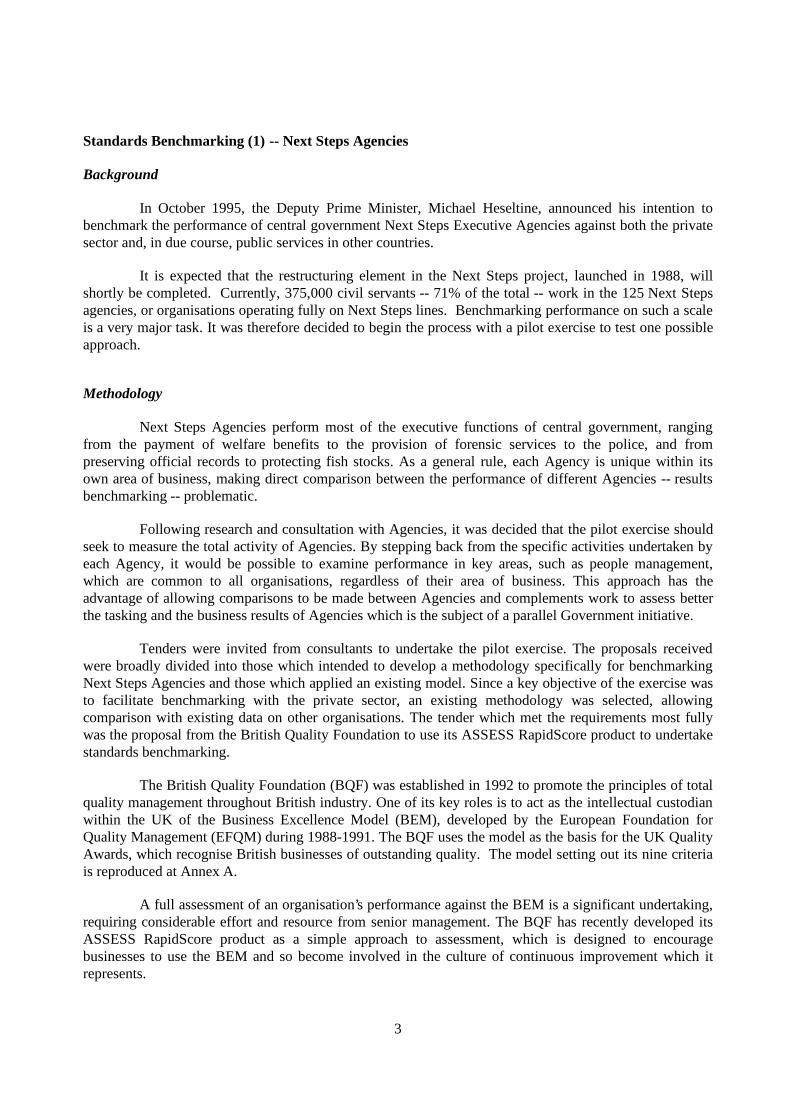
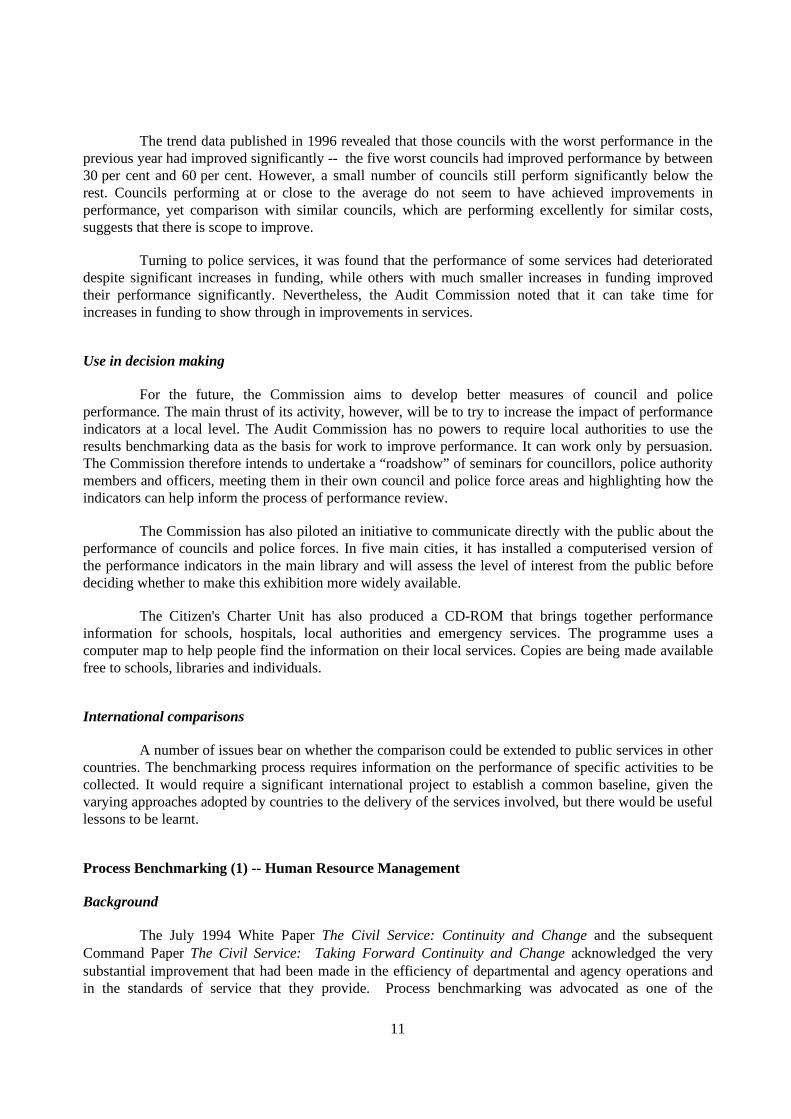
In running the pilot exercise, care was taken to ensure that Agencies went through the sameprocess as do private sector organisations. This allows a direct comparison to be made between the resultsfrom the public and private sectors. Although the BQF does not release the results from individualcompanies for reasons of commercial confidentiality, it is possible to compare the average scores undereach criterion held on the BQF database for the private sector against those for the Agencies. Again, scoresare compared to the standard set by the UK Quality Award winners. This data makes it possible to identifythose areas where Agencies appear to be performing particularly well, as well as areas where furtherimprovement appears necessary.
In comparison with the private sector, Agencies scored well in the areas of customer satisfaction,business results, policy and strategy and the management of service delivery generated by agency statushas enabled agencies to develop more robust business strategies, with particular emphasis on the effectivemanagement of their financial resources. Agencies, encouraged by the Citizen’s Charter, have also becomemore responsive to their customers and are more sensitive to external factors. With this has come a greatersense of corporate identity and a culture which strives for continual improvements in efficiency andeffectiveness.
Agencies scored noticeably better than the private sector average in the criterion coveringcustomer satisfaction. This suggests that efforts over recent years to improve the effectiveness of publicservices and raise the importance of the public as customers for services have borne considerable fruit.However, there is some evidence to suggest that the current high levels of achievement in this area are, inpart, the result of starting from a comparatively low base, and that Agencies may not be able to improvetheir services still further as quickly as customer expectations rise. If so, levels of customer satisfactionmay over time become more in line with private sector experience.
The Agencies tended to score rather less well than the private sector in the areas of leadership,human resources, processes and employee perception. The results indicated that there was stillconsiderable room for improvement in the areas of internal communications, including feedback from both
5
managers and staff, human resource planning, and the operational management of processes and theirinterfaces.
This may in part be a consequence of the fact that the civil service has only recently moved awayfrom a system under which most key decisions affecting staff management, such as pay and grading, wetaken centrally, with limited input from individual business units. It would not be surprising if moves todevolve control over these areas of business down to individual Agencies appear to have resulted in adegree of uncertainty, as agencies start to include the new aspects in their planning systems. However, asthe process becomes more familiar, it can be expected that the freedom to design human resource systemswhich meet the particular needs of the business of the individual Agency will result in significantimprovements in performance. It can also be expected that the commitment for all civil serviceorganisations to achieve “Investors in People” accreditation by the year 2000 will have an impact onresults here.
Issues and problems
The reaction from the Agencies taking part in the pilot exercise has been largely favourable. Ingeneral, Agencies have found it valuable to assess their position against both the standard set by the UKQuality Award and also the results achieved by the private sector. Their experience suggests that much ofthe approach of the private sector applies equally to public services, though certain issues (noted below)have arisen.
The process of self-assessment has provided benefits to Agencies both in terms of improvingtheir knowledge of themselves and of highlighting areas of difference between the disciplines of the publicand private sectors. Specific benefits of benchmarking identified so far are that it:
− provided Agencies with an insight into private sector best practice, as described in the model,and caused key issues affecting modes of operation to be raised for further discussion;
− focused the management teams on their business in total, providing an opportunity to discussand debate key issues and their linkages and interdependencies;
− provided a process for managers to map their progress to date and plot where they needed tobe in future in relation to their plans;
− provided the basis for identifying issues affecting Agencies as a group and more specific localissues that could be developed via inter-Agency contact and sharing of best practice.
Certain key issues emerged with regard to the extent to which the BEM is applicable to thepublic sector:
– the extent to which customers can drive the policy of the Agency. The model gives this ahigh value, but Agencies carry out Government policy, and Next Steps arrangements mustdeliver the balance between the needs of taxpayers, customers and staff, inherent in thepriorities set by Ministers.
– the market context in the model has also highlighted the problems experienced by Agencies inattempting to focus on this competitive issue. Direct competitors are in many cases difficult toidentify and the focus for most Agencies is on achieving objectives efficiently rather than onout-performing competition.
6
– the extent to which an agency in itself impacts on society in carrying out its function hasproved complex to evaluate. For most private sector organisations, their broader reputationwithin society can have a significant effect upon the willingness of customers to buy theirproduct. This area can, therefore, be of considerable importance for their business success.However, this pressure applies in a different nature to those agencies whose customers mayhave little choice as to whether to use the service.
– whereas the purpose in benchmarking agencies is to facilitate their performance rather thandraw in evaluation of policy matters, the BEM is designed more holistically. Agency targetsare based on outputs rather than outcomes, in line with the philosophical split between policyand operations inherent in Next Steps.
These areas of comment indicate that the environment in which Agencies operate, carrying outpolicies set by Ministers, who are accountable to Parliament, is in certain important respects different fromthat in which private sector organisations exist.
These issues in applying the BEM to the public sector, coupled with the complexities ofcalibrating scores accurately against the model, are proving challenging. Greater experience with themodel will also provide assurance or re-evaluation about the robustness of scores generated through self-assessment. Accurate calibration of scores is essential if the process is genuinely to benchmark Agencyperformance against a set standard, thereby allowing scope for comparison with other organisations, ratherthan merely to give an indication of areas of relative strong and poor performance within a single Agency.
Use in decision making
Following the self-assessment, Agencies identify key areas for improvement and developappropriate action plans. Many of the improvement actions to date reflect the areas where the self-assessment scores identified weakness in performance, in particular “communications”. A number ofAgencies have used the results of the benchmarking as a catalyst to drive forward initiatives to improvelinks both between staff and management, and between the Agency and its key customers.
An encouraging sign from the improvement plans is that, despite the generally high scoresrecorded in the areas of Customer Satisfaction and Business Results, Agencies recognised that scoperemained for raising performance still further, while consolidating the achievements already recorded.Agencies focused on improving the link between their overall strategy and its implementation throughoutthe organisation by means of business planning.
Agencies have proved ready to accept the results of the benchmarking exercise, which havegenerally revealed new aspects of known issues, rather than uncovering previously unsuspectedweaknesses. This indicates that the greater focus on improving the management and delivery of theexecutive functions of government -- the main goal of the Next Steps initiative -- has taken root withinAgencies. The managers and staff of Agencies have demonstrated a commitment to the principles ofincreasing the efficiency and effectiveness of their organisations and are seeking to adopt a culture whichaims at continuous improvement. Nevertheless, it is clear that there is still considerable scope forimprovement in the achievement and measurement of output performance.
7
International comparisons
An important element of the Deputy Prime Minister’s strategy relates to the potential tobenchmark Next Steps Agencies against public services in other countries. One reason for selecting theBQF’s tender, and using the BEM, was that the results from the initial pilot exercise should in due coursebe comparable with data gathered by the EFQM for the European Quality Award.
We understand that the EFQM is working with the European Commission to adapt the BEM foruse in the public sector. During the course of the pilot exercise with the BQF, certain difficulties have beenfound in applying the existing model unadapted to the particular circumstances of the public sector. TheUK therefore has considerable interest in the progress of the EFQM’s work.
Standards Benchmarking (2) -- The Citizen’s Charter
Background
The Citizen’s Charter, launched in 1991, is a ten-year programme which aims to raise thestandard of public services and to make them more responsive to the needs and wishes of users. It coversbodies in the public sector, such as central government Next Steps Agencies and units of the NationalHealth Service, and also the private regulated monopoly utilities supplying electricity, gas and water.
The Charter is based on six key principles:
– standards;– information and openness;– choice and consultation;– courtesy and helpfulness;– putting things right; and– value for money.
Much of the work to implement the Charter’s principles has focused on the area of resultsbenchmarking and is described in the section covering that topic. Two initiatives, however, fall under thecategory of standards benchmarking -- Charter Mark and the six service standards for central government.
Methodology
The Charter Mark Award Scheme, launched in January 1992, rewards excellence in deliveringpublic services. It is open to all public service organisations that serve the public direct. Organisationsreceiving the award must provide evidence of their performance against the six Charter principles, showyear-on-year improvements in the quality of their services and demonstrate that their customers aresatisfied with the services they provide. They must also have plans to introduce at least one innovativeenhancement to their services which can be put into effect without increasing the cost to taxpayers orconsumers. Independent assessors visit short-listed organisations.
8
To be considered for an award, an organisation must apply to the Citizen’s Charter Unit inCabinet Office (Office of Public Services). Since 1995, members of the public have been able to nominateorganisations for the award, and a publicity campaign has been run each year to generate awareness of thescheme. In 1995, 4,010 nominations were made; in 1996, 15,132 (covering over 5,000 differentorganisations).
From a total of 2,707 applications under the scheme, 451 Charter Marks have been awarded, anda further 298 organisations have been highly commended. Since the standard of service provided by anorganisation may vary over time, Charter Marks are awarded for a period of three years only, and renewalis dependent on a fresh application and assessment. The importance of this measure is demonstrated by thefact that to date only 25 of the 36 organisations whose Charter Marks have expired have been successful inhaving the award confirmed for a further three years. It is hoped to expand the programme to at least 2,000Charter Mark holders by the year 2000, while maintaining its current high standards.
The second area of standards benchmarking resulting from the Charter is the adoption of sixservice standards by the whole of central government, including both Next Steps Agencies and the centresof Departments, as from 1 April 1997. The standards cover:
– Targets for answering letters;– Keeping to agreed appointment times;– Providing clear information about services and a telephone contact number;– Regular consultation with users about the services provided;– Complaints procedures;– Making services available to everyone.
For the first time, the performance of all government Departments and Agencies will bemeasured against this single set of indicators and the results published. The Citizen’s Charter Unit isconsulting service users about the standards and will revise them in the light of users’ views.
Issues and problems
The organisations which have applied under the scheme during its first five years represent onlya small proportion of the estimated 75,000 public service organisations across the UK that are eligible toapply. The challenge for the next five years will be to bring Charter Mark to bear on the vast majority ofpublic services.
An expansion of the scheme would bring its own problems. The existing assessment process,which is geared to receiving up to 1,000 applications, lasts three to four months and requires aconsiderable effort and cost to run. Alternatives, such as turning Charter Mark into an accreditationscheme or introducing a rolling programme of applications and assessments, are being considered for thelonger term.
The six service standards apply to all central government Departments and Agencies, but not toother services, such as schools and hospitals, where there is much less direct Ministerial control. One ofthe challenges for the future is to continue the process of getting these organisations to set standards fortheir services. There are already more than 10,000 local charters, covering services as diverse as doctors’practices and fire services. But for benchmarking to be successful, organisations need to set the samestandards so that meaningful comparisons can be made.
9
Use in decision making
The Charter Mark Award scheme has, for the first time, established a standard of performanceagainst which the achievement of individual public service providers can be benchmarked. The creation ofthis standard, which is sufficiently realistic as to be attainable yet sufficiently challenging as to requireconsiderable effort for its attainment, has served as the impetus for the adoption of similar schemes withina number of the larger service providers, such as the Benefits Agency’s Quality Award scheme.
Charter Mark enjoys high level support from Ministers and has therefore served to raise theprofile of customer service within the public sector. The existence of an award to recognise achievement inthis area has undoubtedly acted as an incentive for managers to examine the performance of theirorganisations critically with a view to making improvements. It may be expected that the new servicestandards will have a similar effect.
International comparisons
The nature and scope of the organisations covered by the Citizen’s Charter are such that there areconsiderable practical difficulties in seeking to make direct comparisons with services in other countries,though this is an area of interest.
Results Benchmarking -- Local Authorities
Background
The previous sections have been largely concerned with benchmarking the activities of centralgovernment. In addition, here are initiatives to measure the performance of individual schools, hospitalsand ambulance trusts, local authority and emergency services, which allow organisations to benchmarktheir performance against other, similar, services. The results are published in performance tables that aremade available to the public. As an example of how the process works, this section looks at theprogramme of results benchmarking of the performance of local authorities, including police and fireservices, in England and Wales which began in 1992.
Local authorities, are responsible for a wide range of essential services, such as education,housing, land use planning, social services and waste disposal. In addition, police (outside London) andfire services are funded and operated on a local basis. There is a total of 449 local authorities, consisting of47 county councils, 333 district councils, 36 metropolitan borough councils and 33 London boroughcouncils -- though work is on-going to rationalise the system. Together, they employ more than1.5 million staff and are responsible for expenditure of over £44 billion.
Responsibility for the programme of results benchmarking lies with the Audit Commission. TheCommission, formed in 1982 as a non-departmental public body sponsored by the Department of theEnvironment, with the Welsh Office, has the task of auditing local authority expenditure in England andWales. From its establishment, it has conducted national studies designed to promote economy, efficiencyand effectiveness in the provision of services by the bodies which it covers (these are considered in thesection on process benchmarking, below). This work has now been complemented by the Commissionplaying the lead role in local authority results benchmarking.
10
Methodology
The Local Government Act 1992 for the first time required the Audit Commission to produceannual comparative indicators of local authority performance, including that of police and fire services.The resulting data is published annually.
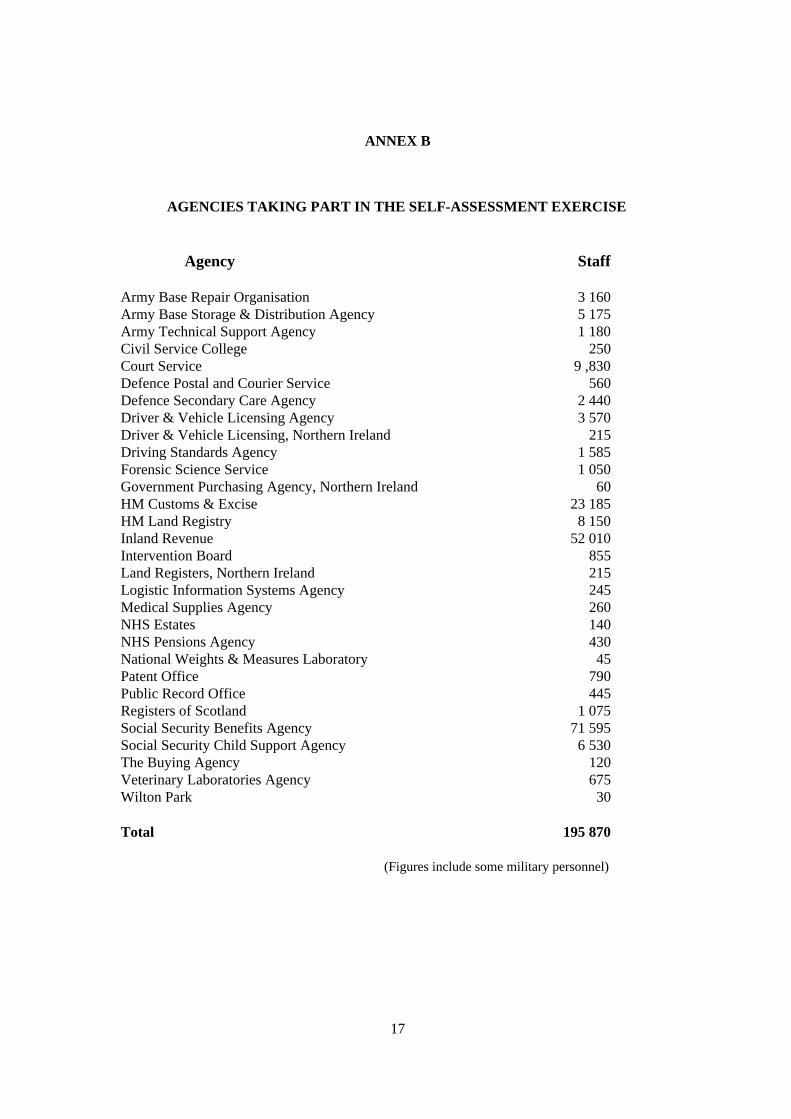
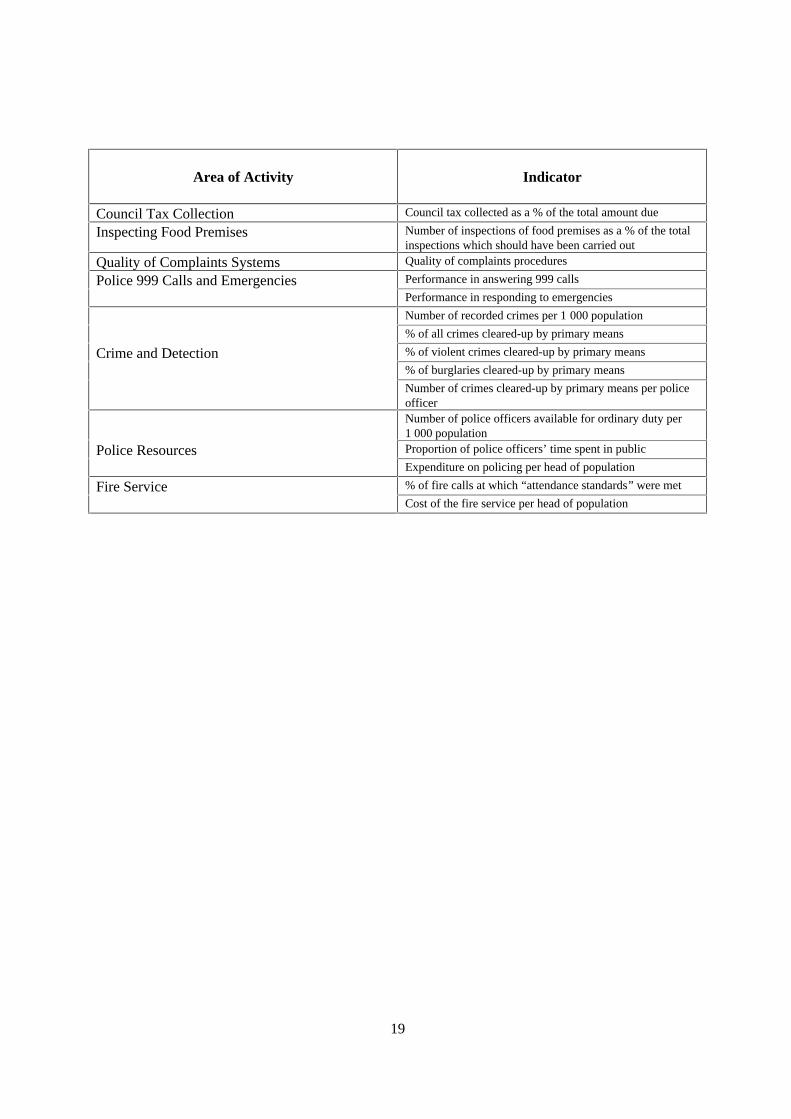
The first year following the legislation was taken up with consultation between the AuditCommission and the bodies whose performance was to be covered. The process was complex and requiredsensitive handling, since local authorities are accountable to their own elected bodies, rather than to eitherthe Audit Commission or Ministers. The agreed approach was for performance indicators to be defined foreach area of activity. Each indicator was designed with the bodies whose performance it would measure, toensure that the activity measured was appropriate and that the resources required for collection of the datawere not excessive. The detailed methods by which performance was to be measured were published in1993. Given the very wide range of activities undertaken and the number of areas selected for comparison,over 200 performance indicators were set. A selection of the indicators is provided in Annex C.
As part of the Citizen’s Charter, councils and police forces had to publish in local newspapers thedetails of their performance against the indicators. This information, as well as an explanation of thesystem used for its measurement, was also supplied to the Audit Commission at the end of the year. TheAudit Commission then collated the data and produced a commentary on the key activities to accompanyits publication. The first set of data, covering the operational year 1993/94, was published in March 1995.The second set, covering 1994/95, was published in March 1996, thus starting the reporting of trends.
The Audit Commission’s approach to the data has largely been to let the figures speak forthemselves, although it supplies a commentary seeking to bring out key issues. The aim of the programmeis to inform the public debate about the performance of public services. In publishing the information, theCommission has not, in most cases, attempted to define what constitutes good or bad service. In somecases this will be obvious but, in others, views will justifiably differ about whether or not a given level ofperformance is good. In addition, the Audit Commission has been at pains to ensure that the data areinterpreted in a way that takes local circumstances into account, such as rural or urban communities.
Issues and problems
There was a fair degree of resistance to the programme in its initial stages. This was largelyattributable to two factors. First, there was some perception that it represented a politically-motivatedintrusion by central government into the affairs of local government. Second, many in local governmentpredicted that publication of the data would have little impact and that the resources required for itscollection would therefore be expended for little gain. These concerns proved to be unfounded.
The Audit Commission had undertaken research into the public’s views and found that peoplevalued the information being made available, believing that this would enhance public accountability. Thiswas confirmed by the major press coverage which greeted publication -- over 2,000 pages in national andlocal newspapers and over 100 radio and television items were devoted to the subject. Concerns thatreporting might be biased also proved unfounded -- research indicated that people tended to interpret theperformance indicators as throwing a positive light on local government and were impressed at the rangeof services provided for the money spent. Press coverage was also more positive than negative. The resulthas been that there now exists a broad national and local political acceptance of the value of theperformance indicators and of national publication.
11
The trend data published in 1996 revealed that those councils with the worst performance in theprevious year had improved significantly -- the five worst councils had improved performance by between30 per cent and 60 per cent. However, a small number of councils still perform significantly below therest. Councils performing at or close to the average do not seem to have achieved improvements inperformance, yet comparison with similar councils, which are performing excellently for similar costs,suggests that there is scope to improve.
Turning to police services, it was found that the performance of some services had deteriorateddespite significant increases in funding, while others with much smaller increases in funding improvedtheir performance significantly. Nevertheless, the Audit Commission noted that it can take time forincreases in funding to show through in improvements in services.
Use in decision making
For the future, the Commission aims to develop better measures of council and policeperformance. The main thrust of its activity, however, will be to try to increase the impact of performanceindicators at a local level. The Audit Commission has no powers to require local authorities to use theresults benchmarking data as the basis for work to improve performance. It can work only by persuasion.The Commission therefore intends to undertake a “roadshow” of seminars for councillors, police authoritymembers and officers, meeting them in their own council and police force areas and highlighting how theindicators can help inform the process of performance review.
The Commission has also piloted an initiative to communicate directly with the public about theperformance of councils and police forces. In five main cities, it has installed a computerised version ofthe performance indicators in the main library and will assess the level of interest from the public beforedeciding whether to make this exhibition more widely available.
The Citizen's Charter Unit has also produced a CD-ROM that brings together performanceinformation for schools, hospitals, local authorities and emergency services. The programme uses acomputer map to help people find the information on their local services. Copies are being made availablefree to schools, libraries and individuals.
International comparisons
A number of issues bear on whether the comparison could be extended to public services in othercountries. The benchmarking process requires information on the performance of specific activities to becollected. It would require a significant international project to establish a common baseline, given thevarying approaches adopted by countries to the delivery of the services involved, but there would be usefullessons to be learnt.
Process Benchmarking (1) -- Human Resource Management
Background
The July 1994 White Paper The Civil Service: Continuity and Change and the subsequentCommand Paper The Civil Service: Taking Forward Continuity and Change acknowledged the verysubstantial improvement that had been made in the efficiency of departmental and agency operations andin the standards of service that they provide. Process benchmarking was advocated as one of the

12
management techniques which can help to improve further the efficiency and delivery of services. Thissection covers one of a number of initiatives being undertaken in central government to apply thistechnique to human resource management.
Methodology
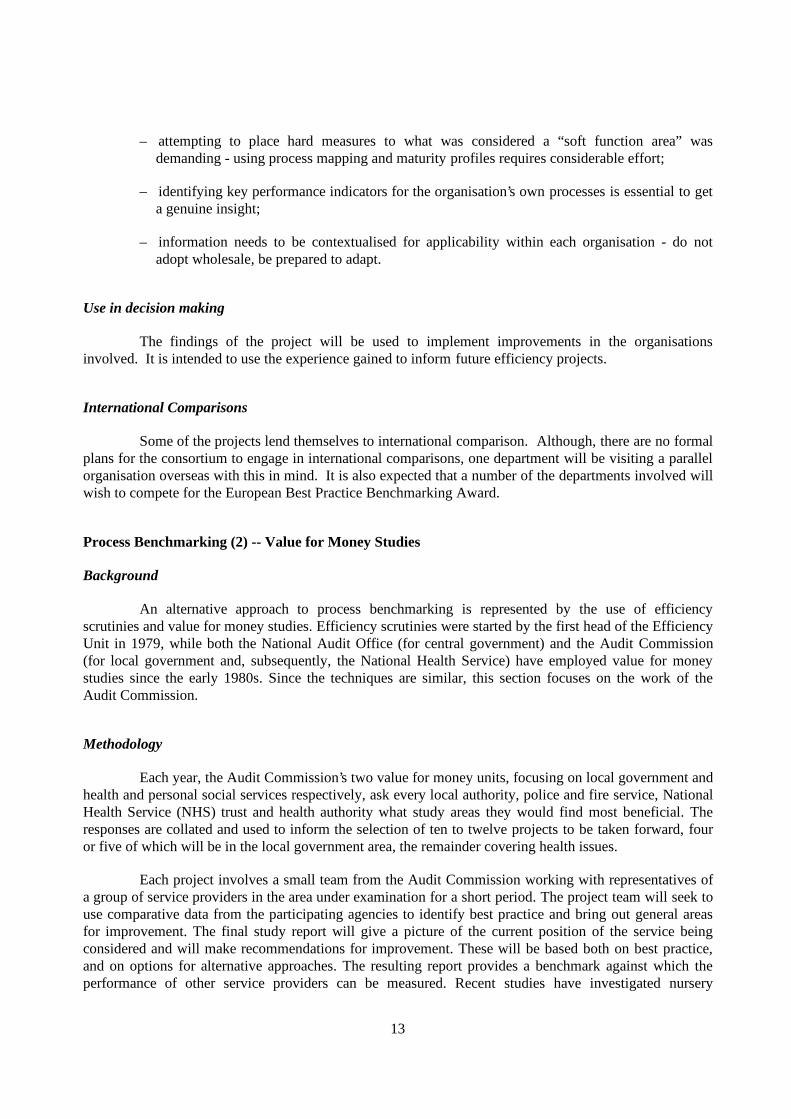
In January 1996, ten central Government departments agreed to take part in a project, led byDevelopment and Equal Opportunities Division, Cabinet Office (Office of Public Services), to explore theuse of process benchmarking as a tool to improve human resource practices. The approach adopted was toform a consortium, where departments work together while at the same time carrying out separate projects.This provided a means by which participants could learn about process mapping and benchmarking, sharetheir approaches, refine the techniques learned and develop sufficient skills to enable them to carry outbenchmarking of other processes (not exclusively in the human resource area) in the future.
Following a tender exercise, consultants Coopers & Lybrand were contracted to work alongsidethe departments to help them along the benchmarking route. This firm has extensive experience inbenchmarking (as well as management consultancy), including design of the European Best PracticeBenchmarking Award.
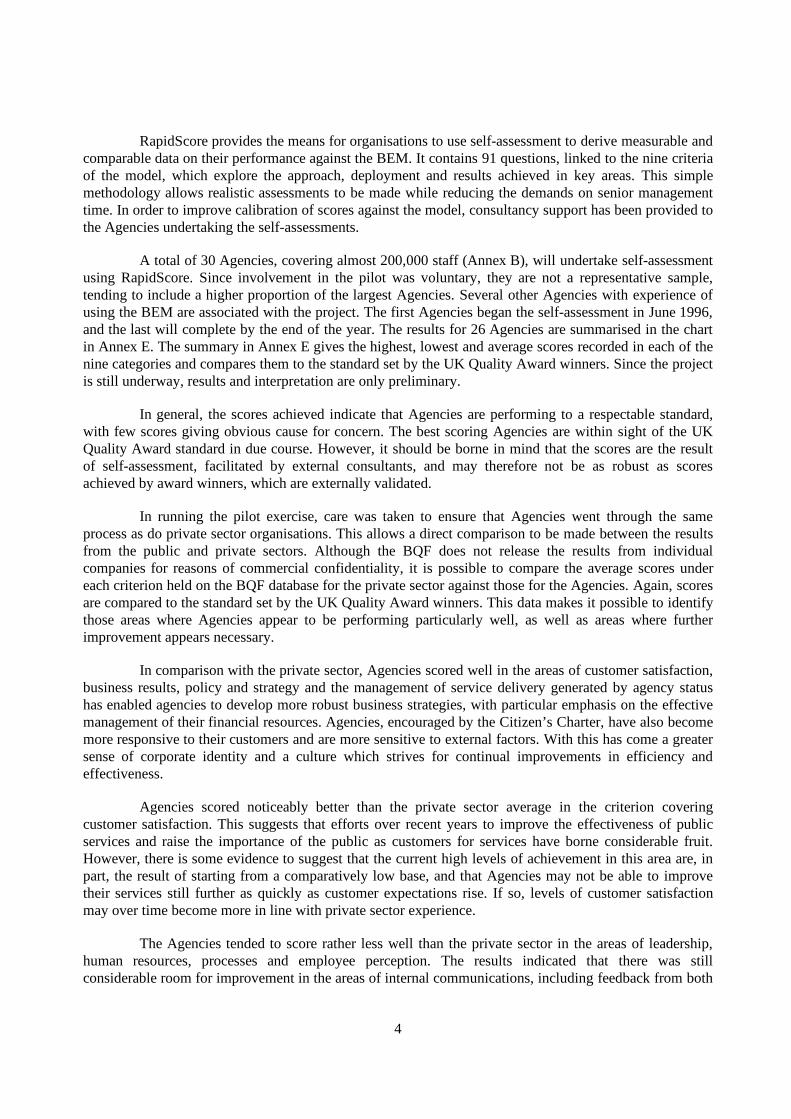
It was recognised that measurements in themselves would not improve a process. Humanresources has long been considered as an area of subjective and qualitative information not suited for“hard” measures. Benchmarking provides a way to harness the qualitative with the quantitative to providemeasurable outcomes (see Annex D for the benchmarking route).
Individual projects were chosen by the participating departments covering the whole range ofhuman resource functions -- such as personnel appraisal systems and measuring the impact of equalopportunities. From the outset it was emphasised that however small the scope of the project the issueshould be something that was of critical importance to the organisation.
Although it is too early to comment on the outcomes of the individual projects, it is clear that theconsortium will be a rich source of information -- on both the processes benchmarked and thebenchmarking technique itself. The consortium report will include case studies of each project and there isalready consensus that the collective learning and common issues contain excellent evidence that shouldbe promulgated within and extended beyond the civil service.
Issues and problems
Different issues affected individual teams; however, there were some consistent key messagesthroughout -- some attributable to project management and others concerning the benchmarking process:
– benchmarking is only a vehicle to bring about the delivery of key changes and continuousdevelopment;
– those involved in benchmarking need to be personally motivated and have the skills to carryout specific roles - key skills include influencing, negotiation and problem solving techniques;
– a clear definition of the project must be agreed from the outset, setting the boundaries of theinvestigation;
13
– attempting to place hard measures to what was considered a “soft function area” wasdemanding - using process mapping and maturity profiles requires considerable effort;
– identifying key performance indicators for the organisation’s own processes is essential to geta genuine insight;
– information needs to be contextualised for applicability within each organisation - do notadopt wholesale, be prepared to adapt.
Use in decision making
The findings of the project will be used to implement improvements in the organisationsinvolved. It is intended to use the experience gained to inform future efficiency projects.
International Comparisons
Some of the projects lend themselves to international comparison. Although, there are no formalplans for the consortium to engage in international comparisons, one department will be visiting a parallelorganisation overseas with this in mind. It is also expected that a number of the departments involved willwish to compete for the European Best Practice Benchmarking Award.
Process Benchmarking (2) -- Value for Money Studies
Background
An alternative approach to process benchmarking is represented by the use of efficiencyscrutinies and value for money studies. Efficiency scrutinies were started by the first head of the EfficiencyUnit in 1979, while both the National Audit Office (for central government) and the Audit Commission(for local government and, subsequently, the National Health Service) have employed value for moneystudies since the early 1980s. Since the techniques are similar, this section focuses on the work of theAudit Commission.
Methodology
Each year, the Audit Commission’s two value for money units, focusing on local government andhealth and personal social services respectively, ask every local authority, police and fire service, NationalHealth Service (NHS) trust and health authority what study areas they would find most beneficial. Theresponses are collated and used to inform the selection of ten to twelve projects to be taken forward, fouror five of which will be in the local government area, the remainder covering health issues.
Each project involves a small team from the Audit Commission working with representatives ofa group of service providers in the area under examination for a short period. The project team will seek touse comparative data from the participating agencies to identify best practice and bring out general areasfor improvement. The final study report will give a picture of the current position of the service beingconsidered and will make recommendations for improvement. These will be based both on best practice,and on options for alternative approaches. The resulting report provides a benchmark against which theperformance of other service providers can be measured. Recent studies have investigated nursery

14
education for “under-fives”, local authority finance departments, hospital patient records, and NHSaccident and emergency services.
Issues and problems
The Audit Commission has found that many of the bodies which it covers are keen to adopt thegood practices highlighted in the Commission's national value-for-money reports before being subject tolocal audit. Such an approach can lead to strong local ownership of the change agenda. Building on itsmanagement handbooks, which help audited bodies implement locally appropriate solutions, theCommission is now experimenting with a new audit methodology called “study -- implementation --audit”. This methodology has five key stages:
− early process benchmarking against the findings of a national value for money study, toprovide a baseline of data against which an organisation's progress can be monitored;
− a diagnostic “snapshot” by the local auditor to ascertain the key local issues;
− the opportunity for the audited bodies to draw up their own “agenda for action” to address themain issues in the light of local circumstances and priorities;
− management handbooks, and possibly workshops, to support audited bodies whenimplementing their own solutions;
− a follow-up review by the auditor to establish how well the audited body has progressedagainst its own agenda for action.
Use in decision making
The Audit Commission's value for money approach to process benchmarking is well establishedand is becoming increasingly integrated into the decision making process by which these bodies reviewtheir performance and seek to identify areas for improvement and implement action plans. The EfficiencyUnit's efficiency scrutinies and the National Audit Office's value for money studies play a similar role incentral government.
International comparisons
Due to the specialised nature of the work, there are at present no plans to expand the programmesto include comparison with services in other countries.
Conclusions
The use of benchmarking techniques has been of increasing importance in the long-standingdrive to improve the value for money offered by the public service in the UK, even though the term itselfis of more recent adoption.
As in most other developed countries, the scope and scale of the public sector in the UK remainsextensive and the bodies responsible for the delivery of services correspondingly large. The result has been
15
a host of initiatives, which have employed a range of benchmarking approaches, each focused on theparticular circumstances of the area of work under consideration.
Process benchmarking is probably the longest established technique, dating back to the early1980s, with the introduction of the Rayner (efficiency) scrutinies and the Audit Commission’s value formoney studies. This approach can be very labour intensive and depends on the existence of a sufficientnumber of bodies performing similar processes. In the right environment, process benchmarking hasproved itself to be a powerful efficiency tool and has led to significant improvements in value for money.However, given the range of public sector activity this technique can be used only in a relatively smallproportion of the whole.1
Results benchmarking has been adopted only since 1992, with the legal requirement being placedon the Audit Commission to publish data on local authority performance. This technique is highlyeffective where a number of organisations provide similar services. One of the benefits of resultsbenchmarking in this circumstance is that there is no necessity to set a target for performance, therebyavoiding intrusion into the powers of elected local Councillors. The publication of data, identifying issuesbut without making judgements, has been shown to have a marked effect upon both public accountabilityand managerial attitudes to standards of performance.
Standards benchmarking is the most recent technique to have been used. The Charter MarkAward scheme has allowed high quality customer service to be recognised throughout the varied functionsof the public services and has publicly set a standard in this area of activity for which organisations mayaim. The Next Steps Agency benchmarking pilot seeks to go further, by measuring the performance ofAgencies as a whole against the standards set by “best-in-class” businesses. The initial findings of thisexercise indicate that this approach may be highly effective both at assessing the overall performance oforganisations engaged in a wide range of activities and at providing a means for the identification andadoption of best practice from both within the civil service and beyond.
As the pressure becomes more intense for the public sector to seek ever more effective means bywhich to deliver high quality services to the public within increasingly limited resources, it can beexpected that the use of the three main aspects of benchmarking will become a standard element in theefficiency techniques adopted by all sectors of the public sector in the UK.
1 Some public services, particularly those that experience competition for example in the certification field, from
international equivalent bodies following the opening up of the European Union market, have adopted thequality accreditation approach. Schemes such as the British Standard (BS5750), or the ISO 9000 equivalentprovide a signal to prospective customers and an assurance about the internal processes of the organisation.While a case can be made for translating these standards, designed originally for manufacturing processes, toadministrative and other service processes, central government in the UK has not generally pursued this route.This may reflect in part the strength of internal audit and inspection procedures and the newer focus on resultsand standards for the user, rather than on internal process itself. Thus, while a number of central Governmentlaboratories and scientific institutions have sought (and achieved) quality accreditation, this has not seemedmost appropriate for a widespread approach. However, in one respect, that of human resource management andstaff development, the Government has promoted an accreditation scheme, Investors in People, which is beingactively taken forward across Government as well as the wider public service and in the private sector.
16
ANNEX A
THE UK /EUROPEAN BUSINESS EXCELLENCE MODEL
People People
Management 9 % Satisfaction 9 %
Leadership Policy & Strategy Processes Customer Business8 % Satisfaction 20 % Results
10 % 14% 15 %Resources Impact on Society
9 % 6 %
Enablers Results
17
ANNEX B
AGENCIES TAKING PART IN THE SELF-ASSESSMENT EXERCISE
Agency Staff
Army Base Repair Organisation 3 160Army Base Storage & Distribution Agency 5 175Army Technical Support Agency 1 180Civil Service College 250Court Service 9 ,830Defence Postal and Courier Service 560Defence Secondary Care Agency 2 440Driver & Vehicle Licensing Agency 3 570Driver & Vehicle Licensing, Northern Ireland 215Driving Standards Agency 1 585Forensic Science Service 1 050Government Purchasing Agency, Northern Ireland 60HM Customs & Excise 23 185HM Land Registry 8 150Inland Revenue 52 010Intervention Board 855Land Registers, Northern Ireland 215Logistic Information Systems Agency 245Medical Supplies Agency 260NHS Estates 140NHS Pensions Agency 430National Weights & Measures Laboratory 45Patent Office 790Public Record Office 445Registers of Scotland 1 075Social Security Benefits Agency 71 595Social Security Child Support Agency 6 530The Buying Agency 120Veterinary Laboratories Agency 675Wilton Park 30
Total 195 870
(Figures include some military personnel)
18
ANNEX C
SELECTION OF LOCAL AUTHORITY KEY PERFORMANCE INDICATORS
− The Audit Commission has established a series of more than 200 key performance indicators as ameans to measure the activities of local authorities. The number is high, due to the wide range of theauthorities’ business. The Commission recognises that a balance must be struck between gatheringsufficient data to allow an accurate assessment of performance to be made, while ensuring that theneed to collect the data does not become an excessive burden.
− Given that the system has been in operation only since 1993, it is accepted that the indicatorsemployed need to be adapted over time, in order to capture more accurately the key aspects ofperformance and also to minimise the resources required for their collection.
− The indicators listed below are only a small selection of the complete range, for which full details oflocal authority performance was published in April 1996.
Area of Activity Indicator
% of 3 and 4 years old with an LA school place
Education Expenditure per primary school pupil
Expenditure per secondary school pupil
% of draft special educational needs statements preparedwithin 6 months% of elderly people over 75 helped to live at home
% of minor items of equipment to help people live at homeprovided within 3 weeks
Social Services % of adults going into residential care who were offeredsingle rooms% of children in LA care who are in foster homes
Number of children on the Child Protection Register per1 000 children
Libraries Number of books and other items issued by libraries perhead of population
Total Expenditure Total expenditure per head of population
Council Housing Average time taken to re-let council dwelling
% of tenants owing more than 13 weeks’ rent
Recycling % of household waste recycled
Planning Applications % of householder planning applications decided in 8 weeks
Council Tax Benefit % of new council tax benefit claims processed in 14 days
Table continued....
19
Area of Activity Indicator
Council Tax Collection Council tax collected as a % of the total amount due
Inspecting Food Premises Number of inspections of food premises as a % of the totalinspections which should have been carried out
Quality of Complaints Systems Quality of complaints procedures
Police 999 Calls and Emergencies Performance in answering 999 calls
Performance in responding to emergencies
Number of recorded crimes per 1 000 population
% of all crimes cleared-up by primary means
Crime and Detection % of violent crimes cleared-up by primary means
% of burglaries cleared-up by primary means
Number of crimes cleared-up by primary means per policeofficerNumber of police officers available for ordinary duty per1 000 population
Police Resources Proportion of police officers’ time spent in public
Expenditure on policing per head of population
Fire Service % of fire calls at which “attendance standards” were met
Cost of the fire service per head of population

20
ANNEX D
CONSORTIUM PROJECT: BENCHMARKING HUMAN RESOURCES ACTIVITIES
Benchmarking Route
setting up and developing a benchmarking team
⇓
identifying human resources activities or processes which will benefit from benchmarking,and planning the project
⇓
mapping the process and identifying areas for improvement
⇓
identifying the best-in-class for the process
⇓
arranging and organising site visits with the best-in-class to collect data
⇓
analysing the data to produce an action plan aimed at delivering performance improvements
⇓
winning support for and implementing the action plan
⇓
monitoring results and developing a strategy of continuous improvement through benchmarking
21
ANNEX E
Agency Benchmarking DataThis column provides Agency minimum scores
Unweighted used for blank base of columns in first chart
Criterion UK Quality Award Standard Private Sector Average Agency Average Range of Agency ScoresLeadership 63 60 35 48 19Policy & Strategy 68 40 36 57 15People Managemt 66 50 36 50 18Resources 68 60 41 52 17Processes 75 50 35 53 14Customer Satisfaction 60 30 38 61 14People Satisfaction 66 40 22 45 7Impact on Society 55 30 17 30 0Business Results 86 50 46 63 23
Range of Agency Scores
0
10
20
30
40
50
60
70
80
90
Lead
ersh
ip
Pol
icy
&S
trat
egy
Peo
ple
Man
agem
t
Res
ourc
es
Pro
cess
es
Cus
tom
erS
atis
fact
ion
Peo
ple
Sat
isfa
ctio
n
Impa
ct o
nS
ocie
ty
Bus
ines
sR
esul
ts
Criteria
Un
wei
gth
ed S
core
s
Range of Agency Scores
UK Quality Award Standard
Agency Average
Private/Public Comparison
0
10
20
30
40
50
60
70
80
90
Lead
ersh
ip
Pol
icy
&S
trat
egy
Peo
ple
Man
agem
t
Res
ourc
es
Pro
cess
es
Cus
tom
erS
atis
fact
ion
Peo
ple
Sat
isfa
ctio
n
Impa
ct o
nS
ocie
ty
Bus
ines
sR
esul
ts
Criteria
Un
wei
gth
ed S
core
s
Private Sector Average
Agency Average
UK Quality Award Standard

22

23
THE IMPLEMENTATION OF BENCHMARKING FROMA SWEDISH PERSPECTIVE
by Lars Dahlberg and Christian IsakssonStatskontoret, Sweden
Public sector reform in Sweden has been significant at all levels of Government for more than adecade. Reform efforts are gaining momentum partly because of increasing difficulties in financing thepublic sector, coupled with mounting pressures caused by the globalisation of most aspects of social andeconomic life. A natural response has been the assimilation of new methods for improving performance.The benchmarking experiences summarised in this paper form part of this strategy.
Dimensions in the Implementation of Benchmarking
There are two dimensions that can be referred to in gaining a greater understanding ofbenchmarking experiences. The first distinguishes benchmarking as a process performed for either theevaluation or the continuous improvement of public activities. The second identifies the approach as beingeither results oriented or process oriented.
Granted the subjectivity and importance of “classifying” each benchmarking experience, it isimportant to keep in mind that benchmarking in all its forms contains a mixture of these four dimensions.These dimensions are to be understood as representing a rough or general interpretation of the prevalentdirection identified in the four benchmarking cases presented in this paper.
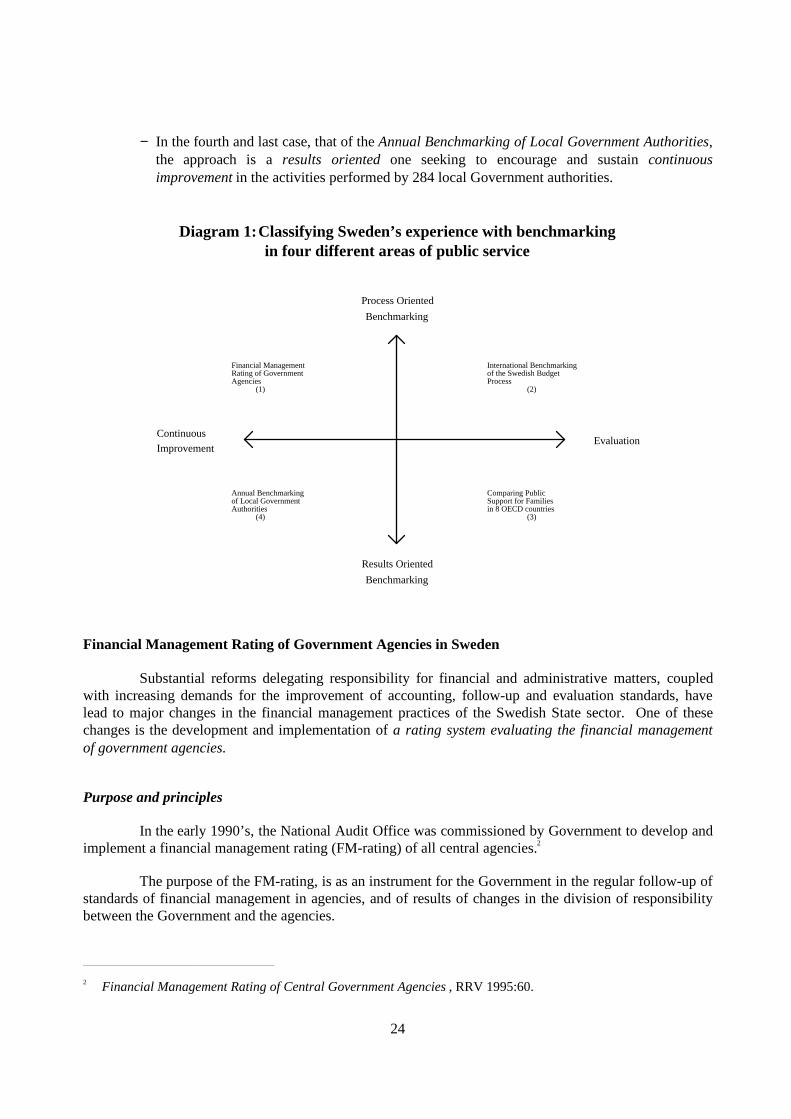
− In the first case, that of the Financial Management Rating of Government Agencies, thedirection points towards a process oriented benchmarking system that aims to initiate andconsolidate continuous improvement in the financial management practices of 253 governmentagencies.
− The second case deals with the International benchmarking of the Swedish GovernmentBudget Process. The principal direction here is undoubtedly process oriented yet with theobjective of being evaluative in terms of offering an international perspective to a unique re-form effort of the Government’s budget process.
− In the third case, that of an International Comparison of Public Support for Families,undertaken in eight OECD-countries, the emphasis is towards results oriented benchmarkingfor purposes of comprehensively evaluating the objectives and results of existing programsand services.
24
− In the fourth and last case, that of the Annual Benchmarking of Local Government Authorities,the approach is a results oriented one seeking to encourage and sustain continuousimprovement in the activities performed by 284 local Government authorities.
Diagram 1:Classifying Sweden’s experience with benchmarkingin four different areas of public service
Process Oriented
Results Oriented
ContinuousEvaluation
Financial ManagementRating of GovernmentAgencies
Annual Benchmarkingof Local GovernmentAuthorities
International Benchmarkingof the Swedish Budget
Comparing PublicSupport for Familiesin 8 OECD countries
Improvement
Benchmarking
Benchmarking
(1) (2)
(3)(4)
Process
Financial Management Rating of Government Agencies in Sweden
Substantial reforms delegating responsibility for financial and administrative matters, coupledwith increasing demands for the improvement of accounting, follow-up and evaluation standards, havelead to major changes in the financial management practices of the Swedish State sector. One of thesechanges is the development and implementation of a rating system evaluating the financial managementof government agencies.
Purpose and principles
In the early 1990’s, the National Audit Office was commissioned by Government to develop andimplement a financial management rating (FM-rating) of all central agencies.2
The purpose of the FM-rating, is as an instrument for the Government in the regular follow-up ofstandards of financial management in agencies, and of results of changes in the division of responsibilitybetween the Government and the agencies.
2 Financial Management Rating of Central Government Agencies , RRV 1995:60.
25
The FM-rating is composed of a two-letter rating for each agency:
− The first position -- a so-called consolidated group rating -- represents an evaluation offinancial management at the consolidated group level. It is meant to rate the relationshipbetween the Government and the agencies.
− The second position -- a so-called agency rating -- evaluates financial management at theagency level. It is intended to show how well the agencies meet general requirements inrespect of financial management.
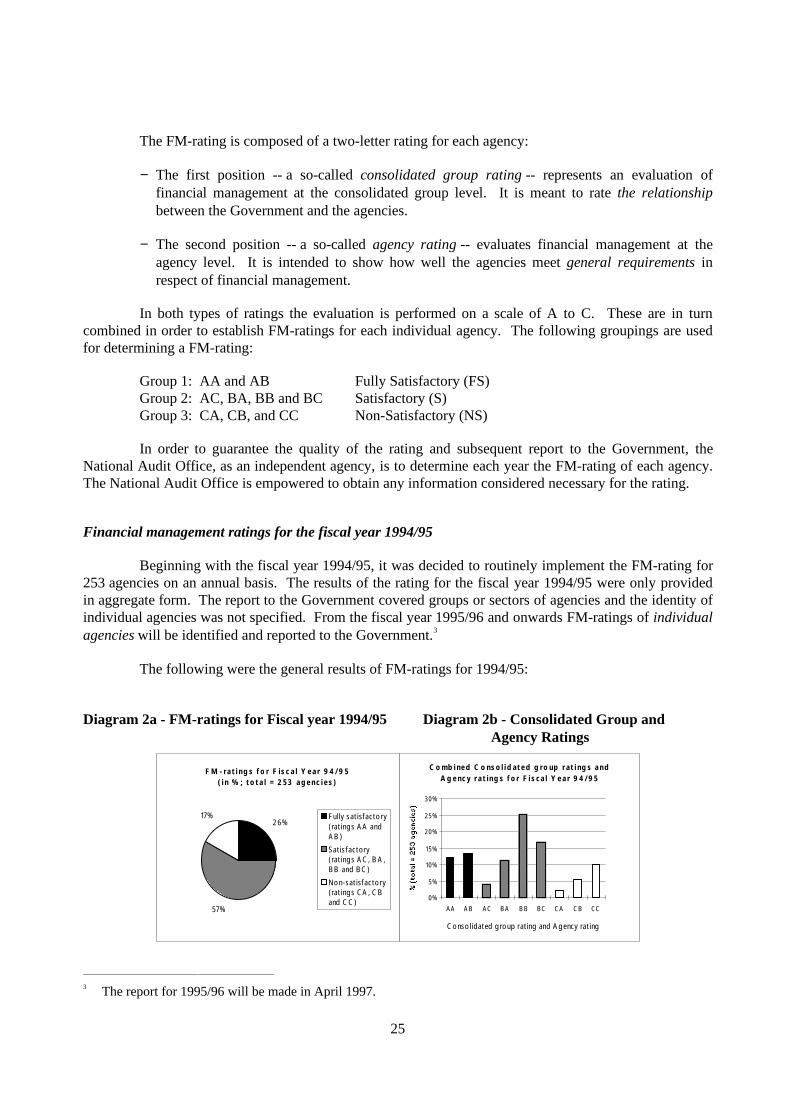
In both types of ratings the evaluation is performed on a scale of A to C. These are in turncombined in order to establish FM-ratings for each individual agency. The following groupings are usedfor determining a FM-rating:
Group 1: AA and AB Fully Satisfactory (FS)Group 2: AC, BA, BB and BC Satisfactory (S)Group 3: CA, CB, and CC Non-Satisfactory (NS)
In order to guarantee the quality of the rating and subsequent report to the Government, theNational Audit Office, as an independent agency, is to determine each year the FM-rating of each agency.The National Audit Office is empowered to obtain any information considered necessary for the rating.
Financial management ratings for the fiscal year 1994/95
Beginning with the fiscal year 1994/95, it was decided to routinely implement the FM-rating for253 agencies on an annual basis. The results of the rating for the fiscal year 1994/95 were only providedin aggregate form. The report to the Government covered groups or sectors of agencies and the identity ofindividual agencies was not specified. From the fiscal year 1995/96 and onwards FM-ratings of individualagencies will be identified and reported to the Government.3
The following were the general results of FM-ratings for 1994/95:
Diagram 2a - FM-ratings for Fiscal year 1994/95 Diagram 2b - Consolidated Group and Agency Ratings
F M - r a t i ng s f o r F is c a l Y e a r 9 4 / 9 5 ( i n % ; t o t a l = 2 5 3 a g e nc i e s )
2 6%
57%
17% Fully sat isf act o ry(rat ing s A A andA B )
Sat isf act o ry(rat ing s A C , B A ,B B and B C )
No n-sat isf act o ry(rat ing s CA , C Band C C )
C o mb i ne d C o ns o l i d at e d g r o up r a t i ng s a nd A g e nc y r a t ing s f o r F i s ca l Y e a r 9 4 / 9 5
0%
5%
10%
15%
20%
25%
30%
AA A B AC B A B B BC CA CB CC
C o nso lidat ed g ro up rat ing and A g ency rat ing
3 The report for 1995/96 will be made in April 1997.
26
The rating system
The consolidated group rating is based on the National Audit Office’s assessment of theagencies on the basis of a number of aspects that measure how the agency performs its financialmanagement in the overall context of central government.
The following are examples of factors that are assessed:
− the audit report; − overspending of appropriations; − reports to the central government accounting system; − cash management; − reconciliation of payments; − checks of closing balances and opening balances in the final accounts.
The agency rating is based on the answers the agency itself provides to a questionnaire that isthen further processed, including examination by the National Audit Office of the agency. Thequestionnaire covers the financial management requirements that apply to all agencies. The questionnairedoes not measure circumstances specific to the agency and is mostly of a formal character. It containsquestions on items in the balance sheet and the income statement.
Examples of such items are:
– administration and valuation of outstanding claims;– proportion of bad debt losses and interest paid on overdue payments;– accounting for fixed assets.
Appropriation accounting is also covered. In addition, a number of general areas are measured toelucidate the agency’s methods of management, i.e.:
– procurement and sales of goods and services;– integration with other information systems;– business-like conditions for fee-financed activities;– follow-up of earlier audit observations.
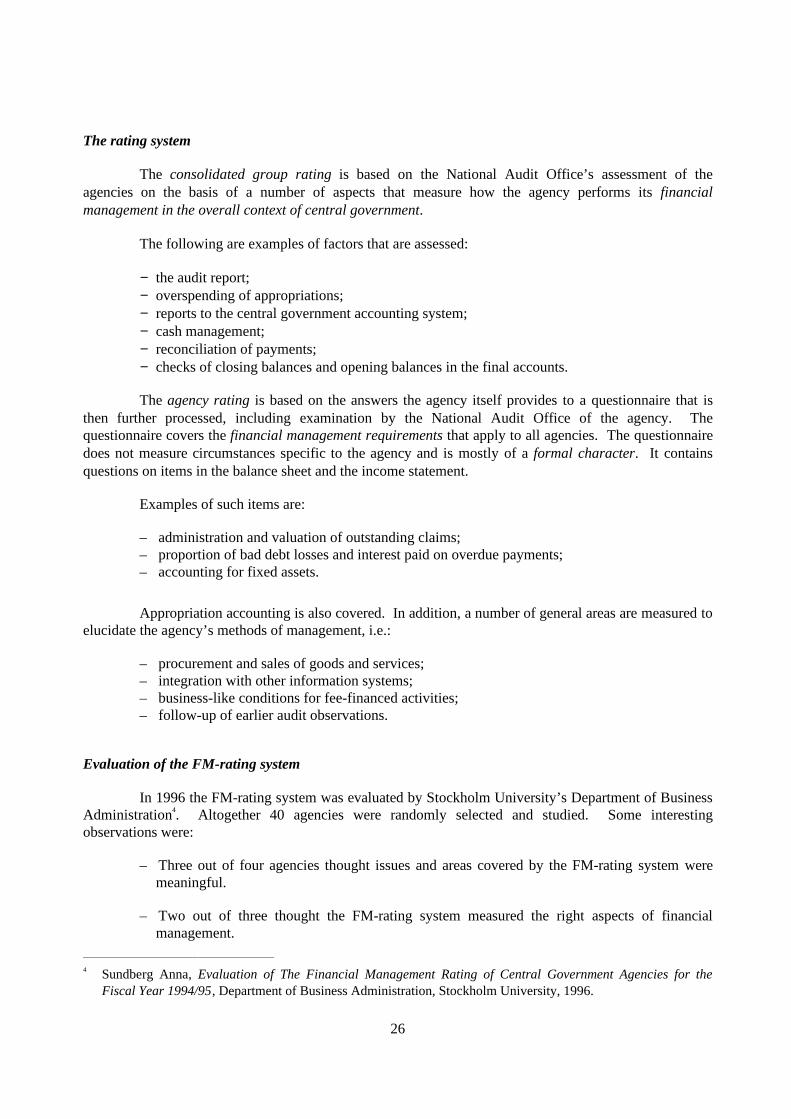
Evaluation of the FM-rating system
In 1996 the FM-rating system was evaluated by Stockholm University’s Department of BusinessAdministration4. Altogether 40 agencies were randomly selected and studied. Some interestingobservations were:
– Three out of four agencies thought issues and areas covered by the FM-rating system weremeaningful.
– Two out of three thought the FM-rating system measured the right aspects of financialmanagement.
4 Sundberg Anna, Evaluation of The Financial Management Rating of Central Government Agencies for the
Fiscal Year 1994/95, Department of Business Administration, Stockholm University, 1996.
27
– More than half were positive to the idea the FM-rating of individual agencies being identified.
– A similar number considered that the FM-rating system had not resulted in any changes infinancial management. Two out of five took the opposite view.
– Two out of five viewed the FM-rating system as being potentially valuable as a benchmarkingdevice. More than half were negative to such an idea.
– One out of two thought the FM-rating system had no value as a learning process. Close to anequal number shared an opposite view.
– Two out of three were generally positive about being involved with the FM-rating system.
Thus, the evaluation of the FM-rating system’s first year of implementation conveys a dividedpicture. From a benchmarking perspective, both hazards and potentials can be identified, a principal onebeing: that close to two-fifths of the evaluated agencies expressed a willingness to benchmark theirFM-practices in relation to the agencies that had earned top FM-ratings. Hence, next year’s individualFM-ratings stand a good chance of being used as envisaged.
The International Benchmarking of the Swedish Budget Process
Comparing budgeting procedures and fiscal performance
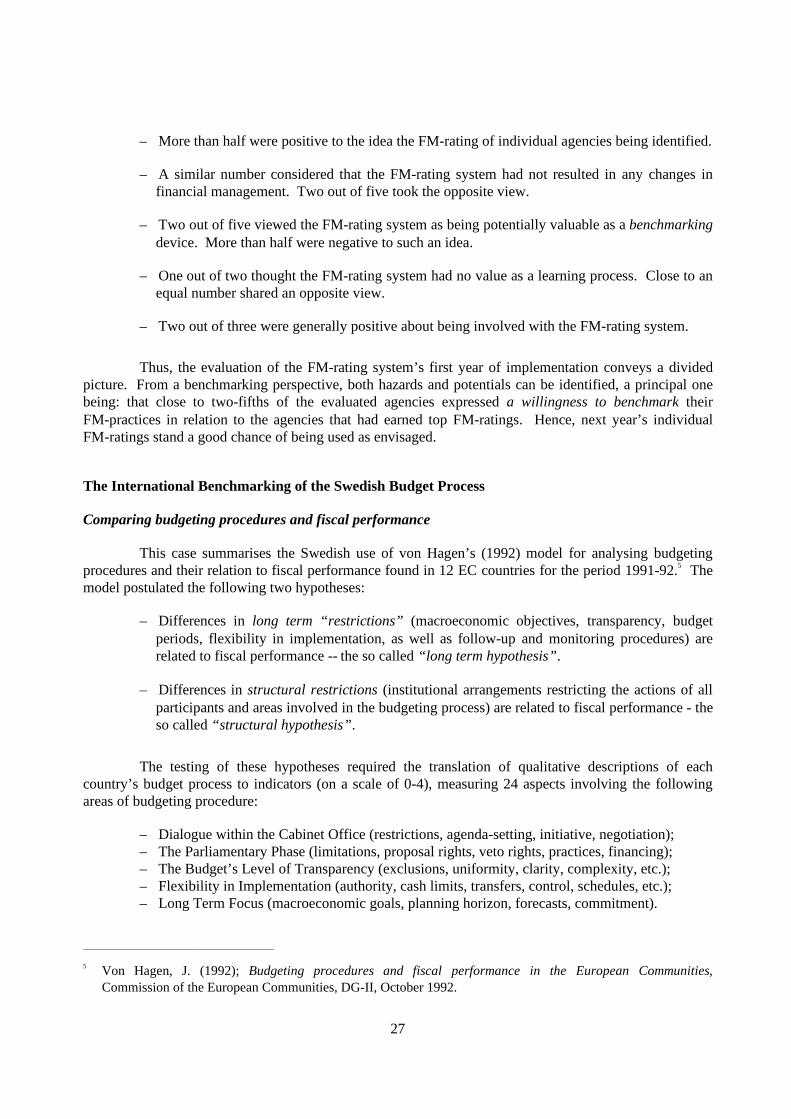
This case summarises the Swedish use of von Hagen’s (1992) model for analysing budgetingprocedures and their relation to fiscal performance found in 12 EC countries for the period 1991-92.5 Themodel postulated the following two hypotheses:
– Differences in long term “restrictions” (macroeconomic objectives, transparency, budgetperiods, flexibility in implementation, as well as follow-up and monitoring procedures) arerelated to fiscal performance -- the so called “long term hypothesis”.
– Differences in structural restrictions (institutional arrangements restricting the actions of allparticipants and areas involved in the budgeting process) are related to fiscal performance - theso called “structural hypothesis”.
The testing of these hypotheses required the translation of qualitative descriptions of eachcountry’s budget process to indicators (on a scale of 0-4), measuring 24 aspects involving the followingareas of budgeting procedure:
– Dialogue within the Cabinet Office (restrictions, agenda-setting, initiative, negotiation);– The Parliamentary Phase (limitations, proposal rights, veto rights, practices, financing);– The Budget’s Level of Transparency (exclusions, uniformity, clarity, complexity, etc.);– Flexibility in Implementation (authority, cash limits, transfers, control, schedules, etc.);– Long Term Focus (macroeconomic goals, planning horizon, forecasts, commitment).
5 Von Hagen, J. (1992); Budgeting procedures and fiscal performance in the European Communities,
Commission of the European Communities, DG-II, October 1992.

28
In order to construct indexes measuring each country’s overall level of restrictiveness inbudgeting procedures, all indicators were subsequently added up to index-totals on a scale of 0-96 (highervalues meaning greater restrictiveness). These indexes were then related to each country’s fiscalperformance consisting of key economic indicators such as government fiscal deficit, net borrowing, etc.
More interestingly, the relationships between on the one side long term restrictiveness andstructural restrictiveness, and fiscal performance on the other, were also analysed. This was done byaltering the composition of the budget procedure areas included in each index.
All in all von Hagen drew the following general conclusions:
– The “long term hypothesis” could not be validated -- no relation could be established betweenfiscal performance and variations in long term restrictions
– The “structural hypothesis” was confirmed. Budgeting performance was found to be relatedto variations in structural restrictions. Regression analysis showed that as much as one-thirdof the fiscal deficit could be explained by structural restrictions, meaning that higherindicators for structural restrictions correlated with superior fiscal performance.
– Variations in the level of structural restrictiveness in each country’s initiating phases (theCabinet Office Phase and the Parliamentary Phase) were the areas of budgeting procedure thatwere found to be most strongly related to fiscal performance.
The rating of the Swedish budget process
In late 1992, the Expert Group on Public Finance analysed the Government budget processfollowing von Hagen’s model of analysis. The following conclusions were drawn:
On a scale of 0-80, Sweden obtained a rating of 20 for structural restrictiveness, to be comparedwith the EC country’s average of 40 and span of 20-70. In all four areas related to structuralrestrictions -- the Cabinet Office Phase, the Parliamentary Phase, the Degree of BudgetTransparency, and the Flexibility in Implementation -- Sweden obtained lower indexes than ECaverages. Long Term Focus was the only area where Sweden obtained a higher result. On theother hand, this area was concluded as being the one of least significance in terms of influencingfiscal performance.
On the basis of these results, the following changes were recommended:
– Strengthening structural restrictions over participants and activities belonging to the initiatingphases of the budget process.
– The introduction of decision-making procedures enabling the fixing of an overall ceiling onspending during the initiating phases of the budget process.
– More stringent rules concerning MPs proposal rights.
– Improving parliamentary monitoring and auditing over policy implementation.
29
Major changes in the Swedish budget process
Over the past few years, Sweden’s Riksdag (Parliament) and Government have taken severaldecisions aimed at reforming and strengthening the budget process, an important element in the work ofimproving public finances.
One such decision is to introduce a framework budget model for handling budget proposals in theRiksdag. The model means that the Riksdag will first decide on the overall level of spending and thendetermine its distribution among various purposes.
A decision has also been taken that the Government’s budget proposals should come within a setexpenditure ceiling for the public sector. This expenditure ceiling is defined in nominal terms, spans threeyears and covers the entire public sector (that is the state sector, excluding interest payments ongovernment debt); social-insurance schemes; and the municipalities. For the state sector, theGovernment’s budget proposal is divided into expenditure areas. With the introduction of the ceiling,open-ended or draft appropriations as a form of appropriation have been abolished.
As far as the local government sector (the municipalities) is concerned the expenditure ceiling issomewhat different. It rests on a separate agreement between the government and the municipal sector.
Budget process and fiscal policy - past, present, and future
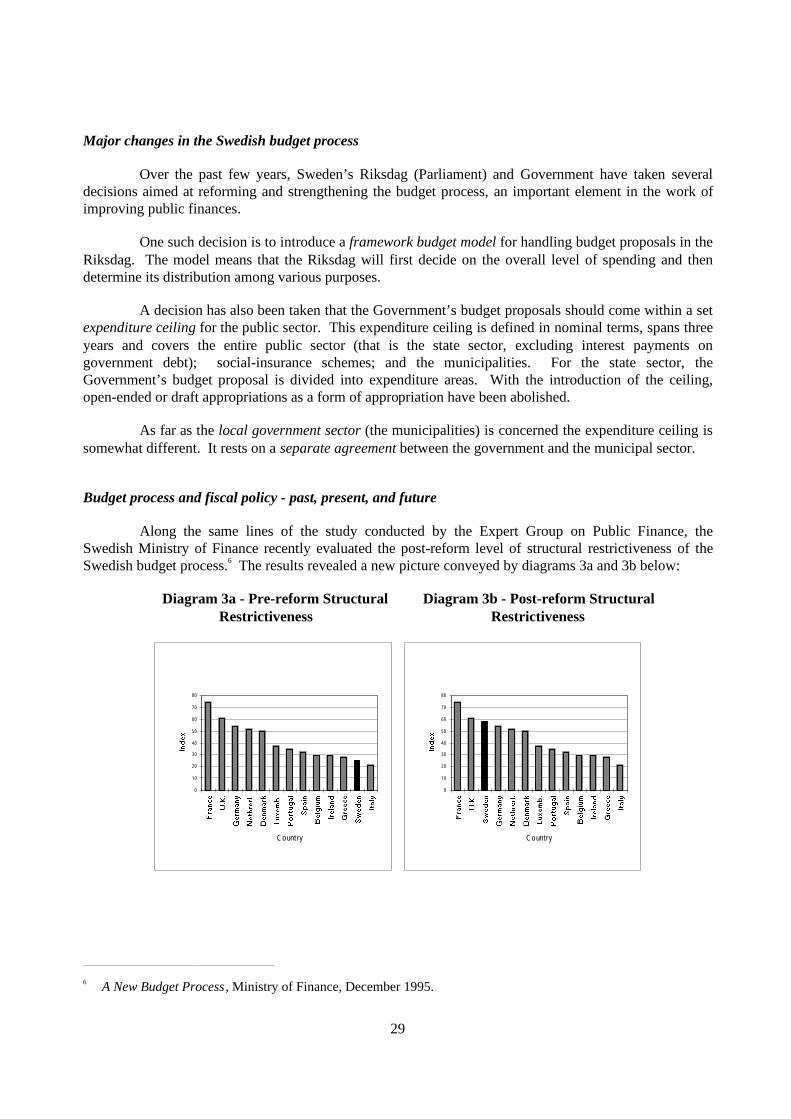
Along the same lines of the study conducted by the Expert Group on Public Finance, theSwedish Ministry of Finance recently evaluated the post-reform level of structural restrictiveness of theSwedish budget process.6 The results revealed a new picture conveyed by diagrams 3a and 3b below:
Diagram 3a - Pre-reform Structural Diagram 3b - Post-reform Structural Restrictiveness Restrictiveness
0
10
20
30
40
50
60
70
80
Country
0
10
20
30
40
50
60
70
80
Country
6 A New Budget Process , Ministry of Finance, December 1995.

30
On the whole, it is clear that both past and contemporary decisions aimed at reforming theSwedish budget process have been markedly influenced by the findings of the two earlier studiesmentioned. However, it should be noted that the future effect on Sweden’s fiscal performance remains tobe seen. However, a good measure of optimism may be warranted arising from the fact that budgetprocess reform in Sweden is being strongly backed-up by a series of deep cuts in Government spending.
Comparing Public Support for Families: a Study of Eight OECD Member Countries
This is a summary of a study that the Expert Group of Public Finance commissioned from theSwedish Agency for Administrative Development.7 The purpose of the study was to compare publicexpenditures for transfer payments and services to families with children, existing in 1993 in Britain,Denmark, Finland, France, Germany, the Netherlands, Norway and Sweden. The study analyses andcompares all forms of public support for families with children for the period beginning with a child’stime of birth to his or her completion of secondary education.
Findings and results
The study’s principal findings were: Sweden and Norway accounted for the highest levels ofexpenditure per child as well as for the implementation of the most varied systems of family supportbenefits and services.
7 The study will be available in English early 1997.
31
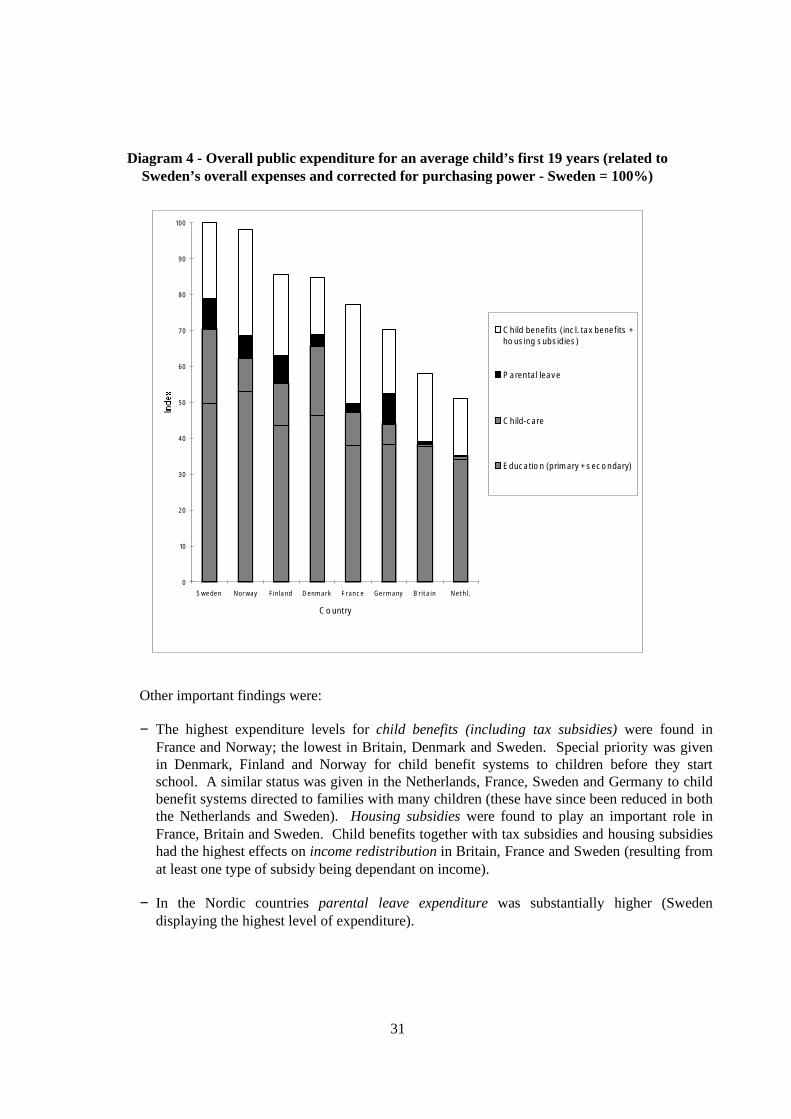
Diagram 4 - Overall public expenditure for an average child’s first 19 years (related toSweden’s overall expenses and corrected for purchasing power - Sweden = 100%)
0
10
20
30
40
50
60
70
80
90
100
S we den Nor way Fin la nd D enm ar k Fr an c e Ge r m any B r i t a in N et h l .
C o unt ry
C h ild benef its ( inc l. tax bene f its +ho us ing s ubs id ies )
P a ren tal leav e
C h ild-c are
Educ a t io n (p rim ary + s ec o ndary)
Other important findings were:
− The highest expenditure levels for child benefits (including tax subsidies) were found inFrance and Norway; the lowest in Britain, Denmark and Sweden. Special priority was givenin Denmark, Finland and Norway for child benefit systems to children before they startschool. A similar status was given in the Netherlands, France, Sweden and Germany to childbenefit systems directed to families with many children (these have since been reduced in boththe Netherlands and Sweden). Housing subsidies were found to play an important role inFrance, Britain and Sweden. Child benefits together with tax subsidies and housing subsidieshad the highest effects on income redistribution in Britain, France and Sweden (resulting fromat least one type of subsidy being dependant on income).
− In the Nordic countries parental leave expenditure was substantially higher (Swedendisplaying the highest level of expenditure).

32
− Denmark and Sweden accounted for greater expenditures for child care than the othercountries. Practically no public expenditure was found to exist for this kind of purpose inboth Britain and the Netherlands.
− Though being the area of highest expenditure in all countries, much less variation wasobserved in expenditure for primary and secondary education. The Nordic countries,however, showed substantially higher figures (Sweden and Norway the highest). Between thecountries there were considerable differences concerning the cost per pupil in primary school.This was partly due to differences in the number of teachers employed.
Method
The study’s principal sources of information were written material from domestic andinternational organisations (OECD, Eurostat, the European Commission, EURYDICE, etc.),complemented by consultations with national and international advisers.
Comprehensive analysis was also carried out involving participation from “central advisers” foreach country studied. This measure was taken for purposes of securing a proper evaluation andunderstanding of all information concerning each country. These “central advisers” were also allowed toread draft versions of the study.
Significant difficulties arose concerning the development and use of measures and indexes,mainly due to the effects of different tax systems, accounting methods, currency values and fundingpractices.
The principal measurement used for indexing each country’s overall level of commitment wasthat of net public expenditure. A net estimate was favoured for reasons of enabling the exclusion of bothtaxes paid on family benefits and of user fees for child-care services and education.
Each country’s net expenses per child was also indexed by dividing the net public expenditurefor each benefit/service by the respective number of their intended users. These figures were thencalculated for a child’s first nineteen years of public support as if entirely occurring in 1993. Furtheranalysis was performed as these results were later summed up to totals revealing each country’s combinedexpenditure for all public forms of support existing in 1993 per child raised.
The study also made use of purchasing power indexes that related each country’s expenditurelevels to the domestic value of local products and services.
A number of so called “family types” were developed to further analyse and compare the study’sprincipal findings in terms of variations in income, number of supporting parents, as well as the numberand age of children.

33
Policy issues in a Swedish context
The study discussed the following two principal policy issues concerning public programs andservices for families in Sweden:
– Major differences were identified regarding the general nature of each country’s system forchild benefits (including tax subsidies and housing subsidies). From a comparative stance, theSwedish system was found to be quite selective in nature (due to the fact that proportionatelylarge housing subsidies were awarded on selective grounds). On the basis of this observation,the conventional perception held in Sweden concerning the general make-up of the domesticchild benefit system was strongly questioned.
– Public expenditures for both subsidised services (child-care + primary and secondaryeducation) and benefits (child benefits + tax subsidies + housing subsidies + parental leave),were found to be substantially higher in Sweden. Consequently, no general policy objectivesassigning priority levels between subsidised services and benefits as two means of publicsupport could be identified.
As a result, policy recommendations in the study centred on the idea that possibilities forreducing public expenditure for the support of families with children in Sweden could be identified.Reduced expenditure was seen as attainable by enhanced efficiency and/or by overall reductions inspending. Areas viewed as being suitable for reductions in expenditure were those of child-care, parentalleave and education. This perceived suitability arose from the fact that even marginal reductions wouldtranslate to considerable savings in policy areas requiring such high rates of expenditure.
From a wider perspective, the making of well defined policy choices aiming at establishingpriority levels and criteria for evaluating and comparing existing programs and services, was alsohighlighted as a desirable course of action.
The Annual Benchmarking of Local Government Authorities
This case deals with the annual benchmarking of the finances of Swedish local Governmentauthorities that has been implemented since 1993. The benchmarking is carried out by The SwedishAssociation of Local Authorities in co-operation with the Central Bureau of Statistics. Its general purposeis that of elucidating the general financial results of local Government authorities.
The results are published in the form of a yearly report -- How Costly Is Your Local GovernmentAuthority -- containing information from the previous year’s annual accounts as reported by localGovernment authorities. Close to 140 different indicators for each local Government authority aredeveloped and analysed each year.
Indicators reported
The annual report contains analysis of indicators describing all areas of the local Governmenteconomy. The indicators used are different to those used in other comparative studies that are oftenrestricted to a specific area. For example, the National Agency of Education and the National Board of
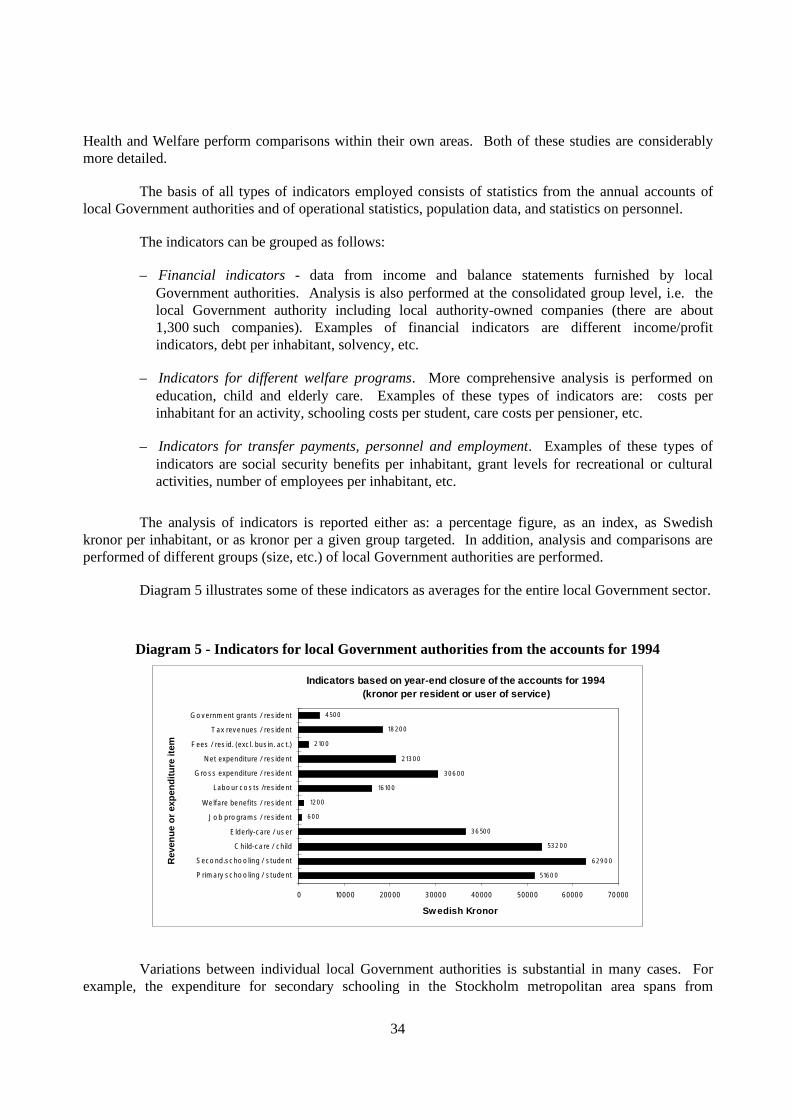
34
Health and Welfare perform comparisons within their own areas. Both of these studies are considerablymore detailed.
The basis of all types of indicators employed consists of statistics from the annual accounts oflocal Government authorities and of operational statistics, population data, and statistics on personnel.
The indicators can be grouped as follows:
– Financial indicators - data from income and balance statements furnished by localGovernment authorities. Analysis is also performed at the consolidated group level, i.e. thelocal Government authority including local authority-owned companies (there are about1,300 such companies). Examples of financial indicators are different income/profitindicators, debt per inhabitant, solvency, etc.
– Indicators for different welfare programs. More comprehensive analysis is performed oneducation, child and elderly care. Examples of these types of indicators are: costs perinhabitant for an activity, schooling costs per student, care costs per pensioner, etc.
– Indicators for transfer payments, personnel and employment. Examples of these types ofindicators are social security benefits per inhabitant, grant levels for recreational or culturalactivities, number of employees per inhabitant, etc.
The analysis of indicators is reported either as: a percentage figure, as an index, as Swedishkronor per inhabitant, or as kronor per a given group targeted. In addition, analysis and comparisons areperformed of different groups (size, etc.) of local Government authorities are performed.
Diagram 5 illustrates some of these indicators as averages for the entire local Government sector.
Diagram 5 - Indicators for local Government authorities from the accounts for 1994
Indicators based on year-end closure of the accounts for 1994 (kronor per resident or user of service)
516 0 0
6 2 9 0 0
53 2 0 0
3 6 50 0
6 0 0
12 0 0
16 10 0
3 0 6 0 0
2 13 0 0
2 10 0
18 2 0 0
4 50 0
0 1000 0 200 00 3 000 0 40 000 5000 0 6 000 0 70 000
P rim ary s c ho o lin g / s tude nt
S ec o nd .s c ho o lin g / s tude nt
C hild-c a re / c h ild
E ld erly-c are / us er
J o b p ro gram s / re s ide nt
We lfare be nef it s / re s ide nt
Lab o ur c o s ts / re s ide nt
G ro s s expen diture / re s ide nt
N et expen diture / re s ide nt
F ees / res id. (exc l. bu s in . ac t .)
T a x rev e nues / re s ide nt
G o v ernm ent grants / re s ide nt
Rev
enu
e o
r ex
pen
dit
ure
item
Sw edish Kronor
Variations between individual local Government authorities is substantial in many cases. Forexample, the expenditure for secondary schooling in the Stockholm metropolitan area spans from
35
46,000 kronor per student to 71,000. For primary schooling from 3,900 to 67,000 kronor per student, andfor child-care from 42,000 to 69,000 kronor per child.
The use of indicators
The interest for following-up and evaluating local Government activities has increasedsignificantly in recent years at both central and local Government.
Besides elucidating the annual state of local finances, a principal purpose is that of creatingcontinued self-analysis concerning why differences exist between local Government authorities.
The need to follow-up the newly introduced Government grant system has further underscoredthe need for good indicators used in the financial practices of local Government authorities.
At the local Government level, this type of financial information is principally used whenworking with the budget. It is also increasingly being used independently as a basis for carrying out morein-depth comparative studies by one or more local Government authorities.
General experience and problems
The main problem with performance indicators of this character is the insufficient degree ofcomparability existing between different local Government authorities. The organisational and operationalmethods developed, together with the standards chosen for reporting financial and operational statistics,vary substantially between individual authorities. However, increased use has resulted in a continuingimprovement of the base data used. Consequently, the continual task of improving the quality of data aswell as that of the comparative process itself -- both in terms of the development and use of financial andoperational statistics -- has been given the highest priority.
Beginning with the closing of annual accounts for the year 1995, a new system for classifyingactivities, costs and income has been introduced for the collection of financial data from local Governmentauthorities. So as to improve the degree of comparability between local government authorities.Moreover, a Government commission is currently investigating proposals leading to the improvement ofboth the quality and comparability of financial information used in local Government. Addressing issuesconcerning the use of indicators in annual national follow-ups is a principal task being dealt with by thecommission.
One important development aspect of the work with indicators -- being carried out by theAssociation of Local Authorities -- is that of finding the most relevant indicators that can be used at boththe central and local levels of Government. An equally important task is that of devising models that canexplain observed differences existing between individual or segments of local Government authorities.
Swedish Benchmarking Experiences
Assumptions behind benchmarking
There are several common traits concerning the motives driving the studies summarised in thispaper. These can be grouped along the following lines:
36
– Perceiving the state of affairs and developments pertaining to the area(s) investigated as beinggenerally unsatisfactory in terms of efficiency and effectiveness;
– Assuming that a benchmarking approach stands a good chance of identifying and analysinginefficiency in hitherto unscrutinised practices in the areas investigated;
– Sweden’s ambition to develop an internationally competitive public sector.
What do the cases tell us about continuous improvement?
In the two cases identified as aiming at continuous improvement -- the Financial ManagementRating of Government Agencies and the Annual Benchmarking of Local Authorities -- the objective isexplicitly stated as being the recurrent benchmarking of existing services and programs. Benchmarking isseen as a systematic and continuous process that once started, never ends.
Another similarity is the presence of benchmarking agents that are not directly responsible forthe processes or results being benchmarked (RRV, Central Bureau of Statistics, Association of LocalAuthorities). Not surprisingly, this “outsider” effect can represent a challenge for the development of abenchmarking culture within the agencies concerned. This “ownership” aspect of the benchmarkingprocess can substantially influence attitudes towards the concept of “learning from others”.
Diagram 6 illustrates a model for how agencies can implement such continuous benchmarking.
Diagram 6: The Benchmarking process for continuous improvement
UnderstandingYour Enterprise
Implementationand Follow-Up
IdentifyingComparators
AnalysingDifferences
Setting Objectivesand Planning Activities
The principles underlining this model are also evident in a handbook for benchmarking recently publishedby the National Audit Office.8
Some insights on evaluation
In the remaining two cases -- the international benchmarking of the budget process and the studyin eight OECD Member countries comparing support for families -- the benchmarking performed wasmainly evaluative in character. Hence, it centred on questioning the suitability of the systems or theresults being achieved.
8 Benchmarking -- Effectiveness Through Comparisons , RRV 1996:35.
37
One important distinction between the two cases concerns their respective initiating andimplementing agents. In the Budget Process case, the benchmarking was both initiated and performed bya government body found within the policy area being investigated. The contrary was true in the Supportfor Families case. This explains to a large extent why the benchmarking of the Budget Process had such aclear and immediate prescriptive outcome in comparison to the Family Support study’s moreargumentative and suggestive conclusions. The findings of the latter case still forming the basis of presentdeliberation and public debate.
In both cases, whether centred on processes or results, the evaluative benchmarking’seffectiveness was determined in great part by the initial formulation of relevant policy issues thataddressed the circumstances of the area(s) chosen for investigation. The complexity in terms of time,analytical skill and resources needed, explains why this type of benchmarking is normally performedoccasionally or on a off time basis.
Diagram 7 shows a five-step procedure for how agencies can implement evaluationbenchmarking that is partially deduced from the two cases.
Diagram 7: The benchmarking process for evaluation
Formulating Clear and
IdentifyingPolicy Choices
Chosing Internationalor National Comparators
Choice of Method and Implementation
Interpretation ofResults and Findings
Relevant Policy Issues
This type of benchmarking plays an important role in initiating a public debate on the need forchange, one that leads to the questioning of the established order without having to present a fullyelaborated alternative policy, program or system. This perspective puts great emphasis on the right timingof evaluative benchmarking.
The need for international benchmarking
In recent time one fourth of the commissions appointed by the Swedish Government that haveinvestigated different policy issues have made international comparisons or analysis of a benchmarkingcharacter. There are several motives encouraging this development:
– Increased globalisation and international interdependency. National policy frames arebecoming too narrow for dealing with issues that are becoming more and more international incharacter (i.e. issues concerning finance, the environment, communications, energeticinfrastructure, education, etc.).

38
– The absence of domestic comparators. International benchmarking enables or significantlywidens the prospects for finding suitable comparators.
– The quest for competitive alternatives. In the face of change the international hunt for newideas can stimulate positive change in areas containing obsolete and outmoded programs andsystems.
– Widening the scope of debate and deliberation. By casting light on new arguments oraspects, international benchmarking can substantially widen the freedom of action for policymakers and implementers alike.
Implementing international benchmarking is neither simple nor inexpensive. There is a need tofind ways to decrease the amount of time and resources usually needed. This may include makinginternational benchmarking studies that are carried out in different OECD Member countries more easilyavailable among all OECD members. There is also a need to analyse experiences on such issues asanalytical approaches and the use of international benchmarking in the future development of publicmanagement.
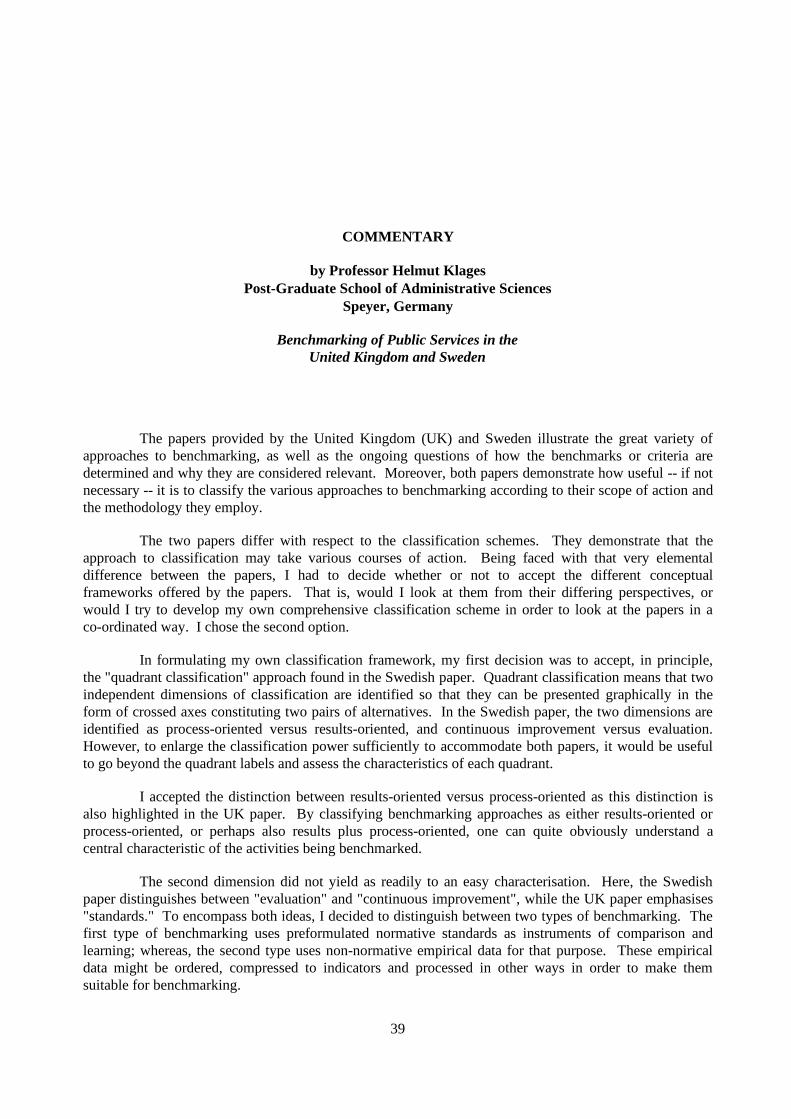
39
COMMENTARY
by Professor Helmut KlagesPost-Graduate School of Administrative Sciences
Speyer, Germany
Benchmarking of Public Services in theUnited Kingdom and Sweden
The papers provided by the United Kingdom (UK) and Sweden illustrate the great variety ofapproaches to benchmarking, as well as the ongoing questions of how the benchmarks or criteria aredetermined and why they are considered relevant. Moreover, both papers demonstrate how useful -- if notnecessary -- it is to classify the various approaches to benchmarking according to their scope of action andthe methodology they employ.
The two papers differ with respect to the classification schemes. They demonstrate that theapproach to classification may take various courses of action. Being faced with that very elementaldifference between the papers, I had to decide whether or not to accept the different conceptualframeworks offered by the papers. That is, would I look at them from their differing perspectives, orwould I try to develop my own comprehensive classification scheme in order to look at the papers in aco-ordinated way. I chose the second option.
In formulating my own classification framework, my first decision was to accept, in principle,the "quadrant classification" approach found in the Swedish paper. Quadrant classification means that twoindependent dimensions of classification are identified so that they can be presented graphically in theform of crossed axes constituting two pairs of alternatives. In the Swedish paper, the two dimensions areidentified as process-oriented versus results-oriented, and continuous improvement versus evaluation.However, to enlarge the classification power sufficiently to accommodate both papers, it would be usefulto go beyond the quadrant labels and assess the characteristics of each quadrant.
I accepted the distinction between results-oriented versus process-oriented as this distinction isalso highlighted in the UK paper. By classifying benchmarking approaches as either results-oriented orprocess-oriented, or perhaps also results plus process-oriented, one can quite obviously understand acentral characteristic of the activities being benchmarked.
The second dimension did not yield as readily to an easy characterisation. Here, the Swedishpaper distinguishes between "evaluation" and "continuous improvement", while the UK paper emphasises"standards." To encompass both ideas, I decided to distinguish between two types of benchmarking. Thefirst type of benchmarking uses preformulated normative standards as instruments of comparison andlearning; whereas, the second type uses non-normative empirical data for that purpose. These empiricaldata might be ordered, compressed to indicators and processed in other ways in order to make themsuitable for benchmarking.
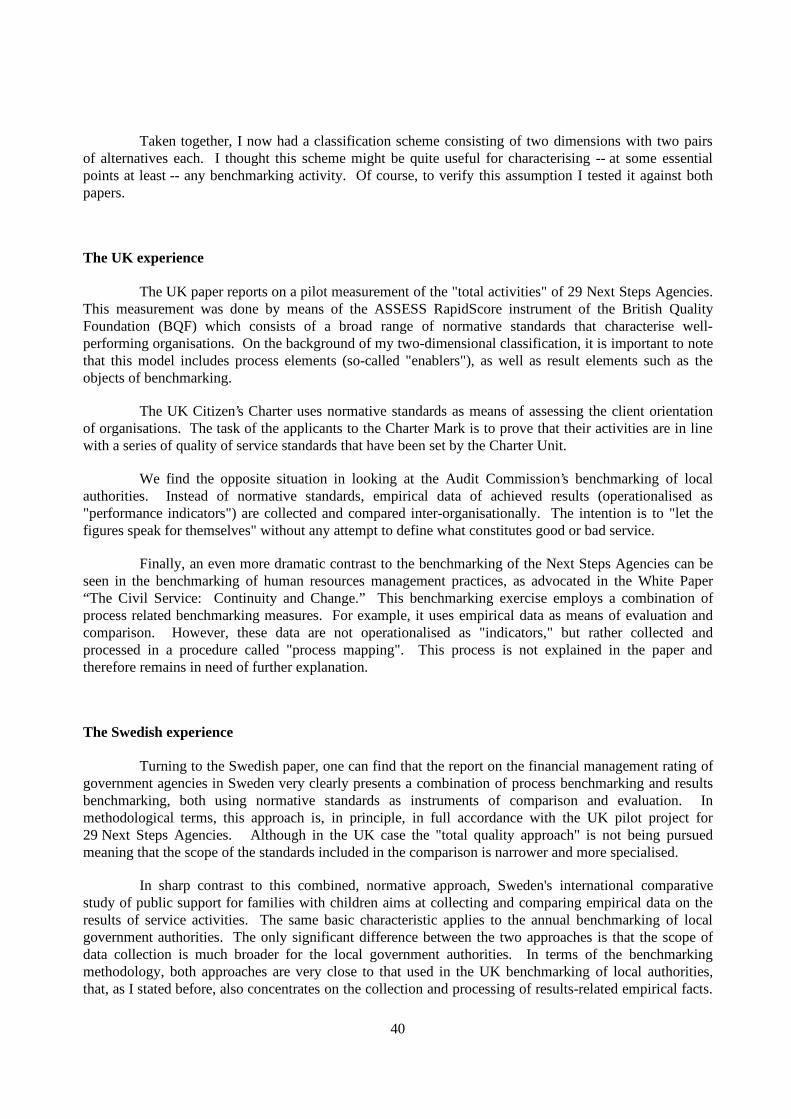
40
Taken together, I now had a classification scheme consisting of two dimensions with two pairsof alternatives each. I thought this scheme might be quite useful for characterising -- at some essentialpoints at least -- any benchmarking activity. Of course, to verify this assumption I tested it against bothpapers.
The UK experience
The UK paper reports on a pilot measurement of the "total activities" of 29 Next Steps Agencies.This measurement was done by means of the ASSESS RapidScore instrument of the British QualityFoundation (BQF) which consists of a broad range of normative standards that characterise well-performing organisations. On the background of my two-dimensional classification, it is important to notethat this model includes process elements (so-called "enablers"), as well as result elements such as theobjects of benchmarking.
The UK Citizen’s Charter uses normative standards as means of assessing the client orientationof organisations. The task of the applicants to the Charter Mark is to prove that their activities are in linewith a series of quality of service standards that have been set by the Charter Unit.
We find the opposite situation in looking at the Audit Commission’s benchmarking of localauthorities. Instead of normative standards, empirical data of achieved results (operationalised as"performance indicators") are collected and compared inter-organisationally. The intention is to "let thefigures speak for themselves" without any attempt to define what constitutes good or bad service.
Finally, an even more dramatic contrast to the benchmarking of the Next Steps Agencies can beseen in the benchmarking of human resources management practices, as advocated in the White Paper“The Civil Service: Continuity and Change.” This benchmarking exercise employs a combination ofprocess related benchmarking measures. For example, it uses empirical data as means of evaluation andcomparison. However, these data are not operationalised as "indicators," but rather collected andprocessed in a procedure called "process mapping". This process is not explained in the paper andtherefore remains in need of further explanation.
The Swedish experience
Turning to the Swedish paper, one can find that the report on the financial management rating ofgovernment agencies in Sweden very clearly presents a combination of process benchmarking and resultsbenchmarking, both using normative standards as instruments of comparison and evaluation. Inmethodological terms, this approach is, in principle, in full accordance with the UK pilot project for29 Next Steps Agencies. Although in the UK case the "total quality approach" is not being pursuedmeaning that the scope of the standards included in the comparison is narrower and more specialised.
In sharp contrast to this combined, normative approach, Sweden's international comparativestudy of public support for families with children aims at collecting and comparing empirical data on theresults of service activities. The same basic characteristic applies to the annual benchmarking of localgovernment authorities. The only significant difference between the two approaches is that the scope ofdata collection is much broader for the local government authorities. In terms of the benchmarkingmethodology, both approaches are very close to that used in the UK benchmarking of local authorities,that, as I stated before, also concentrates on the collection and processing of results-related empirical facts.

41
Also in the Swedish case, the learning effect from benchmarking is expected from the approach to "let thefigures speak for themselves".
Finally, the international benchmarking of the Swedish budget process also uses empirical data(without any normative meaning) as instruments of benchmarking. However, this approach takes one verysignificant step further by including not only results, but also process-related facts and by bringing thesetwo groups of data into an "analytical" relationship with each other. Stated more concretely, this approachaims at explaining results through process-characteristics by exploring their statistical correlations.
Insights and Consequences
I now turn to the question of insights to be gained and consequences to be derived frombenchmarking. I want to concentrate on those points that I myself regard as particularly important.
As stated earlier, the two papers represent a broad range of approaches to benchmarking. Theseapproaches cover quite well -- maybe with some exceptions -- the main paths that are usually available. Inview of this broad range, the question is raised whether there is any possibility to evaluate and rank theexisting alternatives. Of course, the criteria for such an evaluation and ranking have to be selected verycarefully beforehand.
On the background of the basic definition of benchmarking that I quoted in the beginning of thepaper, it may go without saying that one main criterion will necessarily be the capacity and effectivenessof a benchmarking approach for fostering learning processes. With respect to the approaches underdiscussion, I want to put forward the thesis that they represent different learning strategies, as well asdifferent probabilities and levels of learning effects to be expected.
Let us take, for example, the results-oriented comparison of empirical data that is found in theUK benchmarking of local authorities, the Swedish comparative study of public support for families withchildren, and the Swedish annual benchmarking of local government authorities. In all these cases, thelearning effect to be gained rests almost exclusively on two factors: the impact of comparative statisticsupon the general public and the actions of officials in the public sector who are expected to react to thesestatistics in an accountable way.
In this context, significant limits to the learning effect become visible. For example, the UKpaper reports that only those councils that had shown the worst performance improved significantly afterthe publication of the relevant data; whereas, councils rated as performing at or close to the average hadnot improved even after some years, regardless of the actual scope of improvement. In other words, thestrategy to "let the figures speak for themselves" produces the desired learning effect only if thecomparisons discloses levels well below the norm. One can assume that the learning effect decreases tozero at an average level of performance, and speculate further that it may become negative above the norm.
Consequently, to get a higher level of learning capacity for effectiveness and optimisation, thistype of benchmarking approach must be connected with additional elements of benchmarking orperformance management. One strategy for improving the learning capacity might be to switch to abenchmarking approach that combines standards with a results orientation or, perhaps, combines standardswith a results plus process orientation. This latter approach is used in several activities outlined in thepapers, including the strategic concept behind the Citizen’s Charter, the measurement of the "totalactivities" for Next Steps Agencies, and the Swedish financial management rating of government agencies.One could be inclined to expect higher learning effects, in particular, from the combination of standards

42
with the measurement of results plus process because this combination provides direct information onopportunities for improvement.
Another strategy for improving the learning capacity of data-oriented benchmarking might be toproceed in the direction of linking results-oriented data to process-oriented data in an analytical way. Thisis basically the strategy being pursued in Sweden’s international comparison of budget processes. Theinter-organisational comparison of empirical data on results will likely give rise to strong motivationalfactors (e.g. desire to have results compare favourably with other organisations, or to improve performancewhere there is a deficit compared to other organisations) that will increase the learning effect frombenchmarking.
Before digging any deeper into the nature of the conditions for optimising the learning effect, itis necessary to consider additional criteria for evaluating existing alternative types of benchmarking. Forexample, the cost effectiveness of benchmarking has to be considered in addition to the learning effect. Itseems to me that we cannot help but give weight to this criterion if we agree that benchmarking activitiesshould cover as many comparable institutions or services as possible, and if we further agree thatbenchmarking activities should be institutionalised and repeated on a regular basis.
The introduction of a cost-effectiveness criterion leads to a ranking of benchmarking approachesthat differs sharply from the ranking achieved when learning capacity is the leading criterion. Forexample, as the UK paper observes quite correctly, a process-oriented benchmarking approach that digsinto a potentially voluminous store of data in order to analyse the causes of differences in results is labourintensive and costly. Furthermore, this approach can be used in only a relatively small proportion of thetotal activities of an organisation, because under this approach only activities and services of the same kindcan be compared. Although there may be a high learning capacity attached to this type of benchmarking,it scores badly with respect to cost-effectiveness.
On the other hand, collecting comparative results-oriented data without process-oriented datascores badly in terms of the learning effect, as discussed earlier, but scores very highly with respect to costeffectiveness. This is because it can -- within certain limits -- be easily routinised and made compulsory,as has been demonstrated in the case of benchmarking of local authorities by the UK Audit Commission.
If we try to take both criteria in consideration, the evaluation of current benchmarkingapproaches runs into a problem of conflicting goals. However, in order to attain satisfactory results frombenchmarking, the question of possibilities for reconciling the conflicting goals has to be addressed.
In my opinion, the first answer to this question may be that some very elementary infrastructurepreconditions for benchmarking should be guaranteed in the public sector. Stated more concretely, thereshould be an institutionalised practice to select and operate performance indicators that concentrates onresults. These indicators should be agreed upon across the public sector, as far as is possible. On the basisof a continuous stream of information gained by the indicators, various supplementary activities could bedeveloped. A growing number of indicators could be used as a basis for formulating normative servicestandards. Likewise, various groups, or "rings", of benchmarking partners could be established to useinformation on performance levels as a starting point for making improvements and benefiting from thelessons offered by the "best-in-class" examples. The results of such projects could also be published andused by others outside the group. I should like to mention briefly that in Germany we are proceeding quitewell on this track. Stated with some optimism, we are approaching a common catalogue of performanceindicators that can be used by most local governments. Furthermore, a growing number of benchmarkinggroups made up of similar organisations have been developing. They proceed from the comparison and

43
critical discussion of results-oriented data on the identification, analysis, and adoption of best-in-class (orbest-in-group) practices.
The motivational power and learning capacity offered by benchmarking could be increased byusing best-in-class performance management practices as a basis for formulating operational standards thatcan be used by all organisations as benchmarks for self-assessment and improvements. In this context,award competitions that follow the total quality management (TQM) principles can be very helpful asreinforcers of learning-oriented attitudes. In Germany, we have created the Speyer Quality Award for thepublic sector, that ran successfully in 1992 and in 1994, and that now (in its third round) is also availablefor Austrian and Swiss candidates. Award competitions mainly score very high in terms of learningcapacity, but there are problems concerning cost-effectiveness. In this regard, the main problem may bethe rather limited number of public organisations willing to take the risk of coming forward as candidates.However, the impact of this problems can be reduced by organising reward competitions as "bench-learning" events, and by providing for a "medium probability" for all candidates to be among the winners.
I would like to end by mentioning that we ourselves are not close friends of the ISO-certificateprogramme. Its seems to us in Germany that this certificate is too much oriented toward formalisation anddocumentation, and too little oriented toward the promotion of learning and innovation. As a result, itsrespective capacity and effect for improving performance management is rather low.