Internal Audit Progress Report (October 2020) West Sussex ...

PERFORMANCE AUDIT ____________
West Perry School District
Perry County, Pennsylvania ____________
April 2021

Mr. David M. Zula, Superintendent West Perry School District 2606 Shermans Valley Road Elliottsburg, Pennsylvania 17024
Mrs. Crystal Summers, Board President West Perry School District 2606 Shermans Valley Road Elliottsburg, Pennsylvania 17024
Dear Mr. Zula and Mrs. Summers:
We have conducted a performance audit of the West Perry School District (District) for the period July 1, 2015 through June 30, 2019, except as otherwise indicated in the audit scope, objective, and methodology section of the report. We evaluated the District’s performance in the following areas as further described in Appendix A of this report:
• Transportation Operations • Nonresident Student Data • Bus Driver Requirements • Administrator Separations • Contracting
We also evaluated the application of best practices and determined the District’s compliance with fire and
security drill requirements in the area of school safety. Due to the sensitive nature of school safety and the need for the results of this review to be confidential, we did not include the full results in this report. However, we communicated the full results of our review of school safety to District officials, the Pennsylvania Department of Education, and other appropriate officials as deemed necessary.
The audit was conducted pursuant to Sections 402 and 403 of The Fiscal Code (72 P.S. §§ 402 and 403),
and in accordance with the Government Auditing Standards issued by the Comptroller General of the United States. Those standards require that we plan and perform the audit to obtain sufficient, appropriate evidence to provide a reasonable basis for our findings and conclusions based on our audit objectives. We believe that the evidence obtained provides a reasonable basis for our findings and conclusions based on our audit objectives.
Our audit identified areas of noncompliance and significant internal control deficiencies in the areas of transportation operations and nonresident student data. Those deficiencies are detailed in the two findings in the report. A summary of the results is presented in the Executive Summary section of this report.

Mr. David M. Zula Mrs. Crystal Summers Page 2
In addition, we identified internal control deficiencies in the area of bus driver requirements that were not significant to the objective, but warranted the attention of District management and those charged with governance. This deficiency was verbally communicated to District management and those charged with governance for their consideration. Finally, we found that the District performed adequately in the areas of administrator separations and contracting.
Our audit findings and recommendations have been discussed with the District’s management, and their
responses are included in the audit report. We believe the implementation of our recommendations will improve the District’s operations and facilitate compliance with legal and other relevant requirements. We appreciate the District’s cooperation during the course of the audit. Sincerely,
Timothy L. DeFoor April 20, 2021 Auditor General cc: WEST PERRY SCHOOL DISTRICT Board of School Directors

Table of Contents Page Executive Summary ............................................................................................................................................ 1 Background Information ..................................................................................................................................... 2 Findings ............................................................................................................................................................... 7
Finding No. 1 – The District’s Failure to Implement an Adequate Internal Control System Resulted in a Transportation Reimbursement Net Underpayment of $533,441 to the District ................................................................................................................ 7
Finding No. 2 – The District Failed to Implement Adequate Internal Controls Over the
Nonresident Student Data Reported to the Pennsylvania Department of Education ..................................................................................................................... 13
Status of Prior Audit Findings and Observations ............................................................................................... 16 Appendix A: Audit Scope, Objectives, and Methodology ................................................................................. 17 Appendix B: Academic Detail ............................................................................................................................ 23 Distribution List .................................................................................................................................................. 27

West Perry School District Performance Audit
1
Executive Summary
Audit Work The Pennsylvania Department of the Auditor General conducted a performance audit of the West Perry School District (District). Our audit sought to answer certain questions regarding the District’s application of best practices and compliance with certain relevant state laws, regulations, contracts, and administrative procedures. Our audit scope covered the period July 1, 2015 through June 30, 2019, except as otherwise indicated in the audit scope, objectives, and methodology section of the report (see Appendix A). Compliance specific to state subsidies and reimbursements was determined for the 2015-16 through 2018-19 school years.
Audit Conclusion and Results
Our audit found that the District applied best practices and complied, in all significant respects, with certain relevant state laws, regulations, contracts, and administrative procedures, except for the two findings detailed in this report and summarized below. Finding No. 1: The District’s Failure to Implement an Adequate Internal Control System Resulted in a Transportation Reimbursement Net Underpayment of $533,441 to the District. We found that the District did not implement an adequate internal control system over the input, categorization, calculating, and reporting of regular and supplemental transportation data. The failure to implement internal controls led to multiple inaccuracies in the transportation data reported to the Pennsylvania Department of Education (PDE). Consequently, the District missed out on $535,751 in regular transportation reimbursements for the 2015-16 through 2018-19 school years. Additionally, the supplemental transportation data reporting errors we identified resulted in a $2,310
overpayment to the District. The net effect of these reporting errors was a $533,441 underpayment for the District. (See page 7). Finding No. 2: The District Failed to Implement Adequate Internal Controls Over the Nonresident Student Data Reported to the Pennsylvania Department of Education. We found that the District failed to implement adequate internal controls over the categorization, input, and reporting of nonresident student data to PDE. Specifically, the District did not implement any form of oversight of this process and instead it relied on just one employee to perform all aspects of the nonresident student reporting. The lack of oversight could lead to errors that significantly impact the District’s reimbursement from PDE. In fact, our review found a reporting error in the 2018-19 school year data that resulted in a $688 overpayment to the District. (See page 13). Status of Prior Audit Findings and Observations. There were no findings or observations in our prior audit report.
West Perry School District Performance Audit 2
Background Information
School Characteristics 2020-21 School Year*
County Perry Total Square Miles 325 Number of School
Buildings 5
Total Teachers 164 Total Full or Part-Time
Support Staff 110
Total Administrators 12 Total Enrollment for
Most Recent School Year 2,356
Intermediate Unit Number 15
District Career and Technical School
Cumberland-Perry Area Vocational
Technical School
* - Source: Information provided by the District administration and is unaudited.
Mission Statement*
To build tomorrow’s future, the West Perry School District prepares, inspires, and empowers... every student, every day.
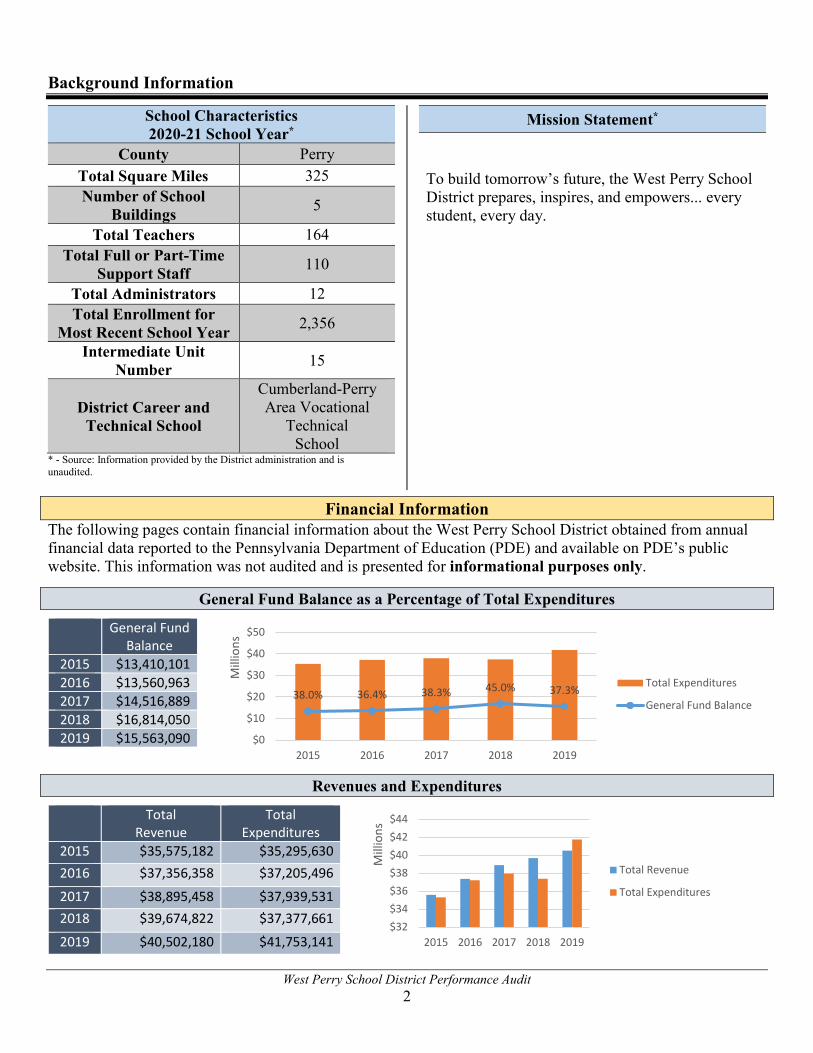
Financial Information The following pages contain financial information about the West Perry School District obtained from annual financial data reported to the Pennsylvania Department of Education (PDE) and available on PDE’s public website. This information was not audited and is presented for informational purposes only.
General Fund Balance as a Percentage of Total Expenditures
Revenues and Expenditures
38.0% 36.4% 38.3% 45.0% 37.3%
$0
$10
$20
$30
$40
$50
2015 2016 2017 2018 2019
Mill
ions
Total Expenditures
General Fund Balance
$32$34$36$38$40$42$44
2015 2016 2017 2018 2019
Mill
ions
Total Revenue
Total Expenditures
General Fund Balance
2015 $13,410,101 2016 $13,560,963 2017 $14,516,889 2018 $16,814,050 2019 $15,563,090
Total Revenue
Total Expenditures
2015 $35,575,182 $35,295,630 2016 $37,356,358 $37,205,496
2017 $38,895,458 $37,939,531 2018 $39,674,822 $37,377,661
2019 $40,502,180 $41,753,141
West Perry School District Performance Audit 3
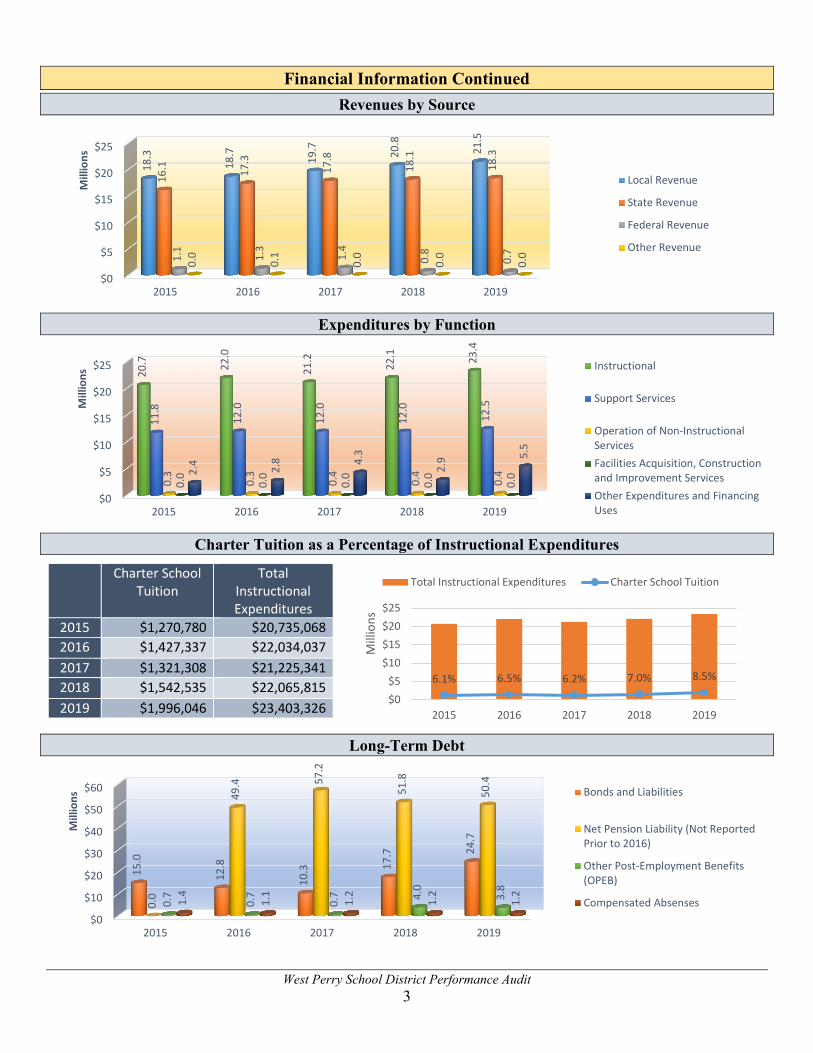
Financial Information Continued
Revenues by Source
Expenditures by Function
Charter Tuition as a Percentage of Instructional Expenditures
Long-Term Debt
$0
$5
$10
$15
$20
$25
2015 2016 2017 2018 2019
18.3
18.7 19.7 20
.8
21.5
16.1 17
.3
17.8
18.1
18.3
1.1
1.3
1.4
0.8
0.7
0.0
0.1
0.0
0.0
0.0
Mill
ions
Local Revenue
State Revenue
Federal Revenue
Other Revenue
$0
$5
$10
$15
$20
$25
2015 2016 2017 2018 2019
20.7 22
.0
21.2
22.1 23
.4
11.8
12.0
12.0
12.0
12.5
0.3
0.3
0.4
0.4
0.4
0.0
0.0
0.0
0.0
0.02.
4 2.8 4.
3
2.9 5.
5
Mill
ions
Instructional
Support Services
Operation of Non-InstructionalServicesFacilities Acquisition, Constructionand Improvement ServicesOther Expenditures and FinancingUses
6.1% 6.5% 6.2% 7.0% 8.5%
$0$5
$10$15$20$25
2015 2016 2017 2018 2019
Mill
ions
Total Instructional Expenditures Charter School Tuition
$0
$10
$20
$30
$40
$50
$60
2015 2016 2017 2018 2019
15.0
12.8
10.3 17
.7 24.7
0.0
49.4 57
.2
51.8
50.4
0.7
0.7
0.7 4.
0
3.8
1.4
1.1
1.2
1.2
1.2
Mill
ions Bonds and Liabilities
Net Pension Liability (Not ReportedPrior to 2016)
Other Post-Employment Benefits(OPEB)
Compensated Absenses
Charter School Tuition
Total Instructional Expenditures
2015 $1,270,780 $20,735,068 2016 $1,427,337 $22,034,037 2017 $1,321,308 $21,225,341 2018 $1,542,535 $22,065,815 2019 $1,996,046 $23,403,326
West Perry School District Performance Audit 4
Academic Information
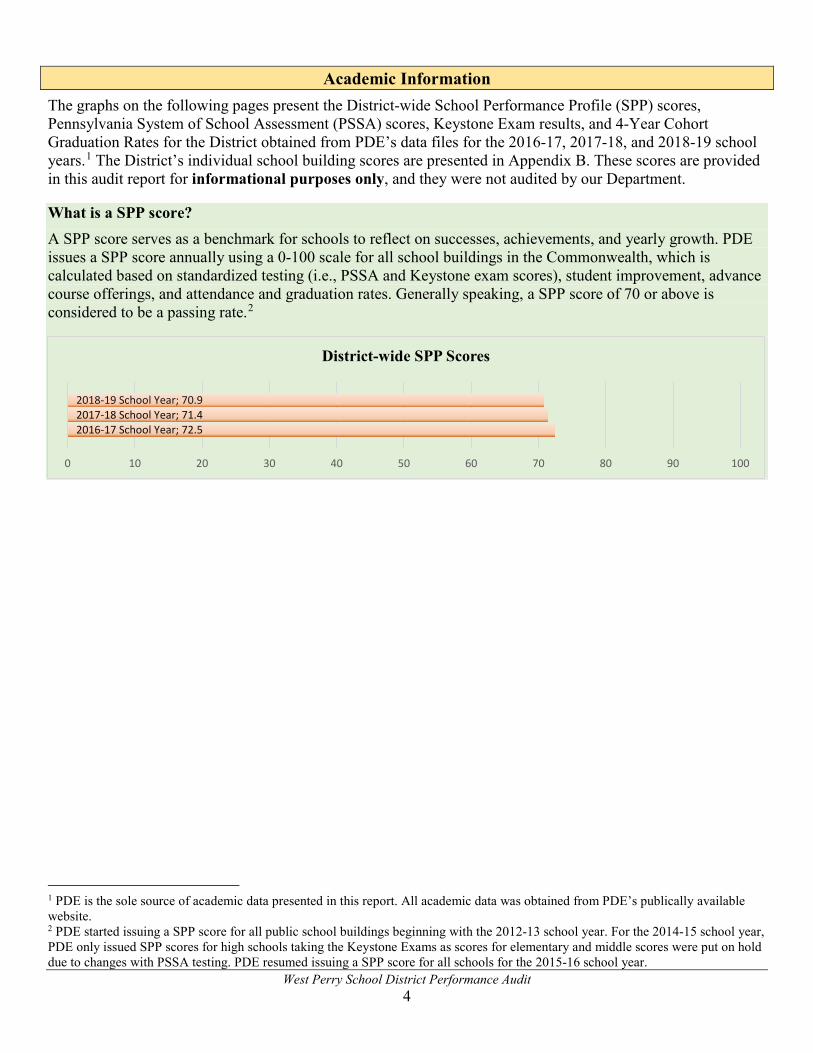
The graphs on the following pages present the District-wide School Performance Profile (SPP) scores, Pennsylvania System of School Assessment (PSSA) scores, Keystone Exam results, and 4-Year Cohort Graduation Rates for the District obtained from PDE’s data files for the 2016-17, 2017-18, and 2018-19 school years.1 The District’s individual school building scores are presented in Appendix B. These scores are provided in this audit report for informational purposes only, and they were not audited by our Department. What is a SPP score? A SPP score serves as a benchmark for schools to reflect on successes, achievements, and yearly growth. PDE issues a SPP score annually using a 0-100 scale for all school buildings in the Commonwealth, which is calculated based on standardized testing (i.e., PSSA and Keystone exam scores), student improvement, advance course offerings, and attendance and graduation rates. Generally speaking, a SPP score of 70 or above is considered to be a passing rate.2
1 PDE is the sole source of academic data presented in this report. All academic data was obtained from PDE’s publically available website. 2 PDE started issuing a SPP score for all public school buildings beginning with the 2012-13 school year. For the 2014-15 school year, PDE only issued SPP scores for high schools taking the Keystone Exams as scores for elementary and middle scores were put on hold due to changes with PSSA testing. PDE resumed issuing a SPP score for all schools for the 2015-16 school year.
2016-17 School Year; 72.52017-18 School Year; 71.42018-19 School Year; 70.9
0 10 20 30 40 50 60 70 80 90 100
District-wide SPP Scores

West Perry School District Performance Audit 5
Academic Information Continued
What is the PSSA? The PSSA is an annual, standardized test given across the Commonwealth to students in grades 3 through 8 in core subject areas, including English, Math and Science. The PSSAs help Pennsylvania meet federal and state requirements and inform instructional practices, as well as provide educators, stakeholders, and policymakers with important information about the state’s students and schools. The 2014-15 school year marked the first year that PSSA testing was aligned to the more rigorous PA Core Standards. The state uses a grading system with scoring ranges that place an individual student’s performance into one of four performance levels: Below Basic, Basic, Proficient, and Advanced. The state’s goal is for students to score Proficient or Advanced on the exam in each subject area.
What is the Keystone Exam? The Keystone Exam measures student proficiency at the end of specific courses, such as Algebra I, Literature, and Biology. The Keystone Exam was intended to be a graduation requirement starting with the class of 2017, but that requirement has been put on hold until the 2020-21 school year.3 In the meantime, the exam is still given as a standardized assessment and results are included in the calculation of SPP scores. The Keystone Exam is scored using the same four performance levels as the PSSAs, and the goal is to score Proficient or Advanced for each course requiring the test.
3 Act 158 of 2018, effective October 24, 2018, amended the Public School Code to further delay the use of Keystone Exams as a graduation requirement until the 2021-22 school year. See 24 P.S. § 1-121(b)(1). Please refer to the following link regarding further guidance to local education agencies (LEAs) on Keystone end-of-course exams (Keystone Exams) in the context of the pandemic of 2020: https://www.education.pa.gov/Schools/safeschools/emergencyplanning/COVID-19/Pages/Keystone-Exams.aspx
2016-17 School Year; 78.9
2016-17 School Year; 40.0
2016-17 School Year; 61.3
2017-18 School Year; 72.0
2017-18 School Year; 44.2
2017-18 School Year; 60.2
2018-19 School Year; 81.3
2018-19 School Year; 44.1
2018-19 School Year; 58.5
0 10 20 30 40 50 60 70 80 90 100
Science
Math
English
District-wide Percent of Students Scoring Proficient or Advanced on PSSA
2016-17 School Year; 66.7
2016-17 School Year; 67.1
2016-17 School Year; 76.7
2017-18 School Year; 80.1
2017-18 School Year; 73.2
2017-18 School Year; 77.3
2018-19 School Year; 70.3
2018-19 School Year; 54.8
2018-19 School Year; 66.7
0 10 20 30 40 50 60 70 80 90 100
Science
Math
English
District-wide Percent of Students Scoring Proficient or Advanced on Keystone Exams

West Perry School District Performance Audit 6
Academic Information Continued
What is a 4-Year Cohort Graduation Rate? PDE collects enrollment and graduate data for all Pennsylvania public schools, which is used to calculate graduation rates. Cohort graduation rates are a calculation of the percentage of students who have graduated with a regular high school diploma within a designated number of years since the student first entered high school. The rate is determined for a cohort of students who have all entered high school for the first time during the same school year. Data specific to the 4-year cohort graduation rate is presented in the graph below.4
4 PDE also calculates 5-year and 6-year cohort graduation rates. Please visit PDE’s website for additional information: http://www.education.pa.gov/Data-and-Statistics/Pages/Cohort-Graduation-Rate-.aspx.
93.4
87.0 91
.2
89.6
89.4
89.5
0
10
20
30
40
50
60
70
80
90
100
2018-19 2017-18 2016-17
District Graduation Rate Statewide Average

West Perry School District Performance Audit 7
Findings Finding No. 1 The District’s Failure to Implement an Adequate Internal
Control System Resulted in a Transportation Reimbursement Net Underpayment of $533,441 to the District We found that the West Perry School District (District) did not implement an adequate internal control system over the input, categorization, calculation, and reporting of regular and supplemental transportation data. The failure to implement internal controls led to multiple inaccuracies in the transportation data reported to the Pennsylvania Department of Education (PDE). Consequently, the District missed out on $535,751 in regular transportation reimbursements for the 2015-16 through 2018-19 school years. Additionally, the supplemental transportation data reporting errors we identified resulted in a $2,310 overpayment to the District. The net effect of these reporting errors was a $533,441 underpayment for the District.
Background: School districts receive two separate transportation reimbursement payments from PDE. The regular transportation reimbursement is broadly based on the number of students transported, the number of days each vehicle was used for transporting students, and the number of miles that vehicles are in service, both with and without students. The supplemental transportation reimbursement is based on the number of nonpublic school and charter school students transported. The errors identified in this finding pertain to both the District’s regular and supplemental transportation reimbursements.
Since the above listed components are integral to the calculation of the District’s transportation reimbursements, it is essential that the District properly record, calculate, categorize, and report transportation data to PDE. Therefore, the District should have a strong system of internal control over transportation operations that should include, but not be limited to, the following:
• Segregation of duties • Comprehensive written procedures • Training on PDE reporting requirements
It is also important to note that the Public School Code (PSC) requires that all school districts annually file a sworn statement of student transportation data for the prior and current school years with PDE in order to be eligible for transportation reimbursements.5 The sworn
5 See 24 P.S. § 25-2543.
Criteria relevant to the finding: Student Transportation Subsidy Section 2541(a) of the Public School Code (PSC) states, in part: “School districts shall be paid by the commonwealth for every school year on account of pupil transportation which… have been approved by the Department of Education… an amount to be determined by multiplying the cost of approved reimbursable pupils transportation incurred by the district by the district’s aid ratio. In determining the formula for the cost of approved reimbursable transportation, the Secretary of Education may prescribe the methods of determining approved mileages and the utilized passenger capacity of vehicles for reimbursement purposes…” See 24 P.S. § 25-2541(a).

West Perry School District Performance Audit 8
statement includes the superintendent’s signature attesting to the accuracy of the reported data. Because of this statutorily required attestation, the District should ensure it has implemented an adequate internal control system to provide it with the confidence it needs to sign the sworn statement. Regular Transportation Reporting Errors PDE guidelines state that school districts are required to report the number of miles per day to the nearest tenth that each vehicle travels with and without students. Districts are also required to report the number of students assigned to each vehicle. If the miles traveled and/or students assigned changes during the school year, an average must be calculated and reported. In addition, districts are required to report the number of days each vehicle transported students and the District’s costs when it contracts with a vendor to provide transportation services. These transportation data elements are some of the elements that are annually required to be reported to PDE and are data inputs in a PSC determined “formula” that calculates the District’s regular transportation reimbursement amount.
We found that during the audit period the District relied on just one employee to obtain, calculate, and report these transportation data elements. We found multiple reporting errors during the four-year audit period; however, the primary errors that led to the underpayment of regular transportation reimbursement were the District’s failure to report the following:
• Miles traveled, days in operation, and number of students transported
for one vehicle during the 2018-19 school year. • Miles traveled to transport students to vocational education
programs. • Transportation costs, totaling $255,668, incurred for one vendor
during the 2018-19 school year.
We also found that the employee responsible for reporting transportation data to PDE made numerous clerical errors that resulted in inaccuracies in the number of miles traveled, students transported, and vehicle days in operation reported to PDE. All of these errors were secondary factors in the large underpayment to the District.
Our review of the District’s supporting documentation disclosed that the data the District reported to PDE for 79 of 277 vehicles was inaccurate. We summarized the errors for all four years of the audit period and calculated the total amount of reimbursements that the District did not receive because of its errors.
Criteria relevant to the finding (continued): Sworn Statement and Annual Filing Requirements Section 2543 of the PSC, which is entitled, “Sworn statement of amount expended for reimbursable transportation; payment; withholding” of the PSC states, in part: “Annually, each school district entitled to reimbursement on account of pupil transportation shall provide in a format prescribed by the Secretary of Education, data pertaining to pupil transportation for the prior and current school year. . . . The Pennsylvania Department of Education (PDE) may, for cause specified by it, withhold such reimbursement, in any given case, permanently, or until the school district has complied with the law or regulations of the State Board of Education.” (Emphases added.) See 24 P.S. § 25-2543. Total Students Transported Section 2541(a) of the PSC states, in part: “School districts shall be paid by the commonwealth for every school year on account of pupil transportation which, and the means and contracts providing for which, have been approved by the Department of Education, in the cases hereinafter enumerated, an amount to be determined by multiplying the cost of approved reimbursable pupils transportation incurred by the district by the district’s aid ratio. In determining the formula for the cost of approved reimbursable transportation, the Secretary of Education may prescribe the methods of determining approved mileages and the utilized passenger capacity of vehicles for reimbursement purposes.” See 24 P.S. § 25-2541(a).
West Perry School District Performance Audit 9
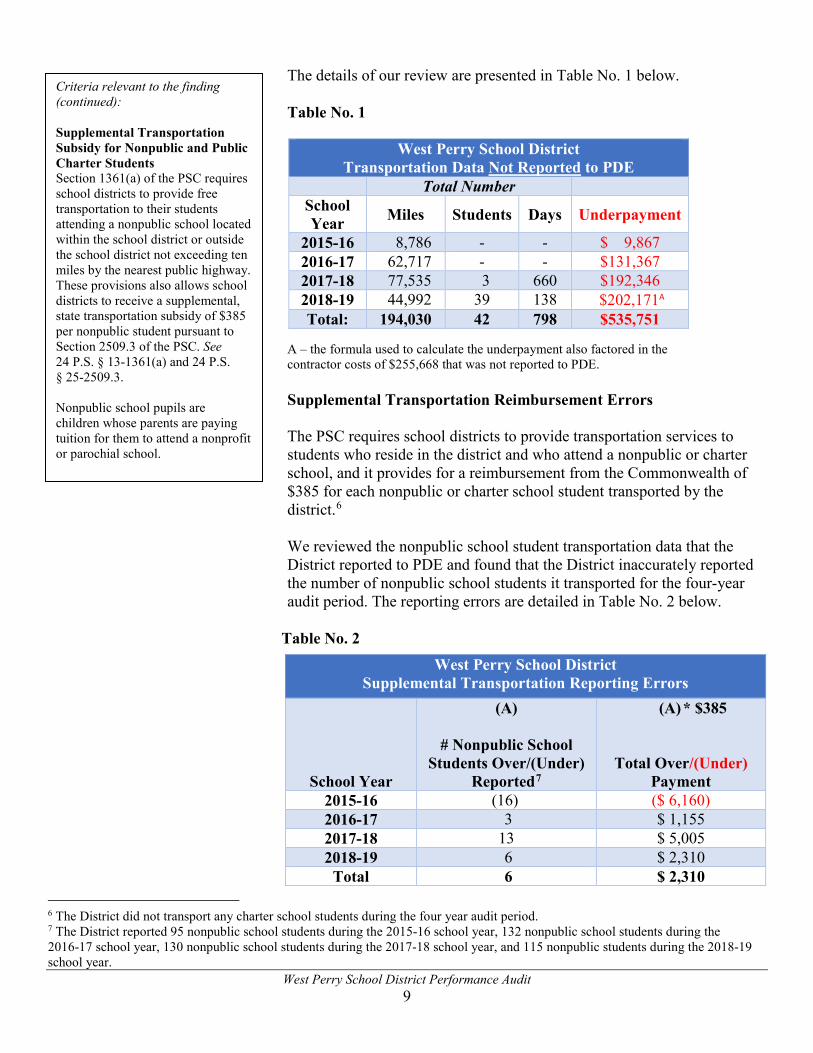
The details of our review are presented in Table No. 1 below. Table No. 1
A – the formula used to calculate the underpayment also factored in the contractor costs of $255,668 that was not reported to PDE. Supplemental Transportation Reimbursement Errors The PSC requires school districts to provide transportation services to students who reside in the district and who attend a nonpublic or charter school, and it provides for a reimbursement from the Commonwealth of $385 for each nonpublic or charter school student transported by the district.6
We reviewed the nonpublic school student transportation data that the District reported to PDE and found that the District inaccurately reported the number of nonpublic school students it transported for the four-year audit period. The reporting errors are detailed in Table No. 2 below.
Table No. 2
6 The District did not transport any charter school students during the four year audit period. 7 The District reported 95 nonpublic school students during the 2015-16 school year, 132 nonpublic school students during the 2016-17 school year, 130 nonpublic school students during the 2017-18 school year, and 115 nonpublic students during the 2018-19 school year.
West Perry School District Transportation Data Not Reported to PDE
Total Number School Year Miles Students Days Underpayment
2015-16 8,786 - - $ 9,867 2016-17 62,717 - - $131,367 2017-18 77,535 3 660 $192,346 2018-19 44,992 39 138 $202,171A Total: 194,030 42 798 $535,751
West Perry School District Supplemental Transportation Reporting Errors
School Year
(A)
# Nonpublic School Students Over/(Under)
Reported7
(A) * $385
Total Over/(Under)
Payment 2015-16 (16) ($ 6,160) 2016-17 3 $ 1,155 2017-18 13 $ 5,005 2018-19 6 $ 2,310
Total 6 $ 2,310
Criteria relevant to the finding (continued): Supplemental Transportation Subsidy for Nonpublic and Public Charter Students Section 1361(a) of the PSC requires school districts to provide free transportation to their students attending a nonpublic school located within the school district or outside the school district not exceeding ten miles by the nearest public highway. These provisions also allows school districts to receive a supplemental, state transportation subsidy of $385 per nonpublic student pursuant to Section 2509.3 of the PSC. See 24 P.S. § 13-1361(a) and 24 P.S. § 25-2509.3. Nonpublic school pupils are children whose parents are paying tuition for them to attend a nonprofit or parochial school.

West Perry School District Performance Audit 10
Every school year, the District should obtain a written request to transport each nonpublic school student from the parent/guardian. The District must maintain this documentation as support for the number of students it reports to PDE for the supplemental reimbursement calculation. The District was able to provide documentation for 16 students that the District did not report for the 2015-16 school year; however, during the other three years of the audit period the District did not have the documentation to support all of the nonpublic school students reported. The net effect of these reporting errors was that the District received a $2,310 overpayment. Significant Internal Control Deficiencies Our review revealed that the District did not have an adequate internal control system over its regular and supplemental transportation operations. Specifically, we found that the District did not implement adequate segregation of duties when it placed responsibility on only one employee for obtaining the miles, students, and days traveled data; calculating the averages; and reporting regular and supplemental transportation data to PDE. Furthermore, this employee had other job duties and responsibilities for the District unrelated to transportation operations and he did not receive adequate training on the PDE reporting requirements. In addition, we found that the District did not do the following:
• Ensure that an employee other than the employee responsible for
reporting transportation data to PDE reviewed the data before it was submitted to PDE.
• Ensure that each nonpublic school student reported to PDE had an individual request for transportation on file for each school year.
• Reconcile the annual transportation vendor payments to amounts reported to PDE.
• Develop comprehensive written procedures for accurately reporting transportation data to PDE, including all vehicle data and the number of nonpublic school students transported.
All of the above internal control deficiencies led to the errors we found and resulted in the District’s transportation reimbursements being more than $533,000 less than it was eligible to receive during the four-year audit period. The monetary effect of the errors we identified highlight the need for strong internal controls over the transportation data reporting system. Future Reimbursement Adjustment: We provided PDE with reports detailing the reporting errors related to the regular and supplemental transportation reimbursements for the 2015-16 through 2018-19 school
Criteria relevant to the finding (continued): PDE instructions for Local Education Agencies (LEA) on how to complete the PDE-1049. The PDE-1049 is the electronic form used by LEAs to submit transportation data annually to PDE. http://www.education.pa.gov/Documents/Teachers-Administrators/Pupil%20Transportation/eTran%20Application%20Instructions/PupilTransp%20Instructions%20PDE%201049.pdf (accessed 4/16/20) Pupils Assigned – Report the greatest number of pupils assigned to ride this vehicle at any one time during the day. Report the number of pupils assigned to the nearest tenth. The number cannot exceed the seating capacity. If the number of pupils assigned changed during the year, calculate a weighted average or a sample average. Daily Miles With Report the number of miles per day, to the nearest tenth, that the vehicle traveled with pupils. If this figure changed during the year, calculate a weighted average or sample average. Daily Miles Without Report the number of miles per day, to the nearest tenth, that the vehicle traveled without pupils. If this figure changed during the year, calculate a weighted average or sample average.
West Perry School District Performance Audit 11
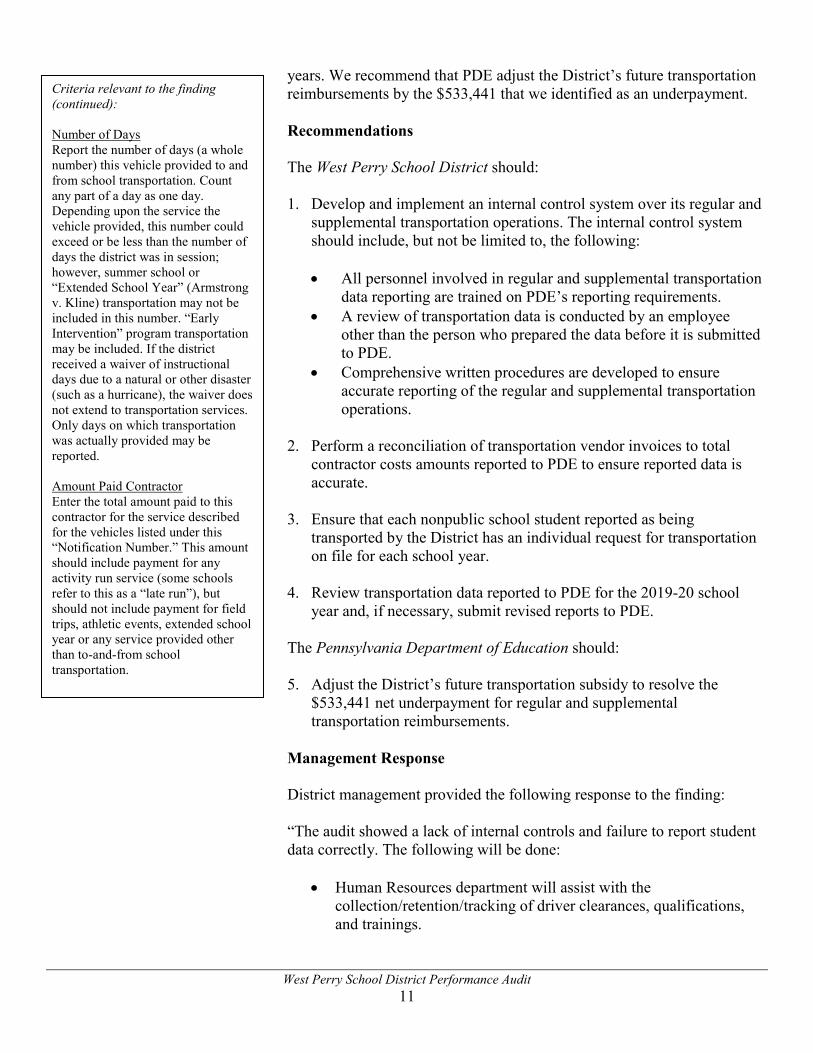
years. We recommend that PDE adjust the District’s future transportation reimbursements by the $533,441 that we identified as an underpayment.
Recommendations The West Perry School District should: 1. Develop and implement an internal control system over its regular and
supplemental transportation operations. The internal control system should include, but not be limited to, the following:
• All personnel involved in regular and supplemental transportation
data reporting are trained on PDE’s reporting requirements. • A review of transportation data is conducted by an employee
other than the person who prepared the data before it is submitted to PDE.
• Comprehensive written procedures are developed to ensure accurate reporting of the regular and supplemental transportation operations.
2. Perform a reconciliation of transportation vendor invoices to total
contractor costs amounts reported to PDE to ensure reported data is accurate.
3. Ensure that each nonpublic school student reported as being
transported by the District has an individual request for transportation on file for each school year.
4. Review transportation data reported to PDE for the 2019-20 school
year and, if necessary, submit revised reports to PDE.
The Pennsylvania Department of Education should:
5. Adjust the District’s future transportation subsidy to resolve the $533,441 net underpayment for regular and supplemental transportation reimbursements.
Management Response District management provided the following response to the finding: “The audit showed a lack of internal controls and failure to report student data correctly. The following will be done:
• Human Resources department will assist with the collection/retention/tracking of driver clearances, qualifications, and trainings.
Criteria relevant to the finding (continued): Number of Days Report the number of days (a whole number) this vehicle provided to and from school transportation. Count any part of a day as one day. Depending upon the service the vehicle provided, this number could exceed or be less than the number of days the district was in session; however, summer school or “Extended School Year” (Armstrong v. Kline) transportation may not be included in this number. “Early Intervention” program transportation may be included. If the district received a waiver of instructional days due to a natural or other disaster (such as a hurricane), the waiver does not extend to transportation services. Only days on which transportation was actually provided may be reported. Amount Paid Contractor Enter the total amount paid to this contractor for the service described for the vehicles listed under this “Notification Number.” This amount should include payment for any activity run service (some schools refer to this as a “late run”), but should not include payment for field trips, athletic events, extended school year or any service provided other than to-and-from school transportation.

West Perry School District Performance Audit 12
• Transportation Supervisor will work in collaboration with the business manager to review bus/van mileages, days of operation, pupil counts and contractor costs prior to submittal of data to PDE. Transportation Supervisor and Business manager will perform a comprehensive review of the subsidy report to ensure accuracy and integrity of all the data submitted to PDE.
• The District will proactively seek opportunities that provide in-depth instruction and guidance on the transportation subsidy process.
• Transportation Supervisor will create a nonpublic transportation request form for parent/guardian to complete and return to transportation office for each school year. The returned requests for transportation shall be maintained on file for the appropriate retention period. A letter to all nonpublic schools advising them of the new process will be sent at the end of this school year.”
Auditor Conclusion We are pleased the District has identified appropriate corrective actions to be implemented. We reiterate our recommendation that the District develop written procedures for the transportation collection, calculation and reporting of vehicle data. Additionally, we continue to recommend that the District perform a reconciliation of invoices to contractor costs prior to reporting to PDE. We will evaluate the effectiveness of the District’s corrective actions during the next audit of the District.
West Perry School District Performance Audit 13
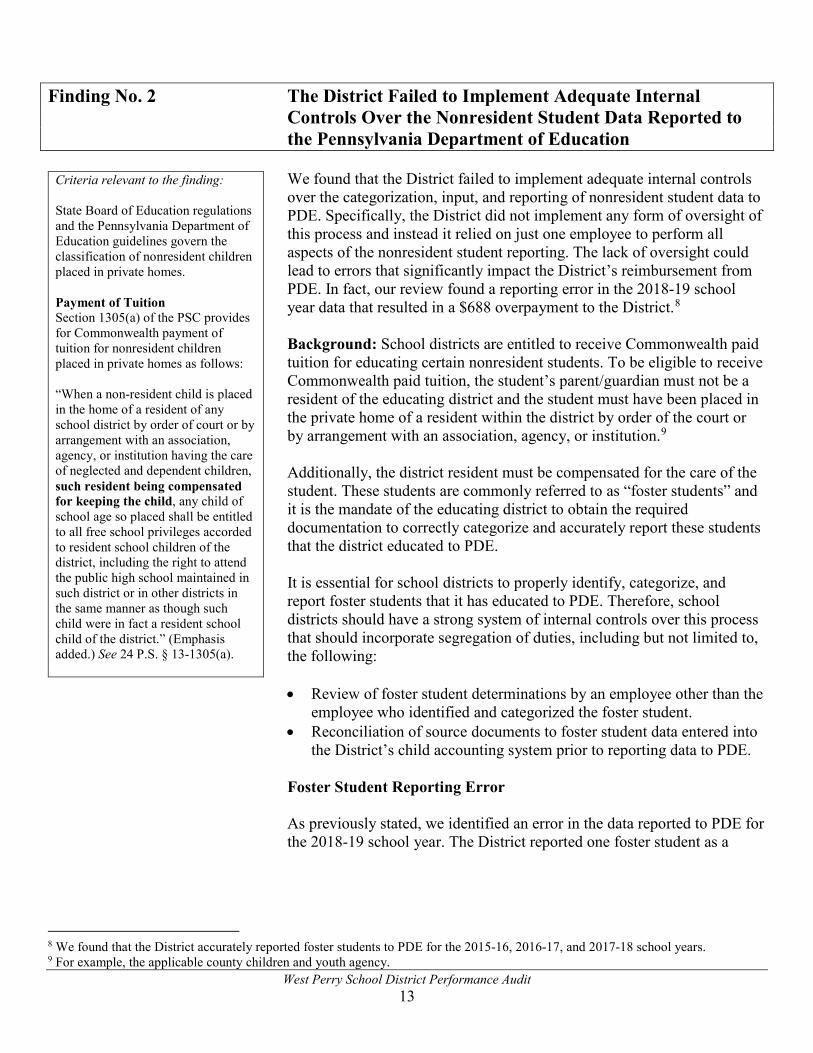
Finding No. 2 The District Failed to Implement Adequate Internal
Controls Over the Nonresident Student Data Reported to the Pennsylvania Department of Education We found that the District failed to implement adequate internal controls over the categorization, input, and reporting of nonresident student data to PDE. Specifically, the District did not implement any form of oversight of this process and instead it relied on just one employee to perform all aspects of the nonresident student reporting. The lack of oversight could lead to errors that significantly impact the District’s reimbursement from PDE. In fact, our review found a reporting error in the 2018-19 school year data that resulted in a $688 overpayment to the District.8 Background: School districts are entitled to receive Commonwealth paid tuition for educating certain nonresident students. To be eligible to receive Commonwealth paid tuition, the student’s parent/guardian must not be a resident of the educating district and the student must have been placed in the private home of a resident within the district by order of the court or by arrangement with an association, agency, or institution.9 Additionally, the district resident must be compensated for the care of the student. These students are commonly referred to as “foster students” and it is the mandate of the educating district to obtain the required documentation to correctly categorize and accurately report these students that the district educated to PDE. It is essential for school districts to properly identify, categorize, and report foster students that it has educated to PDE. Therefore, school districts should have a strong system of internal controls over this process that should incorporate segregation of duties, including but not limited to, the following:
• Review of foster student determinations by an employee other than the
employee who identified and categorized the foster student. • Reconciliation of source documents to foster student data entered into
the District’s child accounting system prior to reporting data to PDE. Foster Student Reporting Error As previously stated, we identified an error in the data reported to PDE for the 2018-19 school year. The District reported one foster student as a
8 We found that the District accurately reported foster students to PDE for the 2015-16, 2016-17, and 2017-18 school years. 9 For example, the applicable county children and youth agency.
Criteria relevant to the finding: State Board of Education regulations and the Pennsylvania Department of Education guidelines govern the classification of nonresident children placed in private homes. Payment of Tuition Section 1305(a) of the PSC provides for Commonwealth payment of tuition for nonresident children placed in private homes as follows: “When a non-resident child is placed in the home of a resident of any school district by order of court or by arrangement with an association, agency, or institution having the care of neglected and dependent children, such resident being compensated for keeping the child, any child of school age so placed shall be entitled to all free school privileges accorded to resident school children of the district, including the right to attend the public high school maintained in such district or in other districts in the same manner as though such child were in fact a resident school child of the district.” (Emphasis added.) See 24 P.S. § 13-1305(a).

West Perry School District Performance Audit 14
reimbursable student even though that student was educated by the intermediate unit and not by the District. Because the intermediate unit provided the students education, the District was not eligible to receive reimbursement from PDE for this foster student. When we brought this error to the District’s attention, the employee responsible for nonresident data indicated that the error was the result of an oversight. However, the error may have been detected if the District had better internal controls over this area. Significant Internal Control Deficiencies The District assigned the responsibility for multiple aspects of nonresident student data to only one employee. This employee was responsible for categorizing the types of nonresident students, completing the foster student data entry into the District’s child accounting software, and reporting the data to PDE. Each of these procedures were performed without any oversight or review by another District employee. A secondary review and a reconciliation of the foster student source documentation to the data entered into the District’s child accounting system would have most likely revealed the error previously noted and allowed time to correct it prior to the data being submitted to PDE. While our testing found only one error, we note the potential for more costly errors impacting the District nonresident reimbursements if the internal control deficiencies are not corrected. Implementing adequate segregation of duties that includes a review and reconciliation process will help ensure that the nonresident student data reported to PDE is accurate. Since PDE uses that data to calculate the reimbursements provided to the District, it is imperative that the data be reviewed for accuracy prior to reporting it to PDE. Future Reimbursement Adjustment: We provided PDE with a report detailing the reporting error we identified for the 2018-19 school year. We recommend that PDE adjust the District’s future subsidy reimbursement amount by the $688 that we calculated as an overpayment. Recommendations The West Perry School District should:
1. Develop and implement an internal control system governing the
process for categorizing, inputting, and reporting foster student data. The internal control system should include, but not be limited to, the review of all foster students by an official other than the employee who categorized each foster student and a reconciliation of the foster student data to source documents, before reporting to PDE.
Criteria relevant to the finding (continued): Section 2503(c) of the PSC specifies the amount of Commonwealth-paid tuition on behalf of nonresident children placed in private homes by providing, in part: “Each school district, regardless of classification, which accepts any non-resident child in its school under the provisions of section one thousand three hundred five… shall be paid by the Commonwealth an amount equal to the tuition charge per elementary pupil or the tuition charge per high school pupil, as the case may be….” (Emphasis added.) See 24 P.S. § 25-2503(c). (a) of Section 11.19 (relating to Nonresident child living with a district resident) of the State Board of Education’s regulations provides as follows, in part. “(a) A nonresident child is entitled to attend the district’s public schools if that child is fully maintained and supported in the home of a district resident as if the child were the residents own child and if the resident receives no personal compensation for maintaining the student in the district. Before accepting the child as a student, the board of school directors of the district shall require the resident to file with the secretary of the board of school directors either appropriate legal documentation to show dependency or guardianship or a sworn statement that the child is supported fully without personal compensation or gain, and that the resident will assume all personal obligations for the child relative to school requirements and intends to so keep and fully support the child continuously and not merely through the school term.” See 22 Pa. Code § 11.19(a).

West Perry School District Performance Audit 15
The Pennsylvania Department of Education should: 2. Adjust the District’s future reimbursements to resolve the overpayment
of $688. Management Response The District identified and provided documents for four procedures which it has implemented to improve internal controls over the collecting, inputting, reviewing and reporting of nonresident foster student membership data to PDE. According to District management, those procedures are as follows: “1. Creation of a new comprehensive 1305 Nonresident Foster form. 2. A detailed outline of responsibilities for 5 of the District’s employees
involved in the procedures for 1305 nonresident students. 3. Creation of a 15 step detailed review of your Power school data
quarterly and annually to ensure all data is correct before reporting. 4. Lastly, a detailed review process to be completed before Accuracy
certification is signed by the Superintendent with this review process signed off on and the date it was completed.”
Auditor Conclusion We are pleased the District agreed to implement our recommendations by developing operating procedures and a review process before reporting data to PDE. We will evaluate the effectiveness of its corrective actions during the next audit of the District.
West Perry School District Performance Audit 16
Status of Prior Audit Findings and Observations
ur prior audit of the West Perry School District resulted in no findings or observations.
O

Appendix A: Audit Scope, Objectives, and Methodology School performance audits allow the Pennsylvania Department of the Auditor General to determine whether state funds, including school subsidies, are being used according to the purposes and guidelines that govern the use of those funds. Additionally, our audits examine the appropriateness of certain administrative and operational practices at each local education agency (LEA). The results of these audits are shared with LEA management, the Governor, the Pennsylvania Department of Education (PDE), and other concerned entities. Our audit, conducted under authority of Sections 402 and 403 of The Fiscal Code,10 is not a substitute for the local annual financial audit required by the Public School Code of 1949, as amended. We conducted our audit in accordance with Government Auditing Standards issued by the Comptroller General of the United States. Those standards require that we plan and perform the audit to obtain sufficient, appropriate evidence to provide a reasonable basis for our findings and conclusions based on our audit objectives. We believe that the evidence obtained provides a reasonable basis for our findings and conclusions based on our audit. Our audit focused on the District’s effectiveness and/or compliance with applicable statutory provisions and related regulations in the areas of Transportation Operations, Nonresident Student Data, Bus Driver Requirements, Administrator Separations, Contracting, and School Safety, including fire and security drills. The audit objectives supporting these areas of focus are explained in the context of our methodology to achieve the objectives in the next section. Overall, our audit covered the period July 1, 2015 through June 30, 2019. The scope of each individual objective is also detailed in the next section. The District’s management is responsible for establishing and maintaining effective internal control to provide reasonable assurance that the District’s objectives will be achieved.11 Standards for Internal Control in the Federal Government (also known as and hereafter referred to as the Green Book), issued by the Comptroller General of the United States, provides a framework for management to establish and maintain an effective internal control system. The Department of the Auditor General used the Green Book as the internal control analysis framework during the conduct of our audit.12 The Green Book’s standards are organized into five components of internal control. In an effective system of internal control, these five components work together in an integrated manner to help an entity achieve its objectives. Each of the five components of internal control contains principles, which are the requirements an entity should follow in establishing an effective system of internal control. We illustrate the five components and their underlying principles in Figure 1 on the following page.
10 72 P.S. §§ 402 and 403. 11 District objectives can be broadly classified into one or more of the following areas: effectiveness of operations; reliability of reporting for internal and external use; and compliance with applicable laws and regulations, more specifically in the District, referring to certain relevant state laws, regulations, contracts, and administrative procedures. 12 Even though the Green Book was written for the federal government, it explicitly states that it may also be adopted by state, local, and quasi-government entities, as well as not-for-profit organizations, as a framework for establishing and maintaining an effective internal control system. The Green Book is assessable at https://www.gao.gov/products/GAO-14-704G

Figure 1: Green Book Hierarchical Framework of Internal Control Standards
Principle Description Control Environment
1 Demonstrate commitment to integrity and ethical values
2 Exercise oversight responsibility
3 Establish structure, responsibility, and authority
4 Demonstrate commitment to competence 5 Enforce accountability
Risk Assessment 6 Define objectives and risk tolerances 7 Identify, analyze, and respond to risks 8 Assess fraud risk 9 Identify, analyze, and respond to change
Principle Description Control Activities
10 Design control activities
11 Design activities for the information system
12 Implement control activities Information and Communication
13 Use quality information 14 Communicate internally 15 Communicate externally
Monitoring 16 Perform monitoring activities
17 Evaluate issues and remediate deficiencies
In compliance with generally accepted government auditing standards, we must determine whether internal control is significant to our audit objectives. We base our determination of significance on whether an entity’s internal control impacts our audit conclusion(s). If some, but not all, internal control components are significant to the audit objectives, we must identify those internal control components and underlying principles that are significant to the audit objectives. In planning our audit, we obtained a general understanding of the District’s control environment. In performing our audit, we obtained an understanding of the District’s internal control sufficient to identify and assess the internal control significant within the context of the audit objectives. Figure 2 represents a summary of the internal control components and underlying principles that we identified as significant to the overall control environment and the specific audit objectives (denoted by an “X”). Figure 2 – Internal Control Components and Principles Identified as Significant
Inte
rnal
Con
trol
Si
gnifi
cant
?
Con
trol
E
nvir
onm
ent
Ris
k A
sses
smen
t
Con
trol
A
ctiv
ities
Info
rmat
ion
and
Com
mun
icat
ion
Mon
itori
ng
Principle → 1 2 3 4 5 6 7 8 9 10 11 12 13 14 15 16 17 General/overall Yes X X X X X X X X X X X X X X X Transportation Yes X X X X X X X X X Nonresident Student Data Yes X X X X X X X X Bus Drivers Yes X X X X Administrator Separations No
Contracting No Safe Schools No

With respect to the principles identified, we evaluated the internal control(s) deemed significant within the context of our audit objectives and assessed those controls to the extent necessary to address our audit objectives. The results of our evaluation and assessment of the District’s internal control for each objective is discussed in the following section. Objectives/Scope/Methodology In order to properly plan our audit and to guide us in selecting objectives, we reviewed pertinent laws and regulations, the District’s annual financial reports, annual General Fund budgets, and the independent audit reports of the District’s basic financial statements for the July 1, 2015 through June 30, 2019 fiscal years. We conducted analytical procedures on the District’s state revenues and the transportation reimbursement data. We reviewed the prior audit report and we researched current events that possibly affected District operations. We also determined if the District had key personnel or software vendor changes since the prior audit. Performance audits draw conclusions based on an evaluation of sufficient, appropriate evidence. Evidence is measured against criteria, such as laws, regulations, third-party studies, and best business practices. Our audit focused on the District’s effectiveness in four areas as described below. As we conducted our audit procedures, we sought to determine answers to the following questions, which served as our audit objectives. Transportation Operations
Did the District ensure compliance with applicable laws and regulations governing transportation operations, and did the District receive the correct transportation reimbursement from the Commonwealth?13
To address this objective, we assessed the District’s internal controls for obtaining, processing,
and reporting transportation data to PDE. We selected 17 of the 68 vehicles used to transport students during the 2017-18 school year. We randomly selected 16 vehicles and 1 vehicle was selected due to a high risk of error.14 In addition, we randomly selected 7 of 70 vehicles used to transport District students during the 2018-19 school year. For the vehicles selected, we obtained odometer readings, student rosters, and school calendars to determine if the District accurately calculated and reported transportation data to PDE. Due to the type of errors found in our initial selection, we expanded our testing to include a review of all 286 vehicles used to transport District students during the 2015-16 through 2018-19 school years.15 For all vehicles, we verified that the District accurately calculated sample averages on the District’s average calculation worksheets and accurately reported this data to PDE. Additionally, we selected one of the District’s four contracted transportation providers for the 2018-19 school year and reviewed documentation to ensure that the District accurately reported to PDE the total transportation costs paid to this provider.16 This contractor was selected due to a high risk of errors after our review of the reimbursement the District received related to this contractor’s costs. We obtained the District’s year-to-date expenditure ledger and verified that
13 See 24 P.S. § 25-2541(a). 14 The one judgmentally selected vehicle had high risk of error due to fluctuations found when reviewing the District’s sample average calculations worksheet. 15 The District reported 75 vehicles as transporting students in 2015-16, 73 vehicles in 2016-17, 68 vehicles in 2017-18, and 70 vehicles in 2018-19 school years. 16 This vendor was selected because due to a higher risk of noncompliance; accordingly, the results of this audit procedure are not, and should not be, projected to the population.

expenses for this provider were accurately reported to PDE on the PDE Form 1049 Year End Transportation Report.
Finally, we assessed the District’s internal controls for inputting and processing nonpublic and charter school student data and reporting this data to PDE. We reviewed requests for transportation for all 472 nonpublic school students reported as transported by the District for the 2015-16 through 2018-19 school years. Conclusion: The results of our procedures identified areas of noncompliance and significant internal control deficiencies related to the input, calculation, and reporting of transportation data to PDE. Those results are detailed in Finding No. 1 beginning on page 7 of this report.
Nonresident Student Data
Did the District accurately report nonresident students to PDE? Did the District receive the correct reimbursement for these nonresident students?17 To address this objective, we assessed the District’s internal control for inputting, categorizing,
and reporting of nonresident foster students to PDE. We reviewed all 52 nonresident foster students reported to PDE as educated by the District during the 2015-16 through 2018-19 school years.18 We reviewed documentation to confirm that the custodial parents or guardian of the foster students were not residents of the District and confirmed that the foster parent received a stipend for caring for the student. We also determined if the District received the correct amount of reimbursement for the education of these students. Conclusion: The results of our procedures identified areas of noncompliance and significant internal control deficiencies related to the input, categorization and reporting of nonresident foster student data. Those results are detailed in Finding No. 2 beginning on page 13 of this report.
Bus Driver Requirements
Did the District ensure that all bus drivers transporting District students are board approved and had the required driver’s license, physical exam, training, background checks, and clearances19 as outlined in applicable laws?20 Also, did the District adequately monitor driver records to ensure compliance with the ongoing five-year clearance requirements and ensure it obtained updated licenses and health physical records as applicable throughout the school year?
To address this objective, we assessed the District’s internal controls for reviewing required
driver qualification documents and procedures for being made aware of who transported students daily. We determined if all drivers were approved by the District’s Board of School Directors. We randomly selected 49 of the 97 drivers transporting District students as of March 13, 2020,
17 See 24 P.S. §§ 13-1301, 13-1302, 13-1305, 13-1306; 22 Pa. Code Chapter 11. 18 22 nonresident foster students were reported in 2018-19, 17 nonresident foster students were reported in 2017-18, 9 nonresident foster students were reported in 2016-17, and 4 nonresident foster students were reported in the 2015-16 school years. 19 Auditors reviewed the required state, federal, and child abuse background clearances that the District obtained from the most reliable sources available, including the FBI, the Pennsylvania State Police, and the Department of Human Services. However, due to the sensitive and confidential nature of this information, we were unable to assess the reliability or completeness of these third-party databases. 20 PSC 24 P.S. § 1-111, CPSL 23 Pa.C.S. § 6344(a.1), PSC (Educator Discipline) 24 P.S. § 2070.1a et seq., State Vehicle Code 75 Pa.C.S. §§ 1508.1 and 1509, and State Board of Education’s regulations 22 Pa. Code Chapter 8.

and we reviewed documentation to ensure the District complied with the requirements for those drivers.21 We also determined if the District had monitoring procedures to ensure that all drivers had updated clearances, licenses, and physicals.
Conclusion: The results of our procedures did not identify any reportable issues; however, we did identify internal control deficiencies that were not significant to our objective but warranted the attention of District management and those charged with governance. These deficiencies were verbally communicated to District management and those charged with governance for their consideration.
Administrator Separations
Did the District ensure all individually contracted employees who separated from the District were compensated in accordance with their contract? Also, did the contracts comply with the Public School Code and were the final payments in accordance with the Public School Employees’ Retirement System (PSERS) guidelines? To address this objective, we reviewed the employment contracts, leave records, and payroll
records for the two individually contracted administrators who separated employment from the District during the period of July 1, 2015 through June 30, 2019. We reviewed the final payouts to determine if the administrators were compensated in accordance with their contracts. We verified the leave payouts were not reported as eligible wages to PSERS. We verified that the Board complied with Section 508 of the Public School Code by voting to approve each administrator’s separation from employment with the District. Conclusion: The results of our procedures did not identify any reportable issues.
Contracting
Did the District properly award its energy savings contract in compliance with Board policies and was this contract Board approved? To address this objective, we obtained and reviewed the pertinent board policies (Purchases
Subject to Bid Quotation), and we verified that the District issued a Request for Qualifications as required by board policies. We verified that the District advertised for proposals for this contract and that the contract was approved by the Board.
Conclusion: The results of our procedures for this objective did not disclose any reportable issues.
School Safety
Did the District comply with requirements in the Public School Code and the Emergency Management Code related to emergency management plans, bullying prevention, and memorandums of understanding with local law enforcement?22 Also, did the District follow best practices related to physical building security and providing a safe school environment?
21 While representative selection is a required factor of audit sampling methodologies, audit sampling methodology was not applied to achieve this test objective; accordingly, the results of this audit procedure are not, and should not be projected to the population. 22 Safe Schools Act 24 P.S. § 13-1301-A et seq., Emergency Management Services Code 35 Pa. C.S. § 7701.

To address this objective, we reviewed a variety of documentation including, safety plans, risk and vulnerability assessments, anti-bullying policies, memorandums of understanding with local law enforcement, and safety committee meeting minutes. Conclusion: Due to the sensitive nature of school safety, the results of our review for this portion of the objective are not described in our audit report, but they were shared with District officials, PDE’s Office of Safe Schools, and other appropriate law enforcement agencies deemed necessary.23
Did the District comply with the fire and security drill requirements of Section 1517 of the Public
School Code?24 Also, did the District accurately report the dates of drills to PDE and maintain supporting documentation to evidence the drills conducted and reported to PDE?
To address this objective, we obtained and reviewed the fire and security drill records for all five
of school buildings to determine whether drills were conducted as required for the 2018-19 school year. We determined if a security drill was held within the first 90 days of the school year for each building in the District and if monthly fire drills were conducted in accordance with requirements. We also obtained the Accuracy Certification Statement that the District filed with PDE and compared the dates reported to the supporting documentation. Conclusion: The results of our procedures for this portion of the school safety objective did not identify any reportable issues;
23 Other law enforcement agencies include the Pennsylvania State Police, the Attorney General’s Office, and local law enforcement with jurisdiction over the District’s school buildings. 24 Public School Code (Fire and Security Drills) 24 P.S. § 15-1517.

West Perry School District Performance Audit 23
Appendix B: Academic Detail Benchmarks noted in the following graphs represent the statewide average of all public school buildings in the Commonwealth that received a score in the category and year noted.25 Please note that if one of the District’s schools did not receive a score in a particular category and year presented below, the school will not be listed in the corresponding graph.26
SPP School Scores Compared to Statewide Averages
25 Statewide averages were calculated by our Department based on individual school building scores for all public schools in the Commonwealth, including district schools, charters schools, and cyber charter schools. 26 PDE’s data does not provide any further information regarding the reason a score was not published for a specific school. However, readers can refer to PDE’s website for general information regarding the issuance of academic scores.
West Perry Senior High School, 63.8West Perry Middle School, 69.8New Bloomfield Elementary School, 71.4Carroll Elementary School, 69.8Blain Elementary School, 79.5
0 10 20 30 40 50 60 70 80 90 100
2018-19
Statewide Average - 68.0
West Perry Senior High School, 72.1West Perry Middle School, 79.0New Bloomfield Elementary School, 72.9Carroll Elementary School, 56.0Blain Elementary School, 77.0
0 10 20 30 40 50 60 70 80 90 100
2017-18
Statewide Average - 68.2
West Perry Senior High School, 71.8West Perry Middle School, 72.4New Bloomfield Elementary School, 81.5Carroll Elementary School, 61.3Blain Elementary School, 75.3
0 10 20 30 40 50 60 70 80 90 100
2016-17
Statewide Average - 69.0

West Perry School District Performance Audit 24
PSSA Advanced or Proficient Percentage School Scores Compared to Statewide Averages
Blain Elementary School, 62.5
Blain Elementary School, 51.1
Blain Elementary School, 89.1
Carroll Elementary School, 50.3
Carroll Elementary School, 36.1
Carroll Elementary School, 81.8
New Bloomfield Elementary School, 57.2
New Bloomfield Elementary School, 52.4
New Bloomfield Elementary School, 88.4
West Perry Middle School, 64.1
West Perry Middle School, 36.6
West Perry Middle School, 65.8
0 10 20 30 40 50 60 70 80 90 100
English
Math
Science
2018-19
Statewide English Average - 61.3 Statewide Math Average - 44.5 Statewide Science Average - 71.1
Blain Elementary School, 64.6
Blain Elementary School, 50.3
Blain Elementary School, 82.4
Carroll Elementary School, 45.8
Carroll Elementary School, 30.5
Carroll Elementary School, 64.6
New Bloomfield Elementary School, 63.0
New Bloomfield Elementary School, 52.8
New Bloomfield Elementary School, 80.0
West Perry Middle School, 67.2
West Perry Middle School, 43.0
West Perry Middle School, 61.0
0 10 20 30 40 50 60 70 80 90 100
English
Math
Science
2017-18
Statewide English Average - 61.5 Statewide Math Average - 43.9 Statewide Science Average - 68.1

West Perry School District Performance Audit 25
PSSA Advanced or Proficient Percentage School Scores Compared to Statewide Averages (continued)
Blain Elementary School, 63.5
Blain Elementary School, 43.4
Blain Elementary School, 94.0
Carroll Elementary School, 51.0
Carroll Elementary School, 28.5
Carroll Elementary School, 72.2
New Bloomfield Elementary School, 66.3
New Bloomfield Elementary School, 53.5
New Bloomfield Elementary School, 87.9
West Perry Middle School, 64.4
West Perry Middle School, 34.8
West Perry Middle School, 61.3
0 10 20 30 40 50 60 70 80 90 100
English
Math
Science
2016-17
Statewide English Average - 61.5 Statewide Math Average - 44.6 Statewide Science Average - 67.0

West Perry School District Performance Audit 26
Keystone Advanced or Proficient Percentage School Scores Compared to Statewide Averages
West Perry Senior High School, 70.3
West Perry Senior High School, 54.8
West Perry Senior High School, 66.7
0 10 20 30 40 50 60 70 80 90 100
Science
Math
English
2018-19
Statewide English Average - 68.1 Statewide Math Average - 59.3 Statewide Science Average - 59.1
West Perry Senior High School, 80.1
West Perry Senior High School, 73.2
West Perry Senior High School, 77.3
0 10 20 30 40 50 60 70 80 90 100
Science
Math
English
2017-18
Statewide English Average - 69.4 Statewide Math Average - 61.2 Statewide Science Average - 59.9
West Perry Senior High School, 66.7
West Perry Senior High School, 67.1
West Perry Senior High School, 76.7
0 10 20 30 40 50 60 70 80 90 100
Science
Math
English
2016-17
Statewide English Average - 69.8 Statewide Math Average - 61.8 Statewide Science Average - 59.3

West Perry School District Performance Audit 27
Distribution List This report was initially distributed to the Superintendent of the District, the Board of School Directors, and the following stakeholders: The Honorable Tom W. Wolf Governor Commonwealth of Pennsylvania Harrisburg, PA 17120 The Honorable Noe Ortega Acting Secretary of Education 1010 Harristown Building #2 333 Market Street Harrisburg, PA 17126 The Honorable Stacy Garrity State Treasurer Room 129 - Finance Building Harrisburg, PA 17120 Mrs. Danielle Mariano Director Bureau of Budget and Fiscal Management Pennsylvania Department of Education 4th Floor, 333 Market Street Harrisburg, PA 17126 Dr. David Wazeter Research Manager Pennsylvania State Education Association 400 North Third Street - Box 1724 Harrisburg, PA 17105 Mr. Nathan Mains Executive Director Pennsylvania School Boards Association 400 Bent Creek Boulevard Mechanicsburg, PA 17050 This report is a matter of public record and is available online at www.PaAuditor.gov. Media questions about the report can be directed to the Pennsylvania Department of the Auditor General, Office of Communications, 229 Finance Building, Harrisburg, PA 17120; via email to: [email protected].