Performance Assessment of Apparel Industries-A Survey Assessment of App… · PROCESS AND TOOLS FOR...
46
CMYK
-
Upload
truongkhanh -
Category
Documents
-
view
215 -
download
0
Transcript of Performance Assessment of Apparel Industries-A Survey Assessment of App… · PROCESS AND TOOLS FOR...

CMYK

PROCESS AND TOOLS FOR ENHANCING COMPETITIVENESS
Performance Assessment Of Apparel Industries: Process And Tools For Enhancing Competitiveness
Study by Mr. Roger Thomas, Methods Apparel Consultancy Pvt. Ltd.
Commissioned by
German Technical Cooperation, SME Financing and Development Project, New Delhi,
in association with Okhla Garment and Textiles Cluster (OGTC)
October 2008

Performance Assessment of Apparel Industries 3

CMYK
PROCESS AND TOOLS FOR ENHANCING COMPETITIVENESS
PREFACE
The apparel industry plays a major role in Indian Economy, Apparel exports have approximately 9%
share in India’s total exports with apparel exporters directly employing 2.5 million people. The combined textile and apparel sector directly and indirectly employ 35 million people; this
makes it the 2nd
largest employer in the country. The year 2005-06, witnessed a major increase in apparel exports of 28%, however, the future growth
seems to be very difficult. The abolition of quota opened the world markets and there is a direct
competition from many countries to retain the existing global market share and for future growth,
Indian apparel industry has to work on many fronts. The scope of improvement available within the
average firms is immense and its imperative that proper attention is given to many basic aspects to
improve overall productivity as a first step. This study has been undertaken by M/s Method Apparel Consultancy India Pvt. Ltd. and was
commissioned by German Technical Cooperation (GTZ) in association with OGTC. We are grateful to
GTZ for giving us the opportunity to study the existing systems and practices prevalent in apparel firms
and thus outline the scope of improvement and training needs. Our sincere thanks go to OGTC and its members for their commitment towards the assessment. The
firms not only provided the support in terms of data etc. but at times facilitated the team to understand
the latent issues. It is important to note that there is a wide variation in the level of competency in the factories. The
major contributors to this variation are lack of work study, mismanagement in the finishing departments
and a general lack of systems to establish performance levels. So there is no way that they can
establish the efficiency levels they are performing at. The production and cutting departments are
operating at a score of 52-53% compared to an acceptable international benchmark of 75%. The result of the study is based on the findings of 10 firms in National Capital Region wherein the
entire manufacturing operations and training needs have been critically evaluated. Findings are very
relevant for enhancing the growth and competitiveness of the apparel manufacturing industry. It aims
to show manufacturers the areas where they can improve performance and return to the levels of
profitability previously achieved if corrective steps are taken in time. On behalf of M/s Method Apparel Consultancy India Pvt. Ltd., we are hopeful that this publication will
enable companies to take a hard look at their inefficiencies and be motivated to work towards
enhanced efficiencies, future growth and higher profitability.
Roger Thomas Method Apparel Consultancy India Pvt. Ltd. [email protected]

Performance Assessment of Apparel Industries 7

CMYK
PROCESS AND TOOLS FOR ENHANCING COMPETITIVENESS
C O N T E N T S
Chapter 1
EXECUTIVE SUMMARY 11
Chapter 2
PRESENT SITUATION OF APPAREL FIRMS 14
2.1 Workstudy Department 14
2.2 Quality Department 16
2.3 Fabric Stores 17
2.4 Trim Stores 19
2.5 Cutting Department 20
2.6 Mechanics 22
2.7 Production Department 22
2.8 Finishing Department 25
2.9 General Issues 26
Chapter 3
WORKSTUDY DEPARTMENT – A CRITICAL COMPONENT 27
Chapter 4
TRAINING NEEDS 28
Case Studies
1. Dead Stock in Factory 18
2. Fabric Purchasing in Factory 18
3. Benefit of Fabric Width Utilization in Factory 20
4. A Check on Fabric Reconciliation in Factory 21
5. M/A Ratio Study in Factory 24

10 Performance Assessment of Apparel Industries

CMYK
PROCESS AND TOOLS FOR ENHANCING COMPETITIVENESS
C H A P T E R - 1
1. EXECUTIVE SUMMARY
Introduction
India is looked upon as an important
contender in the world apparel market.
However, export orders in 2007 have
declined since India is not sufficiently
competitive. It is high time that the
industry realizes the need to compete
and starts to work to increase
productivity.
It is defiantly a buyer’s market! Garment prices are not following inflation. In the last two
years estimates say that prices are on a downward trend which varies from 7% to
15% in some product groups (KSA study).
This has been exacerbated during 2007-08
by the increase in the input cost due to
inflation, rising minimum wage rates by as
much as 40% in Haryana and reducing
drawbacks.
With manufacturing efficiencies running
between 28% and 45%, as per the survey
findings, the time taken per piece in the
finishing department and repair rates are at
an unacceptably high level, which
apparently shows that there is plenty of
scope for improvement.
The major improvement initiatives required
by the garment industry to remain
competitive are:
Introduction of work study techniques,
Establishment of standard times and
efficiency monitoring systems from the
cutting department to dispatch,
Fabric control, reconciliation and cutting
room improvements,
Reorganisation of finishing floor,
Quality system review and restructuring,
Properly structured management
meetings with comprehensive targets and
task allocation. An extensive survey was commissioned by
the German Technical Cooperation (GTZ) in
association with Okhla Garment and Textile
Cluster (OGTC), and Methods Apparel
Consultancy was chosen to analyze current
systems and advise ways to improve overall
competitiveness.
Objectives
This study aims to show manufacturers the
areas where they can improve performance
and regain some of the lost profitability by:
Analysing current production and
management systems,
Investigating and highlighting the
shortcomings in each department,
Making recommendations for
improvement,
To provide solutions and the potential
savings that would accrue.
Methodology An extensive survey was conducted in the
NCR Region in the months of November and
December 2007. The firms selected covered a

Performance Assessment of Apparel Industries 11

CMYK
PROCESS AND TOOLS FOR ENHANCING COMPETITIVENESS
wide range of products and fall within the
following parameters.
Orders in excess of 2000 pieces,
200 to 1000 operators,
Have some operators on the company
payroll,
Willing to share management cost
information. The survey included an analysis of the
production department, the personnel
involved and potential savings in an average
factory. All the key departments were analyzed and
rated keeping the world-class standard as a
benchmark. All the managers and supervisors
were assessed and rated to establish where
training would be most effective.
Priorities
Based on the data collected during the
survey, it can be said that the following major
areas require immediate attention:
1. Technical skills availability,
2. The need for first-time quality,
3. A reduction in throughput time,
4. Lower WIP,
5. Better management and supervision,
6. Development of team work,
7. Lower absenteeism,
8. Lower labour turnover,
9. Innovation and technology
upgradation.

12 Performance Assessment of Apparel Industries

CMYK
PROCESS AND TOOLS FOR ENHANCING COMPETITIVENESS
Conclusion
The industry needs to spend money on
the people: Caring and training are the
main factors to improve factory
performance from a mere 35 to 45%
efficiency level to at least 60 to 65% level.
And to achieve these objectives the
industry has to lay emphasis on
implementing better systems. It is known
that the companies understand the need to
improve their performance levels but this
will not happen unless management
broadens their view of the people. We must
accept that people are not “born with
knowledge”, they have to learn, unlearn and
re-learn again and need to be treated with
respect and understanding. This is the reason why the suggestions
outlined in the report are the basic
fundamentals required and there has
been no suggestion to improve
equipment in this report. It is a pointless
direction since the industry is performing
at low efficiency levels; new and more
sophisticated machinery will not produce
the required effect. In the last few months the industry has taken
a considerable beating. If it has to survive
these changes, then the thinking must change
to accommodate the demands that have been
forced upon the industry. These changes will
require that the industry start using control mechanisms that will
provide the information needed to
manage more effectively. There are new challenges, improved
productivity is the order of the day, many
companies will have to change direction
and realign their priorities to be able to
accept the changing scenario.
Recommendations
Recommendations have been
included within the report under
each section.
The following list is a general
summary of what is required:
1. Training and development of
Managers, Supervisors and
Operators,
2. Introduction of a more pro-
active personnel department
which is responsible for both
absenteeism and labour
turnover,
3. Properly constructed
management meetings,
4. Implementation of standard
times and monitoring control
systems in the Cutting,
Sewing and Finishing
departments,
5. Layout improvements in
Cutting and Finishing,
6. Comprehensive
fabric reconciliations,
7. The Establishment of “Cost
per Minute”,
8. Establishment of “Cost of
Quality”,
9. Introduction of SOP’s and
their proper use,
10.Establishment of in-house
Operator Training Schools,
11.Sustained and constant
improvement.

Performance Assessment of Apparel Industries 13

CMYK
PROCESS AND TOOLS FOR ENHANCING COMPETITIVENESS
C H A P T E R - 2
2. PRESENT SITUATION OF APPAREL FIRMS
Poor planning is a major reason for
poor efficiency, orders being split
over many lines to meet the delivery
date, lots of overtime to achieve the
delivery and top managers spending
much of their time chasing orders to
achieve unplanned delivery promises.
Aproductivity improvement throughout this report is targeting at 15%. But if the
starting efficiency is 40%, then this means that you only have to reach 46% to achieve
this target. This is still not an acceptable competitive level, but once
attained is the beginning.
Average Factory Score: 53%
There is a wide variation in the scores
achieved by the surveyed factories. Some of
the major contributors to this variation is lack
of workstudy, absence of production control
and mismanagement in finishing. Most of the companies have no systems to
measure their performance, workstudy and
finishing departments show the lowest levels
of performance, production and cutting
departments score around 52-53%. With all
the major departments scoring less than
55% which reflects the huge scope for
improvement is evident. The section below analyses each department
separately and highlights priorities that need
attention to chart out a future success path.
2.1. Workstudy
In today’s environment the need to improve
productivity is essential. The manufacturers
must realize the importance of using
scientific ways to analyse how best garments
can be made and how manufacturing
procedures can be improved. Workstudy is
one of the most important tools that can be
used for this purpose.
Seven of the 10 factories visited do not know
their performance levels, and although the
labour portion of the cost is around 25%
there are great opportunities for improved
profitability through improved practices and
better methods. Garment factories will not survive in the future
without well-organized measurement
techniques; they must know their performance
levels and constantly work to improve them. The introduction of workstudy techniques
into the industry is relatively new, and the
problem has been considerable shortage of
good industrial engineers and the need for
accelerated training in the techniques is

important. Most companies do not have IE /
14 Performance Assessment of Apparel Industries
CMYK
PROCESS AND TOOLS FOR ENHANCING COMPETITIVENESS
workstudy departments and are losing a
huge potential for improvement. They have
no means of measuring their performance
and are unaware of their competitive status.
Standard Time and Target Setting
Many companies do not use standard time
systems; target setting is based on guesswork
and experience. Operator efficiency monitoring
is not done. So companies have no means to
establish their performance against an
international standard, hence their efficiency
levels are at best a guesswork only.
Establishment of standard times and the
development of the best method of
manufacture is of vital importance to improve
productivity. Every company that wishes to
compete in the future has to realize this.
Method Analysis
Most of the companies are using poor
methods. Operators are left to establish best
way to do the job, decide on the number of
bursts of stitching, folding and unfolding of
parts, unnecessary matching and additional
handling. All of these motions add to the
time it takes to manufacture the garment and
should be eliminated. Method study can be implemented in any type
of production system whether it is in-house or
on a contract basis. Proper method analysis can improve productivity by at least 15%.
Workplace Layout
The management can fit as many machines in
the factory as possible, reducing the scope for
methods improvement. The space between
machines is insufficient in many cases. A good workplace layout will eliminate
unnecessary motions and fatigue resulting in
substantial increase in the efficiency of the
operator.
Cramped space reduces efficiency
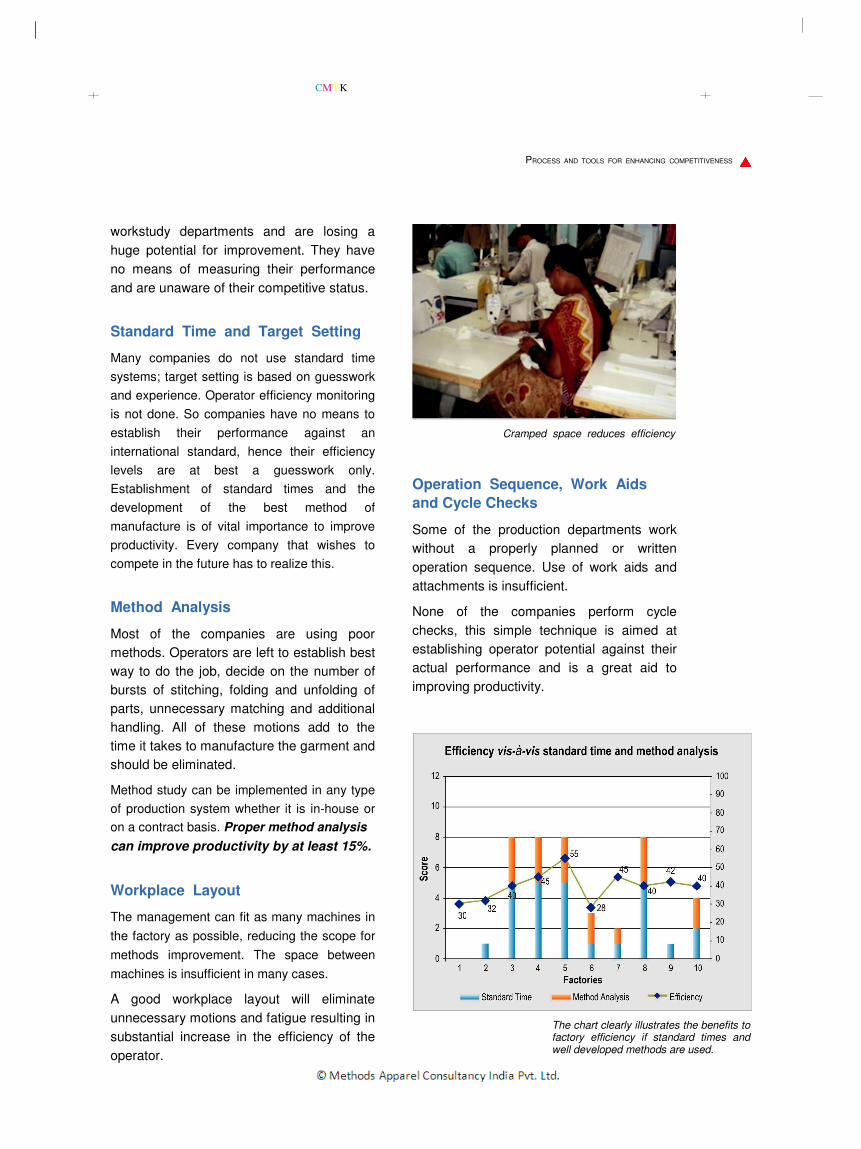
Operation Sequence, Work Aids and Cycle Checks
Some of the production departments work
without a properly planned or written
operation sequence. Use of work aids and
attachments is insufficient. None of the companies perform cycle
checks, this simple technique is aimed at
establishing operator potential against their
actual performance and is a great aid to
improving productivity.
The chart clearly illustrates the benefits to factory efficiency if standard times and well developed methods are used.

Performance Assessment of Apparel Industries 15
CMYK
PROCESS AND TOOLS FOR ENHANCING COMPETITIVENESS
Recommendations
1. Workstudy departments must be
introduced in all companies,
2. Standard Times must be
established,
3. Operator efficiency monitoring is
essential,
4. All new operations must have a
written method and the operator
must be instructed in that
method. This should also be
used for training new operators,
5. Poor performers guided to
improve their efficiency,
6. Investigations must be done to
explore new attachments and
folders,
7. Regular management meetings to
establish the way forward and the
month on month progress towards
these aims carefully monitored.
“Work Study Department Assessment Score
Averaged 43%”
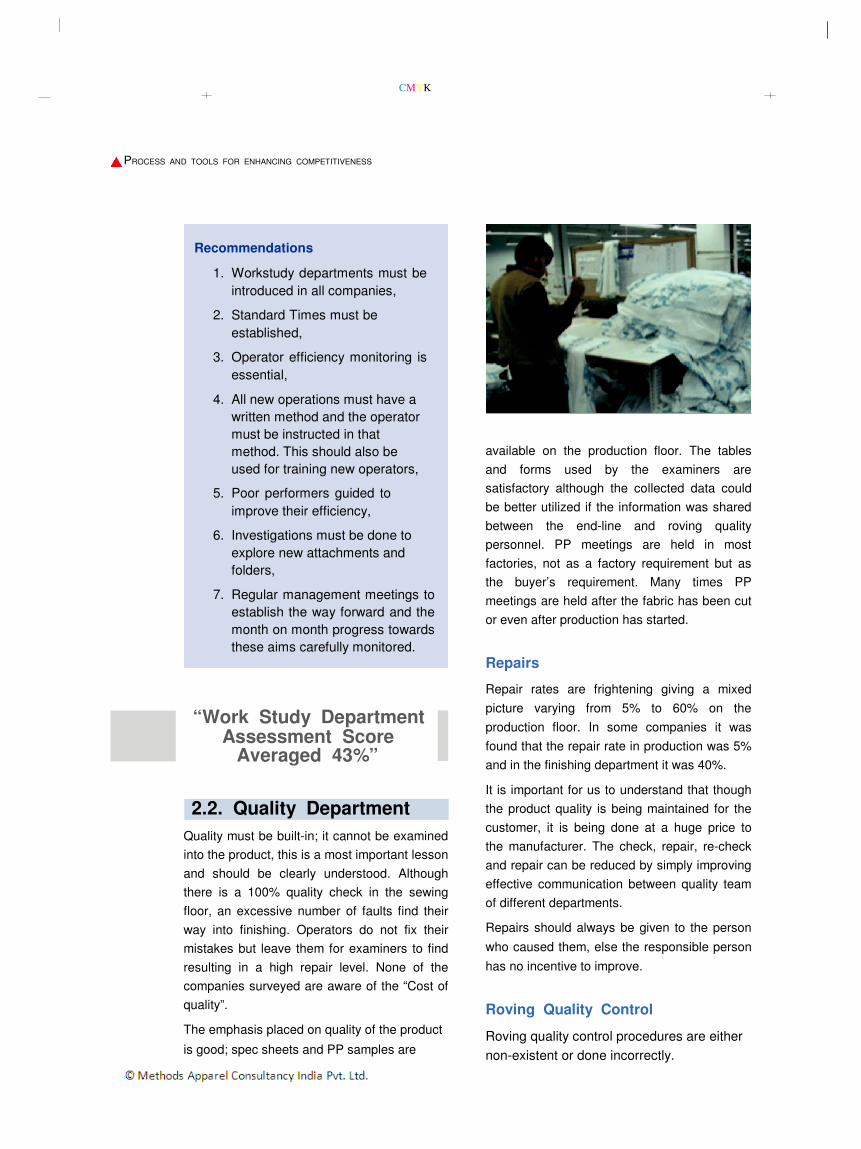
2.2. Quality Department Quality must be built-in; it cannot be examined
into the product, this is a most important lesson
and should be clearly understood. Although
there is a 100% quality check in the sewing
floor, an excessive number of faults find their
way into finishing. Operators do not fix their
mistakes but leave them for examiners to find
resulting in a high repair level. None of the
companies surveyed are aware of the “Cost of
quality”. The emphasis placed on quality of the product
is good; spec sheets and PP samples are
available on the production floor. The tables
and forms used by the examiners are
satisfactory although the collected data could
be better utilized if the information was shared
between the end-line and roving quality
personnel. PP meetings are held in most
factories, not as a factory requirement but as
the buyer’s requirement. Many times PP
meetings are held after the fabric has been cut
or even after production has started.
Repairs Repair rates are frightening giving a mixed
picture varying from 5% to 60% on the
production floor. In some companies it was
found that the repair rate in production was 5%
and in the finishing department it was 40%. It is important for us to understand that though
the product quality is being maintained for the
customer, it is being done at a huge price to
the manufacturer. The check, repair, re-check
and repair can be reduced by simply improving
effective communication between quality team
of different departments. Repairs should always be given to the person
who caused them, else the responsible person
has no incentive to improve.
Roving Quality Control
Roving quality control procedures are either
non-existent or done incorrectly.

16 Performance Assessment of Apparel Industries

CMYK
PROCESS AND TOOLS FOR ENHANCING COMPETITIVENESS
Wherever roving quality procedures are being
used the quality levels indicate a reduced
repair level. If this system is followed, the
outgoing quality of production will be improved
and the high level of repairs and rejections in
finishing room can be reduced.
Quality Team
Quality Teams are not completely
independent of the production department, it
is important to have clear reporting
procedures and to keep the quality team
independent of production management.
Checkers in the line are also a part of the
quality team. The Supervisor is responsible
for the output but quality decisions must be
made by the quality management team.
Recommendations
1. Properly organized roving quality
procedures must be implemented,
2. Regular quality meetings with all
concerned and its reports should
be shared and analysed,
3. Quality team should be
independent of production
department,
4. Investigations must be made into
the amount of repairs found in
finishing department,
5. A co-ordinated effort must be
made to reduce repair rates,
6. The cost of quality must become
a major management information
tool.
“Quality Department Assessment Score
Averaged 58%”
2.3. Fabric Stores
The major areas where the investigation
focused are fabric handling, control systems,
inspection procedures and transportation
systems. Inspection procedures and quality
systems are satisfactory but fabric handling
control and transportation systems are
inadequate and require considerable
improvement.
Storage / Transportation
Generally there is lack of adequate racking.
Fabric is stored on pallets wasting volume

Performance Assessment of Apparel Industries 17

CMYK
PROCESS AND TOOLS FOR ENHANCING COMPETITIVENESS
CASE STUDY 1: Dead Stock in Factory
It was observed that approximately
10,000 metres of fabric was collected in
the fabric store in the last 2 months of
which 50% was liability fabric and rest
was surplus from the production.
Monthly fabric consumption of the factory
was 50,000 metres.
Dead stock collected in one month owing
to production surplus was 2,500 metres.
This is 5% of monthly fabric consumption
of the company.
In the “Average Factory” this loss
amounts to Rs. 16,50,000 per annum.
CASE STUDY 2: Fabric Purchasing in Factory
The fabric purchasing in factory XYZ is
being done as follows:
1. A 2 or 4 body single size marker is
made and an average consumption
figure is established.
2. A further 10% is added and the cost of
garment is established.
3. After alterations, required by the buyer, a new 4 body single or double size
marker is made, this is compared to the
original costing.
4. An additional 4% is added to the final
consumption marker.
5. Another 6-7% is added to the fabric
consumption this is to cover the
following:
a. Additional garments that could be
sent to the buyer.
b. Rejects.
6. A further 6% shrinkage factor is added.
This amounts to 16.5% extra fabric
ordered.
space, materials handling and transportation
equipment is virtually non-existent. Almost all
of the factories use manual labour to move
fabrics from one department to another. Dead stock is prevalent and takes up storage
space and in some of the companies the
amount of greige fabric stock is excessive.
Record Keeping
Many of the stores use computerized stock
control systems, however many of these do not
have accurate data due to poor data entry.
Computer records do not match the quantity in
stock. There are no stock cards! Therefore
actual stock checks are not possible. None of
the companies do random stock checks. The fabrics should be stored with proper
stock cards which have complete details
regarding the quantity of the fabric lot.
Fabric Width Measurement and Usage
Fabric width is measured in most of the
companies but none of them record it on roll
into tickets nor do they segregate different
widths. Thus fabric is issued to cutting without
width segregation and the markers are made
on the narrowest width. The rolls should be grouped by width and the information
forwarded to the CAD department to make
markers to maximize fabric utilization.

18 Performance Assessment of Apparel Industries

CMYK
PROCESS AND TOOLS FOR ENHANCING COMPETITIVENESS
Fabric Purchasing
2.4. Trim Stores The fabric purchasing system needs a
thorough review and the percentages of
additional fabric ordered should be
investigated since it was found that in some
cases several departments add additional
quantities which finally end up as dead stock
or gets lost in the factory. The cumulative
additions can be as high as 15-18%.
Fabric Returns
Excess fabric is returned to the fabric store
after the order is completed but the returns
are considered as waste and are not
recorded. This makes accurate fabric
reconciliation impossible.
Recommendations
1. Dead Stock must be eliminated.
2. Stock cards must be used and
updated after each transaction,
3. Fabric widths must be
segregated and information
given to the CAD department to
make most efficient markers,
4. Fabric must be issued by width,
5. Storage and material handling
equipment must be improved,
6. Random Stock Audits and
Stock Checks must be part of
regular schedule,
7. Fabric reconciliations must be
done for each order,
8. Stock holding of greige fabric
should be reduced,
“Fabric Store
Assessment Score
Averaged 58%’
The trim stores have been evaluated on the
same parameters as the fabric stores. The stores are clean, well laid and have
adequate space. Racks and shelves are
satisfactory. All items are inspected upon
receipt and some companies have dedicated
quality control personnel. However, stock
cards are not maintained. None of the
companies have systems for stock checks
and dead stock removal. Trims are issued all at once for an order or as
requested by production/finishing departments.
Returns are considered as waste in many
cases and not recorded resulting in
discrepancies in trim reconciliation.
Recommendations
1. Dead stock should be
removed,
2. Stock cards should be properly
maintained,
3. Random stock audits and stock
checks should be a regular
schedule,
4. Trim reconciliation should be
done for each order,
5. Trims should be issued
according to the cut quantities.
“Trim Store
Assessment Score
Averaged 56%”

Performance Assessment of Apparel Industries 19
9. Fabric ordering procedures must be
CMYK
PROCESS AND TOOLS FOR ENHANCING COMPETITIVENESS
2.5. Cutting Department
There is gold on your cutting floor The Cutting room is one of the most important
departments in the factory; it scored a low of 48-
50%. The staff in many of these departments is
not sufficiently “Fabric Conscious”. An improvement of 2-3% in utilisation efficiency can make a huge difference to
bottom line profitability. Comprehensive
fabric reconciliation is essential; it is
disappointing to see that most companies do
not include this vital aspect in their controls.
Machinery
Machinery is generally well maintained.
Fusing machines have proper maintenance
schedule in place but regular temperature
checks are not done. Many cutting tables
are of poor quality and not properly
maintained. End cutters are not used as
much as they should be.
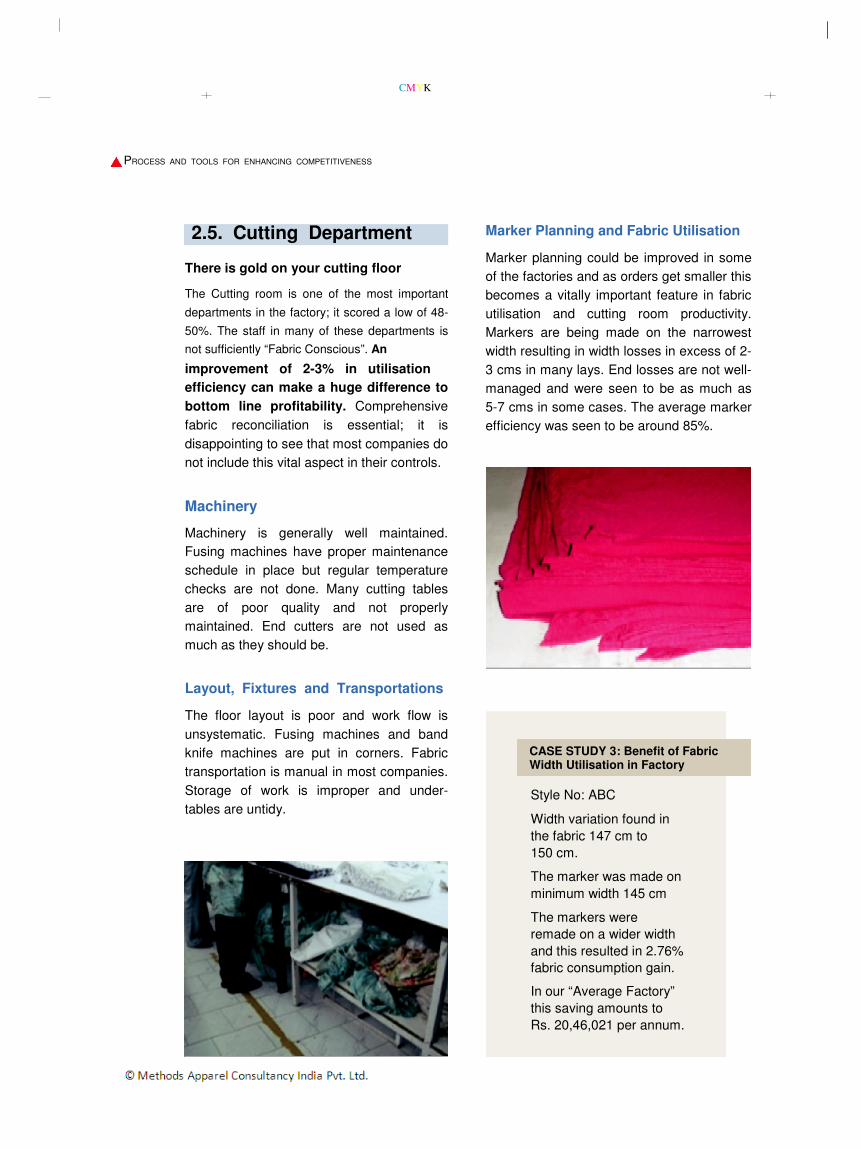
Layout, Fixtures and Transportations
The floor layout is poor and work flow is
unsystematic. Fusing machines and band
knife machines are put in corners. Fabric
transportation is manual in most companies.
Storage of work is improper and under-
tables are untidy.
Marker Planning and Fabric Utilisation
Marker planning could be improved in some
of the factories and as orders get smaller this
becomes a vitally important feature in fabric
utilisation and cutting room productivity.
Markers are being made on the narrowest
width resulting in width losses in excess of 2-
3 cms in many lays. End losses are not well-
managed and were seen to be as much as
5-7 cms in some cases. The average marker
efficiency was seen to be around 85%.
CASE STUDY 3: Benefit of Fabric Width Utilisation in Factory
Style No: ABC
Width variation found in
the fabric 147 cm to
150 cm.
The marker was made on
minimum width 145 cm
The markers were
remade on a wider width
and this resulted in 2.76%
fabric consumption gain.
In our “Average Factory”
this saving amounts to
Rs. 20,46,021 per annum.

20 Performance Assessment of Apparel Industries

CMYK
PROCESS AND TOOLS FOR ENHANCING COMPETITIVENESS
Fabric Reconciliation Numbering
The majority of the companies do not have a
properly managed fabric reconciliation
system. This is a fundamental aspect of
control in garment manufacturing systems
which tells management what happens to
every inch of issued fabric that is essential.
The numbering system and number clarity is
good. However, the position of numbering
can be improved. A poorly positioned
number sticker causes problems for the
sewing operator since they have to remove
and replace the sticker before completing
the operation, wasting sewing time.
CASE STUDY 4: A Check on Fabric Reconciliation in Factory
Order Quantity: 500
Actual achieved consumption as per marker (including end losses) 1.32 metres
Actual quantity of Processed Fabric required 500 x 1.32 660 metres
Quantity including 2% extra (allowed to ship ) 500+10 510 pieces
Initial estimated consumption at the time of costing 1.40 metres
Total fabric required 510 x 1.40 714 metres
Plus 5% for cutting wastage, 714 + (0.05X714) 751.58 metres
Plus 3% for shrinkage, 751.6 + (0.03X751.6) 774.82 metres
The merchandiser was informed that 350 metres of processed fabric 401.58 metres
was in stock so of processed fabric was ordered.
Processed fabric received 419 metres
Hence the total stock of processed fabric should be 350 + 419 769 metres
Total Fabric issued to cutting department 735 metres
Therefore, total fabric that should be left in stock 769 - 735 34 metres
The records of stock room show that the quantity in stock is 54 metres
(The store had given incorrect information of 350 metres in stock to the merchant)
The actual quantity in stock upon physical measurement was found to be 71 metres
71 metres of fabric ends up as dead stock. This is 10% of the order quantity.
Total Fabric received for this order 735 + 71 806 metres
Fabric that was used 510 X 1.32 673.2 metres
Fabric that was wasted or lost in the factory 806 - 673.2 132.8 metres 16.5% of fabric was either lost, wasted or ended up as dead stock in the store

Performance Assessment of Apparel Industries 21
CMYK
PROCESS AND TOOLS FOR ENHANCING COMPETITIVENESS
Operator Monitoring
There is no operator efficiency monitoring in
any of the cutting departments as the score
boards are not properly maintained.
Recommendations
1. Accurate Fabric reconciliations
to be completed for each order,
2. Standard times for each process
must be established,
3. An operator monitoring system
needs to be introduced,
4. Cutting room layout and the
workflow can be improved,
5. End pieces and remnants should
be properly managed,
6. Markers should be made as per
the fabric width.
7. Work transportation trolleys and
other work aids should be
introduced,
8. Simple laying up aids
introduced.
“Cutting Department Assessment Score
Averaged 52%”
2.6. Mechanics
Companies allocate one mechanic for every
100 to 120 machines. The service provided
by the mechanics is good and prompt. The
mechanics are only expected to fix machines
and not contribute further by offering advice
on attachments and equipment. The machines are well serviced and oil
reservoirs are clean and well-maintained. A
maintenance schedule is in place in most
companies but is not followed. None of the companies have adequate
mechanics or workshops, and if ever, space
is provided for them it is inadequate and
inaccessible. The storage space for spare parts is small
and holds very few spares; spare parts are
ordered when required. Most companies do
not have proper machine moving trolleys.
Recommendations
1. A regular maintenance
schedule must be adhered to,
2. There should be increased
involvement with the IE for the
usage of attachments and
folders,
3. The mechanics department
should have sufficient space
allocated for proper workshop,
4. Spare parts store should be
adequately stocked,
5. Machine moving trolleys should
be provided.
“Mechanics Department Assessment Score
Averaged 57%”

22 Performance Assessment of Apparel Industries

CMYK
PROCESS AND TOOLS FOR ENHANCING COMPETITIVENESS
2.7. Production Department
No Measurement = No Management
Current Production Managers are generally
working with outdated systems, they are
reluctant to learn new techniques and have
little or no knowledge or interest in what is
available to help them improve. Even if few
who are aware, are reluctant to pass on their
knowledge to trainees. They are doing what
has always been done and repeating the
same mistakes.
Production problems and bottlenecks are
solved by adding additional labour instead of
solving the problem that has caused the
bottleneck. In some cases the management
thinks that the louder you shout the more
you will produce, this of course is not an
answer. The major focus is to ensure that
the order is delivered on time and not the
efficiency that is required to remain
competitive. The most skilful people in the
organization are spending their time chasing
orders and not problem solving.
The average industry efficiency is between
35-45% and certainly is not competitive in
the world market.
Bundle System
Most companies do not have bundle
systems and have additional operators
matching parts. Companies that do have
bundle systems have poor bundle
disciplines; in many cases the bundle
quantity does not match ticket quantity.
Line Layout and Workflow
Line size is generally large comprising of 40-
50 people. Line layout is poor, helper and
ironing stations are often placed outside the
lines. The operators are not placed in a
proper sequence resulting in improper
workflow and unnecessary helpers.

WIP and Line Balancing
The lines are not properly balanced in most of
the companies. Due to paucity of proper work
study procedures line balancing and WIP
management is far behind acceptable
standards. Average balance efficiency was around 60-65%. Line balance efficiency
should be 80% or more.
Repair Handling
Repairs are done within 30 minutes of their
detection although in many cases repairs are
not given to the person who caused them there
were separate people to handle repairs this is
not a good practice since those responsible
have no incentive to improve.
Meetings and Reports
Reports are generally inaccurate due to
improper data collection. Most factories have
informal meetings on requirement basis only.
There is a great need for formal supervisory
meetings on a regular basis with an agenda
and action requirement.
Production Monitoring and Control
Production boards are not present in many
cases and wherever present are placed in
inappropriate locations. Only those
companies who have work study and
operator management systems are properly
able to monitor production and efficiency.
Performance Assessment of Apparel Industries 23
CMYK
PROCESS AND TOOLS FOR ENHANCING COMPETITIVENESS
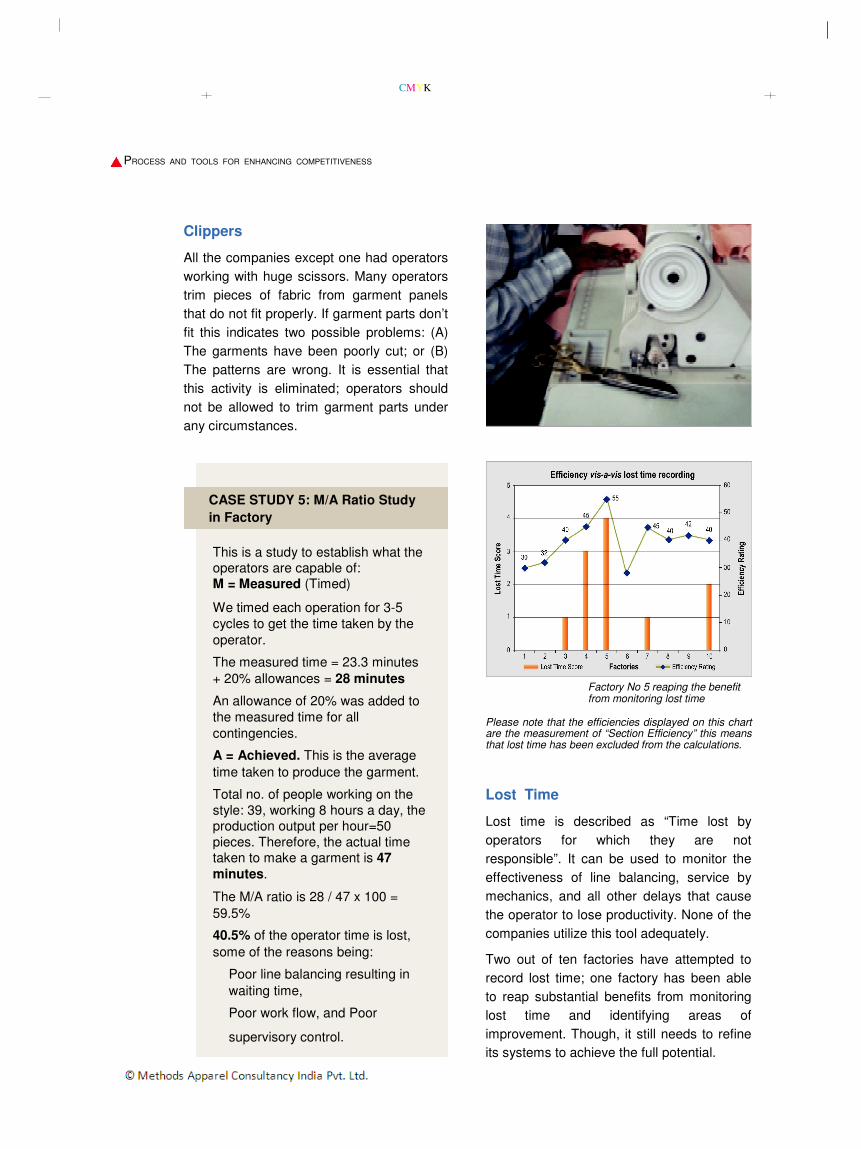
Clippers
All the companies except one had operators
working with huge scissors. Many operators
trim pieces of fabric from garment panels
that do not fit properly. If garment parts don’t
fit this indicates two possible problems: (A)
The garments have been poorly cut; or (B)
The patterns are wrong. It is essential that
this activity is eliminated; operators should
not be allowed to trim garment parts under
any circumstances.
CASE STUDY 5: M/A Ratio Study in Factory
This is a study to establish what the operators are capable of: M = Measured (Timed)
We timed each operation for 3-5
cycles to get the time taken by the
operator. The measured time = 23.3 minutes
+ 20% allowances = 28 minutes An allowance of 20% was added to
the measured time for all
contingencies. A = Achieved. This is the average
time taken to produce the garment. Total no. of people working on the
style: 39, working 8 hours a day, the production output per hour=50
pieces. Therefore, the actual time taken to make a garment is 47 minutes.
The M/A ratio is 28 / 47 x 100 =
59.5% 40.5% of the operator time is lost,
some of the reasons being:
Poor line balancing resulting in
waiting time,
Poor work flow, and Poor
supervisory control.
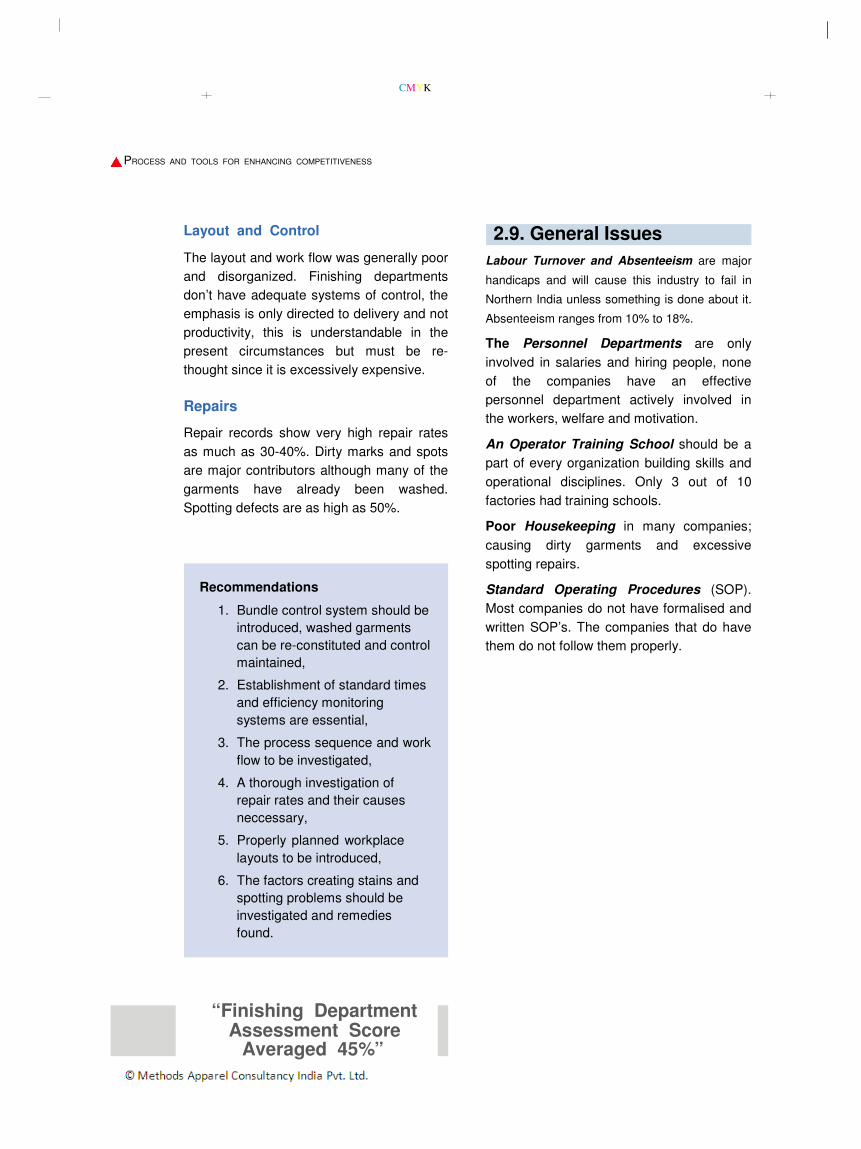
Factory No 5 reaping the benefit from monitoring lost time
Please note that the efficiencies displayed on this chart are the measurement of “Section Efficiency” this means that lost time has been excluded from the calculations.
Lost Time
Lost time is described as “Time lost by
operators for which they are not
responsible”. It can be used to monitor the
effectiveness of line balancing, service by
mechanics, and all other delays that cause
the operator to lose productivity. None of the
companies utilize this tool adequately.
Two out of ten factories have attempted to
record lost time; one factory has been able
to reap substantial benefits from monitoring
lost time and identifying areas of
improvement. Though, it still needs to refine
its systems to achieve the full potential.

24 Performance Assessment of Apparel Industries

CMYK
PROCESS AND TOOLS FOR ENHANCING COMPETITIVENESS
Recommendations
1. Bundle control systems with
adequate bundle disciplines
to be introduced,
2. Proper standard times and
operator monitoring
procedures to be
established,
3. The supervisors need
training to manage WIP
levels,
4. The supervisors need
training to do proper
production monitoring and
control,
5. Method Improvement
procedures should be
introduced,
6. Production monitoring
systems should be
introduced,
7. Production studies must be
completed wherever poor
performance is observed,
8. Lost Time information must
be collected analysed and
acted upon,
9. Repair handling procedures
must be revised,
10. Large inappropriate scissors
must be eliminated,
11. Operators should not be
allowed to trim garment
parts.
2.8. Finishing Department Finishing departments are over-staffed in most
of the factories studied, the time to finish a
garment varied from 11.2 minutes to 57.6
minutes.
Finishing Time
Finishing times are excessive in almost
every company; and as can be seen in the
chart below the time taken to finish a
garment is alarming. Some of the companies
are examining the garment as many as five
times; this is driven by the fear of order
rejection or rework. There is a great potential
for improvement in this department.
“Production Department Assessment Score
Averaged 53%”

Performance Assessment of Apparel Industries 25
CMYK
PROCESS AND TOOLS FOR ENHANCING COMPETITIVENESS
Layout and Control
2.9. General Issues The layout and work flow was generally poor
and disorganized. Finishing departments
don’t have adequate systems of control, the
emphasis is only directed to delivery and not
productivity, this is understandable in the
present circumstances but must be re-
thought since it is excessively expensive.
Repairs
Repair records show very high repair rates
as much as 30-40%. Dirty marks and spots
are major contributors although many of the
garments have already been washed.
Spotting defects are as high as 50%.
Recommendations
1. Bundle control system should be
introduced, washed garments
can be re-constituted and control
maintained,
2. Establishment of standard times
and efficiency monitoring
systems are essential,
3. The process sequence and work
flow to be investigated,
4. A thorough investigation of
repair rates and their causes
neccessary,
5. Properly planned workplace
layouts to be introduced,
6. The factors creating stains and
spotting problems should be
investigated and remedies
found.
“Finishing Department Assessment Score
Averaged 45%”
Labour Turnover and Absenteeism are major
handicaps and will cause this industry to fail in
Northern India unless something is done about it.
Absenteeism ranges from 10% to 18%. The Personnel Departments are only
involved in salaries and hiring people, none
of the companies have an effective
personnel department actively involved in
the workers, welfare and motivation. An Operator Training School should be a
part of every organization building skills and
operational disciplines. Only 3 out of 10
factories had training schools. Poor Housekeeping in many companies;
causing dirty garments and excessive
spotting repairs. Standard Operating Procedures (SOP).
Most companies do not have formalised and
written SOP’s. The companies that do have
them do not follow them properly.

26 Performance Assessment of Apparel Industries

CMYK
PROCESS AND TOOLS FOR ENHANCING COMPETITIVENESS
C H A P T E R - 3
3. WORKSTUDY DEPARTMENT – A CRITICAL COMPONENT
In order to get an objective comparison
between factories, a rating was done of
the companies with and without work-
study department. The factories were
categorized into two groups ‘A’ score
(with more than 40%) and ‘B’ (with less
than 40% score).
Looking at the comparison shown in the table it is obvious that group ‘A’factories are more productive than the group ‘B’
factories. This fact is further strengthened
when the overall factory survey results are
compared. The factories in group ‘A’ have a
combined score of 61% for overall
performance whereas factories in group ‘B’
achieved a score of only 48%.
Workstudy is the need of the hour and it is
high time that the industry now understands
its importance and its contribution to
profitability.
Status of Workstudy Department
The workstudy departments in factories 5 and 7 are operational but ineffective.
Different functions in a factory were analysed to show improved
productivity in a Group ‘A’ factories with workstudy department.
Benefits of Workstudy Department

Performance Assessment of Apparel Industries 27

CMYK
PROCESS AND TOOLS FOR ENHANCING COMPETITIVENESS
C H A P T E R - 4
4. TRAINING NEEDS
4.1. Management
Properly constructed and professionally
run training courses are essential,
although many of the managers have
considerable work experience. This is not
enough to move the industry where it
needs to go; companies must review their
management structures and the people
they have in place. Management
techniques are changing constantly. Are
the managers fit to cope with the demands
that are now being expected? If the
answer is no, then you must embark on a
serious move to change this.
t was astounding to note the manner in
Iwhich managers overrated their colleagues indicating that they do not have sufficient
performance expectations from their staff.
The training requirements
for Managers should be:
1. Communication,
2. To-do list,
3. Leadership techniques,
4. Decision-making,
5. Planning and organization,
6. Garment engineering,
7. Workstudy,
8. Quality and Productivity,
9. SOPs,
10.Computer Knowledge,
11.General Industry
Knowledge.
The requirement list above is covered
in the following courses:
Suggested course Statistical Analysis Urgency**
Communication for 61 Managers were $$$$$$
Managers evaluated 96% were
How to get the best unable to achieve
the required level of
out of your staff
communication skills
Conflict Management
Team Building
General 92% need $$$$$$
knowledge of the
Management
techniques required
Techniques
in today’s
Workstudy
demanding and
Garment Engineering
competitive
production scenario.
Basic computer Only basic computer $$$
knowledge is
knowledge
present with some
of the Managers.
**The “$” represents the level of urgency for training. The higher
the number of “$”s the more urgent is the training requirement.

28 Performance Assessment of Apparel Industries

CMYK
PROCESS AND TOOLS FOR ENHANCING COMPETITIVENESS
4.2. Supervisor
None of the Supervisors have
professional education in garment
manufacturing; their knowledge is based
on their work experience. It is extremely
important to teach them a more
professional approach to supervision.
The requirement list alongside, covers the following courses:
Suggested Course Statistical Analysis Urgency
Supervisor’s Course Out of 204 total $$$$
includes Supervisors, 65%
Communication, need extensive
Planning, Team training.
Work, Workstudy,
Garment
Engineering, Quality
and Productivity.
Work Study/ 51% out of a total $$$$$
Garment of 204
Engineering Supervisors need
These are specialized
specialized courses training on
focusing on the Workstudy and
vital needs of the Garment
industry. Engineering
Cutting Room Out of 38 Cutting $$$
Room Supervisors
Specialized training
evaluated, 74%
course for Cutting
need further
Room Supervisors.
training
Quality 42% out of a total $$$$
This includes
of 129 Quality
invaluable inputs on
Supervisors need
quality and repair
specialized
monitoring and
training
measuring
techniques
The training requirements
for Supervisors should be: 1. Communication, 2. To-do list, 3. Motivation techniques, 4. Leadership, 5. Decision-making, 6. Planning and organization, 7. Technical expertise, 8. Workstudy, 9. Quality, 10.Cutting Room, 11.General industry
knowledge.

Performance Assessment of Apparel Industries 29

For further details contact:
Methods Apparel Consultancy Pvt Ltd.
Roger Thomas
+91 9899011174