Performance Tests of a Liquid Hydrogen Propellant Densification ...

Grant Agreement no. 735582, 26 February 2018 1/94
JIVE – Joint Initiative for hydrogen Vehicles across Europe
Deliverable 3.1
MEHRLIN – Models for Economic Hydrogen RefueLling INfrastructure
Activities 2.4, 3.1 and 3.2
Performance Assessment Handbook
Dissemination level: Public
Version: Final
Date: 26 February 2018
JIVE and MEHRLIN Performance Assessment Handbook
Grant Agreement no. 735582, 26 February 2018 2/94
Authors:
Stefan Eckert 1
Michael Faltenbacher 1
Klaus Stolzenburg 2
Martin Gallmetzer 3
1 thinkstep AG, Hauptstr. 111-113, 70771 Leinfelden-Echterdingen, Germany,
[email protected] (Fuel cell buses)
2 PLANET GbR Engineering and Consulting, Donnerschweer Straße 89/91,
26123 Oldenburg, Germany, [email protected] (Hydrogen refuelling
infrastructure in JIVE)
3 Institut für Innovative Technologien Bozen Konsortial-GmbH, Enrico-Mattei-Straße
1, 39100 Bozen, Italy, [email protected] (Hydrogen refuelling infrastructure
in MEHRLIN)
Approval process
Status JIVE Status MEHRLIN
Work Package Leader Coordinator FCH 2 JU INEA/CEF
JIVE and MEHRLIN Performance Assessment Handbook
Grant Agreement no. 735582, 26 February 2018 3/94
Acknowledgments:
The JIVE project has received funding from the Fuel Cells and Hydrogen 2 Joint Un-dertaking (FCH 2 JU) under grant agreement No 735582. This Joint Undertaking re-ceives support from the European Union’s Horizon 2020 research and innovation programme, Hydrogen Europe and Hydrogen Europe Research. The MEHRLIN project is co-financed by the European Union under the CEF (Con-necting Europe Facility) – Transport Sector, agreement No INEA/CEF/TRAN/ M2015/1142684, action No 2015-EU-TM-0316-S. This document is based on the Assessment Framework from the CHIC project [Fal-tenbacher, Stolzenburg et al., 2011/14]) and the corresponding document from the HyTransit project [Stolzenburg/Glatthor 2014].
Disclaimer:
Despite the care that was taken while preparing this document, the following dis-claimer applies: The information in this document is provided as is and no guarantee or warranty is given that the information is fit for any particular purpose. The user thereof employs the information at his/her sole risk and liability. The report reflects only the authors’ views. The FCH 2 JU, INEA/CEF and the European Union are not liable for any use that may be made of the information contained herein.

JIVE and MEHRLIN Performance Assessment Handbook
Grant Agreement no. 735582, 26 February 2018 4/94
0 Executive Summary The projects JIVE and MEHRLIN run in parallel and work in close cooperation. The
key objective of JIVE is to implement and operate of 139 zero emission fuel cell bus-
es in five EU member states at unprecedented scale, thereby advancing their com-
mercialisation. The main objective of MEHRLIN is to promote, deploy and commer-
cialise hydrogen as an alternative fuel, contributing to the European alternative fuel
implementation strategy. This includes operating real-pilot hydrogen refuelling sta-
tions at seven locations along four Core Network Corridors of the trans-European
Transport Network (TEN-T).
Most of the buses co-funded under JIVE will refuel at stations co-funded under
MEHRLIN. Both projects involve analysis tasks based on data collected during the
demonstration phase. In this respect, JIVE concentrates on the technical perfor-
mance of the stations and buses, while MEHRLIN focuses on the financial aspects of
refuelling station ownership and operation, in particular achieving bankability.
To be able to monitor and assess to which degree targets are achieved, operating
data need to be collected, compiled, and evaluated on a steady and coherent basis.
This Performance Assessment Handbook is the basis of all monitoring and analysis
activities of Task 3.1 in JIVE and Activities 2.4, 3.1 and 3.2 in MEHRLIN. It thus:
• Defines the performance indicators for assessing hydrogen infrastructure and fuel
cell bus performance, also in comparison to reference technology (buses with in-
ternal combustion engines) as well as to those of other novel drivetrains (notably
long range electric buses).
• Defines the descriptive parameters and data points required to calculate indicator
figures.
• Explains the frequency of data collection and related details.
• Determines the necessary data structures and formats.
• Defines roles and responsibilities for data collection and performance evaluation. Figure 0-1 gives an overview of the flow and processing of information:

JIVE and MEHRLIN Performance Assessment Handbook
Grant Agreement no. 735582, 26 February 2018 5/94
• The descriptive parameters characterise the deployed hardware, such as the nom-
inal pressure and efficiency of an electrolyser etc. They are usually collected once.
• The data points are the items to be monitored during demonstration. The operating
data are collected at the data points. They are recorded regularly, typically daily
(e.g. the distance travelled by a bus) or per event (the amount of hydrogen refu-
elled to a bus).
• The performance indicator values are calculated using the operating data and se-
lected descriptive parameters.
Key Performance Indicators are subsets from the complete lists of bus and infrastruc-
ture performance indicators. For the Key Performance Indicators, the work pro-
grammes of the two projects state target figures, such as a minimum efficiency of on-
site hydrogen generation and a maximum hydrogen consumption of the buses per
100 km travelled.
Figure 0-1: Overview of the flow and processing of information for the performance assess-ment.
JIVE and MEHRLIN Performance Assessment Handbook
Grant Agreement no. 735582, 26 February 2018 6/94
Table of Contents
0 EXECUTIVE SUMMARY ................................................................................. 4
1 INTRODUCTION ............................................................................................12
1.1 Objectives of the JIVE project ............................................................................................... 12
1.2 Outline of JIVE work package 3 “Monitoring and analysis” .............................................. 13
1.3 Objectives of the MEHRLIN project ...................................................................................... 13
1.4 Outline of the data management in MEHRLIN ..................................................................... 14
1.5 Objective and scope of this document ................................................................................ 15
2 PERFORMANCE ASSESSMENT PROCESS ................................................16
2.1 Descriptive parameters, data points and performance indicators .................................... 16
2.1.1 Descriptive parameters .............................................................................................. 16
2.1.2 Operating data and data points ................................................................................. 17
2.1.3 Performance indicators .............................................................................................. 17
2.1.4 Key Performance Indicators ...................................................................................... 17
2.2 Data collection and analysis process .................................................................................. 18
2.2.1 Data collection at the sites ......................................................................................... 19
2.2.2 Compilation of monthly datasets and data upload..................................................... 19
2.2.3 Plausibility check and feedback on data quality ........................................................ 19
2.2.4 Data analysis ............................................................................................................. 20
2.2.5 Results and reports .................................................................................................... 21
3 HYDROGEN REFUELLING INFRASTRUCTURE .........................................22
3.1 Introduction ............................................................................................................................. 22
3.2 Key Performance Indicators .................................................................................................. 25
3.2.1 Efficiency of on-site hydrogen production (HRI-1) ..................................................... 26
3.2.2 Efficiency of the complete on-site hydrogen supply chain (HRI-2) ............................ 29
3.2.3 Availability of station (HRI-3 and MEHR-4) ............................................................... 30
3.2.4 Amount of hydrogen dispensed to project buses (HRI-4 and MEHR-2) and Rate of utilisation (MEHR-3) ............................................................................................... 31
3.2.5 Speed of dispensing (HRI-5), Time to fill (MEHR-8) and Total captive fleet refuelling window (MEHR-7) ...................................................................................... 32
3.2.6 Cost of hydrogen dispensed (HRI-6 and MEHR-5) ................................................... 33
3.2.7 Hydrogen purity (HRI-7 and MEHR-6) ....................................................................... 34
3.3 Descriptive parameters .......................................................................................................... 35

JIVE and MEHRLIN Performance Assessment Handbook
Grant Agreement no. 735582, 26 February 2018 7/94
3.4 Data points .............................................................................................................................. 47
3.5 Performance indicators ......................................................................................................... 57
4 FUEL CELL AND REFERENCE BUSES .......................................................65
4.1 Introduction ............................................................................................................................. 65
4.2 Key Performance Indicators .................................................................................................. 66
4.2.1 Vehicle operational lifetime ........................................................................................ 67
4.2.2 Distance travelled ...................................................................................................... 67 4.2.3 Operating hours per fuel cell system ......................................................................... 67
4.2.4 Availability of bus ....................................................................................................... 68
4.2.5 Mean distance between failures ................................................................................ 68
4.2.6 Specific fuel consumption .......................................................................................... 69
4.2.7 Efficiency .................................................................................................................... 69 4.2.8 Vehicle CAPEX .......................................................................................................... 70
4.2.9 Vehicle OPEX ............................................................................................................ 70
4.3 Descriptive parameters .......................................................................................................... 72
4.4 Data points .............................................................................................................................. 79
4.5 Performance indicators ......................................................................................................... 84
ANNEX A TECHNOLOGY READINESS LEVELS ...............................................88
ANNEX B INCIDENT REPORTING FORMS ........................................................89
ANNEX C CHANGES MADE TO THE DOCUMENT ............................................93
ANNEX D REFERENCES .....................................................................................94
JIVE and MEHRLIN Performance Assessment Handbook
Grant Agreement no. 735582, 26 February 2018 8/94
Index of Figures
Figure 0-1: Overview of the flow and processing of information for the
performance assessment. ....................................................................... 5
Figure 2-1: Overview of the flow and processing of information for the
performance assessment. ..................................................................... 16
Figure 2-2: The data collection and analysis process in JIVE and MEHRLIN. ........ 18
Figure 3-1: Areas covered by the JIVE and MEHRLIN hydrogen refuelling
infrastructure performance assessment. ............................................... 22
Figure 3-2: Sample metering concept for power, natural gas and hydrogen. .......... 28
Index of Tables
Table 3-1: Overview of tables with the descriptive parameters, data points and
(key) performance indicators related to hydrogen refuelling
infrastructure. ........................................................................................ 24
Table 3-2: Key Performance Indicators and performance targets for the
hydrogen refuelling infrastructure in JIVE.............................................. 25
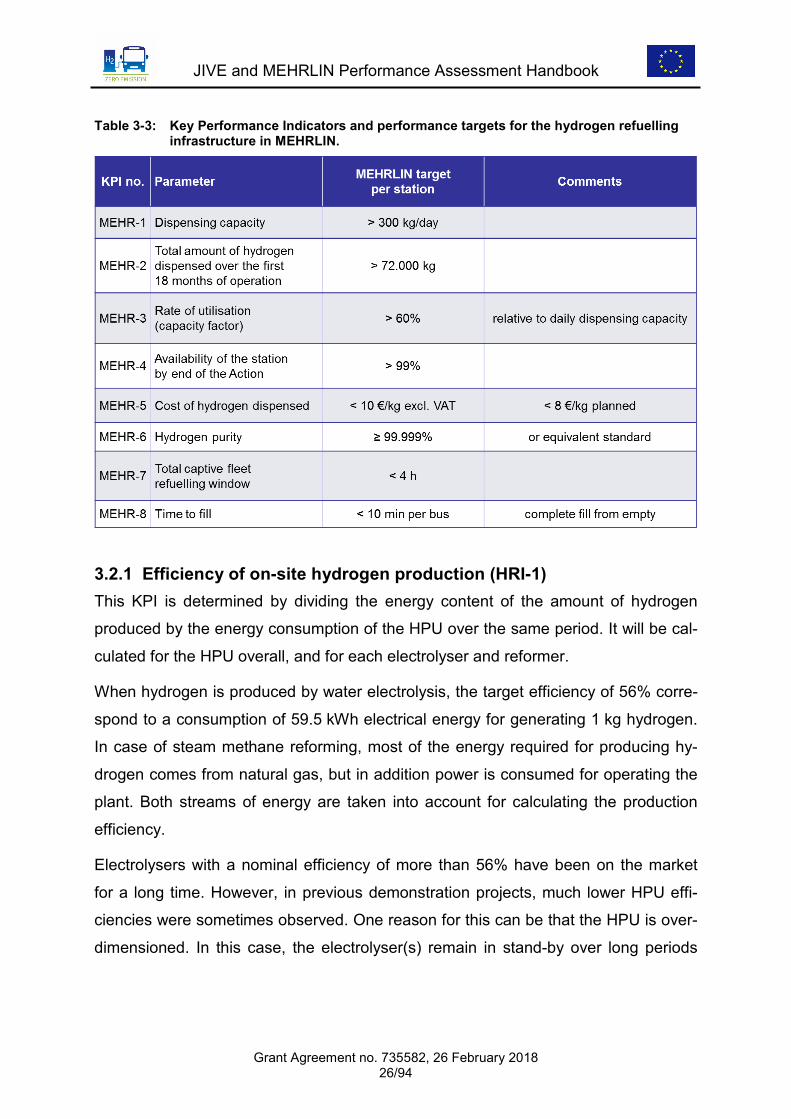
Table 3-3: Key Performance Indicators and performance targets for the
hydrogen refuelling infrastructure in MEHRLIN. .................................... 26
Table 3-4: Descriptive parameters of the HPU (electrolysis) .................................. 35
Table 3-5: Descriptive parameters of the HPU (other production technologies). .... 38
Table 3-6: Descriptive parameters of the HRU. ...................................................... 41
Table 3-7: Descriptive parameters of the external hydrogen delivery .................... 45
Table 3-8: Descriptive parameters of the entire HRS. ............................................ 46
Table 3-9: Data points for the technical monitoring of the HPU. ............................. 48
Table 3-10: Data points for the technical monitoring of the HRU. ............................ 50
Table 3-11: Data points for the technical monitoring of external hydrogen
delivery. ................................................................................................. 53
Table 3-12: Data points for the technical monitoring of the entire HRS. ................... 54
Table 3-13: Data points for the financial monitoring of the HRS. .............................. 55
Table 3-14: Performance indicators of the HPU. ...................................................... 58
Table 3-15: Performance indicators of the HRU. ...................................................... 60
Table 3-16: Performance indicators of the HRS. ...................................................... 63
JIVE and MEHRLIN Performance Assessment Handbook
Grant Agreement no. 735582, 26 February 2018 9/94
Table 4-1: Overview of tables with the descriptive parameters, data points and
(key) performance indicators related to the buses. ............................... 66
Table 4-2: Key Performance Indicators and performance targets for the fuel cell
buses. ................................................................................................... 66
Table 4-3: Descriptive parameters of the FC buses. .............................................. 72
Table 4-4: Descriptive parameters of the reference buses. .................................... 76
Table 4-5: Data points for monitoring FC bus operation. ........................................ 79
Table 4-6: Data points for monitoring FC bus refuelling and recharging. ............... 81
Table 4-7: Data points for monitoring reference bus operation. ............................. 82
Table 4-8: Performance indicators of FC bus operation. ........................................ 84
Table 4-9: Performance indicators of FC bus refuelling. ........................................ 86
Table 4-10: Performance indicators of reference bus operation. .............................. 86

JIVE and MEHRLIN Performance Assessment Handbook
Grant Agreement no. 735582, 26 February 2018 10/94
List of Abbreviations and Terms
RB Reference Bus
CAPEX CAPital EXpenditure
CEF Connecting Europe Facility
CHIC Clean Hydrogen in European Cities, project co-funded
by the FCH JU under the 7th Framework Programme
CUTE Clean Urban Transport for Europe,
project co-funded by the EU under the 5th Framework Programme
DoA Description of the Action (formerly Description of Work / DoW)
EU European Union
FC Fuel Cell
FCB Fuel Cell Bus
FCH JU Fuel Cells and Hydrogen Joint Undertaking,
first phase of the FCH JU under the EU 6th and 7th Framework
Programme; abbreviation also commonly used for the FCH 2 JU
FCH 2 JU Fuel Cells and Hydrogen 2 Joint Undertaking,
second phase of the FCH JU under the EU Horizon 2020 Framework
Programme
FP Framework Programme
H2 Hydrogen
HIAD Hydrogen Incidents and Accidents Database
High V.LO City Cities Speeding up the Integration of Hydrogen Buses in Public
Fleets, project co-funded by the FCH JU under the 7th FP
HPU Hydrogen Production Unit
HRU Hydrogen Refuelling Unit
HRS Hydrogen Refuelling Station (also referred to as
Hydrogen Refuelling Infrastructure or Hydrogen Infrastructure)
HyFleet:CUTE Hydrogen for Clean Urban Transport in Europe,
project co-funded by the EU under the 6th Framework Programme

JIVE and MEHRLIN Performance Assessment Handbook
Grant Agreement no. 735582, 26 February 2018 11/94
HyTransit European Hydrogen Transit Buses in Scotland,
project co-funded by the FCH JU under the 7th FP
INEA Innovation and Networks Executive Agency
JRC Joint Research Centre of the European Commission
kWh kilowatt-hour
LHV Lower Heating Value (for hydrogen: 33.33 kWh/kg)
Nm3 Normal cubic metre (1 m3 of dry gas at 1,013 bar absolute and 0°C)
OPEX OPerational EXpenditure
TEN-T Trans-European Transport Network
ULCF Ultra-Low Cold Fill
WP Work Package
JIVE and MEHRLIN Performance Assessment Handbook
Grant Agreement no. 735582, 26 February 2018 12/94
1 Introduction The projects JIVE and MEHRLIN run in parallel and work in close cooperation. JIVE
focuses on the demonstration of fuel cell buses while under MEHRLIN most of the
corresponding hydrogen refuelling facilities are implemented and operated. Both pro-
jects involve analysis tasks based on data collected during the demonstration phase.
In this respect, JIVE concentrates on the technical performance of the stations and
buses, while MEHRLIN focuses on the financial aspects of hydrogen refuelling sta-
tion (HRS) ownership and operation (regarding the JIVE buses but also other vehi-
cles), in particular achieving bankability.
1.1 Objectives of the JIVE project
The main objectives of the JIVE project are:
• Deployment of 139 zero emission fuel cell (FC) buses in 5 EU member states at
unprecedented scale (Germany, UK: 3 regions/cities each; Italy, Latvia, Denmark:
1 city each)
• Advance commercialisation of FC buses through large-scale deployment of vehi-
cles and achieve commercial viability for bus operators by end of project (early
2020s) to minimize/ eliminate need for subsidies
• Collaboration of multiple cities and regions in joint procurement processes in 3
regional clusters, allowing large orders to be placed with single bus suppliers.
Common specifications for the buses are used to unlock economies of scale.
• Empower local and national governments to regulate for zero emission propulsion
for public transport systems The project comprises five work packages (WP):
1. Bus procurement, deployment and operation
2. Infrastructure deployment and operation
3. Monitoring and analysis
4. Dissemination
5. Project management
JIVE and MEHRLIN Performance Assessment Handbook
Grant Agreement no. 735582, 26 February 2018 13/94
1.2 Outline of JIVE work package 3 “Monitoring and analysis”
The WP comprises five tasks:
• Task 3.1 – Data collection and analysis
• Task 3.2 – Analysis of quality of service and stakeholders’ acceptance
• Task 3.3 – Impacts on public health and urban living
• Task 3.4 – Best practice and commercialisation planning
• Task 3.5 – Inputs from the industry panel Objectives of the performance assessment carried out in WP 3 are:
• Develop and implement a data collection strategy and analysis methodology for
the evaluation of the technical, economic and operational performance of FC bus-
es and the deployed hydrogen refuelling infrastructure including a comparison of
FC buses with diesel reference buses (Task 3.1)
• Assess the environmental benefits and social impacts of the deployed technology
e.g. by evaluating the impact of FC bus fleets on public health and urban living
• Capture the lessons learned from implementing and operating large hydrogen bus
fleets for follower and observer cities
• Support the operators with the introduction of FC buses and identify the remaining
key barriers to their future deployment
• Elaborate pathways for the deployment of larger stations and expanding FC bus
fleets.
This document focusses on the data collection and analysis under JIVE Task 3.1.
1.3 Objectives of the MEHRLIN project
The main objective of the MEHRLIN project is to promote, deploy and commercialise
hydrogen as an alternative fuel, hence contributing to the European alternative fuel
implementation strategy. This includes studies with real-pilot deployments at seven
locations in Italy, Germany, the Netherlands and United Kingdom along four Core
Network Corridors of the trans-European Transport Network (TEN-T):
JIVE and MEHRLIN Performance Assessment Handbook
Grant Agreement no. 735582, 26 February 2018 14/94
• North-Sea Mediterranean,
• North Sea Baltic,
• Rhine-Alpine and
• Scandinavian-Mediterranean.
To achieve the overall objective, the specific objectives will be met by implementing
five activities:
1. Deployment of stations
2. Operation of stations
3. Demonstrating the bankability of the stations
4. Dissemination to encourage future deployment
5. Project management
1.4 Outline of the data management in MEHRLIN
Operational and economic data will be collected and examined with the final objec-
tive to demonstrate the bankability of the HRSs. The performance of the stations will
be assessed from a technical, practical and economic perspective. Monitored data
from Activity 2.4 (Data collection) will be summarised into concise reports, setting out
the performance of the stations under this project (Activity 3.1 – Analysis of economic
data; Activity 3.2 – Analysis of technical and practical performance), and extrapolat-
ing the key requirements for the deployment of profitable stations in the future. In ad-
dition, the partners will work with financiers to assess these projects in terms of
accessing conventional infrastructure debt funding and provide a report on the op-
tions for configuring future projects to maximise the debt funding available (Activity
3.3 – Understanding the bankability of the stations).
The assessment of the technical and economic performance of the stations will fulfil
the contractual requirements and follow the joint way with the JIVE monitoring and
analysis work. Thus, synergies between MEHRLIN and JIVE are created, resulting in
comparable and harmonized datasets, and enlarging both projects’ data basis for
generating project results and drawing conclusions, for example regarding the bank-

JIVE and MEHRLIN Performance Assessment Handbook
Grant Agreement no. 735582, 26 February 2018 15/94
ability and commercialisation perspective of hydrogen infrastructure and fuel cell
buses.
1.5 Objective and scope of this document
The Performance Assessment Handbook is the basis of all monitoring and analysis
activities of Task 3.1 in JIVE and Activities 2.4, 3.1 and 3.2 in MEHRLIN. It relies on
the proven assessment frameworks developed in projects such as CUTE/
HyFLEET:CUTE (2001–2009), CHIC (2010–2016) and HyTransit (2013–2018). Thus,
progress can be evaluated using the same or, based on learnings from these pro-
jects, amended parameters. This is an important element, as it also facilitates as-
sessment of technology development progress across the prior projects.
To be able to monitor and assess to which degree target figures are achieved, oper-
ating data need to be collected, compiled, and evaluated on a steady and coherent
basis. The Handbook thus:
• Defines the performance indicators for assessing hydrogen infrastructure and fuel
cell bus performance, also in comparison to reference (ICE) technology, as well as
those of other novel drivetrains (notably long range electric buses).
• Defines the data points required to calculate indicator figures.
• Explains the frequency of data collection and related details.
• Determines the necessary data structures and formats.
• Defines roles and responsibilities for data collection and performance evaluation. When reference is made to the energy content of hydrogen, its lower heating value
(LHV, 33.33 kWh/kg) is referred to throughout in this document, unless otherwise
specified. The reason is that only this share in the hydrogen’s energy content can be
re-converted to mechanical energy for vehicle propulsion.

JIVE and MEHRLIN Performance Assessment Handbook
Grant Agreement no. 735582, 26 February 2018 16/94
2 Performance Assessment Process Section 2.1 outlines the overall performance assessment approach and introduces
key terms. Section 2.2 describes the processes of collecting and evaluating operating
data in more detail.
2.1 Descriptive parameters, data points and performance indica-tors
Figure 2-1 gives an overview of the flow and processing of information.
Figure 2-1: Overview of the flow and processing of information for the performance assess-ment.
2.1.1 Descriptive parameters Descriptive parameters characterise the deployed hardware (e.g., HRS components
and the FC bus), in particular regarding its technical and economic characteristics,
such as the nominal daily range of a FC bus as specified by the manufacturer, or the
nominal pressure and efficiency of an electrolyser etc. The descriptive parameters
are collected usually once for each type of deployed vehicle (FC and diesel reference
JIVE and MEHRLIN Performance Assessment Handbook
Grant Agreement no. 735582, 26 February 2018 17/94
bus) and for the HRS before or at the beginning of the demonstration activities (and
possibly again after any modifications have been made).
The sites forward the list of parameters to the performance assessment team (see
Figure 2-1). Most of the parameters then have to be fed into the TRUST database of
the FCH JU for mandatory documentation purposes. That includes the location of the
HRS, the type of access to the station (public, restricted or private) etc.
Some of the descriptive parameters are also used in the performance assessment,
e.g. to determine the rate of utilisation of a station relative to its design capacity.
The list of descriptive parameters related to the HRS can be found in chapter 3.3 and
those concerning the buses in chapter 4.3.
2.1.2 Operating data and data points The operating data originate from the demonstration activities. They are recorded
regularly, typically daily (e.g., the distance travelled by a bus) or per event (the
amount of hydrogen refuelled to a bus, periods of downtime and the reasons for
downtime etc.).
The individual data points, i.e. the items to be monitored and recorded, are defined in
chapters 3.4 and 4.4.
The sites submit data sets to the performance assessment team on a monthly basis,
using the web based SoFi tool (see section 2.2).
2.1.3 Performance indicators The performance indicator values are calculated using the operating data and select-
ed descriptive parameters. In the following, operating data and descriptive parame-
ters are sometimes referred to as “data” as collective term.
Based on the evaluation, the sites receive feedback, e.g. regarding apparent unex-
pected changes in performance (Figure 2-1). Reports are compiled and distributed
quarterly. Annual figures (per calendar year) are fed into the TRUST database.
2.1.4 Key Performance Indicators The Key Performance Indicators (KPIs) are subsets from the complete lists of bus
and infrastructure performance indicators. For the KPIs, the work programmes of the

JIVE and MEHRLIN Performance Assessment Handbook
Grant Agreement no. 735582, 26 February 2018 18/94
two projects state target figures, such as a minimum efficiency of on-site hydrogen
generation and a maximum fuel consumption of the buses per 100 km travelled.
2.2 Data collection and analysis process
This section further explains how the operating data, generated at the data points,
are handled and analysed. This is also visualised in Figure 2-2.
Figure 2-2: The data collection and analysis process in JIVE and MEHRLIN. Steps 1 to 5 correspond with the structure of section 2.2.
JIVE and MEHRLIN Performance Assessment Handbook
Grant Agreement no. 735582, 26 February 2018 19/94
2.2.1 Data collection at the sites Operational data are collected at each site according to the specifications described
within this document, both for refuelling infrastructure and bus operation, during the
local operating period. It is recommended to establish an automated data collection
system in the HRS and buses that cover the data points described in section 3.4 and
4.4 to the extent possible.
For a consistent data logging, a data collection template will be provided for HRS and
FC bus operational data monitoring, respectively, listing the individual data points to
be recorded, based on the data points listed in this document.
2.2.2 Compilation of monthly datasets and data upload Datasets have to be compiled on a monthly basis and submitted by the 15th of the
following month in the SoFi tool. Templates will be provided for HRS and FC bus da-
ta uploading to support the operators in providing their data in the agreed format
(MS-Excel readable). They will be customized to account for local needs and the da-
ta collection process (e.g., by the operator or automatically by the manufacturer). The
local data collection supervisors are responsible for meeting the timeline and for data
completeness.
Separate from the monthly data reporting routine, incidents with respect to quality
and safety have to be reported whenever they occur. The purpose of incident report-
ing is to communicate critical information in a rapid, concise and standardised man-
ner (see Annex B for the incident reporting templates used in previous projects). The
need for this was a key learning in the first multi-site fuel cell bus demonstration pro-
ject. Incident reports also have to be forwarded to the Institute for Energy and
Transport of the Joint Research Centre (JRC) as the administrator of the Hydrogen
Incidents and Accidents Database (HIAD)1 for the European Commission.
2.2.3 Plausibility check and feedback on data quality When a dataset has been uploaded, a first check is carried out. It comprises com-
pleteness, format, consistency and plausibility, based on specifications implemented
in SoFi by the assessment team together with the project partners.
1 https://odin.jrc.ec.europa.eu/giada/Main.jsp

JIVE and MEHRLIN Performance Assessment Handbook
Grant Agreement no. 735582, 26 February 2018 20/94
If the datasets are complete and all figures are within the expected ranges, an
acknowledgement of receipt is sent out and no further activity is required. Otherwise,
the local data collection supervisor receives an automated feedback in the format of
an e-mail message specifying the encountered out of spec values, missing data etc.
Once a dataset is complete and checked successfully, the data will be imported into
the SoFi database.
2.2.4 Data analysis By the end of the following month, the performance assessment partners analyse the
datasets, calculate the performance indicators and compile the results in tables and
graphs.
The analysis can involve queries to the site in terms of peculiarities in the data that
were not detected in the automated plausibility check under step 3. That may apply
to changes in efficiency, which are striking but still fall within the expected range, for
example.
The analysis is typically carried out per month, per calendar year (required for the
TRUST database in particular), and for the entire operating period up to the latest
completed month, collectively referred to as “evaluation period”.
Some performance indicators are more meaningful on a longer-term basis, so that
monthly figures are not generated. An example is the operational expenditure
(OPEX) per kilogram of hydrogen dispensed that may change from month to month
due to expenditures for annual maintenance or stocking spare parts, as already
touched upon in section 2.1.2.
Any emerging issues with respect to data availability, data quality and the level of
performance will be addressed with the appointed responsible(s) at the affected site
in a conference call or in the next in-person meeting, depending on urgency and se-
verity.
JIVE and MEHRLIN Performance Assessment Handbook
Grant Agreement no. 735582, 26 February 2018 21/94
2.2.5 Results and reports Reports will be available for consortium partners2, the coordinator, the FCH JU and
INEA/CEF project officers, and the public, with varying level of aggregation and
anonymization as needed.
Evaluations will be retrievable online via the SoFi tool for each appointed user at
each site, with access of operators being restricted to own data by individual access
rights. Operators may grant access to further users at their discretion.
Additionally, aggregated results will be made available in the SoFi tool in form of av-
erages, data ranges or benchmarks as appropriate. Potential data sensitivities indi-
cated by a project partner will be addressed with the coordinator/consortium and the
project officer and considered in the reporting as agreed between the partners and
the project officer.
Quarterly Performance Assessment Summaries are foreseen from June 2018 (month
18) onwards (D3.2). Comprehensive Interim and Final Performance Assessment Re-
ports will be compiled (D3.3 in month 42 and D3.4 in month 70).
The quarterly summaries will include projections up to the end of operation, in order
to verify that the KPI targets with respect to hydrogen dispensed, kilometres travelled
etc. can be reached if operation continues as before (see Table 3-2 and Table 4-2 for
these targets).
Findings from the performance monitoring activities will be presented and discussed
in the biannual consortium meetings.
The outcomes of the assessment activities will also serve as input for
• the analysis work in the other tasks of WP 3 in JIVE
• progressive performance improvement activities of the operators as part of Tasks
1.4 (Operation and maintenance of the buses) and 2.2 (Operation and mainte-
nance of the stations) in JIVE
• Activities 2 and 3 in MEHRLIN and
• dissemination in both projects. 2 Regarding the HRS, this includes the partners from the MEHRLIN project.

JIVE and MEHRLIN Performance Assessment Handbook
Grant Agreement no. 735582, 26 February 2018 22/94
3 Hydrogen Refuelling Infrastructure
3.1 Introduction
In terms of the performance assessment, the hydrogen refuelling infrastructure con-
sists of four areas:
• On-site hydrogen production in the HPU (Hydrogen Production Unit),
• Hydrogen compression, storage, and dispensing in the HRU (Hydrogen Refuelling
Unit),
• External hydrogen delivery, and
• Aspects related to operation of the entire HRS (Hydrogen Refuelling Station). Figure 3-1 shows a generalised schematic of a hydrogen infrastructure facility.
Figure 3-1: Areas covered by the JIVE and MEHRLIN hydrogen refuelling infrastructure per-formance assessment.
Generalised schema. There may be separate storage banks, e.g. for 350 and 700 bar refuelling, and extra dispensers for refuelling cars. Additional battery charging/ conditioning that may be implemented at individual sites is not included here.

JIVE and MEHRLIN Performance Assessment Handbook
Grant Agreement no. 735582, 26 February 2018 23/94
Hydrogen is generated on site from electricity or natural gas and water in the HPU, or
supplied from external sources. It is compressed, stored and dispensed on demand
to the buses by the HRU. Dispensing requires a pressure differential between the on-
site storage and the vehicle tanks (decanting). Depending on the design of the sta-
tion, filling may have to be completed with a booster compressor (not included in Fig-
ure 3-1). The compressor charging the station storage and the one for completing the
filling can be the same physical unit that is able to operate in different modes.
All sites in JIVE and MEHRLIN have a Station Unit, but not all have implemented a
Production Unit for on-site generation of hydrogen. Hence, a separate consideration
of the Station and Production Unit is of key significance for the purpose of perfor-
mance assessment. Also in day-to-day operation, it is important that they can run
independent of each other so that, in the event of Production Unit failure, refuelling of
the buses can be ensured by backup external hydrogen delivery.
Table 3-1 provides an overview of this chapter in terms of tables that it contains.
It starts with the descriptive parameters related to the four areas of refuelling infra-
structure analysis (Table 3-4 to Table 3-8). A further distinction is made between
electrolysis-based and non-electrolysis-based production technologies. The parame-
ter identifiers are defined accordingly:
• HPU-PE stands for “Hydrogen Production Unit, Parameter Electrolysis”,
• HPU-PO for “Hydrogen Production Unit, Parameter Other Production technolo-
gies”,
• EXT-P for “External Hydrogen Delivery, Parameter”, and
• HRS-P for the entire HRS.
The data point identifiers are kept in line with the “Infrastructure Data Points Specifi-
cation” document that was circulated among the JIVE and MEHRLIN partners in Feb-
ruary 2017 (Table 3-9 to Table 3-12). Only the financial data points have been
removed from these tables and compiled into new Table 3-13, together with a num-
ber of new items to account for the requirements of the economic analysis in MEHR-
LIN.
The performance indicators labelling follows an approach similar to that for the de-
scriptive parameters (Table 3-14 to Table 3-16):

JIVE and MEHRLIN Performance Assessment Handbook
Grant Agreement no. 735582, 26 February 2018 24/94
• HPU-I for indicators related to the HPU,
• HRU-I for indicators related to the HRU, and
• HRS-I for indicators related to the entire HRS.
Table 3-1 ends with the KPIs. They are a subset of the performance indicators, as
explained in the preceding chapter.3
Due to their importance, the KPIs are detailed first, in the following sub-section 3.2.
Next are the descriptive parameters (section 3.3), the data points (section 3.4) and
the complete list of performance indicators (section 3.5).
Battery charging and/or conditioning, which may be implemented at individual sites,
is included in the tables of descriptive parameters, data points and performance in-
dictors in terms of costs induced, power consumption and revenue generated.
Table 3-1: Overview of tables with the descriptive parameters, data points and (key) perfor-mance indicators related to hydrogen refuelling infrastructure.
Groups of Items (and Identifier)
Hydrogen Production Unit
Hydrogen Refuelling
Unit
External Hydrogen Delivery
Entire Hydrogen Refuelling
Station Electrolysis Other Technologies
Descriptive Parameters
Table 3-4 (HPU-PE.xx)
Table 3-5 (HPU-PO.xx)
Table 3-6 (HRU-P.xx)
Table 3-7 (EXT-P.xx)
Table 3-8 (HRS-P.xx)
Technical Data Points
Table 3-9 (1.xx)
Table 3-10 (2.xx)
Table 3-11 (3.xx)
Table 3-12 (4.xx)
Financial Data Points
Table 3-13 (5.xx)
Performance Indicators including KPIs
Table 3-14 (HPU-I.xx)
Table 3-15 (HRU-I.xx)
None Table 3-16 (HRS-I.xx)
KPIs Table 3-2 (JIVE) and Table 3-3 (MEHRLIN)
(HRI-x and MEHR-y)
3 Therefore, a regular performance that is also a KPI in both projects gets three identifiers: One for
being a regular performance indicator (HPU-I.xx, HRU-I.xx or HPS-I.xx), one for being a KPI in JIVE (HRI-x) and one for being a KPI in MEHRLIN (MEHR-y).

JIVE and MEHRLIN Performance Assessment Handbook
Grant Agreement no. 735582, 26 February 2018 25/94
3.2 Key Performance Indicators
Table 3-2 and Table 3-3 list the KPIs in JIVE and MEHRLIN respectively. Table 3-2
also includes the targets from the FCH JU’s 2016 Annual Work Plan that some of the
JIVE targets are based on.
Comparison of the tables reveals that while the KPIs of the two projects overlap, the
related target levels usually do not coincide. For example, the availability of the sta-
tion (meaning the HRU) is a KPI in both JIVE and MEHRLIN. The JIVE target is to
reach 98% availability with aspirations to achieve more than 99%. More than 99% is
also the target in MEHRLIN, however only to be reached towards the completion of
the project, while the JIVE target applies for the complete demonstration phase after
a teething period of up to six months.
MEHR-1 is a KPI not related to performance in operation but requires a minimum
nominal dispensing capacity.
The KPIs related to infrastructure operation are explained in the following.
Table 3-2: Key Performance Indicators and performance targets for the hydrogen refuelling infrastructure in JIVE.
JIVE and MEHRLIN Performance Assessment Handbook
Grant Agreement no. 735582, 26 February 2018 26/94
Table 3-3: Key Performance Indicators and performance targets for the hydrogen refuelling infrastructure in MEHRLIN.
3.2.1 Efficiency of on-site hydrogen production (HRI-1) This KPI is determined by dividing the energy content of the amount of hydrogen
produced by the energy consumption of the HPU over the same period. It will be cal-
culated for the HPU overall, and for each electrolyser and reformer.
When hydrogen is produced by water electrolysis, the target efficiency of 56% corre-
spond to a consumption of 59.5 kWh electrical energy for generating 1 kg hydrogen.
In case of steam methane reforming, most of the energy required for producing hy-
drogen comes from natural gas, but in addition power is consumed for operating the
plant. Both streams of energy are taken into account for calculating the production
efficiency.
Electrolysers with a nominal efficiency of more than 56% have been on the market
for a long time. However, in previous demonstration projects, much lower HPU effi-
ciencies were sometimes observed. One reason for this can be that the HPU is over-
dimensioned. In this case, the electrolyser(s) remain in stand-by over long periods

JIVE and MEHRLIN Performance Assessment Handbook
Grant Agreement no. 735582, 26 February 2018 27/94
while still consuming some electricity. During periods with capacity factors4 lower
than 10% to 15%, stand-by losses strongly affect performance, potentially resulting in
monthly efficiency values less than 50%, as observed at some sites in the CHIC pro-
ject [Stolzenburg/Graham 2016]5. Therefore, the JIVE target is defined for periods
with capacity factors higher than 20%.
As also observed in CHIC, the electrolysers integrated into buildings seemed to per-
form some 2% to 4% better on average than those installed in containers. This can
be explained by the fact that containerised units usually receive all energy via one
single power plug, including e.g. for lighting and heating, which are not genuinely part
of the production process and result in reduced efficiency values. This needs to be
considered when comparing and assessing numbers from various sites.
A good metering concept is required in any case. It must ensure that the efficiency of
hydrogen production can be determined per electrolyser and reformer, respectively.
To this end, power and natural gas consumption need to be metered individually as
well as the amount of hydrogen produced should be recorded per unit. Equally im-
portant, consumption for lighting and heating should not captured by these meters,
as mentioned.
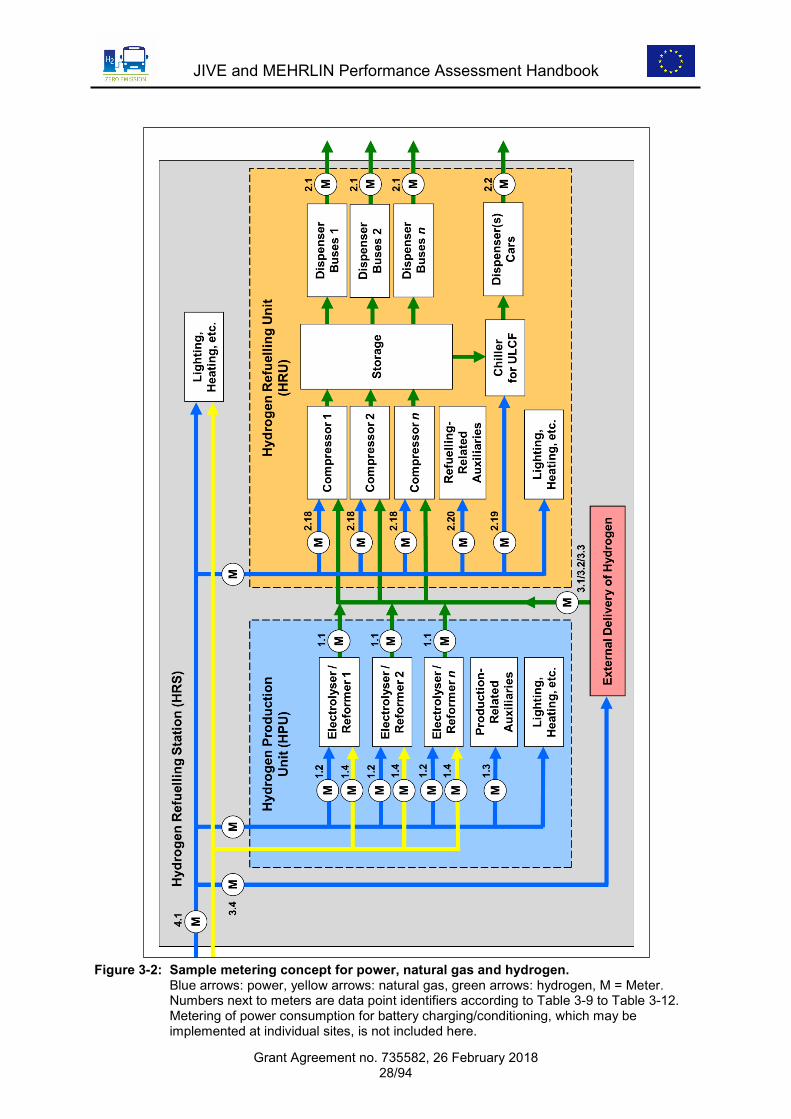
A sample metering concept for the overall refuelling facility can be found in Figure
3-2. It includes power, natural gas and hydrogen, and shows data point identifiers
according to Table 3-9 to Table 3-12 in section 3.4 (same numbering as in the data
points document of February).
4 The capacity factor is a measure of the rate of utilisation of a system. If a unit were to be operated 24
hours per day at rated capacity during its lifetime, its capacity factor would be 100%. 5 The reason for this under-utilisation in the CHIC project was the building in of over-capacities to al-
low for redundancy in the case of equipment failure or to consider a future enlargement of fleet size. Moreover, the fuel economy of the buses improved greatly, which reduced the daily hydrogen de-mand. It was not clear at the beginning of the project that the specific fuel consumption per kilometre travelled would be more than halved compared with previous trials.
JIVE and MEHRLIN Performance Assessment Handbook
Grant Agreement no. 735582, 26 February 2018 28/94
Figure 3-2: Sample metering concept for power, natural gas and hydrogen. Blue arrows: power, yellow arrows: natural gas, green arrows: hydrogen, M = Meter.
Numbers next to meters are data point identifiers according to Table 3-9 to Table 3-12. Metering of power consumption for battery charging/conditioning, which may be implemented at individual sites, is not included here.
JIVE and MEHRLIN Performance Assessment Handbook
Grant Agreement no. 735582, 26 February 2018 29/94
The individual local metering concept may differ from what is shown in Figure 3-2:
• There may just one hydrogen purifier for several or for all electrolysers or reform-
ers, to reduce the investment. In that case, there may be just one meter per purifi-
er. This, however, will not facilitate determining the amounts of hydrogen
generated per electrolyser/reformer.
• The hydrogen produced by electrolysers often is not actually metered but calculat-
ed by the PLC of the electrolyser from current and voltage readings using a pro-
prietary algorithm that also takes into account hydrogen losses in the purifier. In
this case (assuming that these figures can be considered sufficiently accurate),
separate mass flow meters may not be required.
• When the electrolysers, reformers and/or compressors are not building-integrated
but containerised, they are likely to have just one power plug, so that electricity
consumption for lighting and space heating cannot be separated that for the genu-
inely hydrogen-related processes, as mentioned.
• Determining the amount of hydrogen supplied from external sources can also be
based on delivery notes. However, if “normal” or “standard” cubic meters are stat-
ed there, the assumed ambient temperature needs to be taken into account care-
fully.
For water, only one meter is required. It should be placed upstream the water purifier
to capture not just the water split it the electrolyser or reformer but also the amount
lost due to purification.
3.2.2 Efficiency of the complete on-site hydrogen supply chain (HRI-2) This KPI accounts for the energy consumption of the HRU in addition to that of the
HPU, in order to determine the efficiency of the complete on-site supply chain from
power and natural gas arriving at the facility to hydrogen dispensed. It is only mean-
ingful for sites with exclusive on-site generation. (Periods of occasional external
backup delivery of hydrogen can be excluded, but a regular “mixed” supply of on-site
and external hydrogen supply will make it impossible to determine this KPI).
Again, a good metering concept is key to arrive at meaningful indicator figures that
do not include e.g. energy consumption for heating and lighting. At sites with refuel-
ling of cars in addition to buses, the power consumption for ultra-low cold fill devices
JIVE and MEHRLIN Performance Assessment Handbook
Grant Agreement no. 735582, 26 February 2018 30/94
(ULCF, see Figure 3-2) that facilitate their fast refuelling needs to be excluded, too,
or rather be captured by a separate meter, because ULCF units are energy intensive.
In CHIC, the efficiency figures for complete on-site hydrogen supply chains were ap-
proximately 3% lower than those for hydrogen generation only. Therefore, meeting
the target of more than 51% efficiency along the complete chain should be no prob-
lem as long as the 56% target for the HPU is met.
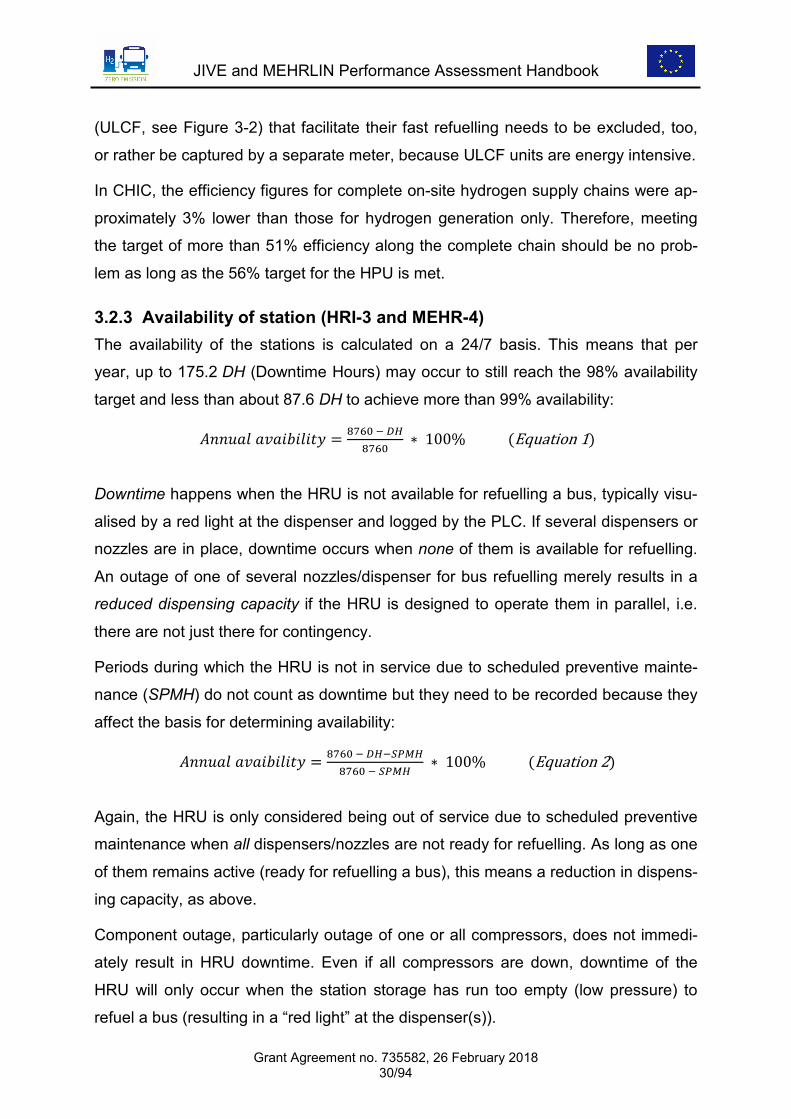
3.2.3 Availability of station (HRI-3 and MEHR-4) The availability of the stations is calculated on a 24/7 basis. This means that per
year, up to 175.2 DH (Downtime Hours) may occur to still reach the 98% availability
target and less than about 87.6 DH to achieve more than 99% availability:
𝐴𝐴𝐴𝐴𝐴𝐴𝐴𝐴𝐴𝐴𝐴𝐴 𝐴𝐴𝑎𝑎𝐴𝐴𝑎𝑎𝑎𝑎𝑎𝑎𝐴𝐴𝑎𝑎𝑎𝑎𝑎𝑎 = 8760 − 𝐷𝐷𝐷𝐷8760
∗ 100% (Equation 1)
Downtime happens when the HRU is not available for refuelling a bus, typically visu-
alised by a red light at the dispenser and logged by the PLC. If several dispensers or
nozzles are in place, downtime occurs when none of them is available for refuelling.
An outage of one of several nozzles/dispenser for bus refuelling merely results in a
reduced dispensing capacity if the HRU is designed to operate them in parallel, i.e.
there are not just there for contingency.
Periods during which the HRU is not in service due to scheduled preventive mainte-
nance (SPMH) do not count as downtime but they need to be recorded because they
affect the basis for determining availability:
𝐴𝐴𝐴𝐴𝐴𝐴𝐴𝐴𝐴𝐴𝐴𝐴 𝐴𝐴𝑎𝑎𝐴𝐴𝑎𝑎𝑎𝑎𝑎𝑎𝐴𝐴𝑎𝑎𝑎𝑎𝑎𝑎 = 8760 − 𝐷𝐷𝐷𝐷−𝑆𝑆𝑆𝑆𝑆𝑆𝐷𝐷8760 − 𝑆𝑆𝑆𝑆𝑆𝑆𝐷𝐷
∗ 100% (Equation 2)
Again, the HRU is only considered being out of service due to scheduled preventive
maintenance when all dispensers/nozzles are not ready for refuelling. As long as one
of them remains active (ready for refuelling a bus), this means a reduction in dispens-
ing capacity, as above.
Component outage, particularly outage of one or all compressors, does not immedi-
ately result in HRU downtime. Even if all compressors are down, downtime of the
HRU will only occur when the station storage has run too empty (low pressure) to
refuel a bus (resulting in a “red light” at the dispenser(s)).
JIVE and MEHRLIN Performance Assessment Handbook
Grant Agreement no. 735582, 26 February 2018 31/94
Availability of the HPU is monitored following the same methodology but this perfor-
mance indicator is not a KPI (i.e. no target figures exists). From the HRU’s perspec-
tive, the HPU is a component just like a compressor. Therefore, downtime of the
HPU will not immediately result in downtime of the HRU (only if the storage runs
empty because the HPU remains down for some time and backup external delivery
cannot be activated quick enough).
In CHIC and the ongoing HyTransit project, the target for HRU availability is 98%.
The majority of the CHIC sites surpassed it or was very close to meeting it. All CHIC
sites scored more than 94%. The average availability of the station in HyTransit was
99.4% by end of 2017.
Scheduled preventive maintenance did constitute downtime in CHIC. Even so, down-
time for this cause was negligible at most sites, thanks to good maintenance con-
cepts, in line with a fully modular design of a station that allows maintenance of
dispensers, compressors largely on a one-by-one basis instead of having to switch
off the entire facility. Elsewhere, up to 1.5% availability were lost for a week of annual
maintenance or for regular monthly maintenance.
As in previous trials, the most prominent reason for downtime in CHIC were failures
of hydrogen compressors. This happened even though most sites had built-in redun-
dancy with two units installed in parallel, while the capacity of one unit would have
been sufficient to supply the daily fuel demand. If there had been no downtime
caused by hydrogen compressors, all sites would have achieved 97.7% average
availability at least.
Difficulties with compressors were avoided at one of the sites by external hydrogen
delivery at high pressure, above the rated tank pressure of the buses, so that filling of
the buses could be achieved without compression at the station being required.
3.2.4 Amount of hydrogen dispensed to project buses (HRI-4 and MEHR-2) and Rate of utilisation (MEHR-3)
This KPI is straightforwardly calculated by summing up all bus fills over the evalua-
tion period, such as a month, a year or the entire demonstration period. In JIVE (KPI
HRI-4), the target is to dispense more than 4,500 kg to each bus per year. In MEHR-
LIN (KPI MEHR-2), more than 72,000 kg shall be dispensed per site over the first 1.5
years of operation. Moreover, in MEHRLIN the daily rate of utilisation is targeted to
JIVE and MEHRLIN Performance Assessment Handbook
Grant Agreement no. 735582, 26 February 2018 32/94
surpass 60% (KPI MEHR-3). Therefore, a station with a nominal capacity of 350 kg/d
is expected to dispense more than 210 kg/d.
3.2.5 Speed of dispensing (HRI-5), Time to fill (MEHR-8) and Total captive fleet refuelling window (MEHR-7)
The speed of dispensing is determined by dividing the amount of hydrogen refuelled
by the time that it took to refuel this amount (“time to fill”) for each refuelling event.
The JIVE target is to dispense faster than 3 kg/min on average across all fills during
the evaluation period (KPI HRI-5) while MEHRLIN requires a time to fill from empty to
completely full in less than 10 minutes (MEHR-8). At a speed of 3 kg/min, 30 kg hy-
drogen can be dispensed during 10 min. In addition, KPI MEHR-7 sets the window
for refuelling the complete bus fleet to a maximum of 4 hours, thereby capping wait-
ing times between two fills.
There are two ways of looking at the time to fill:
• A. Time to fill can be the entire refuelling procedure, from swiping an RFID card (or
similar) at the dispenser after arriving at the station up to the moment when the
station terminates the filling process and signals this. This is the perspective of a
bus operator.
• B. Time to fill can be the filling process only. Before the refuelling process starts,
the PLC of the station will first explore the status of the bus tank via communica-
tion with the vehicle (infrared interface between nozzle and receptacle or data ca-
ble) and/or via sending a hydrogen pulse into the tank and evaluating pressure
response. After the, it will start the filling process as such. This is the technical
perspective, e.g. for determining the actual gas flow rate (g/sec or kg/min).
Both are of interest. The difference between the two periods can be more than one
minute. Option A, the more challenging one, used to be requested by the FCH JU for
its TEMONAS database. This will also be the prime focus of the assessment in JIVE,
in order to facilitate an easy comparison with the findings in CHIC and HyTransit.
The dispensing equipment allowed a maximum gas flow rate of 120 g H2 per second.
This corresponds to 7.2 kg H2/min. However, the actual momentary and average flow
rate depends on the constantly changing pressure differential between station stor-
age and bus tank. It is also influenced by the refuelling protocol that the manufacturer
applies, by the capacity of the station storage (including the size and number of
JIVE and MEHRLIN Performance Assessment Handbook
Grant Agreement no. 735582, 26 February 2018 33/94
banks it has) and of the bus tank, by temperature, and by whether or not the station
receives information on the status of the bus tank. While the maximum flow rate of
7.2 kg H2/min may be reached at some point during a fill, the average across a com-
plete filling event will be much smaller than this figure.
Based on the results from CHIC and HyTransit, it seems to be certain that the JIVE
target of dispensing faster than 3 kg/min can hardly be reached without data commu-
nication between station and bus. The average speed of dispensing in the two pro-
jects ranges from 2.1 kg/min to 2.8 kg/min.
3.2.6 Cost of hydrogen dispensed (HRI-6 and MEHR-5) The JIVE target is to keep the specific costs per unit of hydrogen dispensed below
9 €/kg (excl. taxes) by end of project. The MEHRLIN target is to achieve less than
10 €/kg with aspirations to undercut 8 €/kg.
Contributions to overall costs come from the depreciation of the facility (resulting from
capital expenditure; CAPEX), and from fixed and variable operational expenditure
(OPEX). The former two can be kept low by intensely utilising the plant, spreading
the expenditure across many unit of hydrogen dispensed. Variable OPEX are domi-
nated by the energy feedstock, namely power in case of (on-site) electrolysis. As-
suming an efficiency of the on-site hydrogen supply chain of 51% (target for KPI HRI-
2) and a price of 0.10 €/kWh, 6.54 €/kg hydrogen result, which is more than two-
thirds of the 9 €/kg maximum. Lower variable cost may be achieved via methane
steam reforming or buying by-product hydrogen.
In CHIC, there was a target for the specific OPEX only: Less than 10 €/kg hydrogen
dispensed at the start of the demonstration phase and less than 5 €/kg during or to-
wards the end of the project. However, this could not be achieved by any of the sites
and, in fact, OPEX of up to 20 €/kg were encountered. The reasons include high
prices for power (up to 0.17 €/kWh) and low capacity factors (smaller than 25% on
average).
HyTransit has the same 10 €/kg OPEX target. In 2017, the station in this project was
rather close to meeting it at an average capacity factor of about 50%.

JIVE and MEHRLIN Performance Assessment Handbook
Grant Agreement no. 735582, 26 February 2018 34/94
3.2.7 Hydrogen purity (HRI-7 and MEHR-6) Hydrogen will be dispensed in compliance with SAE J2719 “Hydrogen Fuel Quality
for Fuel Cell Vehicles”, thereby securing a hydrogen purity of 99.999%, which is the
target level in both projects, and avoiding any critical contaminants. Assurance will be
made the responsibility of suppliers via contract. All stations need to be designed
with sufficient filtration to avoid the risk of contamination from working fluids or other
contaminants that could arise within the station. On-site electrolysers and reformers
need to be compliant by design as well. Hydrogen from external sources has to come
with a quality certificate for each delivery.
Since analysis is complex and costly, hydrogen samples will only be taken and ana-
lysed if a quality problem is suspected despite the technical and organisational pre-
cautions. Any such event will be recorded and assessed via the incident reporting
system (see section 2.1.2 and Annex B).
The purity of hydrogen has not been an issue in CHIC and HyTransit, except for a
very small number of incidents in CHIC.

JIVE and MEHRLIN Performance Assessment Handbook
Grant Agreement no. 735582, 26 February 2018 35/94
3.3 Descriptive parameters
The parameters characterising the hydrogen refuelling infrastructure can be found in the following set of tables.
• On-site hydrogen production using electrolysis (Table 3-4),
• On-site hydrogen production using other production technologies (Table 3-5),
• Hydrogen compression, storage, and dispensing in the HRU (Table 3-6), and
• External delivery of hydrogen (Table 3-7).
The descriptive parameters only have to be supplied once, by the start of operation, or again after modifications to the plant. Most of
them are requested for the TRUST database of the FCH JU. Some will also be used for the performance assessment in JIVE and/or
MEHRLIN. For example, the nominal dispensing capacity (descriptive parameter HRU-P.28 in Table 3-6) is required for determining the
capacity factor of the HRU, which is a performance indicator (Table 3-15 in section 3.5).
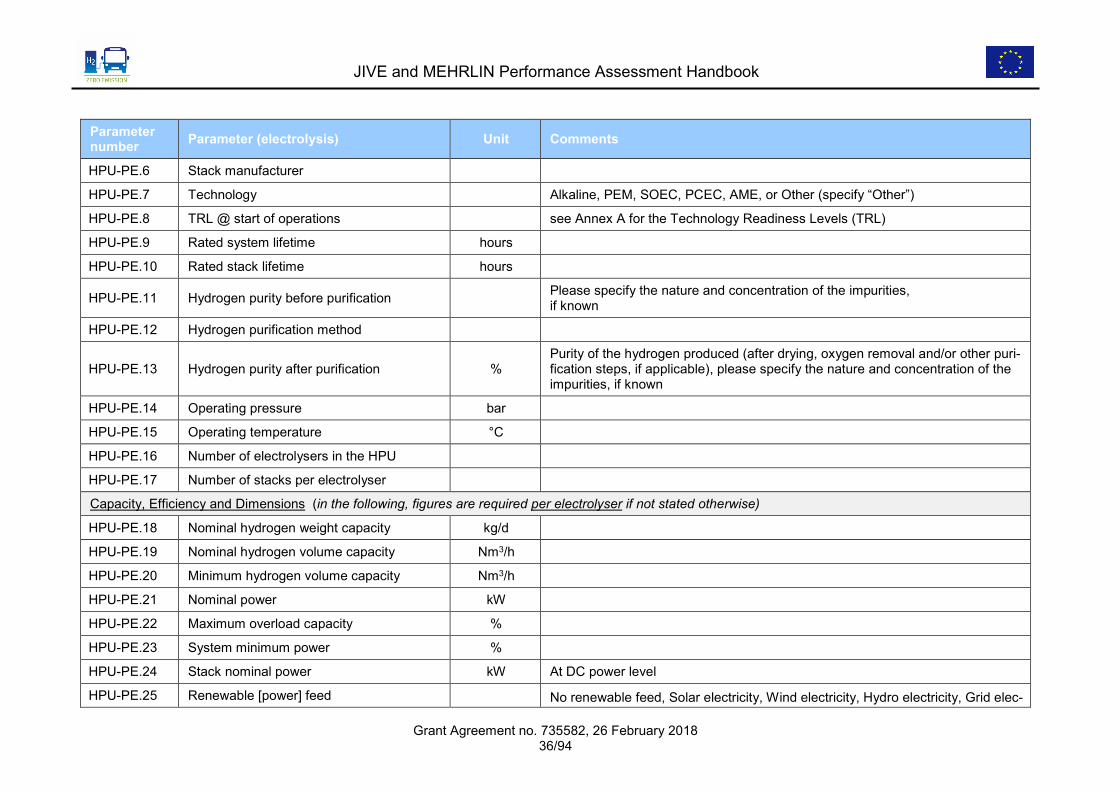
Table 3-4: Descriptive parameters of the HPU (electrolysis) HPU-PE = Hydrogen Production Unit, Parameter Electrolysis.
Parameter number Parameter (electrolysis) Unit Comments
General information
HPU-PE.1 Country
HPU-PE.2 Town
HPU-PE.3 Postcode
HPU-PE.4 Deployment date dd/mm/yyyy Date at which the production unit was first put in operation
HPU-PE.5 Electrolyser manufacturer
JIVE and MEHRLIN Performance Assessment Handbook
Grant Agreement no. 735582, 26 February 2018 36/94
Parameter number Parameter (electrolysis) Unit Comments
HPU-PE.6 Stack manufacturer
HPU-PE.7 Technology Alkaline, PEM, SOEC, PCEC, AME, or Other (specify “Other”)
HPU-PE.8 TRL @ start of operations see Annex A for the Technology Readiness Levels (TRL)
HPU-PE.9 Rated system lifetime hours
HPU-PE.10 Rated stack lifetime hours
HPU-PE.11 Hydrogen purity before purification Please specify the nature and concentration of the impurities, if known
HPU-PE.12 Hydrogen purification method
HPU-PE.13 Hydrogen purity after purification % Purity of the hydrogen produced (after drying, oxygen removal and/or other puri-fication steps, if applicable), please specify the nature and concentration of the impurities, if known
HPU-PE.14 Operating pressure bar
HPU-PE.15 Operating temperature °C
HPU-PE.16 Number of electrolysers in the HPU
HPU-PE.17 Number of stacks per electrolyser
Capacity, Efficiency and Dimensions (in the following, figures are required per electrolyser if not stated otherwise)
HPU-PE.18 Nominal hydrogen weight capacity kg/d
HPU-PE.19 Nominal hydrogen volume capacity Nm3/h
HPU-PE.20 Minimum hydrogen volume capacity Nm3/h
HPU-PE.21 Nominal power kW
HPU-PE.22 Maximum overload capacity %
HPU-PE.23 System minimum power %
HPU-PE.24 Stack nominal power kW At DC power level
HPU-PE.25 Renewable [power] feed No renewable feed, Solar electricity, Wind electricity, Hydro electricity, Grid elec-

JIVE and MEHRLIN Performance Assessment Handbook
Grant Agreement no. 735582, 26 February 2018 37/94
Parameter number Parameter (electrolysis) Unit Comments
tricity accompanied by green certificates, Biomass/biogas, and/or Other (specify “Other)
HPU-PE.26 Fraction of renewable [power] feed %
HPU-PE.27 Power converter AC/DC, DC/DC, No converter, or Other (specify “Other”)
HPU-PE.28 Input voltage V
HPU-PE.29 Power usage of auxiliary equipment in standby kW
HPU-PE.30 Power usage of auxiliary equipment at nominal capacity kW
HPU-PE.31 Rated stack electrical efficiency (HHV, DC current) %
HPU-PE.32 Rated system electrical efficiency (HHV, AC current) %
HPU-PE.33 Transient response time seconds Average time to ramp up from 30% to 100% load at nominal power and operat-ing temperature
HPU-PE.34 Time from standby to nominal capacity seconds Time required to reach the nominal hydrogen output rate operating capacity (HPU-PE.19) when starting the electrolyser from stand-by mode (system al-ready at operating temperature)
HPU-PE.35 Time from standby to nominal power seconds Time required to reach the nominal power (HPU-PE.21) when starting the elec-trolyser from stand-by mode (system already at operating temperature)
HPU-PE.36 Time from cold start to nominal capacity seconds Time required to reach the nominal hydrogen output rate operating capacity (HPU-PE.19) when starting the electrolyser from shutdown mode
HPU-PE.37 Time from cold start to nominal power seconds Time required to reach the nominal power (HPU-PE.21) when starting the elec-trolyser from shutdown mode
HPU-PE.38 Electrolyser footprint m2
HPU-PE.39 Electrolyser volume m3
HPU-PE.40 Nominal water consumption by the stack litres/Nm3

JIVE and MEHRLIN Performance Assessment Handbook
Grant Agreement no. 735582, 26 February 2018 38/94
Parameter number Parameter (electrolysis) Unit Comments
HPU-PE.41 Nominal water consumption overall litres/Nm3 Including losses resulting from water purification
Financial
HPU-PE.42 Specific manufacturing costs €/kW Actual cost of system manufacturing per kW of nominal power (labour, materi-als, utilities), or purchase price, excluding land costs, overheads, VAT and other taxes
HPU-PE.43 Electrolyser price €
Price of the transaction between the electrolyser manufacturer and the electro-lyser buyer. Any grant amount should not be accounted for here (price before any rebates, grants etc.). Exclude HRU. Exclude VAT. Regarding procurement cost, cost of land and civil works, depreciation period and cost of capital see Table 3-8.
Table 3-5: Descriptive parameters of the HPU (other production technologies). HPU-PO = Hydrogen Production Unit, Parameter Other production technologies.
Parameter number Parameter (other prod. technologies) Unit Comments
General information
HPU-PO.1 Country
HPU-PO.2 Town
HPU-PO.3 Postcode
HPU-PO.4 Deployment date dd/mm/yyyy Date at which the production unit was first put in operation
HPU-PO.5 Manufacturer
HPU-PO.6 Hydrogen production method
HPU-PO.7 Description of the production unit
HPU-PO.8 Target application

JIVE and MEHRLIN Performance Assessment Handbook
Grant Agreement no. 735582, 26 February 2018 39/94
Parameter number Parameter (other prod. technologies) Unit Comments
HPU-PO.9 TRL @ start of operations see Annex A for the Technology Readiness Levels
HPU-PO.10 Hydrogen feedstock
HPU-PO.11.1 Main energy source
HPU-PO.11.2 Specific energy content kWh/Nm3 Lower heating value under normal conditions
HPU-PO.12 Secondary energy input/parasitic losses
HPU-PO.13 Catalyst(s)
HPU-PO.14 Rated system lifetime hours
HPU-PO.15 Hydrogen purity before purification % Please specify the nature and concentration of the impurities, if known
HPU-PO.16 Hydrogen purification method
HPU-PO.17 Hydrogen purity after purification % Purity of the hydrogen produced (after drying, oxygen removal and/or other puri-fication steps, if applicable), please specify the nature and concentration of the impurities, if known
HPU-PO.18 Operating pressure bar
HPU-PO.19 Operating temperature °C
HPU-PO.20 Number of production devices (such as stacks or reformers tubes) within the HPU
Capacity, Efficiency and Dimensions (in the following, figures are required per production device if not stated otherwise.)
HPU-PO.21 Nominal hydrogen weight capacity kg/d
HPU-PO.22 Nominal hydrogen volume capacity Nm3/h
HPU-PO.23 Minimum hydrogen volume capacity Nm3/h
HPU-PO.24 Nominal power kW With respect to “Main energy source” / HPU-PO.11, such as natural gas
HPU-PO.25 Maximum overload capacity % With respect to “Main energy source”
HPU-PO.26 Minimum power % With respect to “Main energy source”

JIVE and MEHRLIN Performance Assessment Handbook
Grant Agreement no. 735582, 26 February 2018 40/94
Parameter number Parameter (other prod. technologies) Unit Comments
HPU-PO.27 Nominal power kW With respect to “Secondary energy input” / HPU-PO.12
HPU-PO.28 Nominal electric power kW If not covered above (main or second energy source)
HPU-PO.29 Electricity origin Solar, Wind, Hydro-electric, Grid, and/or Other (specify “Other”)
HPU-PO.30 Nominal conversion thermal efficiency % With respect to “Main energy source”
HPU-PO.31 Nominal conversion total efficiency % With respect to all energy consumption
HPU-PO.32 Time from standby to nominal capacity seconds Time required to reach the nominal hydrogen output rate operating capacity (HPU-PO.22) when starting the electrolyser from stand-by mode (system already at operating temperature)
HPU-PO.33 Time from cold start to nominal capacity seconds Time required to reach the nominal hydrogen output rate operating capacity (HPU-PO.22) when starting the electrolyser from shutdown mode
HPU-PO.34 Footprint of hydrogen production unit m2
HPU-PO.35 Volume of hydrogen production unit m3
HPU-PO.36 Nominal water consumption by the stack litres/Nm3
HPU-PO.37 Nominal water consumption overall litres/Nm3 Including losses resulting from water purification
Financial
HPU-PO.38 Specific manufacturing costs today € Per tonne of production capacity per day
HPU-PO.39 Specific manufacturing costs – Estimated @ mass production € Per tonne of production capacity per day
HPU-PO.40 Price for the hydrogen production unit €
Price of the transaction between the manufacturer and the buyer. Any grant amount should not be accounted for here (price before any rebates, grants etc.). Exclude HRU. Exclude VAT. Regarding procurement cost, cost of land and civil works, depreciation period and cost of capital see Table 3-8.
JIVE and MEHRLIN Performance Assessment Handbook
Grant Agreement no. 735582, 26 February 2018 41/94
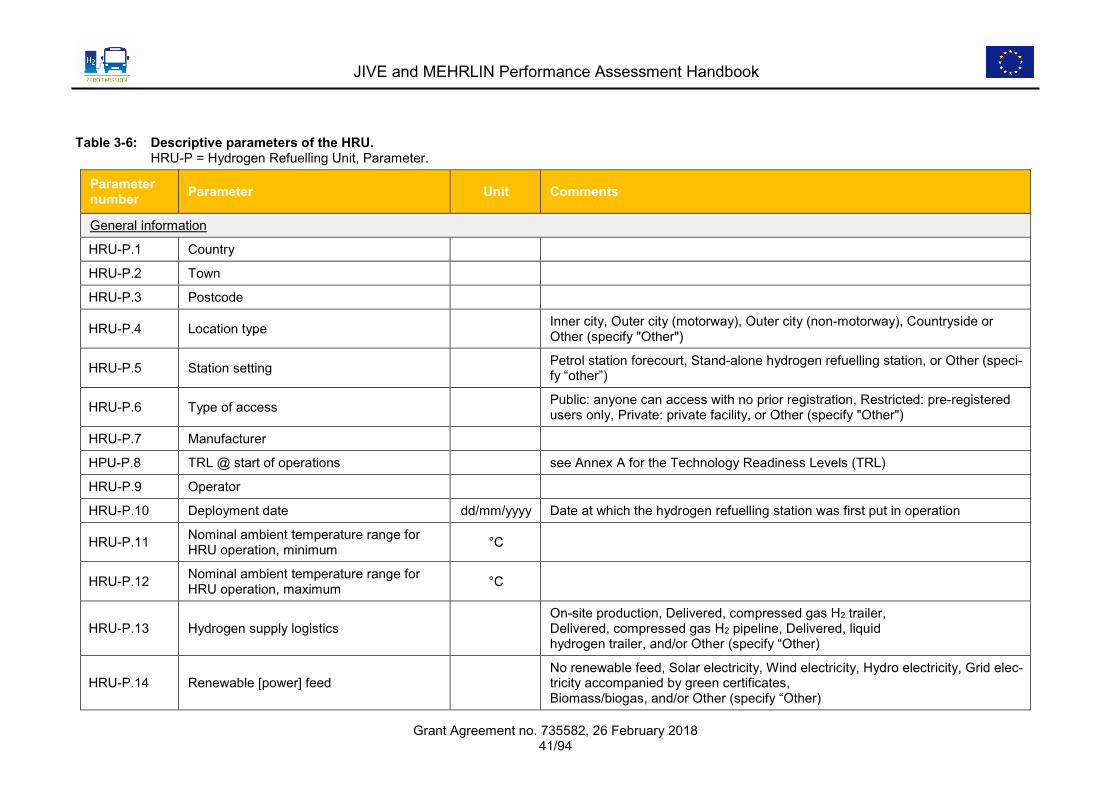
Table 3-6: Descriptive parameters of the HRU. HRU-P = Hydrogen Refuelling Unit, Parameter.
Parameter number Parameter Unit Comments
General information
HRU-P.1 Country
HRU-P.2 Town
HRU-P.3 Postcode
HRU-P.4 Location type Inner city, Outer city (motorway), Outer city (non-motorway), Countryside or Other (specify "Other")
HRU-P.5 Station setting Petrol station forecourt, Stand-alone hydrogen refuelling station, or Other (speci-fy “other”)
HRU-P.6 Type of access Public: anyone can access with no prior registration, Restricted: pre-registered users only, Private: private facility, or Other (specify "Other")
HRU-P.7 Manufacturer
HPU-P.8 TRL @ start of operations see Annex A for the Technology Readiness Levels (TRL)
HRU-P.9 Operator
HRU-P.10 Deployment date dd/mm/yyyy Date at which the hydrogen refuelling station was first put in operation
HRU-P.11 Nominal ambient temperature range for HRU operation, minimum °C
HRU-P.12 Nominal ambient temperature range for HRU operation, maximum °C
HRU-P.13 Hydrogen supply logistics On-site production, Delivered, compressed gas H2 trailer, Delivered, compressed gas H2 pipeline, Delivered, liquid hydrogen trailer, and/or Other (specify “Other)
HRU-P.14 Renewable [power] feed No renewable feed, Solar electricity, Wind electricity, Hydro electricity, Grid elec-tricity accompanied by green certificates, Biomass/biogas, and/or Other (specify “Other)
JIVE and MEHRLIN Performance Assessment Handbook
Grant Agreement no. 735582, 26 February 2018 42/94
Parameter number Parameter Unit Comments
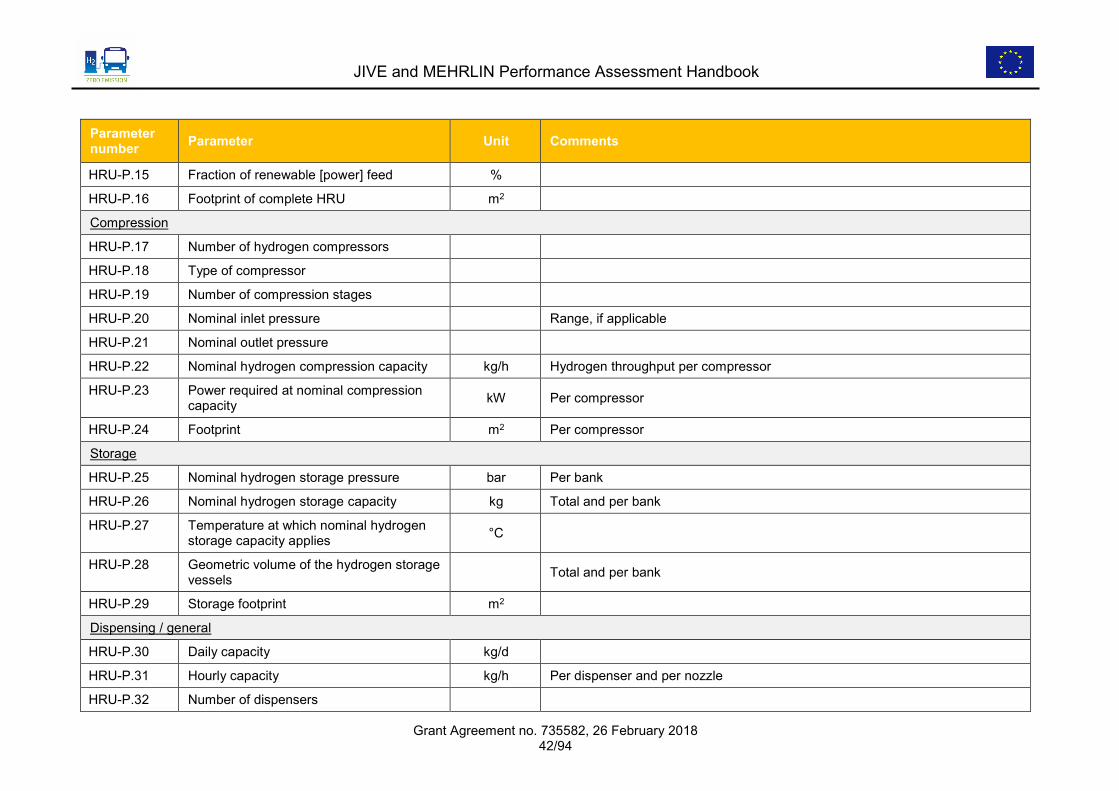
HRU-P.15 Fraction of renewable [power] feed %
HRU-P.16 Footprint of complete HRU m2
Compression
HRU-P.17 Number of hydrogen compressors
HRU-P.18 Type of compressor
HRU-P.19 Number of compression stages
HRU-P.20 Nominal inlet pressure Range, if applicable
HRU-P.21 Nominal outlet pressure
HRU-P.22 Nominal hydrogen compression capacity kg/h Hydrogen throughput per compressor
HRU-P.23 Power required at nominal compression capacity kW Per compressor
HRU-P.24 Footprint m2 Per compressor
Storage
HRU-P.25 Nominal hydrogen storage pressure bar Per bank
HRU-P.26 Nominal hydrogen storage capacity kg Total and per bank
HRU-P.27 Temperature at which nominal hydrogen storage capacity applies °C
HRU-P.28 Geometric volume of the hydrogen storage vessels Total and per bank
HRU-P.29 Storage footprint m2
Dispensing / general
HRU-P.30 Daily capacity kg/d
HRU-P.31 Hourly capacity kg/h Per dispenser and per nozzle
HRU-P.32 Number of dispensers
JIVE and MEHRLIN Performance Assessment Handbook
Grant Agreement no. 735582, 26 February 2018 43/94
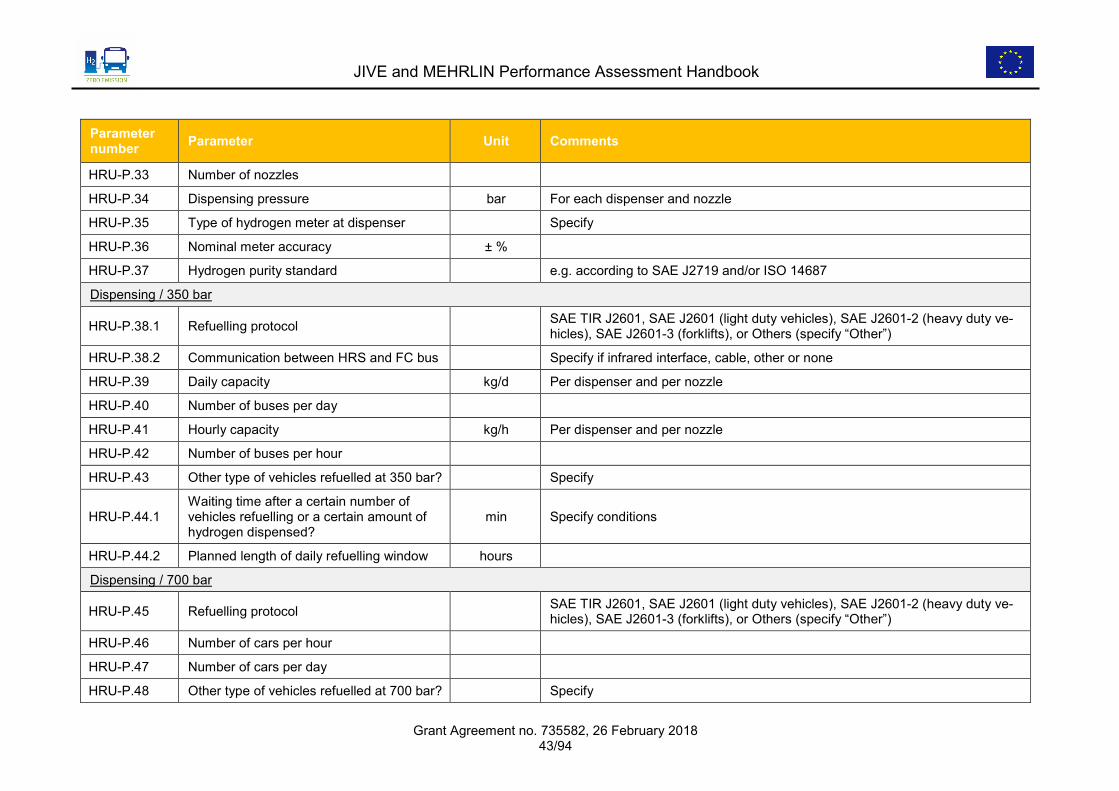
Parameter number Parameter Unit Comments
HRU-P.33 Number of nozzles
HRU-P.34 Dispensing pressure bar For each dispenser and nozzle
HRU-P.35 Type of hydrogen meter at dispenser Specify
HRU-P.36 Nominal meter accuracy ± %
HRU-P.37 Hydrogen purity standard e.g. according to SAE J2719 and/or ISO 14687
Dispensing / 350 bar
HRU-P.38.1 Refuelling protocol SAE TIR J2601, SAE J2601 (light duty vehicles), SAE J2601-2 (heavy duty ve-hicles), SAE J2601-3 (forklifts), or Others (specify “Other”)
HRU-P.38.2 Communication between HRS and FC bus Specify if infrared interface, cable, other or none
HRU-P.39 Daily capacity kg/d Per dispenser and per nozzle
HRU-P.40 Number of buses per day
HRU-P.41 Hourly capacity kg/h Per dispenser and per nozzle
HRU-P.42 Number of buses per hour
HRU-P.43 Other type of vehicles refuelled at 350 bar? Specify
HRU-P.44.1 Waiting time after a certain number of vehicles refuelling or a certain amount of hydrogen dispensed?
min Specify conditions
HRU-P.44.2 Planned length of daily refuelling window hours
Dispensing / 700 bar
HRU-P.45 Refuelling protocol SAE TIR J2601, SAE J2601 (light duty vehicles), SAE J2601-2 (heavy duty ve-hicles), SAE J2601-3 (forklifts), or Others (specify “Other”)
HRU-P.46 Number of cars per hour
HRU-P.47 Number of cars per day
HRU-P.48 Other type of vehicles refuelled at 700 bar? Specify
JIVE and MEHRLIN Performance Assessment Handbook
Grant Agreement no. 735582, 26 February 2018 44/94
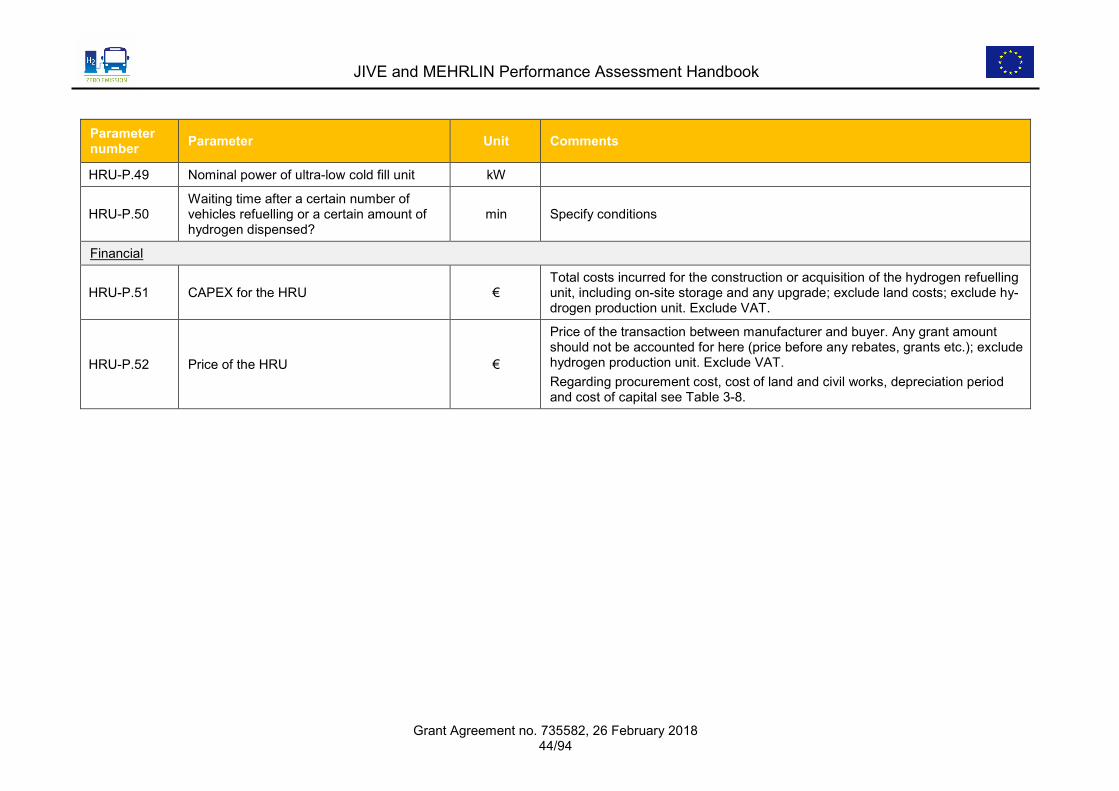
Parameter number Parameter Unit Comments
HRU-P.49 Nominal power of ultra-low cold fill unit kW
HRU-P.50 Waiting time after a certain number of vehicles refuelling or a certain amount of hydrogen dispensed?
min Specify conditions
Financial
HRU-P.51 CAPEX for the HRU € Total costs incurred for the construction or acquisition of the hydrogen refuelling unit, including on-site storage and any upgrade; exclude land costs; exclude hy-drogen production unit. Exclude VAT.
HRU-P.52 Price of the HRU €
Price of the transaction between manufacturer and buyer. Any grant amount should not be accounted for here (price before any rebates, grants etc.); exclude hydrogen production unit. Exclude VAT. Regarding procurement cost, cost of land and civil works, depreciation period and cost of capital see Table 3-8.

JIVE and MEHRLIN Performance Assessment Handbook
Grant Agreement no. 735582, 26 February 2018 45/94
Table 3-7: Descriptive parameters of the external hydrogen delivery EXT-P = External Hydrogen Delivery, Parameter.
Parameter number Parameter Unit Comments
Regular delivery (exclusive fuel supply or in parallel to on-site generation)
EXT-P.1 Mode of delivery Gaseous/road, liquid/road and/or gaseous/pipeline
EXT-P.2 On-board or pipeline pressure bar
EXT-P.3 Road delivery: Typical amount per trailer kg
EXT-P.4 Road delivery: Nominal power for on-board pressurisation/evaporation kW
EXT-P.5 Pipeline delivery: min. and max. rate kg/h
EXT-P.6 Hydrogen source Specify (e.g. central steam methane reformer, by-product from chlor-alkali elec-trolysis, …)
EXT-P.7 Distance H2 production source to station km
Backup delivery (in case of an outage of on-site generation and/or regular external delivery)
EXT-P.8 Mode of delivery Gaseous/road and/or liquid/road
EXT-P.9 On-board pressure bar
EXT-P.10 Typical amount per trailer kg
EXT-P.11 Road delivery: Nominal power for on-board pressurisation/evaporation kW
EXT-P.12 Hydrogen source Specify (as under EXT-P.6)
Financial
EXT-P.13
Price of equipment related to external hydrogen delivery (If not included in the HRU investment in the preceding table.)
€
Price of the transaction between the manufacturer and the buyer. Any grant amount should not be accounted for here (price before any rebates, grants etc.). Exclude VAT. Regarding procurement cost, cost of land and civil works, depreciation period and cost of capital see Table 3-8.

JIVE and MEHRLIN Performance Assessment Handbook
Grant Agreement no. 735582, 26 February 2018 46/94
Table 3-8: Descriptive parameters of the entire HRS. HRS-P = Hydrogen Refueling Station, Parameter.
Parameter number Parameter Unit Comments
General information
HRS-P.1 Overall footprint m2 Footprint (enclosure) of the complete HRS with HPU, HRU, and space for exter-nal hydrogen delivery, incl. for parking of trailers
Financial (CAPEX items as far as not included in the preceding tables and grand total investment; always excluding VAT)
HRS-P.2 Procurement cost € e.g. for procurement preparation, feasibility, tendering
HRS-P.3 Land cost € If land is bought, incurring CAPEX; otherwise see Table 3-13 (OPEX)
HRS-P.4 Civil works cost (incl. engineering) € Total costs for civil works, including engineering, authorisation process etc.
HRS-P.5 Other investment cost € For electricity supply infrastructure for the conditioning of fuel cells overnight, for electricity supply infrastructure for battery charging in range extender buses or external BEV, etc.
HRS-P.6 Grand total investment for the HRS € Including all items for HPU, HRU, external hydrogen delivery and overarching costs
HRS-P.7 Depreciation period years
HRS-P.8 Cost of capital % Interest rate paid or assumed for financing the investment

JIVE and MEHRLIN Performance Assessment Handbook
Grant Agreement no. 735582, 26 February 2018 47/94
3.4 Data points
The data points can be found in the following set of tables, grouped in line with Table 3-1:
• On-site hydrogen production in the HPU (Table 3-9),
• Hydrogen compression, storage, and dispensing in the HRU (Table 3-10),
• External delivery of hydrogen (Table 3-11)
• Aspects related to technical performance of the entire HRS (Table 3-12), and
• Aspects related to financial performance of the HRS (Table 3-13). The data points have to be sampled regularly. The periods and level of detail (such as “Daily and per electrolyser unit”) can be found in
the “Frequency of Collection” columns of the tables. The data points are required for the performance assessment in JIVE and/or
MEHRLIN, and many of them also for the TRUST database of the FCH JU.
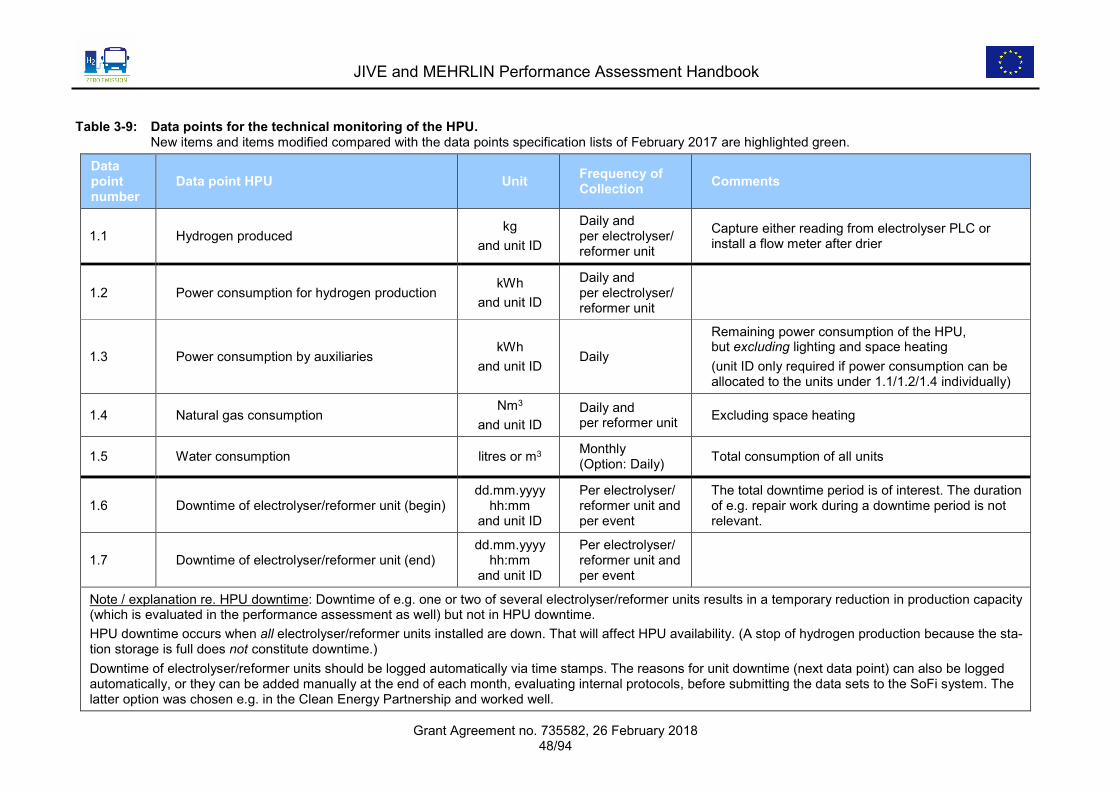
JIVE and MEHRLIN Performance Assessment Handbook
Grant Agreement no. 735582, 26 February 2018 48/94
Table 3-9: Data points for the technical monitoring of the HPU. New items and items modified compared with the data points specification lists of February 2017 are highlighted green.
Data point number
Data point HPU Unit Frequency of Collection Comments
1.1 Hydrogen produced kg
and unit ID
Daily and per electrolyser/ reformer unit
Capture either reading from electrolyser PLC or install a flow meter after drier
1.2 Power consumption for hydrogen production kWh
and unit ID
Daily and per electrolyser/ reformer unit
1.3 Power consumption by auxiliaries kWh
and unit ID Daily
Remaining power consumption of the HPU, but excluding lighting and space heating (unit ID only required if power consumption can be allocated to the units under 1.1/1.2/1.4 individually)
1.4 Natural gas consumption Nm3
and unit ID Daily and per reformer unit Excluding space heating
1.5 Water consumption litres or m3 Monthly (Option: Daily) Total consumption of all units
1.6 Downtime of electrolyser/reformer unit (begin) dd.mm.yyyy
hh:mm and unit ID
Per electrolyser/ reformer unit and per event
The total downtime period is of interest. The duration of e.g. repair work during a downtime period is not relevant.
1.7 Downtime of electrolyser/reformer unit (end) dd.mm.yyyy
hh:mm and unit ID
Per electrolyser/ reformer unit and per event
Note / explanation re. HPU downtime: Downtime of e.g. one or two of several electrolyser/reformer units results in a temporary reduction in production capacity (which is evaluated in the performance assessment as well) but not in HPU downtime. HPU downtime occurs when all electrolyser/reformer units installed are down. That will affect HPU availability. (A stop of hydrogen production because the sta-tion storage is full does not constitute downtime.) Downtime of electrolyser/reformer units should be logged automatically via time stamps. The reasons for unit downtime (next data point) can also be logged automatically, or they can be added manually at the end of each month, evaluating internal protocols, before submitting the data sets to the SoFi system. The latter option was chosen e.g. in the Clean Energy Partnership and worked well.
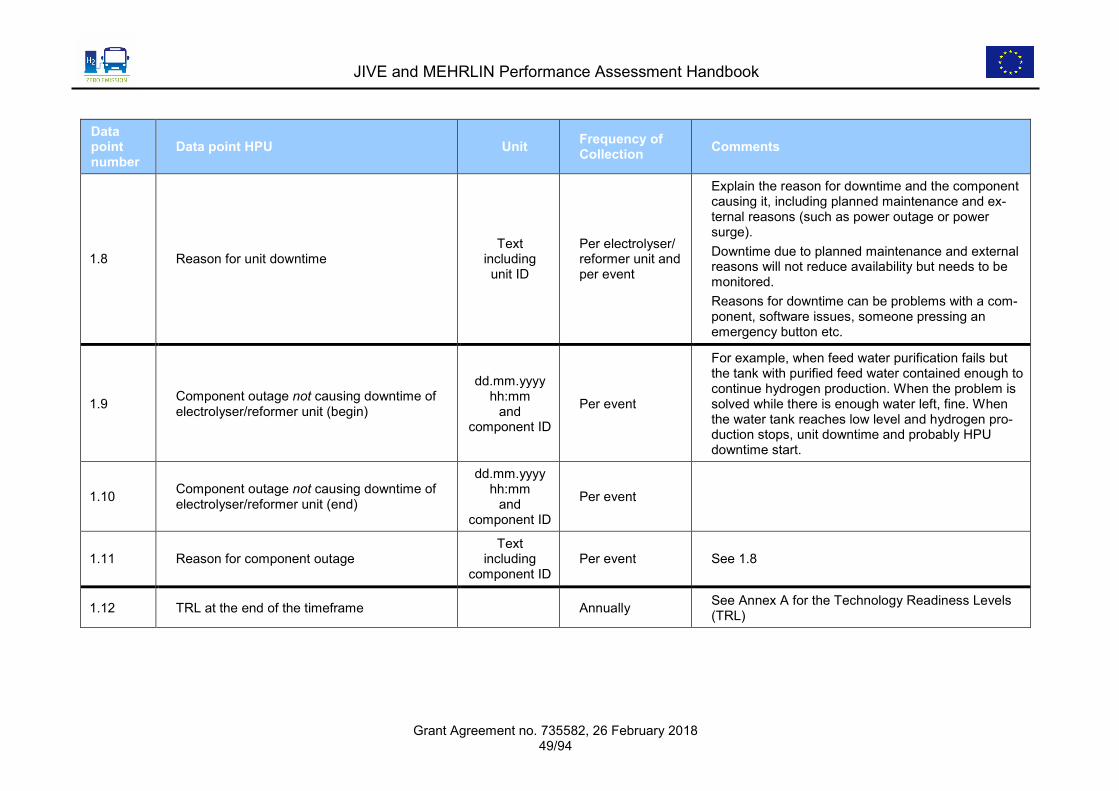
JIVE and MEHRLIN Performance Assessment Handbook
Grant Agreement no. 735582, 26 February 2018 49/94
Data point number
Data point HPU Unit Frequency of Collection Comments
1.8 Reason for unit downtime Text
including unit ID
Per electrolyser/ reformer unit and per event
Explain the reason for downtime and the component causing it, including planned maintenance and ex-ternal reasons (such as power outage or power surge). Downtime due to planned maintenance and external reasons will not reduce availability but needs to be monitored. Reasons for downtime can be problems with a com-ponent, software issues, someone pressing an emergency button etc.
1.9 Component outage not causing downtime of electrolyser/reformer unit (begin)
dd.mm.yyyy hh:mm
and component ID
Per event
For example, when feed water purification fails but the tank with purified feed water contained enough to continue hydrogen production. When the problem is solved while there is enough water left, fine. When the water tank reaches low level and hydrogen pro-duction stops, unit downtime and probably HPU downtime start.
1.10 Component outage not causing downtime of electrolyser/reformer unit (end)
dd.mm.yyyy hh:mm
and component ID
Per event
1.11 Reason for component outage Text
including component ID
Per event See 1.8
1.12 TRL at the end of the timeframe Annually See Annex A for the Technology Readiness Levels (TRL)

JIVE and MEHRLIN Performance Assessment Handbook
Grant Agreement no. 735582, 26 February 2018 50/94
Table 3-10: Data points for the technical monitoring of the HRU. New items and items modified compared with the data points specification lists of February 2017 are highlighted green.
Data point number
Data point HRU Unit Frequency of Collection Comments
2.1 Hydrogen refuelled to project buses kg For each fill
2.2 Hydrogen refuelled to other vehicles kg For each fill For correct hydrogen balancing (amounts entering and leaving the HRU), and for determining the rate of utilisation.
2.3 Station ID code For each fill
2.4 Dispenser ID code For each fill
2.5 Vehicle ID code For each fill Not required for non-project vehicles in case of confidentiality issues.
2.6 Vehicle odometer reading km For each fill For project buses only. Via data communication from the bus or typed in manually by the person refuelling.
Note / explanation regarding data points related to “Time to fill” below: There are two ways of looking at the time to fill: A. Time to fill can be the entire refuelling procedure, from arrival at the station and swiping an RFID card (or similar) at the dispenser up to the moment when the station terminates the filling process and signals this. This is the perspective of a bus operator. B. Time to fill can be the filling process only. Before the refuelling process starts, the PLC of the station will first explore the status of the bus tank via communi-cation with the vehicle (infrared interface between nozzle and receptacle or data cable) and/or via sending a hydrogen pulse into the tank and evaluating pres-sure response. After the, it will start the filling process as such. This is the technical perspective, e.g. for determining the actual gas flow rate (g/sec or kg/min). Both are of interest. The difference between the two periods can be more than one minute. Option “A” is requested by the FCH JU for its TRUST (formerly TEMONAS) database. From previous projects, it seems to be certain that the JIVE target of dispensing faster than 3 kg/min can hardly be reached without data communication be-tween station and bus.
2.7 Duration of the filling procedure (start) [“A” above]
dd.mm.yyyy hh:mm:ss For each fill For project buses only.
2.8 Duration of the filling procedure (end) dd.mm.yyyy hh:mm:ss For each fill For project buses only.
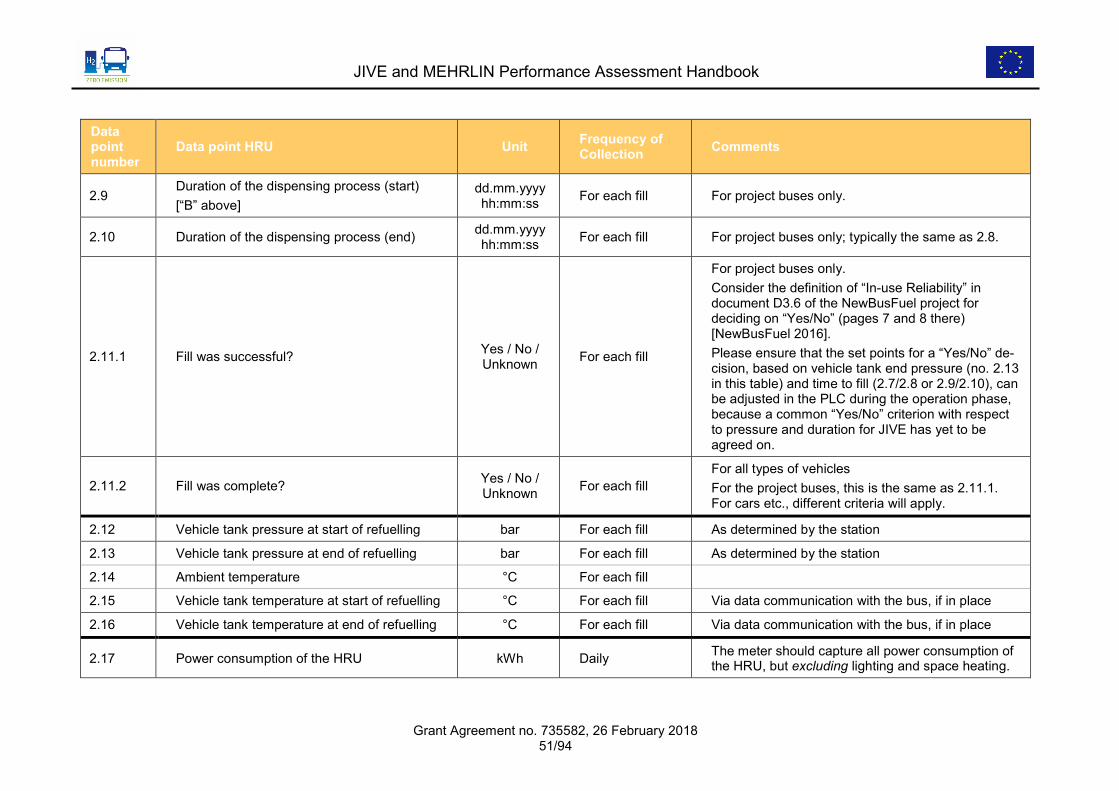
JIVE and MEHRLIN Performance Assessment Handbook
Grant Agreement no. 735582, 26 February 2018 51/94
Data point number
Data point HRU Unit Frequency of Collection Comments
2.9 Duration of the dispensing process (start) [“B” above]
dd.mm.yyyy hh:mm:ss For each fill For project buses only.
2.10 Duration of the dispensing process (end) dd.mm.yyyy hh:mm:ss For each fill For project buses only; typically the same as 2.8.
2.11.1 Fill was successful? Yes / No / Unknown For each fill
For project buses only. Consider the definition of “In-use Reliability” in document D3.6 of the NewBusFuel project for deciding on “Yes/No” (pages 7 and 8 there) [NewBusFuel 2016]. Please ensure that the set points for a “Yes/No” de-cision, based on vehicle tank end pressure (no. 2.13 in this table) and time to fill (2.7/2.8 or 2.9/2.10), can be adjusted in the PLC during the operation phase, because a common “Yes/No” criterion with respect to pressure and duration for JIVE has yet to be agreed on.
2.11.2 Fill was complete? Yes / No / Unknown For each fill
For all types of vehicles For the project buses, this is the same as 2.11.1. For cars etc., different criteria will apply.
2.12 Vehicle tank pressure at start of refuelling bar For each fill As determined by the station
2.13 Vehicle tank pressure at end of refuelling bar For each fill As determined by the station
2.14 Ambient temperature °C For each fill
2.15 Vehicle tank temperature at start of refuelling °C For each fill Via data communication with the bus, if in place
2.16 Vehicle tank temperature at end of refuelling °C For each fill Via data communication with the bus, if in place
2.17 Power consumption of the HRU kWh Daily The meter should capture all power consumption of the HRU, but excluding lighting and space heating.
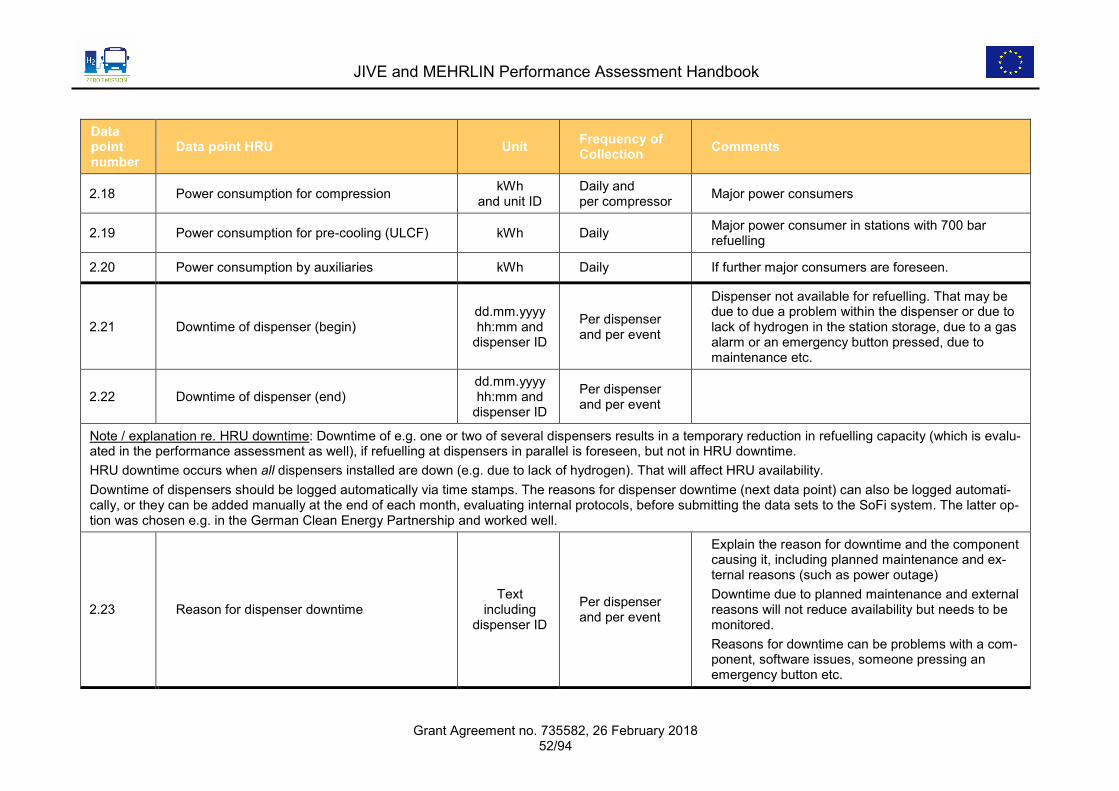
JIVE and MEHRLIN Performance Assessment Handbook
Grant Agreement no. 735582, 26 February 2018 52/94
Data point number
Data point HRU Unit Frequency of Collection Comments
2.18 Power consumption for compression kWh and unit ID
Daily and per compressor Major power consumers
2.19 Power consumption for pre-cooling (ULCF) kWh Daily Major power consumer in stations with 700 bar refuelling
2.20 Power consumption by auxiliaries kWh Daily If further major consumers are foreseen.
2.21 Downtime of dispenser (begin) dd.mm.yyyy hh:mm and
dispenser ID
Per dispenser and per event
Dispenser not available for refuelling. That may be due to due a problem within the dispenser or due to lack of hydrogen in the station storage, due to a gas alarm or an emergency button pressed, due to maintenance etc.
2.22 Downtime of dispenser (end) dd.mm.yyyy hh:mm and
dispenser ID
Per dispenser and per event
Note / explanation re. HRU downtime: Downtime of e.g. one or two of several dispensers results in a temporary reduction in refuelling capacity (which is evalu-ated in the performance assessment as well), if refuelling at dispensers in parallel is foreseen, but not in HRU downtime. HRU downtime occurs when all dispensers installed are down (e.g. due to lack of hydrogen). That will affect HRU availability. Downtime of dispensers should be logged automatically via time stamps. The reasons for dispenser downtime (next data point) can also be logged automati-cally, or they can be added manually at the end of each month, evaluating internal protocols, before submitting the data sets to the SoFi system. The latter op-tion was chosen e.g. in the German Clean Energy Partnership and worked well.
2.23 Reason for dispenser downtime Text
including dispenser ID
Per dispenser and per event
Explain the reason for downtime and the component causing it, including planned maintenance and ex-ternal reasons (such as power outage) Downtime due to planned maintenance and external reasons will not reduce availability but needs to be monitored. Reasons for downtime can be problems with a com-ponent, software issues, someone pressing an emergency button etc.

JIVE and MEHRLIN Performance Assessment Handbook
Grant Agreement no. 735582, 26 February 2018 53/94
Data point number
Data point HRU Unit Frequency of Collection Comments
2.24 Component outage not causing dispenser downtime (begin)
dd.mm.yyyy hh:mm and
component ID
Per event and per component
For example, when one or even all compressors fail, this is just a component outage as long as there is enough hydrogen in the station storage to refuel an-other bus (i.e. dispenser(s) not down). (Compressor problems, even though not always causing down-time, have been a major concern in previous pro-jects.)
2.25 Component outage not causing dispenser downtime (end)
dd.mm.yyyy hh:mm and
component ID Per event
2.26 Reason for component outage Text
including component ID
Per event See 2.23
2.27 TRL at the end of the timeframe Annually See Annex A for the Technology Readiness Levels (TRL)
Table 3-11: Data points for the technical monitoring of external hydrogen delivery. New items and items modified compared with the data points specification lists of February 2017 are highlighted green.
Data point number
Data point external hydrogen delivery Unit Frequency of Collection Comments
3.1 Gaseous hydrogen delivered to the site from regular source kg or Nm3
Per delivery (road) Daily (pipeline)
3.2 Liquid hydrogen delivered to the site from regular source kg or Nm3 Per delivery
3.3 Hydrogen delivered to the site from backup source kg or Nm3 Per delivery
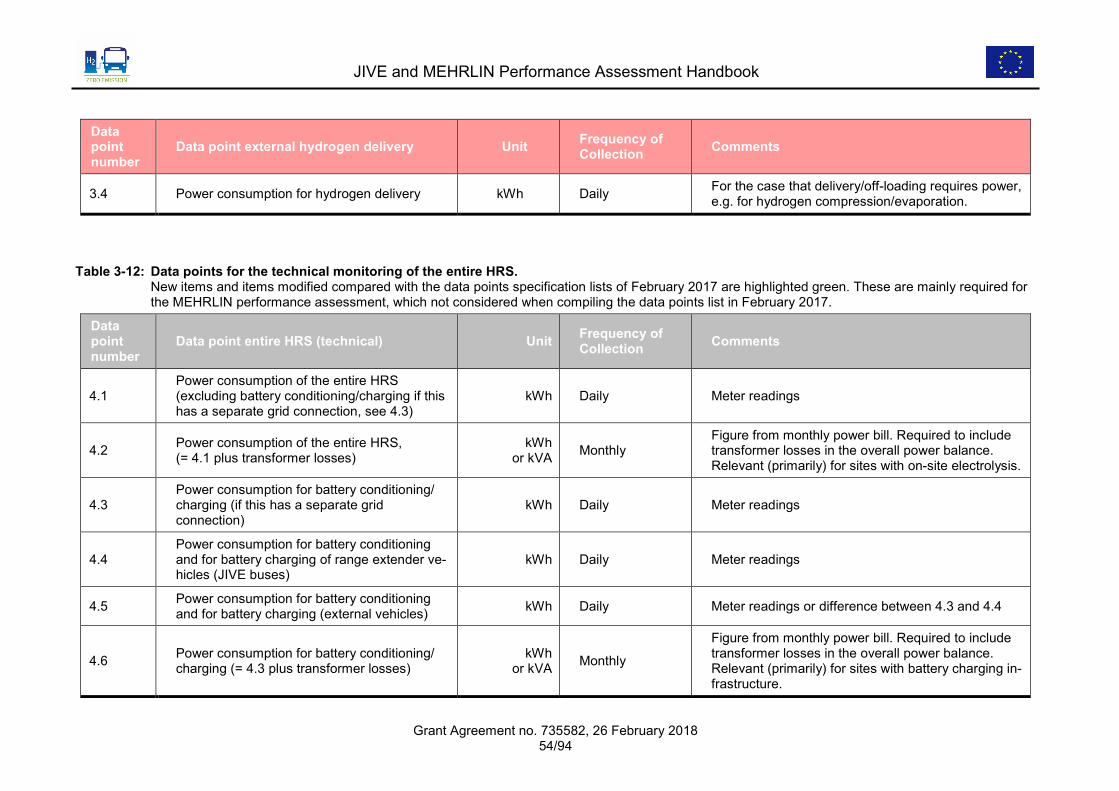
JIVE and MEHRLIN Performance Assessment Handbook
Grant Agreement no. 735582, 26 February 2018 54/94
Data point number
Data point external hydrogen delivery Unit Frequency of Collection Comments
3.4 Power consumption for hydrogen delivery kWh Daily For the case that delivery/off-loading requires power, e.g. for hydrogen compression/evaporation.
Table 3-12: Data points for the technical monitoring of the entire HRS. New items and items modified compared with the data points specification lists of February 2017 are highlighted green. These are mainly required for
the MEHRLIN performance assessment, which not considered when compiling the data points list in February 2017.
Data point number
Data point entire HRS (technical) Unit Frequency of Collection Comments
4.1 Power consumption of the entire HRS (excluding battery conditioning/charging if this has a separate grid connection, see 4.3)
kWh Daily Meter readings
4.2 Power consumption of the entire HRS, (= 4.1 plus transformer losses)
kWh or kVA Monthly
Figure from monthly power bill. Required to include transformer losses in the overall power balance. Relevant (primarily) for sites with on-site electrolysis.
4.3 Power consumption for battery conditioning/ charging (if this has a separate grid connection)
kWh Daily Meter readings
4.4 Power consumption for battery conditioning and for battery charging of range extender ve-hicles (JIVE buses)
kWh Daily Meter readings
4.5 Power consumption for battery conditioning and for battery charging (external vehicles) kWh Daily Meter readings or difference between 4.3 and 4.4
4.6 Power consumption for battery conditioning/ charging (= 4.3 plus transformer losses)
kWh or kVA Monthly
Figure from monthly power bill. Required to include transformer losses in the overall power balance. Relevant (primarily) for sites with battery charging in-frastructure.

JIVE and MEHRLIN Performance Assessment Handbook
Grant Agreement no. 735582, 26 February 2018 55/94
Data point number
Data point entire HRS (technical) Unit Frequency of Collection Comments
4.7 Nitrogen delivered to the site kg Per delivery
4.8 Incidents Per event Incidents affecting safety and/or fuel quality in par-ticular; using the template as in Annex B, to be implemented in SoFi
Table 3-13: Data points for the financial monitoring of the HRS. The high level of OPEX detail is for the MEHRLIN project.
Data point number
Data point entire HRS (financial) Unit Frequency of Collection Comments
OPEX – External Hydrogen Delivery (excluding VAT)
5.1 OPEX – Hydrogen costs € Monthly
OPEX – Entire HRS (excluding VAT)
5.2 OPEX – electricity cost for the entire HRS (excluding battery conditioning/charging if this has a separate grid connection, see below)
€ Monthly Figure from monthly power bill
5.3 OPEX – electricity cost for battery condition-ing/charging (if this has a separate grid connection, see 4.3/4.6)
€ Monthly Figure from monthly power bill
5.4 OPEX – electricity cost for the HPU alone € Monthly If a separate cost figure is available
5.5 OPEX – labour (regular station operation) € Monthly
5.6 OPEX – auxiliary gases and water € Monthly Nitrogen, water etc.
5.7 OPEX – other utilities and consumables € Monthly Leasing or rental fee (land and equipment), insur-ance costs, heating cost (when applicable) etc.
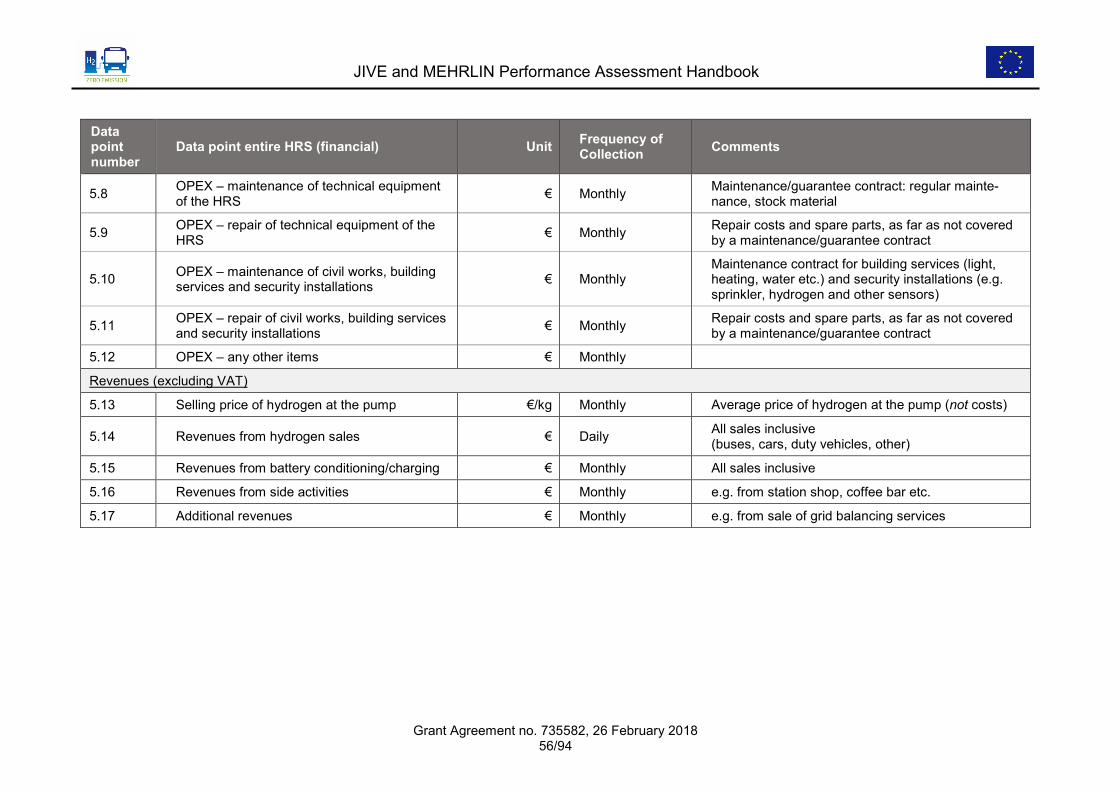
JIVE and MEHRLIN Performance Assessment Handbook
Grant Agreement no. 735582, 26 February 2018 56/94
Data point number
Data point entire HRS (financial) Unit Frequency of Collection Comments
5.8 OPEX – maintenance of technical equipment of the HRS € Monthly Maintenance/guarantee contract: regular mainte-
nance, stock material
5.9 OPEX – repair of technical equipment of the HRS € Monthly Repair costs and spare parts, as far as not covered
by a maintenance/guarantee contract
5.10 OPEX – maintenance of civil works, building services and security installations € Monthly
Maintenance contract for building services (light, heating, water etc.) and security installations (e.g. sprinkler, hydrogen and other sensors)
5.11 OPEX – repair of civil works, building services and security installations € Monthly Repair costs and spare parts, as far as not covered
by a maintenance/guarantee contract
5.12 OPEX – any other items € Monthly
Revenues (excluding VAT)
5.13 Selling price of hydrogen at the pump €/kg Monthly Average price of hydrogen at the pump (not costs)
5.14 Revenues from hydrogen sales € Daily All sales inclusive (buses, cars, duty vehicles, other)
5.15 Revenues from battery conditioning/charging € Monthly All sales inclusive
5.16 Revenues from side activities € Monthly e.g. from station shop, coffee bar etc.
5.17 Additional revenues € Monthly e.g. from sale of grid balancing services
JIVE and MEHRLIN Performance Assessment Handbook
Grant Agreement no. 735582, 26 February 2018 57/94
3.5 Performance indicators
The indicators for assessing the performance of the hydrogen refuelling infrastructure and its major elements can be found in the follow-
ing set of tables:
• On-site hydrogen production in the HPU (Table 3-14),
• Hydrogen compression, storage, and dispensing in the HRU (Table 3-15),
• Aspects related to operation of the entire HRS (Table 3-16).
There are no performance indicators concerning the external delivery of hydrogen.
The numbers to be derived for the various performance indicators will be used for the performance assessment in JIVE and/or MEHR-
LIN, in particular for monitoring accomplishment of the KPI targets (Table 3-2 and Table 3-3). Many of the performance indicators also
represent items that have to be entered into the TRUST database of the FCH JU. This has to take place for each calendar year with
demonstration activities, hence for 2018 to 2022.

JIVE and MEHRLIN Performance Assessment Handbook
Grant Agreement no. 735582, 26 February 2018 58/94
Table 3-14: Performance indicators of the HPU. For diagnostic purposes, monthly or daily evaluations may carried out in addition to what is specified in the “Period” column. Bold items constitute a
KPI in JIVE or MEHRLIN or in both projects.
Performance indicator number
Performance indicator Unit Period Parameters and data points required
Explanations and comments
HPU-PI.1 Availability of the HPU % Monthly, annually and overall 1.6 and 1.7
Calculated in the same way as the availability of the HRU (= KPI HRI-3); see section 3.2.3 for details
HPU-PI.2 Number of HPU downtime hours Annually and overall 1.6 and 1.7
HPU-PI.3 Distribution downtime hours with respect to root causes % Annually and
overall 1.6 to 1.8
The causes for downtime are catego-rised, distinguishing between several in-ternal and external reasons, such as outage of sub-units/components, safety concerns or power outages.
HPU-PI.4 Number of hours with component outage reducing production capacity
Annually and overall 1.9 to 1.11
HPU-PI.5 Number of hours with component outage not reducing production capacity
Annually and overall 1.9 to 1.11
HPU-PI.6 Amount of hydrogen produced by the HPU and by each of its electrolysers/reformers
% Monthly, annually and overall 1.1 .
HPU-PI.7 Capacity factor of the HPU and of each of its electrolysers/reformers % Monthly, annually
and overall
1.1 and HPU-PE.18/ HPU-PO.21
Amount of hydrogen actually produced (1.1), divided by the product of nominal production daily capacity (HPU-PE.18/ HPU-PO.22) and the number of days during evaluation period

JIVE and MEHRLIN Performance Assessment Handbook
Grant Agreement no. 735582, 26 February 2018 59/94
Performance indicator number
Performance indicator Unit Period Parameters and data points required
Explanations and comments
HPU-PI.8 (KPI HRI-1)
Efficiency of on-site hydrogen production of the HPU and of each of its electrolysers/reformers
% Monthly, annually and overall 1.1 to 1.4
JIVE KPI target is > 56% See section 3.2.1 for details
HPU-PI.9 Specific power consumption of the HPU and of each of its electrolysers/reformers
kWh/kg Annually and overall 1.1 to 1.3
HPU-PI.10 Specific energy consumption of the HPU and of each of its electrolysers/reformers
kWh/kg Annually and overall 1.1 to 1.4 Including consumption of power and
natural gas
HPU-PI.11 Specific water consumption for hydrogen production
litres/Nm3 or
litres/kg
Monthly, annually and overall 1.1 and 1.5
HPU-PI.12 Specific OPEX €/kg Annually and overall
1.1, 5.2 or 5.4, and 5.5 to 5.12
Per kg hydrogen produced Way of splitting 5.5 to 5.12 between HPU and HRU to be decided
HPU-PI.13 Specific cost of on-site production of hydrogen €/kg Annually and
overall
1.1 5.2 or 5.4, 5.5 to 5.12, HPU-PE.43/ HPU-PO.40 HRS-P.2 to .5 HRS-P.7 and 8
Including OPEX and CAPEX Per kg hydrogen produced Way of splitting 5.5 to 5.12, HRS-P.2 to .5 and HRS-P.7 and 8 between HPU and HRU to be decided
HPU-PI.14 TRL at the end of the timeframe Annually and overall 1.12

JIVE and MEHRLIN Performance Assessment Handbook
Grant Agreement no. 735582, 26 February 2018 60/94
Table 3-15: Performance indicators of the HRU. For diagnostic purposes, monthly or daily evaluations may carried out in addition to what is specified in the “Period” column. Bold items constitute a
KPI in JIVE or MEHRLIN or in both projects.
Performance indicator number
Performance indicator Unit Period Parameters and data points and required
Explanations and comments
HRU-PI.1 (= KPI HRI-3 and KPI MEHR-4)
Availability of the HRU % Monthly, annually and overall 2.21 and 2.22
JIVE KPI target is > 98% with aspirations to achieve > 99% MEHRLIN KPI target is > 99% by the end of the Action See section 3.2.3 for details
HRU-PI.2 Number of HPU downtime hours Monthly, annually and overall 2.21 and 2.22
HRU-PI.3 Distribution downtime hours with respect to root causes % Monthly, annually
and overall 2.21 to 2.23
The causes for downtime are catego-rised, distinguishing between several in-ternal and external reasons, such as outage of sub-units/components, safety concerns or power outages.
HRU-PI.4 Mean time between failures hours Annually and overall 2.21 and 2.22
HRU-PI.5 Number of hours with component outage reducing production ca-pacity
Monthly, annually and overall 2.24 to 2.26
HRU-PI.6 Number of hours with component outage not reducing production capacity
Monthly, annually and overall 2.24 to 2.26
HRU-PI.7 Number of bus fills Monthly, annually and overall 2.1 and 2.5 Across the fleet and per bus
HRU-PI.8 Number of fuelling events Monthly, annually and overall 2.1 and 2.2 Buses and all other vehicles
HRU-PI.9 Number of incomplete fills Monthly, annually and overall
2.1, 2.2, 2.5 and 2.11.2 Buses and all other vehicles
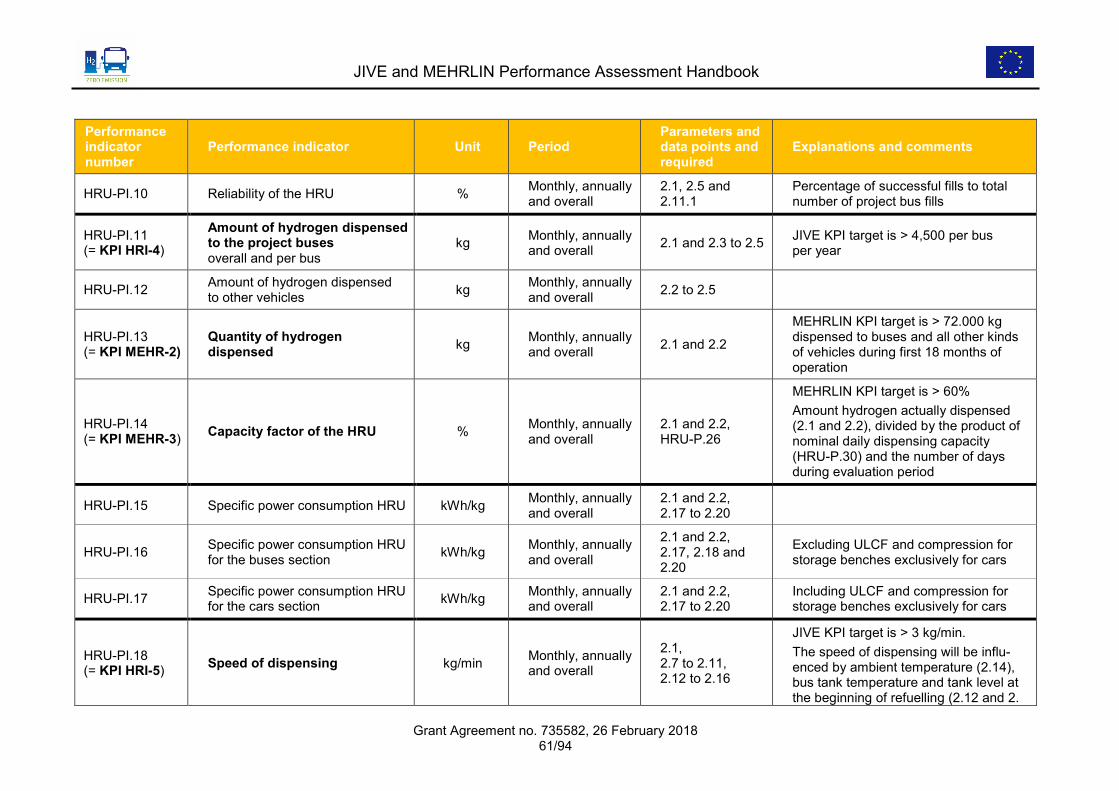
JIVE and MEHRLIN Performance Assessment Handbook
Grant Agreement no. 735582, 26 February 2018 61/94
Performance indicator number
Performance indicator Unit Period Parameters and data points and required
Explanations and comments
HRU-PI.10 Reliability of the HRU % Monthly, annually and overall
2.1, 2.5 and 2.11.1
Percentage of successful fills to total number of project bus fills
HRU-PI.11 (= KPI HRI-4)
Amount of hydrogen dispensed to the project buses overall and per bus
kg Monthly, annually and overall 2.1 and 2.3 to 2.5 JIVE KPI target is > 4,500 per bus
per year
HRU-PI.12 Amount of hydrogen dispensed to other vehicles kg Monthly, annually
and overall 2.2 to 2.5
HRU-PI.13 (= KPI MEHR-2)
Quantity of hydrogen dispensed kg Monthly, annually
and overall 2.1 and 2.2
MEHRLIN KPI target is > 72.000 kg dispensed to buses and all other kinds of vehicles during first 18 months of operation
HRU-PI.14 (= KPI MEHR-3) Capacity factor of the HRU % Monthly, annually
and overall 2.1 and 2.2, HRU-P.26
MEHRLIN KPI target is > 60% Amount hydrogen actually dispensed (2.1 and 2.2), divided by the product of nominal daily dispensing capacity (HRU-P.30) and the number of days during evaluation period
HRU-PI.15 Specific power consumption HRU kWh/kg Monthly, annually and overall
2.1 and 2.2, 2.17 to 2.20
HRU-PI.16 Specific power consumption HRU for the buses section kWh/kg Monthly, annually
and overall
2.1 and 2.2, 2.17, 2.18 and 2.20
Excluding ULCF and compression for storage benches exclusively for cars
HRU-PI.17 Specific power consumption HRU for the cars section kWh/kg Monthly, annually
and overall 2.1 and 2.2, 2.17 to 2.20
Including ULCF and compression for storage benches exclusively for cars
HRU-PI.18 (= KPI HRI-5) Speed of dispensing kg/min Monthly, annually
and overall
2.1, 2.7 to 2.11, 2.12 to 2.16
JIVE KPI target is > 3 kg/min. The speed of dispensing will be influ-enced by ambient temperature (2.14), bus tank temperature and tank level at the beginning of refuelling (2.12 and 2.
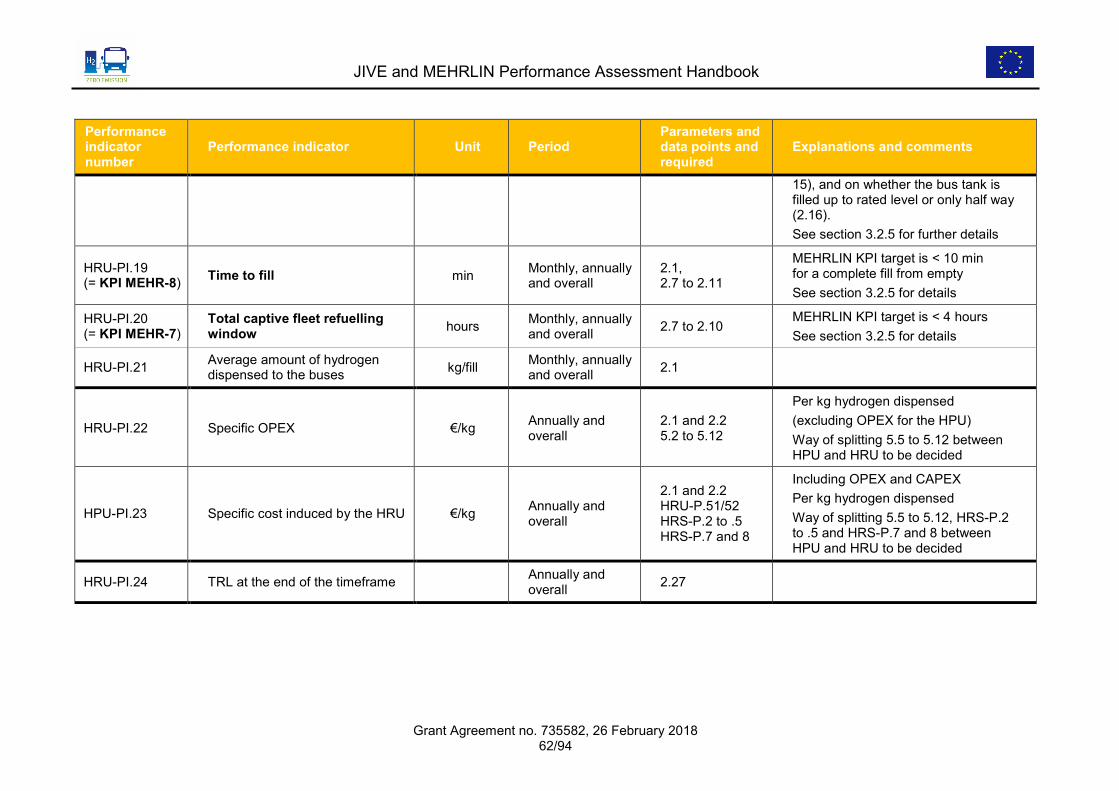
JIVE and MEHRLIN Performance Assessment Handbook
Grant Agreement no. 735582, 26 February 2018 62/94
Performance indicator number
Performance indicator Unit Period Parameters and data points and required
Explanations and comments
15), and on whether the bus tank is filled up to rated level or only half way (2.16). See section 3.2.5 for further details
HRU-PI.19 (= KPI MEHR-8) Time to fill min Monthly, annually
and overall 2.1, 2.7 to 2.11
MEHRLIN KPI target is < 10 min for a complete fill from empty See section 3.2.5 for details
HRU-PI.20 (= KPI MEHR-7)
Total captive fleet refuelling window hours Monthly, annually
and overall 2.7 to 2.10 MEHRLIN KPI target is < 4 hours See section 3.2.5 for details
HRU-PI.21 Average amount of hydrogen dispensed to the buses kg/fill Monthly, annually
and overall 2.1
HRU-PI.22 Specific OPEX €/kg Annually and overall
2.1 and 2.2 5.2 to 5.12
Per kg hydrogen dispensed (excluding OPEX for the HPU) Way of splitting 5.5 to 5.12 between HPU and HRU to be decided
HPU-PI.23 Specific cost induced by the HRU €/kg Annually and overall
2.1 and 2.2 HRU-P.51/52 HRS-P.2 to .5 HRS-P.7 and 8
Including OPEX and CAPEX Per kg hydrogen dispensed Way of splitting 5.5 to 5.12, HRS-P.2 to .5 and HRS-P.7 and 8 between HPU and HRU to be decided
HRU-PI.24 TRL at the end of the timeframe Annually and overall 2.27
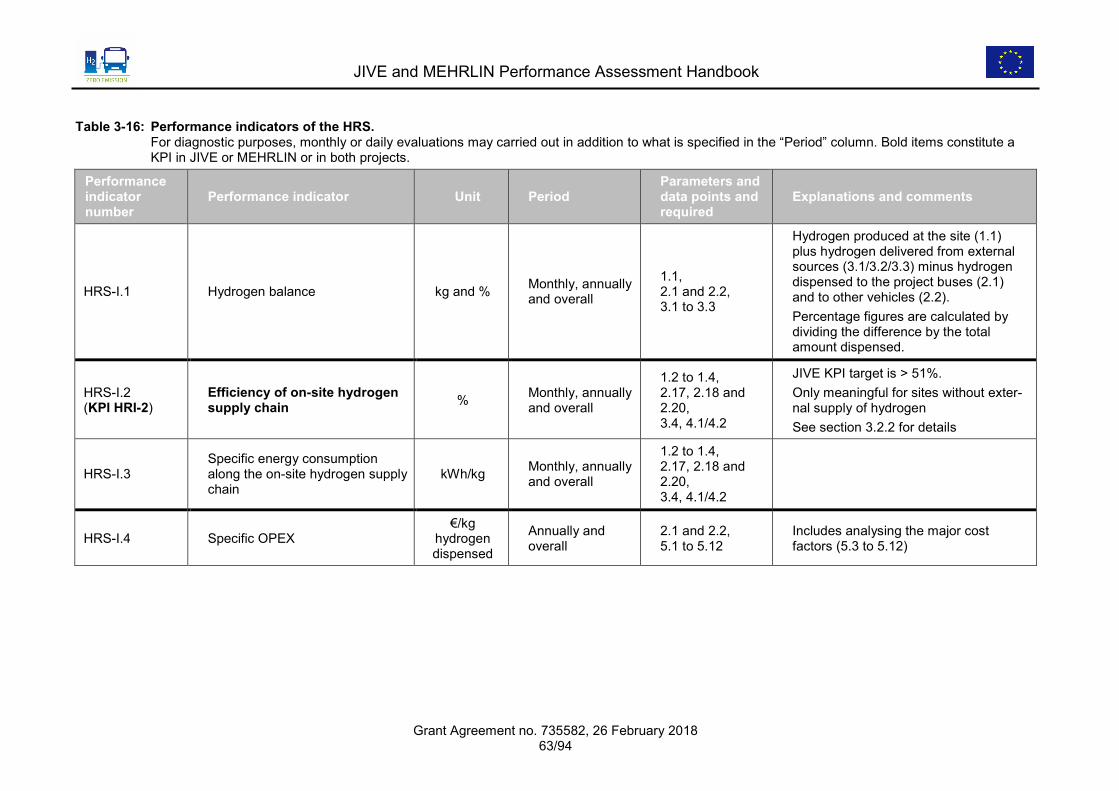
JIVE and MEHRLIN Performance Assessment Handbook
Grant Agreement no. 735582, 26 February 2018 63/94
Table 3-16: Performance indicators of the HRS. For diagnostic purposes, monthly or daily evaluations may carried out in addition to what is specified in the “Period” column. Bold items constitute a
KPI in JIVE or MEHRLIN or in both projects.
Performance indicator number
Performance indicator Unit Period Parameters and data points and required
Explanations and comments
HRS-I.1 Hydrogen balance kg and % Monthly, annually and overall
1.1, 2.1 and 2.2, 3.1 to 3.3
Hydrogen produced at the site (1.1) plus hydrogen delivered from external sources (3.1/3.2/3.3) minus hydrogen dispensed to the project buses (2.1) and to other vehicles (2.2). Percentage figures are calculated by dividing the difference by the total amount dispensed.
HRS-I.2 (KPI HRI-2)
Efficiency of on-site hydrogen supply chain % Monthly, annually
and overall
1.2 to 1.4, 2.17, 2.18 and 2.20, 3.4, 4.1/4.2
JIVE KPI target is > 51%. Only meaningful for sites without exter-nal supply of hydrogen See section 3.2.2 for details
HRS-I.3 Specific energy consumption along the on-site hydrogen supply chain
kWh/kg Monthly, annually and overall
1.2 to 1.4, 2.17, 2.18 and 2.20, 3.4, 4.1/4.2
HRS-I.4 Specific OPEX €/kg
hydrogen dispensed
Annually and overall
2.1 and 2.2, 5.1 to 5.12
Includes analysing the major cost factors (5.3 to 5.12)

JIVE and MEHRLIN Performance Assessment Handbook
Grant Agreement no. 735582, 26 February 2018 64/94
Performance indicator number
Performance indicator Unit Period Parameters and data points and required
Explanations and comments
HRS-I.5 (= KPI HRI-6 and KPI MEHR-5)
Cost of hydrogen dispensed €/kg
hydrogen dispensed
Annually and overall
2.1 and 2.2 5.1 to 5.12 HPU-PE.43/ HPU-PO.40, HRU-P.51/52, HRS-P.2 to .8
Average cost of hydrogen at the pump, considering CAPEX and OPEX JIVE KPI target is ≤ 9 €/kg dispensed at the end of the project. MEHRLIN KPI target is ≤ 10 €/kg with aspirations to achieve < 8 €/kg See section 3.2.6 for details
HRS-I.6 Revenue € Annually and overall 5.13 to 5.17
HRS-I.7 (= KPI HRI-5 and KPI MEHR-6)
Number of incidents affecting fuel quality Annually and
overall 4.8
JIVE and MEHRLIN KPI target is to always keep a quality of 99.999% hydrogen purity or better. See section 3.2.7 for details.
HRS-I.8 Number of incidents Annually and overall 4.8
HRS-I.9 Specific nitrogen consumption kg/tonne dispensed
Annually and overall
2.1 and 2.2, 4.7

JIVE and MEHRLIN Performance Assessment Handbook
Grant Agreement no. 735582, 26 February 2018 65/94
4 Fuel Cell and Reference Buses
4.1 Introduction
This chapter is structured similar to chapter 3 on the hydrogen infrastructure. Table
4-1 provides an overview of this chapter in terms of tables that it contains. Since the
performance of the fuel cell buses will be compared with a reference bus technology
(generally diesel), similar data, however with a reduced scope, has to be collected for
it.
The table starts with the descriptive parameters, i.e. the techno-economic specifica-
tions of the FC and reference buses (see Table 4-3 and Table 4-4). The data points
that will be regularly monitored are described in Table 4-5 for FC bus operation6, in
Table 4-6 for FC bus refuelling and recharging, and in Table 4-7 for reference bus
operation. The general set of performance indicators is depicted in Table 4-8 for FC
bus operation, Table 4-9 for FC bus refuelling, and Table 4-10 for reference bus op-
eration. The KPIs for FC bus operation shown in Table 4-2 are a subset of the list of
performance indicators for which target figures are stated in the projects’ work pro-
grammes (see section 2.1.4).
Due to their importance, first, the KPIs are described in detail, including the used da-
ta points and how the KPIs are calculated (section 4.2). This is followed by a descrip-
tion of the descriptive parameters (section 4.3), data points (section 4.4) and finally
the performance indicators (section 4.5).
6 Table 4-5 also comprises basic information on incidents, while for the formal incident reporting An-
nex B has to be considered.
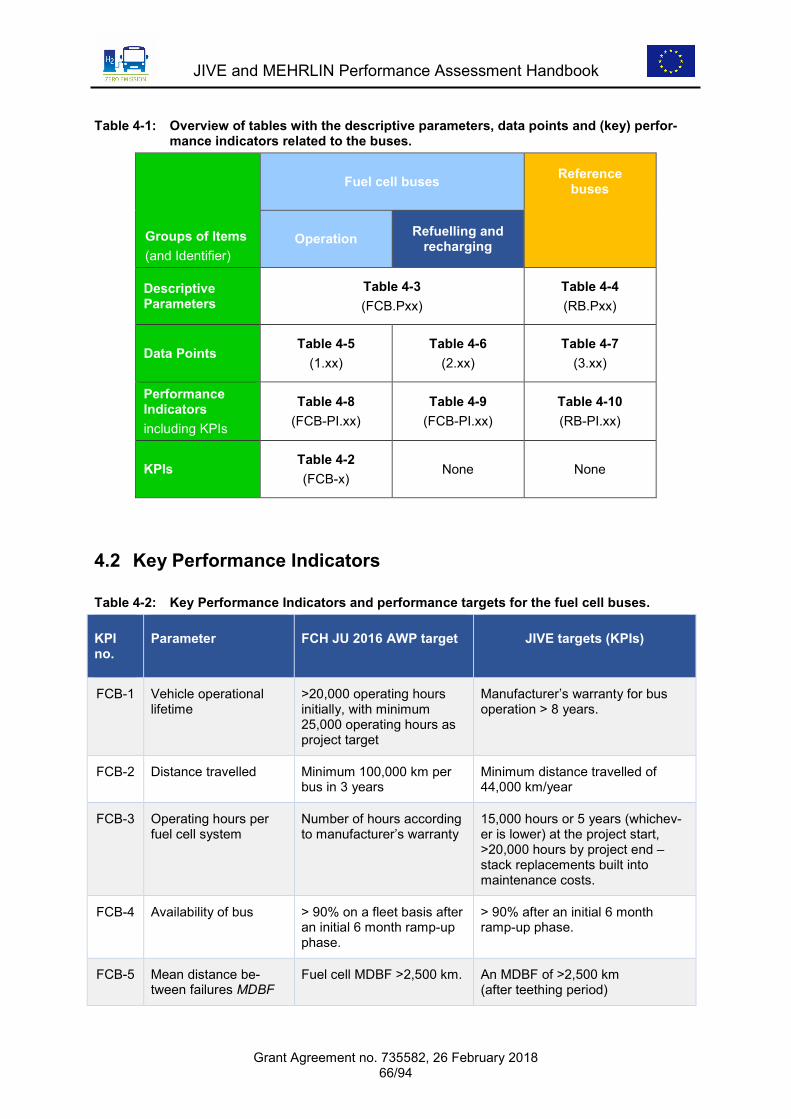
JIVE and MEHRLIN Performance Assessment Handbook
Grant Agreement no. 735582, 26 February 2018 66/94
Table 4-1: Overview of tables with the descriptive parameters, data points and (key) perfor-mance indicators related to the buses.
Groups of Items (and Identifier)
Fuel cell buses Reference buses
Operation Refuelling and
recharging
Descriptive Parameters
Table 4-3 (FCB.Pxx)
Table 4-4 (RB.Pxx)
Data Points Table 4-5
(1.xx) Table 4-6
(2.xx) Table 4-7
(3.xx)
Performance Indicators including KPIs
Table 4-8 (FCB-PI.xx)
Table 4-9 (FCB-PI.xx)
Table 4-10 (RB-PI.xx)
KPIs Table 4-2 (FCB-x)
None None
4.2 Key Performance Indicators
Table 4-2: Key Performance Indicators and performance targets for the fuel cell buses.
KPI no.
Parameter FCH JU 2016 AWP target JIVE targets (KPIs)
FCB-1 Vehicle operational lifetime
>20,000 operating hours initially, with minimum 25,000 operating hours as project target
Manufacturer’s warranty for bus operation > 8 years.
FCB-2 Distance travelled Minimum 100,000 km per bus in 3 years
Minimum distance travelled of 44,000 km/year
FCB-3 Operating hours per fuel cell system
Number of hours according to manufacturer’s warranty
15,000 hours or 5 years (whichev-er is lower) at the project start, >20,000 hours by project end – stack replacements built into maintenance costs.
FCB-4 Availability of bus > 90% on a fleet basis after an initial 6 month ramp-up phase.
> 90% after an initial 6 month ramp-up phase.
FCB-5 Mean distance be-tween failures MDBF
Fuel cell MDBF >2,500 km. An MDBF of >2,500 km (after teething period)

JIVE and MEHRLIN Performance Assessment Handbook
Grant Agreement no. 735582, 26 February 2018 67/94
KPI no.
Parameter FCH JU 2016 AWP target JIVE targets (KPIs)
FCB-6 Specific fuel consump-tion
< 9 kg / 100 km (solo bus, 12–13.5 m), < 14 kg / 100 km (articulated bus, 18 m).
< 9 kg / 100 km (solo bus, 12–13.5 m), < 14 kg / 100 km (articulated bus, 18 m).
FCB-7 Efficiency Tank-to-wheel efficiency >42%, on the SORT 1 & 2 drive cycles.
Tank-to-wheel efficiency >42%, on the SORT 1 & 2 drive cycles.
FCB-8 Vehicle CAPEX < 650,000 € per standard single deck 12m bus < 1,000,000 € for articulat-ed buses.
< 650,000 € for a base 12 m bus, excluding additional parts (CCTV, extra doors, Wi-Fi etc.). < 1,000,000 € for articulated bus-es.
FCB-9 Vehicle OPEX No target. Maximum of 100% more than the equivalent cost of maintaining a diesel bus, aiming at 50% more by the end of the project.
4.2.1 Vehicle operational lifetime The limited duration of the project does not allow the measurement and verification of
the target operational lifetime. Thus, the appropriate lifetime has to be ensured by
tender specifications and contractual arrangements, which oblige bus manufacturers
to furnish a corresponding warranty for at least 8 years on their vehicles and equip-
ment.
4.2.2 Distance travelled For JIVE, a minimum distance travelled of 44,000 km/year has been set. The trav-
elled distance is recorded straightforward by data point 1.4 (see Table 4-5). The ful-
filment of the indicator will be calculated taking the arithmetic average of the monthly
values, multiplied by 12.
4.2.3 Operating hours per fuel cell system The JIVE target for the FC systems are 15,000 operating hours (or 5 years) at the
project start and > 20,000 hours at the project end. As for the vehicle lifetime, the
limited duration of the project does not allow the measurement and verification of the
target FC operational lifetime.
JIVE and MEHRLIN Performance Assessment Handbook
Grant Agreement no. 735582, 26 February 2018 68/94
To check if the target (>20,000 h by project end) is achieved, the indicator will be es-
timated by extrapolating the average operating hours per month of the FC system
(derived from data point 1.2, see Table 4-5) to the vehicle operational lifetime (see
section 4.2.1), i.e. by multiplying them with 96 (12 months times 8 years).
4.2.4 Availability of bus After an initial ramp-up phase during the first 6 months of operation, the target vehi-
cle availability is > 90%. It is based on the general round-the-clock (24/7) readiness
for services (i.e. 24 hours times number of days per month (DpM, monthly availabil-
ity), minus the downtime. Downtime hours are derived from the time stamps of trans-
fer to workshop and back to operation (data points 1.11 and 1.12). Furthermore,
periods during which the bus is not in service due to scheduled maintenance or up-
grade (SMU, data point 1.13.1) do not count as downtime. The availability is thus
calculated as:
𝑀𝑀𝑀𝑀𝐴𝐴𝑎𝑎ℎ𝐴𝐴𝑎𝑎 𝐴𝐴𝑎𝑎𝐴𝐴𝑎𝑎𝑎𝑎𝑎𝑎𝐴𝐴𝑎𝑎𝑎𝑎𝑎𝑎 = 24 ∗ 𝐷𝐷𝐷𝐷𝑆𝑆 −𝑆𝑆𝑆𝑆𝑆𝑆−𝐷𝐷𝐷𝐷𝐷𝐷𝐷𝐷𝐷𝐷𝐷𝐷𝐷𝐷𝐷𝐷24∗𝐷𝐷𝐷𝐷𝑆𝑆 − 𝑆𝑆𝑆𝑆𝑆𝑆
∗ 100% (Equation 3)
𝐴𝐴𝐴𝐴𝐴𝐴𝐴𝐴𝐴𝐴𝐴𝐴 𝐴𝐴𝑎𝑎𝐴𝐴𝑎𝑎𝑎𝑎𝑎𝑎𝐴𝐴𝑎𝑎𝑎𝑎𝑎𝑎 = 8760 −𝑆𝑆𝑆𝑆𝑆𝑆−𝐷𝐷𝐷𝐷𝐷𝐷𝐷𝐷𝐷𝐷𝐷𝐷𝐷𝐷𝐷𝐷8760 − 𝑆𝑆𝑆𝑆𝑆𝑆
∗ 100% (Equation 4)
The required availability shall be ensured by corresponding manufacturer’s warran-
ties as part of the tender specifications and contracts.
4.2.5 Mean distance between failures The KPI mean distance between failures MDBF is directly related to the KPI availabil-
ity. A target MDBF > 2,500 km is set after an initial 6-month ramp-up phase.
Based on the daily driven distance (data point 1.4), the MDBF can be calculated as
the sum of daily driven kilometres divided by the number of failures, with the number
of failures being derived from the count of downtime reasons (data points 1.14.1-7).
𝑀𝑀𝐷𝐷𝐷𝐷𝐷𝐷 = Ø �∑𝐷𝐷𝑎𝑎𝐷𝐷𝑎𝑎𝐴𝐴𝐴𝐴𝐷𝐷𝐷𝐷 𝑎𝑎𝑡𝑡𝐴𝐴𝑎𝑎𝐷𝐷𝐴𝐴𝐴𝐴𝐷𝐷𝑡𝑡
∑𝐷𝐷𝐴𝐴𝑎𝑎𝐴𝐴𝐴𝐴𝑡𝑡𝐷𝐷𝐷𝐷� (Equation 5)
This KPI is provided if minimum one failure occurs within the reporting period. As for
the general availability, the required MDBF shall be stipulated in the procurement
contracts.

JIVE and MEHRLIN Performance Assessment Handbook
Grant Agreement no. 735582, 26 February 2018 69/94
Note: The Mean distance between road calls (MDRC) is not a KPI but a performance
indicator (see section 4.5) and is calculated following the same logic using the sum of
all road calls as denominator.
4.2.6 Specific fuel consumption The fuel consumption of buses generally strongly depends on their length. Therefore,
a hydrogen consumption of < 9 kg H2/100 km for a solo bus (12–13.5 m) and
< 14 kg H2/100 km for an articulated bus (18 m) are stipulated in the FCH JU 2016
AWP. These figures are already included as a minimum efficiency requirement in the
procurement documents.
The average hydrogen consumption is calculated specifically for each bus based on
the total hydrogen refueled (sum of data point 2.1) and the total distance driven
(odometer reading at the time of refueling minus odometer reading at the first refuel-
ing).
𝐷𝐷𝐴𝐴𝐷𝐷𝐴𝐴 𝐷𝐷𝑀𝑀𝐴𝐴𝐷𝐷𝐴𝐴𝑐𝑐𝑐𝑐𝑎𝑎𝑎𝑎𝑀𝑀𝐴𝐴 = ∑ 𝐻𝐻𝑎𝑎𝑡𝑡𝑡𝑡𝑀𝑀𝐻𝐻𝐷𝐷𝐴𝐴 𝑡𝑡𝐷𝐷𝑟𝑟𝐴𝐴𝐷𝐷𝐴𝐴𝐴𝐴𝐷𝐷𝑡𝑡𝐷𝐷0
𝑂𝑂𝑡𝑡𝑀𝑀𝑐𝑐𝐷𝐷𝑎𝑎𝐷𝐷𝑡𝑡 𝑡𝑡𝐷𝐷𝐴𝐴𝑡𝑡𝑎𝑎𝐴𝐴𝐻𝐻𝐷𝐷 − 𝑂𝑂𝑡𝑡𝑀𝑀𝑐𝑐𝐷𝐷𝑎𝑎𝐷𝐷𝑡𝑡 𝑡𝑡𝐷𝐷𝐴𝐴𝑡𝑡𝑎𝑎𝐴𝐴𝐻𝐻0 (Equation 6)
If data points 1.19 and 2.1 are both available, the KPI will be calculated for both data
points and used for cross-checking.
As some buses in CHIC did already consume less, a consumption level below
9 kg H2/100 km for solo buses is anticipated. However, if all suppliers achieve the
levels, there will be an improvement of over 30 % compared to some buses in CHIC.
Based on previous experiences, attention may need to be given to (pro-longed) idling
periods between services, i.e. the driver does not shut down the bus during a break
since e.g. there is usually no or only little noise coming from the bus when idling.
4.2.7 Efficiency A Tank-to-Wheel (TtW) efficiency of > 42% on the SORT 1 & 2 drive cycles7 is re-
quired by the FCH JU 2016 AWP. The TtW efficiency is defined as the ratio of me-
chanical work at the wheel to the lower heating value of the hydrogen consumed.
The fulfilment of this indicator has to be stipulated in the procurement specifications
7 A description and graphical representation of the SORT cycles can be found in http://bit.ly/2olfGko

JIVE and MEHRLIN Performance Assessment Handbook
Grant Agreement no. 735582, 26 February 2018 70/94
and demonstrated by the suppliers as part of their factory sign off. However, it is rec-
ommended to have verified compliance by an independent third party.
𝐸𝐸𝑟𝑟𝑟𝑟𝑎𝑎𝐷𝐷𝑎𝑎𝐷𝐷𝐴𝐴𝐷𝐷𝑎𝑎 = ∑𝑐𝑐𝐷𝐷𝐷𝐷ℎ𝐴𝐴𝐴𝐴𝑎𝑎𝐷𝐷𝐴𝐴𝐴𝐴 𝑤𝑤𝑀𝑀𝑡𝑡𝑤𝑤 𝐴𝐴𝑎𝑎 𝑎𝑎ℎ𝐷𝐷 𝑤𝑤ℎ𝐷𝐷𝐷𝐷𝐴𝐴
∑𝐻𝐻𝑎𝑎𝑡𝑡𝑡𝑡𝑀𝑀𝐻𝐻𝐷𝐷𝐴𝐴 𝐷𝐷𝑀𝑀𝐴𝐴𝐷𝐷𝐴𝐴𝑐𝑐𝐷𝐷𝑡𝑡 (Equation 7)
4.2.8 Vehicle CAPEX The investment for FC buses is limited to 650,000 € per standard single deck 12 m
bus and 1,000,000 € for articulated buses, yet excluding special equipment like
CCTV, extra doors, Wi-Fi etc.. Articulated bus tenders require an investment of less
than 1 Mio. €, again excluding special equipment. The investment comprises the pur-
chasing price excluding any service contract and VAT. It is evaluated via the parame-
ter vehicle price (FCB.P32).
These figures should already have been adopted in the tenders for procurement.
4.2.9 Vehicle OPEX According to the target defined by the JIVE consortium, operating costs shall not ex-
ceed the equivalent costs of a conventional bus by more than 100%, aiming to stay
below 50% extra costs at the end of the project. Operating costs will be determined
as specific operating costs per kilometer driven over a period of one year. For their
calculation, a whole set of parameters and data points is considered:
FC bus
• The driven distance (data point 1.4) for one year will be used to be coherent
with operating cost statements.
• Cost of service contract FC bus (FCB.P36)
• Insurance cost FC bus (FCB.P37)
• Hydrogen fuel cost (data point 2.11) and hydrogen refuelled (data point 2.1)
• Operational and maintenance cost FC bus (data point 1.20)
Reference bus:
• Driven distance reference bus (data point 3.2)
• Cost of service contract reference bus (RB.P23)
JIVE and MEHRLIN Performance Assessment Handbook
Grant Agreement no. 735582, 26 February 2018 71/94
• Insurance cost reference bus (RB.P24)
• Fuel cost reference bus (data point 3.13) and fuel consumption (data point 3.11)
• Operational and maintenance cost reference bus (data point 3.14)
• Filling station usage base fee (RB.P25)
To determine the specific operating costs, all costs that can arise within one year will
be summarized and divided by the sum of the distance travelled within that year.
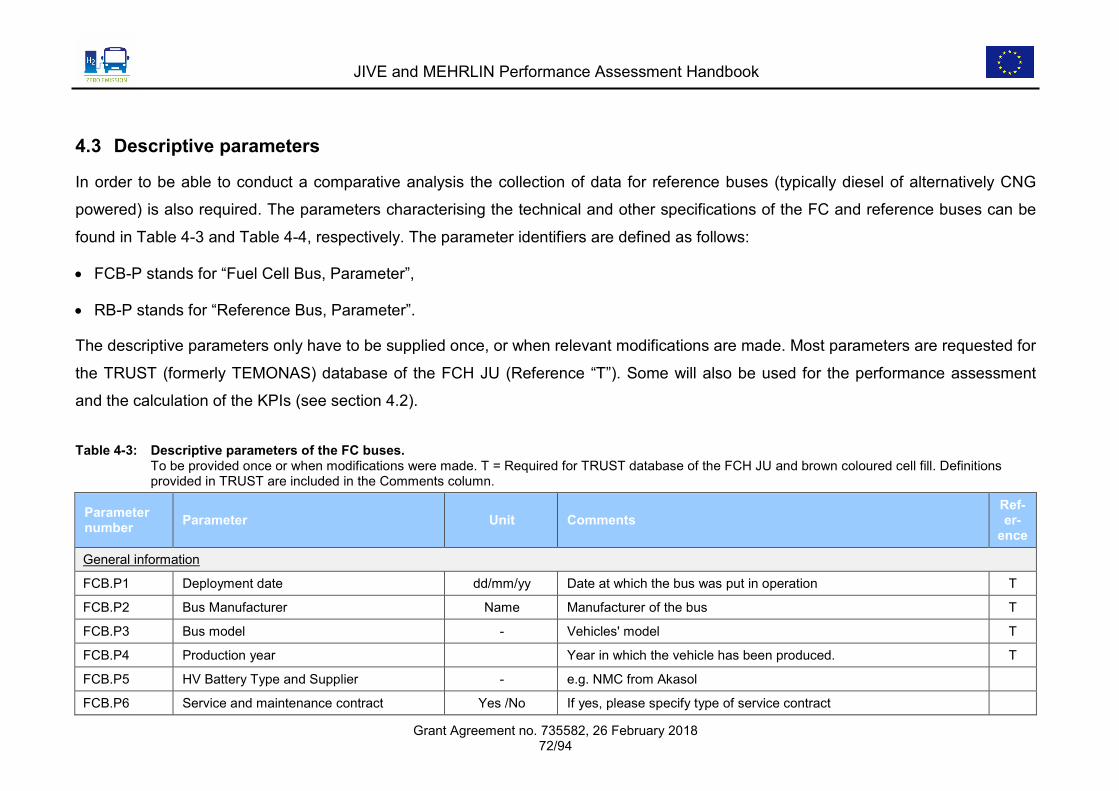
JIVE and MEHRLIN Performance Assessment Handbook
Grant Agreement no. 735582, 26 February 2018 72/94
4.3 Descriptive parameters
In order to be able to conduct a comparative analysis the collection of data for reference buses (typically diesel of alternatively CNG
powered) is also required. The parameters characterising the technical and other specifications of the FC and reference buses can be
found in Table 4-3 and Table 4-4, respectively. The parameter identifiers are defined as follows:
• FCB-P stands for “Fuel Cell Bus, Parameter”,
• RB-P stands for “Reference Bus, Parameter”.
The descriptive parameters only have to be supplied once, or when relevant modifications are made. Most parameters are requested for
the TRUST (formerly TEMONAS) database of the FCH JU (Reference “T”). Some will also be used for the performance assessment
and the calculation of the KPIs (see section 4.2).
Table 4-3: Descriptive parameters of the FC buses. To be provided once or when modifications were made. T = Required for TRUST database of the FCH JU and brown coloured cell fill. Definitions
provided in TRUST are included in the Comments column.
Parameter number Parameter Unit Comments
Ref-er-
ence
General information
FCB.P1 Deployment date dd/mm/yy Date at which the bus was put in operation T
FCB.P2 Bus Manufacturer Name Manufacturer of the bus T
FCB.P3 Bus model - Vehicles' model T
FCB.P4 Production year Year in which the vehicle has been produced. T
FCB.P5 HV Battery Type and Supplier - e.g. NMC from Akasol
FCB.P6 Service and maintenance contract Yes /No If yes, please specify type of service contract

JIVE and MEHRLIN Performance Assessment Handbook
Grant Agreement no. 735582, 26 February 2018 73/94
Parameter number Parameter Unit Comments
Ref-er-
ence
FCB.P7 Insurance - How is the vehicle insured, e.g. self-insured, insurance company?
FCB.P8 Expectation of technological readiness of deployed FC buses at start of operation and after 36 months of operation
TRL 1-9 Please use TRL scale ranging from 1 to 9 as provided in the Annex of this document
Technical parameters
FCB.P9 Drivetrain power kW Maximum power that can be provided to the vehicles' wheels, as rated by the manufacturer, T
FCB.P10 Number of stacks # Indicate how many fuel cell stacks are comprised in the drivetrain T
FCB.P11 Drivetrain weight kg Overall weight of the propulsion system (including fuel cell system, batteries, controllers, motor, transmission, cooling and exhaust sys-tem)
T
FCB.P12 Maximum speed km/h Vehicle's maximum speed, as rated by the manufacturer. Please indi-cate in case the specified max speed is determined by another meas-ure than OEM specs, e.g. by operator requirements
T
FCB.P13 Acceleration time 0-50 km/h s Time to reach 50 km/h from start-up (0 km/h) - as rated by the manu-facturer T
FCB.P14.1 Range (SORT 1) km Maximum distance that the vehicle can travel, without refuelling, ac-cording to the Standardised On-Road Test (SORT) 1 driving cycle T
FCB.P14.2 Range (SORT 2) km Maximum distance that the vehicle can travel, without refuelling, ac-cording to the Standardised On-Road Test (SORT) 2 driving cycle T
FCB.P15.1 Empty weight kg Empty vehicle weight as provided by OEM T
FCB.P15.2 Max. allowable weight kg Maximum allowable vehicle weight as provided by OEM
FCB.P16.1 Height m Vehicle height T
FCB.P16.2 Length m Vehicle length T
FCB.P16.3 Width m Vehicle width T
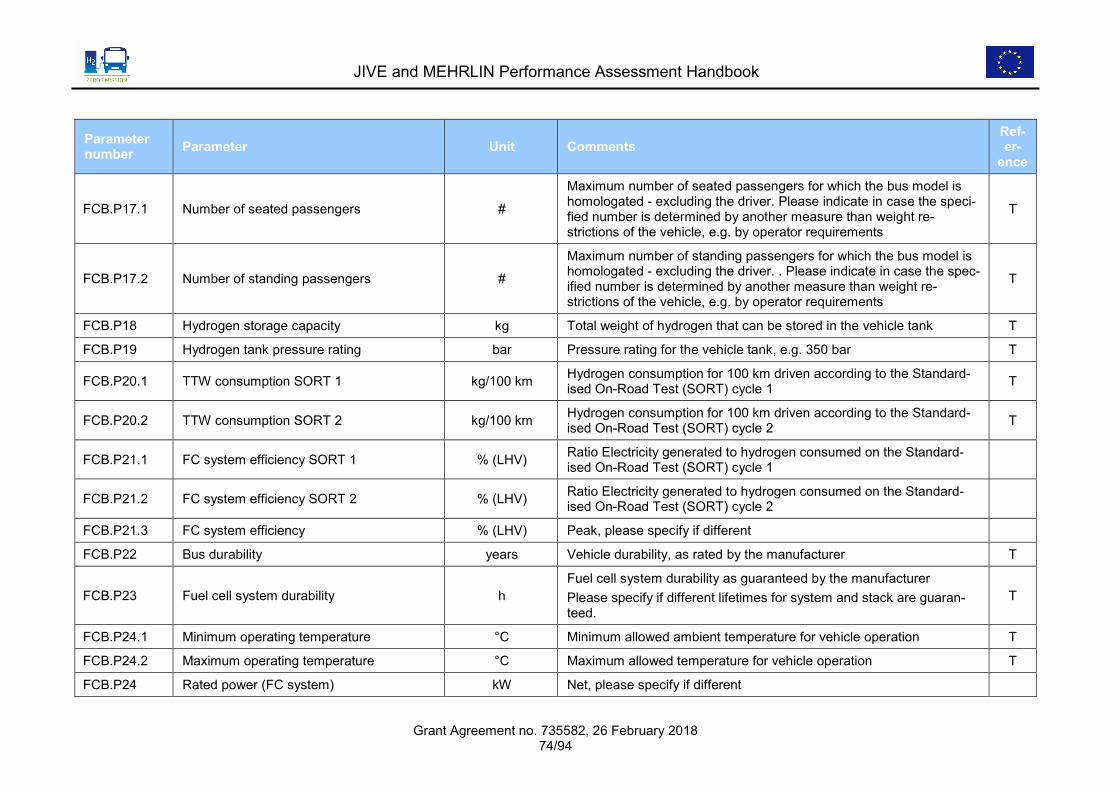
JIVE and MEHRLIN Performance Assessment Handbook
Grant Agreement no. 735582, 26 February 2018 74/94
Parameter number Parameter Unit Comments
Ref-er-
ence
FCB.P17.1 Number of seated passengers #
Maximum number of seated passengers for which the bus model is homologated - excluding the driver. Please indicate in case the speci-fied number is determined by another measure than weight re-strictions of the vehicle, e.g. by operator requirements
T
FCB.P17.2 Number of standing passengers #
Maximum number of standing passengers for which the bus model is homologated - excluding the driver. . Please indicate in case the spec-ified number is determined by another measure than weight re-strictions of the vehicle, e.g. by operator requirements
T
FCB.P18 Hydrogen storage capacity kg Total weight of hydrogen that can be stored in the vehicle tank T
FCB.P19 Hydrogen tank pressure rating bar Pressure rating for the vehicle tank, e.g. 350 bar T
FCB.P20.1 TTW consumption SORT 1 kg/100 km Hydrogen consumption for 100 km driven according to the Standard-ised On-Road Test (SORT) cycle 1 T
FCB.P20.2 TTW consumption SORT 2 kg/100 km Hydrogen consumption for 100 km driven according to the Standard-ised On-Road Test (SORT) cycle 2 T
FCB.P21.1 FC system efficiency SORT 1 % (LHV) Ratio Electricity generated to hydrogen consumed on the Standard-ised On-Road Test (SORT) cycle 1
FCB.P21.2 FC system efficiency SORT 2 % (LHV) Ratio Electricity generated to hydrogen consumed on the Standard-ised On-Road Test (SORT) cycle 2
FCB.P21.3 FC system efficiency % (LHV) Peak, please specify if different
FCB.P22 Bus durability years Vehicle durability, as rated by the manufacturer T
FCB.P23 Fuel cell system durability h Fuel cell system durability as guaranteed by the manufacturer Please specify if different lifetimes for system and stack are guaran-teed.
T
FCB.P24.1 Minimum operating temperature °C Minimum allowed ambient temperature for vehicle operation T
FCB.P24.2 Maximum operating temperature °C Maximum allowed temperature for vehicle operation T
FCB.P24 Rated power (FC system) kW Net, please specify if different

JIVE and MEHRLIN Performance Assessment Handbook
Grant Agreement no. 735582, 26 February 2018 75/94
Parameter number Parameter Unit Comments
Ref-er-
ence
FCB.P25 FC system efficiency % (LHV) Peak, please specify if different
FCB.P26 Rated power (HV Battery) kW
FCB.P27.1 Capacity (HV Battery) kWh
FCB.P27.2 Usable capacity (HV battery) kWh Alternatively provision of min/max SOC [%]
FCB.P28 HVAC system Type and kW E.g. electric AC 24 kW and electric heater 30 kW. please also provide temperature set point for AC and heating, if appli-cable
FCB.P29 External HV battery recharging capability Yes/No If Yes, type of connection and charging power [kW] to be specified, also where amount of energy recharged is measured (e.g. at battery input terminal or before/ after inverter)
FCB.P30 Data communication for refuelling Yes/No Please specify applied communication protocol, e.g. SAE 2799
FCB.P31 Freeze protection System installed Yes/No If Yes, specify operating voltage
Financial parameters
FCB.P32 Vehicle price EUR
Price per vehicle of the transaction between the bus manufacturer and the bus buyer. Any grant amount should not be accounted for here (price before any rebates, grants etc.) Purchase price excluding any service contract and VAT
T
FCB.P33.1 Bus cost EUR If available, cost of manufacturing the vehicle T
FCB.P33.2 Est. bus cost @ mass prod. EUR Estimated vehicle cost at an assumed up-scaled production level - please specify the production level assumed in the comment field T
FCB.P34.1 Fuel cell system cost EUR/kW Actual cost of the fuel cell system, including hydrogen tank, fuel cell stack, air compressor, DC/DC converter - excluding overheads and profits
T
FCB.P34.2 Est. FC system cost @ mass prod. EUR/kW Estimated fuel cell system cost at an assumed up-scaled production level - please specify the production level assumed in the comment field
T

JIVE and MEHRLIN Performance Assessment Handbook
Grant Agreement no. 735582, 26 February 2018 76/94
Parameter number Parameter Unit Comments
Ref-er-
ence
FCB.P35 Funding received EUR Funding received by each funding source
FCB.P36 Cost of service contract EUR/a If FCB.6 is yes, please specify yearly cost
FCB.P37 Insurance cost EUR/a Yearly insurance cost
Table 4-4: Descriptive parameters of the reference buses. Provided once or when modifications were made. T = Required for TRUST database of the FCH JU and brown coloured cell fill. Definitions provided in
TRUST are included in the Comment column.
Parameter number Parameter Unit Comments Refer-
ence
General information
RB.P1 Deployment date dd/mm/yy Date at which the bus was put in operation
RB.P2 Bus Manufacturer Name Manufacturer of the bus
RB.P3 Bus model - Vehicles' model
RB.P4 Production year Year in which the vehicle has been produced.
RB.P5 Type of bus e.g. diesel or CNG (200 bar)
RB.P6 Service and maintenance contract Yes /No If yes, please specify type of service contract
RB.P7 Insurance - How is the vehicle insured, e.g. self-insured, insurance company?
Technical parameters
RB.P8 Drivetrain power kW Maximum power that can be provided to the vehicles' wheels, as rated by the manufacturer,
RB.P9 Drivetrain weight kg Overall weight of the propulsion system (including fuel cell system, batteries, controllers, motor, transmission, cooling and exhaust sys-tem)
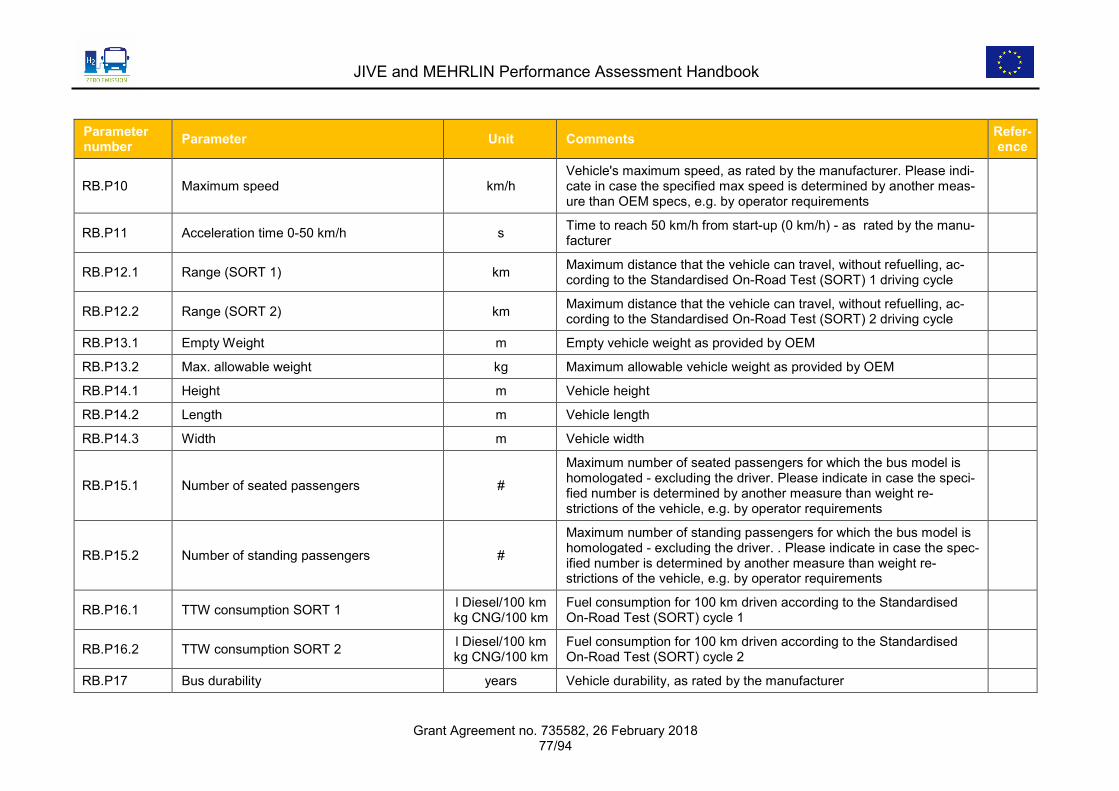
JIVE and MEHRLIN Performance Assessment Handbook
Grant Agreement no. 735582, 26 February 2018 77/94
Parameter number Parameter Unit Comments Refer-
ence
RB.P10 Maximum speed km/h Vehicle's maximum speed, as rated by the manufacturer. Please indi-cate in case the specified max speed is determined by another meas-ure than OEM specs, e.g. by operator requirements
RB.P11 Acceleration time 0-50 km/h s Time to reach 50 km/h from start-up (0 km/h) - as rated by the manu-facturer
RB.P12.1 Range (SORT 1) km Maximum distance that the vehicle can travel, without refuelling, ac-cording to the Standardised On-Road Test (SORT) 1 driving cycle
RB.P12.2 Range (SORT 2) km Maximum distance that the vehicle can travel, without refuelling, ac-cording to the Standardised On-Road Test (SORT) 2 driving cycle
RB.P13.1 Empty Weight m Empty vehicle weight as provided by OEM
RB.P13.2 Max. allowable weight kg Maximum allowable vehicle weight as provided by OEM
RB.P14.1 Height m Vehicle height
RB.P14.2 Length m Vehicle length
RB.P14.3 Width m Vehicle width
RB.P15.1 Number of seated passengers #
Maximum number of seated passengers for which the bus model is homologated - excluding the driver. Please indicate in case the speci-fied number is determined by another measure than weight re-strictions of the vehicle, e.g. by operator requirements
RB.P15.2 Number of standing passengers #
Maximum number of standing passengers for which the bus model is homologated - excluding the driver. . Please indicate in case the spec-ified number is determined by another measure than weight re-strictions of the vehicle, e.g. by operator requirements
RB.P16.1 TTW consumption SORT 1 l Diesel/100 km kg CNG/100 km
Fuel consumption for 100 km driven according to the Standardised On-Road Test (SORT) cycle 1
RB.P16.2 TTW consumption SORT 2 l Diesel/100 km kg CNG/100 km
Fuel consumption for 100 km driven according to the Standardised On-Road Test (SORT) cycle 2
RB.P17 Bus durability years Vehicle durability, as rated by the manufacturer

JIVE and MEHRLIN Performance Assessment Handbook
Grant Agreement no. 735582, 26 February 2018 78/94
Parameter number Parameter Unit Comments Refer-
ence
RB.P18.1 Minimum ambient temperature °C Minimum allowed ambient temperature for vehicle operation
RB.P18.2 Maximum ambient temperature °C Maximum allowed ambient temperature for vehicle operation
RB.P19 HVAC system Type and kW E.g. mechanic AC 24 kW and diesel heater 30 kW. please also provide temperature set point for AC and heating, if appli-cable
RB.P20 Tank Capacity l/kg Litres of diesel or kg of CNG, for CNG also working pressure, e.g. 200 bar
Financial parameters
RB.P21 Vehicle price EUR
Price per vehicle of the transaction between the bus manufacturer and the bus buyer. Any grant amount should not be accounted for here (price before any rebates, grants etc.) Purchase price excluding any service contract and VAT
RB.P22 Funding received EUR Funding received by each funding source
RB.P23 Cost of service contract EUR/a If RB.6 is yes, please specify yearly cost
RB.P24 Insurance cost EUR/a Yearly insurance cost
RB.P25 Filling station usage base fee EUR/a If applicable, please specify any yearly “base” fees which may apply in the context of fuel provision

JIVE and MEHRLIN Performance Assessment Handbook
Grant Agreement no. 735582, 26 February 2018 79/94
4.4 Data points
Table 4-5: Data points for monitoring FC bus operation. T = Required for TRUST database of the FCH JU and brown coloured cell fill. Definitions provided in TRUST are included in the Comment column.
FCB Data point no. Data point Unit Frequency
of Collection Comments Refer-ence
1.1 Hours of bus operation h Daily Alternatively, this can be provided via time stamps for igni-tion on/off [dd/mm/yyyy] [hh:mm:ss]. T
1.2 Operating hours FC system h
Daily and per FC system if more than one
system installed
Depending on the operating regime implemented by the vehicle OEM the values for this data point may be lower than the values recorded for data point 1.1
T
1.3 Operating hours on route h Daily Optional for operators using this metric
1.4 Distance driven km Daily T
1.5 Driven distance on route km Daily Optional for operators using this metric
1.6 Odometer reading km monthly
1.7 Route/ run number # Daily
1.8 Electricity generation FC system kWh Daily
1.9 Electricity consumption electric engine kWh Daily If available, for determining energy consumption for trac-tion
1.10 Electricity generation electric engine kWh Daily If available, for determining recuperation energy
1.11 Electricity consumption HVAC kWh Daily If available, separated by heating and AC and for driver and passenger cabin (if separate)
1.12 Availability status: Out of service [dd/mm/yyyy] [hh:mm:ss] Event based Timestamp for transfer to workshop (out of service mes-
sage)
1.13 Availability status: Back to service [dd/mm/yyyy] [hh:mm:ss] Event based Timestamp for transfer back to operations (back to service
message)

JIVE and MEHRLIN Performance Assessment Handbook
Grant Agreement no. 735582, 26 February 2018 80/94
FCB Data point no. Data point Unit Frequency
of Collection Comments Refer-ence
1.14 Reason(s) for Downtime Event based
Linked to 1.12, please give reason for downtime and/ or select from provided list; if multiple downtime reasons please provide (estimated) share of downtime for each reason
1.14.1 Downtime for scheduled mainte-nance/upgrades SMU - Event based T
1.14.2 Downtime due to FC stack issues - Event based T
1.14.3 Downtime due to FC balance of plant - Event based e.g. humidifier, air compressor
1.14.4 Downtime due to electrical components - Event based e.g. electric engine, steering pump T
1.14.5 Downtime due to the on-board hydrogen storage tank - Event based T
1.14.6 Downtime due to the high voltage battery - Event based T
1.14.7 Downtime due to peripheral mechanical components - Event based e.g. doors, suspension T
1.15 Repair time h Event based If available from Maintenance system. Actual labour time spent for carried out maintenance/ re-pairs specified in 1.12.
1.16 Road call [dd/mm/yyyy] [hh:mm:ss] Event based
Indicates unplanned termination of service due to a failure with date and time stamp. Please specify reason for road call
1.17 Incidents [dd/mm/yyyy] [hh:mm:ss] Event based
If yes, information with time stamp and classification ac-cording to provided list below. In addition safety incident reporting to be carried out according to 1.18, not required for “regular” traffic accident w/o injury
T
1.17.1 Event type 1: Vehicle incident/ injury/ H2 release - Event based
1.17.2 Event type 2: Vehicle incident/ injury/ no H2 release - Event based

JIVE and MEHRLIN Performance Assessment Handbook
Grant Agreement no. 735582, 26 February 2018 81/94
FCB Data point no. Data point Unit Frequency
of Collection Comments Refer-ence
1.17.3 Event type 3: Vehicle incident/ no injury/ H2 release - Event based
1.17.4 Event type 4: Vehicle incident/ no injury/ no H2 release - Event based
1.17.5 Event type 5: Near Miss - Event based
1.18 Safety related incidents Event based Incidents affecting safety using the template as in Annex B
1.19 Hydrogen consumption kg Daily Measured on the bus, will be used to cross check with H2 refuelling data (data points 2.1, 2.3)
1.20 Operational, maintenance and fixed cost EUR/ local currency yearly Incl. material and labour, insurance and any service con-
tract fees excl. fuel cost (see 2.11) and VAT
Table 4-6: Data points for monitoring FC bus refuelling and recharging. T = Required for TRUST database of the FCH JU and brown coloured cell fill. Definitions provided in TRUST are included in the Comment column.
FCB Data point no. Data point Unit Frequency
of Collection Comments Refer-ence
2.1 Hydrogen refuelled kg Event based T
2.2 Station ID - Event based If available
2.3 Odometer reading km Event based T
2.4 Start of refuelling process dd.mm.yyyy hh:mm:ss Event based
2.5 End of refuelling process (end) dd.mm.yyyy hh:mm:ss Event based Alternatively duration of refuelling process is tracked in
[mm:ss]
2.6 Ambient temperature °C Event based at start of refuelling

JIVE and MEHRLIN Performance Assessment Handbook
Grant Agreement no. 735582, 26 February 2018 82/94
FCB Data point no. Data point Unit Frequency
of Collection Comments Refer-ence
2.7 Vehicle tank temperature at start of refuel-ling °C Event based Please specify once where the temperature is measured,
e.g. using a witness tank
2.8 Vehicle tank temperature at end of refuel-ling °C Event based
2.9 Vehicle tank pressure at start of refuelling bar Event based
2.10 Vehicle tank pressure at end of refuelling bar Event based
2.11 Hydrogen fuel cost EUR or lo-cal curren-cy/l or kg
Once / if changed Average H2 fuel cost excl. VAT
2.12 Electricity consumption during (overnight) parking kWh Daily
If applicable, e.g. anti-freeze protection, cabin heating, HV battery balancing collection frequency depends on where the electricity consumption is measured: daily – if measured from the vehicle side, monthly – if measured from the infrastructure side
2.13 Electricity charged kWh Event based If external HV battery recharging capability
2.14 Start SOC % Event based If external HV battery recharging capability
2.15 End SOC % Event based If external HV battery recharging capability
Table 4-7: Data points for monitoring reference bus operation. T = Required for TRUST database of the FCH JU and brown coloured cell fill. Definitions provided in TRUST are included in the Comment column.
RB Data point no. Data point Unit Frequency
of Collection Comments Refer-ences
3.1 Hours of bus operation h Daily Alternatively, this can be provided via time stamps for igni-tion on/off [dd/mm/yyyy] [hh:mm:ss]. T
3.2 Distance driven km Daily T
3.3 Driven distance on route km Daily Optional for operators using this metric
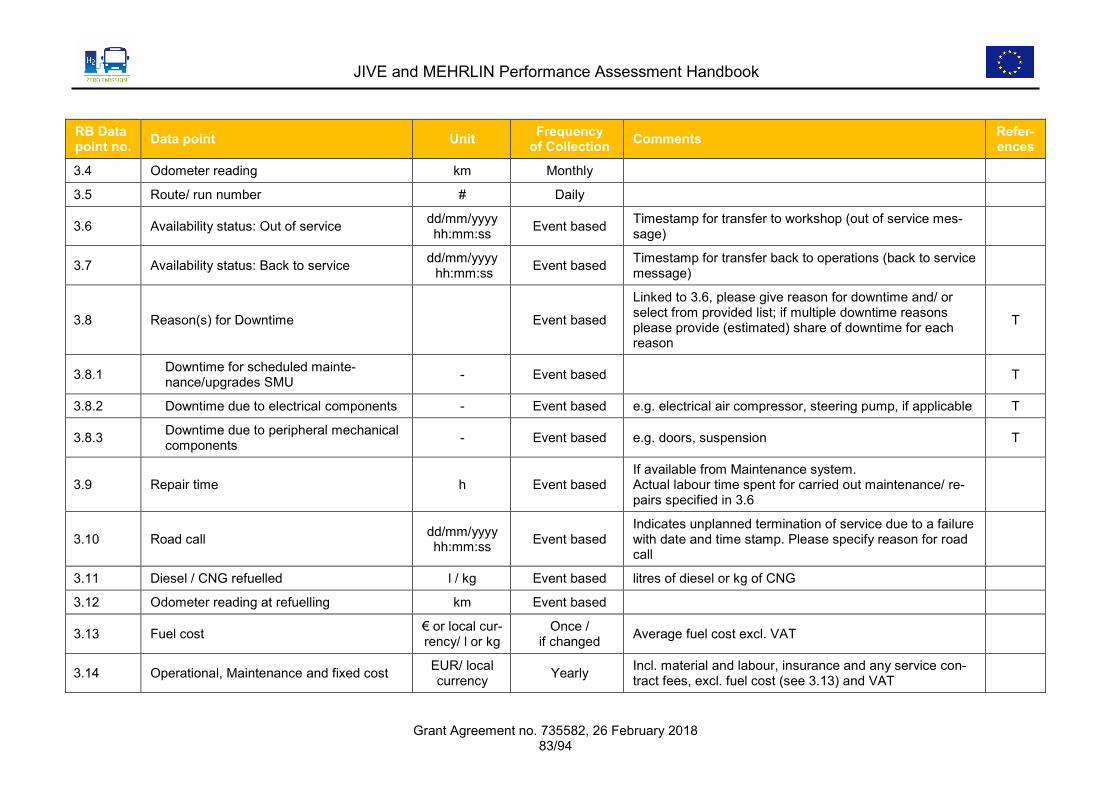
JIVE and MEHRLIN Performance Assessment Handbook
Grant Agreement no. 735582, 26 February 2018 83/94
RB Data point no. Data point Unit Frequency
of Collection Comments Refer-ences
3.4 Odometer reading km Monthly
3.5 Route/ run number # Daily
3.6 Availability status: Out of service dd/mm/yyyy hh:mm:ss Event based Timestamp for transfer to workshop (out of service mes-
sage)
3.7 Availability status: Back to service dd/mm/yyyy hh:mm:ss Event based Timestamp for transfer back to operations (back to service
message)
3.8 Reason(s) for Downtime Event based
Linked to 3.6, please give reason for downtime and/ or select from provided list; if multiple downtime reasons please provide (estimated) share of downtime for each reason
T
3.8.1 Downtime for scheduled mainte-nance/upgrades SMU - Event based T
3.8.2 Downtime due to electrical components - Event based e.g. electrical air compressor, steering pump, if applicable T
3.8.3 Downtime due to peripheral mechanical components - Event based e.g. doors, suspension T
3.9 Repair time h Event based If available from Maintenance system. Actual labour time spent for carried out maintenance/ re-pairs specified in 3.6
3.10 Road call dd/mm/yyyy hh:mm:ss Event based
Indicates unplanned termination of service due to a failure with date and time stamp. Please specify reason for road call
3.11 Diesel / CNG refuelled l / kg Event based litres of diesel or kg of CNG
3.12 Odometer reading at refuelling km Event based
3.13 Fuel cost € or local cur-rency/ l or kg
Once / if changed Average fuel cost excl. VAT
3.14 Operational, Maintenance and fixed cost EUR/ local currency Yearly Incl. material and labour, insurance and any service con-
tract fees, excl. fuel cost (see 3.13) and VAT

JIVE and MEHRLIN Performance Assessment Handbook
Grant Agreement no. 735582, 26 February 2018 84/94
4.5 Performance indicators
The indicators for assessing the performance of the FC buses and reference buses can be found in Table 4-8 and Table 4-10.
Many of the performance indicators also represent items that have to be entered into the TRUST (formerly TEMONAS) database of the
FCH JU (Reference “T”). This has to take place for every calendar year with demonstration activities.
Table 4-8: Performance indicators of FC bus operation. For diagnostic purposes, monthly or daily evaluations may carried out in addition to what is specified in the “Period” column. T = Required for TRUST database of the FCH JU. Definitions provided in TRUST are included in the Comment column.
Performance indicator number
Performance indicator Unit Period Parameters and
data points required
Comments Refer-ence
FCB-PI.1 (KPI FCB-4) Availability of bus %
Monthly, an-nually and
overall 1.12, 1.13
KPI target is > 90% See section 4.2.4 for details
T
FCB-PI.2 (KPI FCB-5) Mean distance between failures (MDBF) Km Annually and
overall 1.4 and count of
1.12 KPI target is >2,500 km See section 4.2.5 for details
T
FCB-PI.3 Mean distance between road calls (MDRC) km Annually and
overall 1.4 and count of
1.16
FCB-PI.4 Distribution downtime hours with respect to root causes % Annually and
overall 1.14.1 to 1.14.7 The causes for downtime are categorised, distinguishing between the provided cate-gories
T
FCB-PI 5 Ratio between actual repair time and Downtime % Annually and
overall 1.14.1 to 1.14.7,
1.15
This PI will allow to elaborate e.g. on wait-ing time for support, parts in comparison to reference buses
FCB-PI.6 TRL - Start/ middle/ end of project FCB.8 T

JIVE and MEHRLIN Performance Assessment Handbook
Grant Agreement no. 735582, 26 February 2018 85/94
Performance indicator number
Performance indicator Unit Period Parameters and
data points required
Comments Refer-ence
FCB-PI.7 (KPI FCB-2) Distance travelled km
Monthly, an-nually and
overall 1.4
KPI target is minimum annual distance of 44,000 km per bus See section 4.2.2 for details
T
FCB-PI.8 (KPI FCB-6) Specific fuel consumption
kg H2/ 100 km
Monthly, an-nually and
overall 2.1/ 1.19, 2.3
KPI target is in average < 9 kg H2/100 km See section 4.2.6 for details.
T
FCB-PI.9 Deviation of refuelling data % Annually and overall 2.1/ 1.19, 2.3
If data points 2.1 and 1.19 are both availa-ble, deviation between the two H2 refuelling data points
FCB-PI.10 (KPI FCB-7) Efficiency % Once FCB.P21.1/.2 KPI target is > 42%
See section 4.2.7 for details
FCB-PI.11 (KPI FCB-1) Vehicle operation lifetime years Once FCB.P22
KPI target is > 25.000 h See section 4.2.1 for details
T
FCB-PI.12 (KPI FCB-3) Operating hours per fuel cell system hours
Monthly, an-nually and
overall 1.2
KPI target is > 15.000 h See section 4.2.3 for details
T
FCB-PI.13 (KPI FCB-8) CAPEX EUR Once FCB-32
KPI target < 650 k€ for 12 m bus, < 1 M€ for 18m bus (excl. operator specific equip-ment. and taxes) See section 4.2.8 for details.
T
FCB-PI.14 (KPI FCB-9) OPEX EUR/km Annually and
overall
1.4, 1.20, 2.11, FCB.P36, FCB.P37
KPI target < 150 % of the equivalent costs for a conventional bus. See section 4.2.9 for details.
T
FCB-PI.15 Diesel fuel replaced l Annually and overall 3.11

JIVE and MEHRLIN Performance Assessment Handbook
Grant Agreement no. 735582, 26 February 2018 86/94
Table 4-9: Performance indicators of FC bus refuelling. Indicator is taken from Table 3-15 on HRU.
Note: This table may need to be extended to account for battery charging in case FC buses with plug-in functionality will be deployed.
Performance indicator number
Performance indicator Unit Period Parameters
and data points required
Comments
FCB-PI.16 (= HRU-PI.11)
Amount of hydrogen dispensed to the project buses overall and per bus
kg Monthly,
annually and overall
Used to double-check specific hydrogen consump-tion.
Table 4-10: Performance indicators of reference bus operation.
Performance indicator number
Performance indicator Unit Period Parameters and
data points required
Comments Refer-ence
RB-PI.1 Availability of bus % Monthly,
annually and overall
3.6, 3.7
RB-PI.2 Mean distance between failures (MDBF) km Annually and overall
3.2 and count of 3.6
RB-PI.3 Mean distance between road calls (MDRC) km Annually and
overall 3.2 and count of
3.10
RB-PI.4 Distribution downtime hours with respect to root causes % Annually and
overall 3.8.1 to 3.8.3 The causes for downtime are categorised, distinguishing between the provided cate-gories
RB-PI 5 Ratio between actual repair time and Downtime % Annually and
overall 3.8.1 to 3.8.3,
3.9
This PI will allow to elaborate e.g. on wait-ing time for support, parts in comparison to FC buses
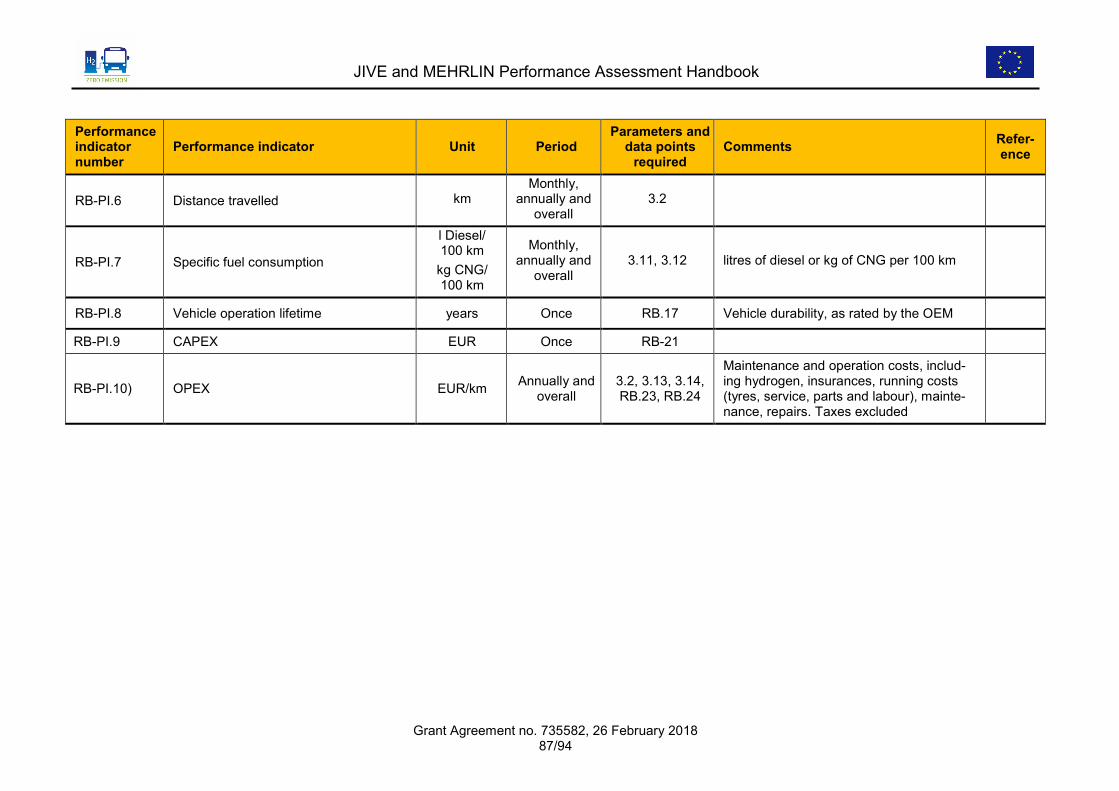
JIVE and MEHRLIN Performance Assessment Handbook
Grant Agreement no. 735582, 26 February 2018 87/94
Performance indicator number
Performance indicator Unit Period Parameters and
data points required
Comments Refer-ence
RB-PI.6 Distance travelled km Monthly,
annually and overall
3.2
RB-PI.7 Specific fuel consumption
l Diesel/ 100 km
kg CNG/ 100 km
Monthly, annually and
overall 3.11, 3.12 litres of diesel or kg of CNG per 100 km
RB-PI.8 Vehicle operation lifetime years Once RB.17 Vehicle durability, as rated by the OEM
RB-PI.9 CAPEX EUR Once RB-21
RB-PI.10) OPEX EUR/km Annually and overall
3.2, 3.13, 3.14, RB.23, RB.24
Maintenance and operation costs, includ-ing hydrogen, insurances, running costs (tyres, service, parts and labour), mainte-nance, repairs. Taxes excluded
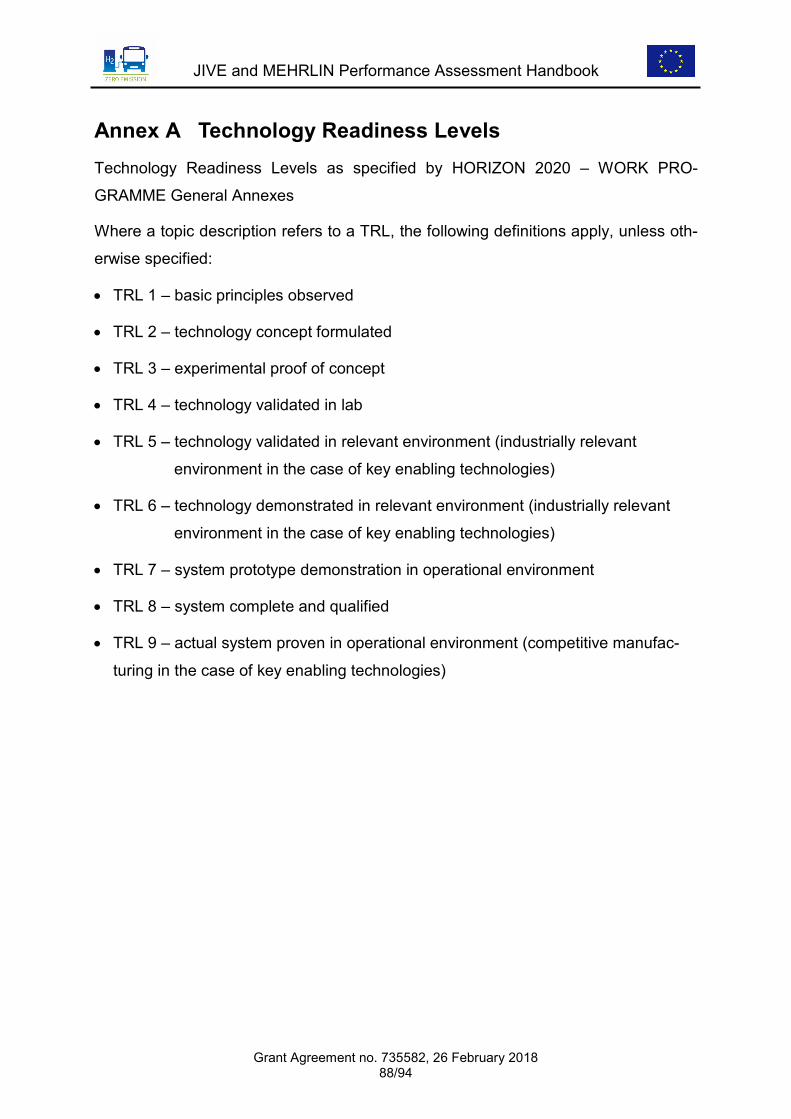
JIVE and MEHRLIN Performance Assessment Handbook
Grant Agreement no. 735582, 26 February 2018 88/94
Annex A Technology Readiness Levels Technology Readiness Levels as specified by HORIZON 2020 – WORK PRO-
GRAMME General Annexes
Where a topic description refers to a TRL, the following definitions apply, unless oth-
erwise specified:
• TRL 1 – basic principles observed
• TRL 2 – technology concept formulated
• TRL 3 – experimental proof of concept
• TRL 4 – technology validated in lab
• TRL 5 – technology validated in relevant environment (industrially relevant
environment in the case of key enabling technologies)
• TRL 6 – technology demonstrated in relevant environment (industrially relevant
environment in the case of key enabling technologies)
• TRL 7 – system prototype demonstration in operational environment
• TRL 8 – system complete and qualified
• TRL 9 – actual system proven in operational environment (competitive manufac-
turing in the case of key enabling technologies)
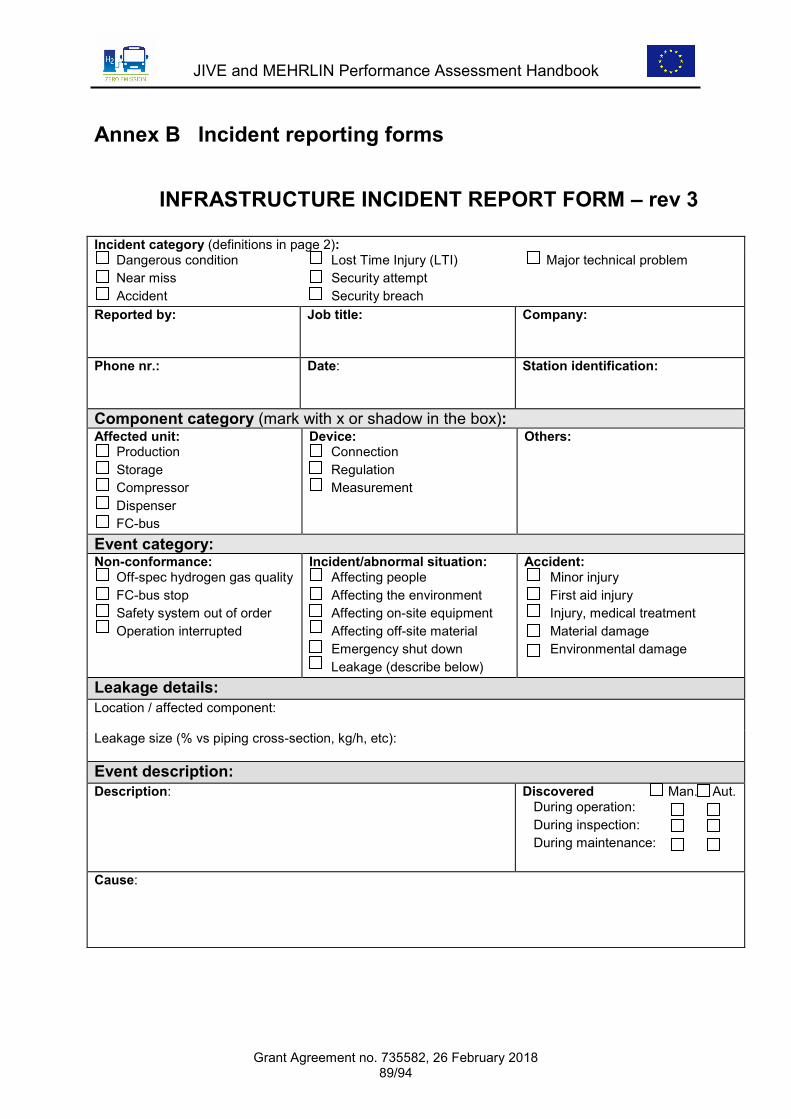
JIVE and MEHRLIN Performance Assessment Handbook
Grant Agreement no. 735582, 26 February 2018 89/94
Annex B Incident reporting forms
INFRASTRUCTURE INCIDENT REPORT FORM – rev 3
Incident category (definitions in page 2): Dangerous condition Near miss Accident
Lost Time Injury (LTI) Security attempt Security breach
Major technical problem
Reported by:
Job title:
Company:
Phone nr.: Date: Station identification:
Component category (mark with x or shadow in the box): Affected unit: Production Storage Compressor Dispenser FC-bus
Device: Connection Regulation Measurement
Others:
Event category: Non-conformance: Off-spec hydrogen gas quality FC-bus stop Safety system out of order Operation interrupted
Incident/abnormal situation: Affecting people Affecting the environment Affecting on-site equipment Affecting off-site material Emergency shut down Leakage (describe below)
Accident: Minor injury First aid injury Injury, medical treatment Material damage Environmental damage
Leakage details:
Location / affected component: Leakage size (% vs piping cross-section, kg/h, etc): Event description:
Description:
Discovered Man. Aut. During operation: During inspection: During maintenance:
Cause:
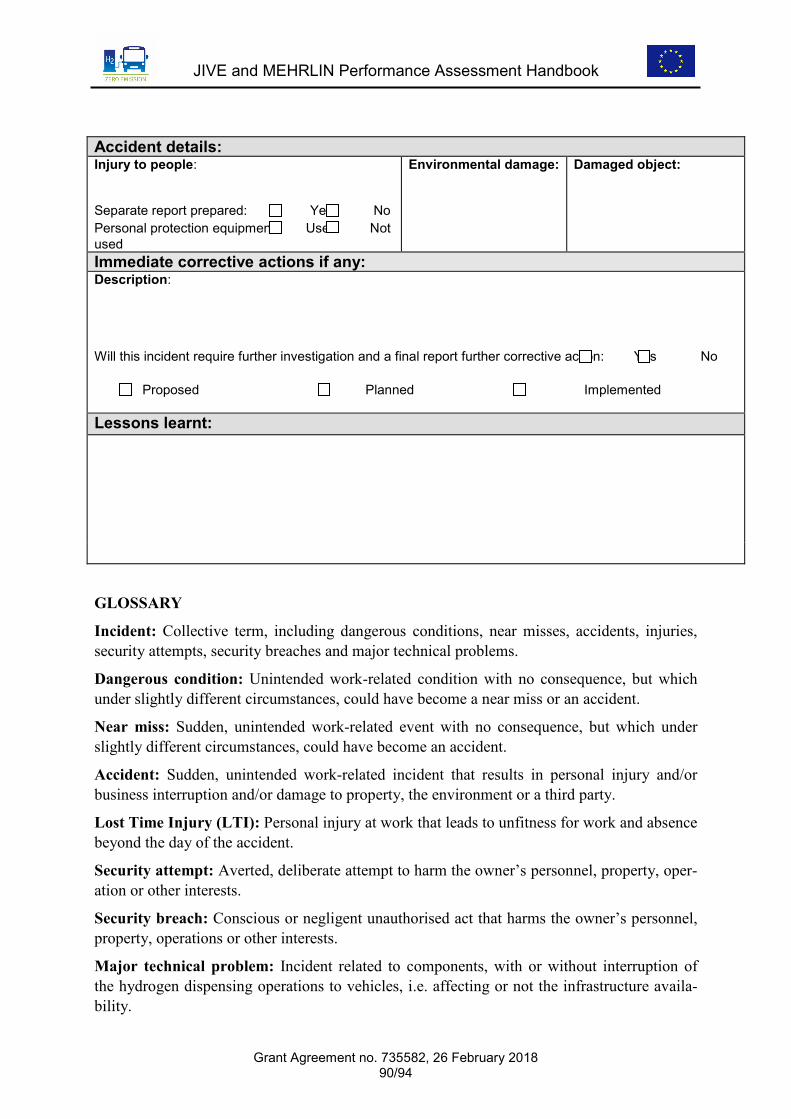
JIVE and MEHRLIN Performance Assessment Handbook
Grant Agreement no. 735582, 26 February 2018 90/94
Accident details:
Injury to people: Separate report prepared: Yes No Personal protection equipment: Used Not used
Environmental damage: Damaged object:
Immediate corrective actions if any:
Description: Will this incident require further investigation and a final report further corrective action: Yes No
Proposed Planned Implemented Lessons learnt:
GLOSSARY
Incident: Collective term, including dangerous conditions, near misses, accidents, injuries, security attempts, security breaches and major technical problems.
Dangerous condition: Unintended work-related condition with no consequence, but which under slightly different circumstances, could have become a near miss or an accident.
Near miss: Sudden, unintended work-related event with no consequence, but which under slightly different circumstances, could have become an accident.
Accident: Sudden, unintended work-related incident that results in personal injury and/or business interruption and/or damage to property, the environment or a third party.
Lost Time Injury (LTI): Personal injury at work that leads to unfitness for work and absence beyond the day of the accident.
Security attempt: Averted, deliberate attempt to harm the owner’s personnel, property, oper-ation or other interests.
Security breach: Conscious or negligent unauthorised act that harms the owner’s personnel, property, operations or other interests.
Major technical problem: Incident related to components, with or without interruption of the hydrogen dispensing operations to vehicles, i.e. affecting or not the infrastructure availa-bility.

JIVE and MEHRLIN Performance Assessment Handbook
Grant Agreement no. 735582, 26 February 2018 91/94
BUS INCIDENT REPORT FORM v1
Incident category (definitions on page 2): Vandalism Accident Fire/braise
Reported by:
Job title:
Company:
Phone nr.: Date/time: Bus identification:
Picture: please add a picture of the incident to this report form Specific definition (mark with x or shadow in the box) Vandalism: Hydrogen components High voltage components
Accident: Hydrogen components (roof) High voltage components (roof & Rear) Accident (bus driver and other parties involved, e.g. traffic accident)
Fire/braise: Hydrogen components High voltage components Standard bus components
Component category Affected unit: Tanks Pipe Fuel Cell High voltage battery Cable Converter
Device: Connector Regulation/ Valve Sensor
Others:
Event category: Non-conformance: Failure of the driver Safety system out of order Deficient maintenance Others:
Incident/abnormal situation: Affecting people Affecting the environment Affecting bus equipment Affecting off-bus equipment
(e.g. bus stand, maintenance hall) Emergency shut down Leakage (describe below)
Accident: Minor injury First aid injury Injury, medical treatment Material damage Environmental damage
Leakage details:
Location / affected component: Leakage size (% vs piping cross-section, kg/h, etc):
Use this incident report form in case of the following events: • Vandalism on hydrogen or high voltage components • Accidents caused by the bus driver and other parties (e.g. traffic accident) • Fire/braise of hydrogen, high voltage an conventional components
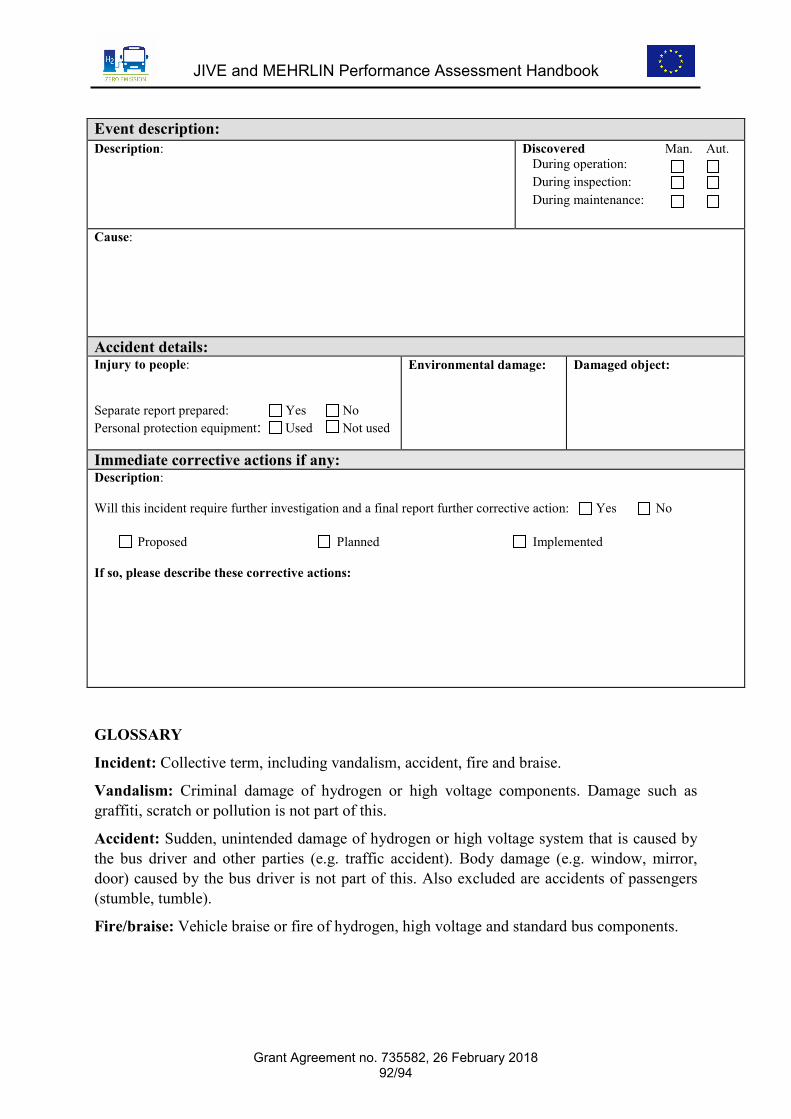
JIVE and MEHRLIN Performance Assessment Handbook
Grant Agreement no. 735582, 26 February 2018 92/94
Event description:
Description:
Discovered Man. Aut. During operation: During inspection: During maintenance:
Cause: Accident details:
Injury to people: Separate report prepared: Yes No Personal protection equipment: Used Not used
Environmental damage: Damaged object:
Immediate corrective actions if any:
Description: Will this incident require further investigation and a final report further corrective action: Yes No
Proposed Planned Implemented If so, please describe these corrective actions:
GLOSSARY
Incident: Collective term, including vandalism, accident, fire and braise.
Vandalism: Criminal damage of hydrogen or high voltage components. Damage such as graffiti, scratch or pollution is not part of this.
Accident: Sudden, unintended damage of hydrogen or high voltage system that is caused by the bus driver and other parties (e.g. traffic accident). Body damage (e.g. window, mirror, door) caused by the bus driver is not part of this. Also excluded are accidents of passengers (stumble, tumble).
Fire/braise: Vehicle braise or fire of hydrogen, high voltage and standard bus components.
JIVE and MEHRLIN Performance Assessment Handbook
Grant Agreement no. 735582, 26 February 2018 93/94
Annex C Changes Made to the Document Version Date Changes made

JIVE and MEHRLIN Performance Assessment Handbook
Grant Agreement no. 735582, 26 February 2018 94/94
Annex D References [Faltenbacher, Stolzenburg et al. 2011/14]
Faltenbacher, M.; Stolzenburg, K.; Bos, U; Reijalt, M; Lozanovski A.: Project Assessment Framework (CHIC deliverable 3.1), 2011/2014.
[Stolzenburg/Graham 2016] Stolzenburg, K; Graham, S.: Publishable Execu-tive Summary of the restricted Report on Hydro-gen Infrastructure Operation and Performance (CHIC Deliverable 1.5), 2016.
[Stolzenburg/Glatthor 2014] Stolzenburg, K; Glatthor, K.; Data Specification for the Project (HyTransit Deliverable 4.1a), 2014.
[NewBusFuel 2016] New Bus ReFuelling for European Hydrogen Bus Depots: Agreed definition of availability and relia-bility for bus depot fuelling stations and recom-mendations for appropriate availability enforce-ment mechanisms (NewBusFuel Deliverable No. 3.6), 2016.