Performance and operational effectiveness of evacuated flat plate solar collectors … ·...
14
Contents lists available at ScienceDirect Applied Energy journal homepage: www.elsevier.com/locate/apenergy Performance and operational effectiveness of evacuated flat plate solar collectors compared with conventional thermal, PVT and PV panels R.W. Moss a, ⁎ , P. Henshall b , F. Arya c , G.S.F. Shire a , T. Hyde c , P.C. Eames d a School of Engineering, University of Warwick, Coventry CV4 7AL, UK b Oxford Brookes University, formerly Centre for Renewable Energy Systems Technology, Loughborough University, UK c School of the Built Environment, University of Ulster, UK d Centre for Renewable Energy Systems Technology, Loughborough University, UK HIGHLIGHTS • A high vacuum increases efficiency and reduces heat losses. • Test results were in good agreement with theoretical models. • 50% higher efficiency than conventional panels or tubes at = ° T 100 C M , G = 1000 W/m 2 . • 104% increase over conventional flat plate in predicted heat to district main operating at 85 °C. • PVT panels are more effective than organic Rankine cycles for low temperature heat and power. ARTICLE INFO Keywords: Evacuated Flat plate Solar Collector Organic Rankine cycle Weather ABSTRACT The concept of an evacuated flat plate (EFP) collector was proposed over 40 years ago but, despite its professed advantages, very few manufacturers have developed commercial versions. This situation suggests both technical difficulties in manufacturing a competitively-priced sealed for life panel and a lack of awareness of the benefits of such panels. This paper demonstrates an evacuated flat plate simulation that closely models experimental efficiency measurements. Having established the validity of the model, it compares published data for a commercial EFP collector with predictions for an optimal design to investigate whether any further efficiency improvement might be possible. The optimised design is then evaluated against alternative solar energy devices by modelling a number of possible applications. These comparisons should inform choices about solar options for delivering heat: EFP collectors are well-suited to some of these applications. Evacuated flat plate collectors are a possible alternative to concentrating collectors for Organic Rankine Cycle power generation. The annual output for all the modelled collectors was found to be a quadratic function of delivery temperature: this enabled a novel optimisation of ORC source temperature. Predictions for con- centrating and non-concentrating ORC plant are compared with a PV/thermal alternative. The ORC output is significantly less than a PV panel would achieve; applications needing both heat and power are better served by PVT panels. This is an original and novel result. 1. Introduction 1.1. Evacuated flat plate solar thermal collectors Non-concentrating solar thermal collectors for low temperature applications such as domestic solar hot water (DSHW) conventionally adopt either a flat plate (FP) or evacuated tube (ET) format. Evacuated tube collectors can also be used for medium-temperature applications such as industrial process heat. Of the UK’s primary energy consumption approximately 26% is used for space heating [1]. The EU requirement for process heat in the 80–240 °C range has been estimated as 300 TWh per annum [2] and process heat is 38% of the US total energy use [3]. High efficiency solar thermal technologies can contribute to the decarbonising of these sec- tors. Evacuated flat plate (EFP) solar thermal collectors are anticipated to https://doi.org/10.1016/j.apenergy.2018.01.001 Received 9 August 2017; Received in revised form 18 December 2017; Accepted 1 January 2018 ⁎ Corresponding author. E-mail address: [email protected] (R.W. Moss). Applied Energy 216 (2018) 588–601 0306-2619/ © 2018 The Authors. Published by Elsevier Ltd. This is an open access article under the CC BY license (http://creativecommons.org/licenses/BY/4.0/). T
Transcript of Performance and operational effectiveness of evacuated flat plate solar collectors … ·...

Contents lists available at ScienceDirect
Applied Energy
journal homepage: www.elsevier.com/locate/apenergy
Performance and operational effectiveness of evacuated flat plate solarcollectors compared with conventional thermal, PVT and PV panels
R.W. Mossa,⁎, P. Henshallb, F. Aryac, G.S.F. Shirea, T. Hydec, P.C. Eamesd
a School of Engineering, University of Warwick, Coventry CV4 7AL, UKbOxford Brookes University, formerly Centre for Renewable Energy Systems Technology, Loughborough University, UKc School of the Built Environment, University of Ulster, UKd Centre for Renewable Energy Systems Technology, Loughborough University, UK
H I G H L I G H T S
• A high vacuum increases efficiency and reduces heat losses.
• Test results were in good agreement with theoretical models.
• 50% higher efficiency than conventional panels or tubes at = °T 100 CM , G= 1000W/m2.
• 104% increase over conventional flat plate in predicted heat to district main operating at 85 °C.
• PVT panels are more effective than organic Rankine cycles for low temperature heat and power.
A R T I C L E I N F O
Keywords:EvacuatedFlat plateSolarCollectorOrganic Rankine cycleWeather
A B S T R A C T
The concept of an evacuated flat plate (EFP) collector was proposed over 40 years ago but, despite its professedadvantages, very few manufacturers have developed commercial versions. This situation suggests both technicaldifficulties in manufacturing a competitively-priced sealed for life panel and a lack of awareness of the benefitsof such panels.
This paper demonstrates an evacuated flat plate simulation that closely models experimental efficiencymeasurements. Having established the validity of the model, it compares published data for a commercial EFPcollector with predictions for an optimal design to investigate whether any further efficiency improvement mightbe possible. The optimised design is then evaluated against alternative solar energy devices by modelling anumber of possible applications. These comparisons should inform choices about solar options for deliveringheat: EFP collectors are well-suited to some of these applications.
Evacuated flat plate collectors are a possible alternative to concentrating collectors for Organic Rankine Cyclepower generation. The annual output for all the modelled collectors was found to be a quadratic function ofdelivery temperature: this enabled a novel optimisation of ORC source temperature. Predictions for con-centrating and non-concentrating ORC plant are compared with a PV/thermal alternative. The ORC output issignificantly less than a PV panel would achieve; applications needing both heat and power are better served byPVT panels. This is an original and novel result.
1. Introduction
1.1. Evacuated flat plate solar thermal collectors
Non-concentrating solar thermal collectors for low temperatureapplications such as domestic solar hot water (DSHW) conventionallyadopt either a flat plate (FP) or evacuated tube (ET) format. Evacuatedtube collectors can also be used for medium-temperature applications
such as industrial process heat.Of the UK’s primary energy consumption approximately 26% is used
for space heating [1]. The EU requirement for process heat in the80–240 °C range has been estimated as 300 TWh per annum [2] andprocess heat is 38% of the US total energy use [3]. High efficiency solarthermal technologies can contribute to the decarbonising of these sec-tors.
Evacuated flat plate (EFP) solar thermal collectors are anticipated to
https://doi.org/10.1016/j.apenergy.2018.01.001Received 9 August 2017; Received in revised form 18 December 2017; Accepted 1 January 2018
⁎ Corresponding author.E-mail address: [email protected] (R.W. Moss).
Applied Energy 216 (2018) 588–601
0306-2619/ © 2018 The Authors. Published by Elsevier Ltd. This is an open access article under the CC BY license (http://creativecommons.org/licenses/BY/4.0/).
T

combine the high fill factor, ease of cleaning and visual aesthetics of FPcollectors with the low heat loss coefficient of ET collectors. Theyconsist of a flat absorber contained within an evacuated enclosure witha top glass cover. An array of pins supports the glass cover against at-mospheric pressure loading. Such collectors can achieve high opera-tional temperatures suitable for many industrial applications and alsooperate efficiently in low irradiance conditions, a valuable feature forsolar thermal collectors in the UK and at high latitudes. Unlike con-centrating collectors, EFP collectors do not track the Sun; they cantherefore be integrated into the building envelope, as the roof or fascia,where they can provide efficiency gains through building insulation[4,5]. The use of a façade to generate heat may also be valuable [6].
Two different designs of EFP collectors were built, each using aflooded panel absorber but with different enclosures. The test resultsare summarised here to demonstrate the accuracy of a simulationmodel: more comprehensive test details are given in Moss et al. [7].Further simulations, of an improved design, have demonstrated theadvantages for DSHW heating under typical UK irradiance conditionsand assessed the potential use of an organic Rankine cycle for powergeneration.
1.2. Recent developments in thermal collectors
Much research has taken place over the past 20 years to improveefficiency in conventional solar collectors. Suman et al. [8] provides adetailed overview of solar collector technology and configurationswhilst Colangelo et al. [9] reviews research into flat plate collectors
over the past decade.Collector efficiency is often characterised as = −η τα U T
GL M where TM
is the difference between absorber and ambient temperatures. An idealhigh-efficiency collector would combine a transmission-absorbanceproduct ≈τα 1 with a low heat loss coefficient UL and operate underhigh irradiance levels G. The optimisation of τα involves spectrallyselective coatings and absorption media. Selvakumar and Barshilia [10]has reviewed the use of PVD coatings for medium and high temperaturesolar thermal applications. Colangelo et al. [11] tested the viability ofnanofluids as selective absorbers. Anti-reflection coatings on the coverglass improve optical transmission: Caër et al. [12] developed a sol-geltechnique for reducing the refractive index of SiO2 to create a durableanti-reflection coating.
The absorber temperature is a key parameter in determining thechoice of solar collector. Domestic solar hot water (DSHW) applicationsonly require temperatures of order 70 °C but more novel applicationssuch as industrial process heat, combined heat and power (CHP) orrefrigeration require higher temperatures. Freeman et al. [13] in-vestigated the suitability of thermal collectors for small scale CHP.Absorption refrigeration systems require heat at 70–120 °C [14]. Alo-baid et al. [15] compared the merits of thermal collectors and PV panelsto power solar cooling systems.
High temperature applications such as thermal power stations ty-pically use concentrating collectors [16,17]: these minimise the effi-ciency penalty at high TM by effectively increasing the irradiance in-tensity G. The insensitivity to diffuse radiation, complexities of thetracking and the need for regular mirror cleaning mean that they tend
Nomenclature
AA frontal area of absorber (m2)Ag collector gross area (m2)C effective heat capacity of absorber (J/m2 K)Eu useful heat to absorber per time step (J/m2)E1 annual heat output for absorber at temperature T1 (Wh/
m2)Eeq Th, thermal equivalent of combined annual energy output
(Wh/m2)G total (beam+diffuse) irradiance (W/m2) measured per-
pendicular to collectorGclear predicted irradiance, clear conditions (W/m2)GE effective irradiance, with beam component perpendicular
to plate (W/m2)Gv irradiance reference value (W/m2)Isc solar irradiance above atmosphere (W/m2)Qu̇ useful heat output (W/m2)Q1̇ heat output with absorber at temperature T1 (W/m2)Ta ambient temperature (°C)Tg cover glass temperature (°C)Tp plate mean surface temperature (°C)Tenv environment radiative (sky) temperature (°C)THM heating main temperature (°C)TM mean temperature difference −T Tp a (°C)T T,1 2 absolute temperatures of heat transferred into and out of a
heat engine cycle (K)T opt1, heat delivery temperature that maximises value of energy
produced (K)UL overall heat loss coefficient (W/m2 K)a b c, , curve fit coefficients for heat outputa a k, ,0 1 standard atmosphere constants for mid-latitude climatef ratio of ORC to Carnot efficiency (second law efficiency)fd fraction of radiation that is diffuseh h,i o heat transfer coefficient (W/m2 K) to inward or outward-
facing glass surface
kτ weather clearness indexqabs rate of heat absorption in glass (W/m2)t time (seconds)v energy cost ratio, electricity:heatα α α, ,1 2 3 coefficients of efficiency polynomialεeg effective emissivity, environment to glassεpg effective emissivity, plate to glassηA efficiency based on absorber areaηg efficiency based on gross areaηORC Organic Rankine Cycle efficiencyη τα,0 transmission-absorbance productλ rate constant for exponential temperature step decayμ cycle profitability parameter −v f( 1)σ Stefan-Boltzmann constantτ τ,b d beam and diffuse transmission coefficients for clear at-
mosphere
Subscripts and superscripts
‘ linearised parameters
Abbreviations
CHP combined heat and powerDSHW domestic solar hot waterEFP evacuated flat plate collectorET evacuated tube collectorFP flat plate collector (non-evacuated)ORC Organic Rankine cyclePTC parabolic trough collectorPV photo-voltaic panelPVD physical vapour depositionPVT photo-voltaic/thermal panelRTD resistance temperature detectorTVP evacuated flat plate collector by TVP Solar
R.W. Moss et al. Applied Energy 216 (2018) 588–601
589

to be used only for large open-air installations in dry climates, thoughZou et al. [18] has proposed a domestic version for use in cold climates,Cohen and Grossman [19] built and tested a rooftop-mounted sphericalmirror concentrator and Buttinger et al. [20] developed a low con-centration, non-tracking trough collector. The latter’s use of low pres-sure krypton greatly reduced the heat loss and approximately doubledthe efficiency at = °T 100 CM .
Wang et al. [21] describes a high efficiency combination of evac-uated tube and concentrating rear reflector. Li et al. [22] evaluated theperformance of a non-imaging concentrator plus evacuated tubes tosupply heat for absorption chiller air-conditioning systems and Mwe-sigye and Meyer [23] compared three nano-fluids to improve heattransfer in a parabolic trough system. Qu et al. [24] built a 300 kWtrough collector with altazimuth tracking.
An alternative approach for obtaining high efficiency at elevated TMwithout the need for concentrating optics is to reduce both the radiationand conduction components of the heat loss coefficient UL. The radia-tive part may be minimised using highly selective surface treatments,for which many options are available [10]. Meanwhile various ap-proaches have been suggested to lessen the conduction component.Benz and Beikircher [25] examined the possibility of using a lowpressure (1–10 kPa) to inhibit convection together with krypton to re-duce the conductivity. Beikircher et al. [26] used a wide air gap toreduce conduction together with multiple intermediate glass or plasticfilms to inhibit convection. Ehrmann and Reineke-Koch [27] used adouble glazed cover glass. Brunold (SPF) [28] describes a prototypecollector using stacked 7mm diameter glass capillary tubes as a thicktransparent insulating layer that inhibits convection.
The use of a vacuum to eliminate conduction losses in a flat platecollector, in particular, has been studied by Benz and Beikircher [25]and Benvenuti and Ruzinov [29–31]. Conductivity in a gas is not afunction of pressure until at low pressures the molecular mean free pathexceeds the characteristic separation of the enclosure surfaces; beyondthis point the heat transfer coefficient between surfaces is proportionalto pressure but independent of the surface spacing [7].
Two evacuated flat plate collectors are available commercially. TheSRB design [29] uses a long, thin format (64 cm wide, up to 3m long)with an internal metal framework. The front and back glass covers aresupported by longitudinal ribs; the absorber uses copper strips that sitbetween the ribs and are welded to a stainless tube.
The TVP design [32,33] uses low melting point frit glass to seal thecover glass to a NiFe alloy edge spacer with a stainless steel back cover.The similarity in expansion coefficients between glass and this 48%nickel alloy avoids the shear stress peaks described by Henshall et al.[34]. The glass is supported by pillars passing through holes in theabsorber.
Many proprietary details of these commercial collector designs arehowever undocumented. The present investigation into theoretical andpractical aspects of EFP collectors is intended to provide definitive datato guide future evacuated flat plate collector designs. A novel com-parison with alternative panels aims to inform installation choices andpolicy decisions in the quest for a low-carbon future.
2. Manufacture and instrumentation of evacuated collectors
2.1. Enclosure styles
Two styles of collector were developed: they share a common ab-sorber design, mounted in different enclosures. In each case an array ofpillars supports the cover glass against the atmospheric pressure load.
The “tray” style of enclosure uses a stainless steel tray with a singlecover glass on the front [7,34]. This concept is intended for industrialprocess heat applications where the visual appearance of the back faceis not architecturally significant.
The “symmetrical” enclosure, Fig. 1 and Table 1, resembles a va-cuum double glazing panel in that it has a sheet of glass to the rear as
well as the front. The U-value is almost as low as for a vacuum glazingpanel and the glass rear face makes its appearance suitable for archi-tectural use in a building façade; it combines thermal insulation, heatcollection and solar shading.
The results presented here were taken from the symmetrical en-closure test using water with a corrosion inhibitor additive. Results forthe tray enclosure and further experimental details are given separatelyin Moss et al. [7].
Approximately 3% of the absorber area was taken up by the 49through holes, so only 97% of the “absorber area” actually absorbsheat. The ratio of absorber area/gross area was 68.3%; this is lowerthan the typical 89% for commercial flat panels because the latter aretypically 2m2 or more in area as well as having narrower edges(13–35mm, [35]). Full size evacuated flat panels would not be ex-pected to suffer a significant fill factor penalty relative to conventionalpanels.
2.2. Absorber manufacture
2.2.1. Configurations and coatingsFollowing initial investigations [36] into micro-channel and ser-
pentine tube absorbers a flooded design of absorber was chosen.0.7 mm T316 stainless steel sheets are hydro-formed and TIG welded toa 0.9 mm baseplate [37]. An array of through holes allows the glasssupport pillars to pass through the absorber without making contact,Fig. 2. The internal height is typically 2mm, increasing to 3.5mm nearthe intake and outlet connections.
Having eliminated gaseous conduction losses, the main heat lossmechanism is radiative transfer between absorber and cover glass.Many selective emissivity coating options were investigated includingcommercial solar panel coatings, black solar panel paint (Solkote®),black nickel [38,39] and black chrome plating, sol-gel [40] and PVDcoatings [10,41].
Commercial coatings after many years’ development now offeremissivities as low as 0.04. Four manufacturers were approached butnone were able to apply their coatings on a one-off basis to a weldedsteel absorber.
Black chrome plating was widely adopted as a spectrally-selectivesurface for solar panel use in the 1970s [42]. Two local black chromesuppliers were used. Chromium plating suffers from a highly non-linearrelationship between electric field strength and deposition rate: in trialsit proved very difficult to obtain a sufficiently uniform coating, parti-cularly when moving from small samples to the full size absorber. Thecoating typically achieved an absorbance of 0.95 or higher, whereblack, but attempts to keep the emissivity low often resulted in somepatches with only a minimal deposit.
Emissivity was measured over an 8× 8 grid using an R&D SystemsAE1 emissometer and was found to have considerable non-uniformity.The emissivity was generally higher than planned but was the best thatcould be achieved using local suppliers with general purpose plating as
Primary metal solder seal
Epoxy resin
Support pin
AbsorberInlet/outlet
Vacuum sleeve
Edge protection trim
Channel spacer
Front glass cover
Rear glass cover
Fig. 1. Collector cross-section (symmetrical enclosure).
R.W. Moss et al. Applied Energy 216 (2018) 588–601
590

opposed to specialist solar panel equipment.
3. Test facility and instrumentation
3.1. System components and test procedure
A dedicated solar simulator was designed and built for evacuatedpanel testing [43], Fig. 3. Four 400W halogen floodlights provided il-lumination; the light was directed down through a reflecting box to
generate multiple virtual images and achieve uniform illuminationwithout an extensive array of lamps. The illumination level was con-trolled by a variable transformer. The simulator illumination was cali-brated against input power using a Kipp and Zonen CMP-11 pyr-anometer. The electrical power was measured throughout each testusing a Hameg 8115 power meter.
A circulating bath heated the coolant to the desired test temperatureand pumped it up to a header tank from where it flowed under gravitythrough the absorber and a Coriolis mass flow meter, Fig. 3. Flowtemperatures were measured by Pt100 RTDs, two at absorber inlet andtwo at outlet. Glass temperatures were measured using thermocouplesbonded to the glass (Fig. 4) [43].
The vacuum system used an Edwards 18 two stage roughing pumpand a Speedivac E04 diffusion pump. Pressures were measured using aKJ Lesker combined vacuum gauge.
Type T thermocouples and Pt100 RTDs were used. Thermocouples(Fig. 4) were connected directly to a 16-bit data acquisition system. TheRTDs were connected via Weidmuller signal conditioning blocks, witheach RTD always using the same block, and were calibrated with coldand hot water in an insulated beaker prior to use. A pair of RTDs was
Table 1Design and test parameters.
Aperture area × =0.47 m 0.47 m 0.221 m2
Gross area × =0.52 m 0.52 m 0.27 m2
Glass thickness 4 mmPillar length 25mmPillar diameter 6 mmPillar array pitch 60mmAbsorber through-hole diameter 13mmHeat transfer fluid specific heat capacity (J/kg
K at 30, 80 °C)4180–4200 (water+ inhibitor)
Typical test flow rate 2 to 6.4 g/s (median 4 g/s)Typical inlet to outlet fluid temperature rise −1.8 to +7.4 °C (median 3 °C)
Fig. 2. Absorber prior to black chrome plating.
Fig. 3. Schematic diagram of the experimental facility.
thermo-couple
Fig. 4. Enclosure showing top glass thermocouples; the lower glass is instrumented si-milarly. The support pillars are visible through the glass. The two bare regions result fromplating conductors being bolted to these holes.
R.W. Moss et al. Applied Energy 216 (2018) 588–601
591

used at both inlet and outlet to reduce uncertainty and to check fortransducer drift.
During testing the collectors were supported by a 50mm thick sheetof polyurethane foam insulation to minimise any uncertainty regardingheat losses from the rear.
Once the header temperature was steady, water was allowed to flowunder gravity through a bubble trap, the collector, a Coriolis mass flowmeter and a needle valve before returning to the bath. The header tanktook a considerable time (1–2 h) to reach steady state so testing over thecourse of a day generally explored a range of illumination levels at asingle flow temperature. The absorber time constant was of order 2minand outlet temperature would largely stabilise about 6min afterchanging the illumination. There was however a much slower effect dueto the response of the tray and glass.
3.2. Vacuum sealing
The vacuum required continual pumping to maintain a sufficientlylow pressure; there was evidence of leakage across the solder seal [7].This did not affect the accuracy of the experimental measurements butit would clearly be unacceptable for a commercial product. Previousexperience in fabricating vacuum glazing samples using indium hadsuccessfully achieved a hermetic seal which needed no pump tomaintain the vacuum. The main challenge in the development ofevacuated flat plate collectors is to achieve sufficient vacuum-tightnessthat the pressure does not rise above 0.1 Pa over the lifetime of thepanel.
3.3. Test stability and instrumentation accuracy
The test data was collected on eight separate days. During each day,the flow temperature was held constant but the illumination level wasset to a number of different levels. The flow rate was also adjusted tomaintain wherever possible a temperature rise through the absorber inthe range 2–8 °C, giving a large enough temperature difference to allowaccurate measurement whilst avoiding excessive non-uniformity ofabsorber temperature between inlet and outlet port areas. The initialtime constant of the absorber outlet temperature in response to flow orillumination changes was of order 2min.
After setting each illumination and flow condition, testing con-tinued until RTD and thermocouple signals appeared sufficiently stablethat significantly different values could not be expected were the test tobe continued, within a practical time frame. Efficiencies were thencalculated as if the data were steady-state i.e. without any correction fortransient effects. Stability was assessed by curve fitting the data at eachcondition to determine the magnitude of the gradient. For the datapoints in Fig. 5 (below), the stability parameters were:
• mean absolute change in heat flux 0.6% per minute
• mean absolute change in top glass temperature 0.14 °C per minute
• mean absolute change in lower glass temperature 0.08 °C per minute
Coriolis meters are typically accurate to better than 0.1% whenmeasuring liquid flow.
Initial testing showed that the cover glass temperature rose to over50 °C under the solar simulator. Subsequent investigation [43] showedthere to be a long wavelength (> 3000 nm) infra-red component of thefloodlight spectrum which is absorbed by the glass instead of passingthrough. Simulations suggested that the efficiency with this illumina-tion spectrum is approximately 1% higher than the efficiency under anominal AM1.5 solar spectrum, if the efficiency is based on the pyr-anometer power reading and there is no change in cover glass tem-perature. A fan blowing over the top surface was used to limit the glasstemperature.
4. Test results
Test results under both atmospheric and high vacuum conditions areshown in Fig. 5.
The fact that the vacuum and non-vacuum tests each lie close to abest-fit straight line indicates that UL did not change significantly overthe testing range of fluid temperatures, = °T 20,31 and 51 CM .
These UL mean heat loss coefficients are higher than commercialstandards because of the poor emissivity of the black chrome plating.The difference between the 1 bar and evacuated UL values, 3.7W/m2 K,demonstrates the reduction in heat losses possible in an evacuatedsystem.
A steady-state heat balance simulation (Fig. 6, Table 2) investigatedthe necessary parameters for matching experimental data from the solarsimulator. The algorithm takes a pair of absorber and environmenttemperatures and solves a quartic heat balance equation to determinethe upper and lower cover glass temperatures:
− + − + + + + +
+ = =
ε ε σT h h T ε T ε T σ h T h T
q i
( ) ( ) ( )
0, 1,2 (upper,lower)
pg i eg i g i i i o i g pg i p eg i env i i p o i a
abs
, , ,4
, , ,4
,4
, ,
Heat transfer within the enclosure was predicted using radiative andlow-pressure conduction models; external heat transfer used a givenheat transfer coefficient to model the effect of the cooling fan (top) andthe insulating support pad (underneath). The glass emissivity was takenas 0.96.
To match the measured efficiency and upper glass temperature theabsorber top surface emissivity was raised above the measured levels.
An IR component equivalent to an additional 14.5% of the incidentpower [43] is included in the model and contributes to heating theupper glass cover. The fan increases the upper surface heat transfercoefficient above the 5.6W/m2 K expected by natural convection. Theincrease in lower surface heat transfer coefficient mimics the transienteffect of the lower glass being cooler than expected. The best fit com-bination of emissivities and heat transfer coefficients is dependent onthe assumption that the thermocouples properly determine the meanglass surface temperature. This is unproven: some deviation from theexpected values is unsurprising.
The general trend of efficiency in Fig. 6 following the experimentalpoints suggests that the necessary physical phenomena are being cor-rectly modelled and that the simulation code may safely be used topredict performance for an optimised panel with a lower emissivitycoating.
Fig. 5. Efficiency test results for atmospheric and high vacuum tests. The vacuum pres-sure was less than 0.03 Pa. 95% confidence limits for UL: [3.52, 3.78] and [7.02, 7.85]based on line fit statistics.
R.W. Moss et al. Applied Energy 216 (2018) 588–601
592

5. Simulations of performance based on weather data
5.1. Comparison with alternative solar collectors and PVT panels underconstant conditions
Fig. 7(a) compares a simulation of an optimised evacuated flat plateagainst typical efficiency trends for each kind of solar collector. Theoptimised simulation included anti-reflection coatings on both sides ofthe top cover and a selective absorber coating with = =α ε0.96, 0.04;coatings of this standard are commercially available. The simulationdescribed in Section 4 above was adapted to model outdoor applica-tions by including terms for radiation to the sky and convective heattransfer from the top cover. Mean relative humidity (72%) and daytimewind speed were obtained from six years’ data from the University ofWarwick weather station, located on top of the School of Engineeringbuilding in Coventry at 52°22′56″N, 1°33′43.5″W, [44]. Coventry wastaken as having a typically temperate European climate.
The mean convective heat transfer coefficient, 5.2W/m2 K, was
calculated from =hwVL
8.6 0.60.4 [70] and assumes a characteristic building
dimension of 8m (after Duffie and Beckman). 5.2W/m2 K is equivalentto a weighted mean wind speed of 1.73m/s from the weather data. Tofacilitate comparisons between flat plate and tubular collectors the ef-ficiencies in Fig. 7 have been based on gross area: =η ηg
AA AAg
.The collectors in Fig. 7 were chosen for comparison purposes as
examples of the higher efficiency models in the SPF online catalogue(Table 3). Their test data was downloaded from DIN CERTCO andcorrelated in terms of a cubic heat loss model:
= −+ +
η ηα T α T α T
G.g
M M M0
1 22
33
(1)
To further validate the collector efficiency model described in Section4, a simulation was performed to match the DIN CERTCO data pointsfor the TVP evacuated panel. The parameters listed in Table 4 werefound to closely model the TVP test result and are within the expectedrange for coating absorbance and emissivity.
The experimental absorbers and optimised simulation have intheory a slight advantage in that the flooded panel configurationachieves a collector efficiency factor F′ = 0.998 as opposed to an es-timated 0.968 for the tube-on-plate TVP design.
The experimental heat loss coefficient for the high vacuum fittedline in Fig. 5 (referred to gross area; absorber area values are 17%higher) is approximately 3W/m2 K at = °T 50 CM . The optimised si-mulation shows this could be reduced to 0.42W/m2 K by using a highquality coating.
The published performance of the TVP panel comes close to the
Fig. 6. Comparison of data with simulations (evacuated, fan on).
Table 2Comparison of estimated emissivities with best fit values.
Experiment Simulation
Upper surface h (W/m2 K) Unknown 22Absorber top α ε, Unknown, 0.385 0.82, 0.46Absorber underneath ε 0.15 0.15Lower surface h (W/m2 K) 0.44 1.8
Fig. 7. (a) Comparison of different collector technologies at G=1000W/m2. (b) Predicted output as a function of insolation (G) at TM = 60 °C.
R.W. Moss et al. Applied Energy 216 (2018) 588–601
593

optimised design simulated here. At =G 1000 W/m2 the optimisedevacuated panel has higher efficiency than other designs up to
= °T 245 CM : beyond this point the parabolic trough collector is moreefficient, albeit only in clear conditions when beam radiation is avail-able.
At this high radiation level and = °T 60 CM an optimised evacuatedflat plate could collect 13% more heat than a conventional flat panel or32% more than the same area of evacuated tubes; this increases toapproximately 50% relative to either flat panel or evacuated tube at
= °T 100 CM .The PVT panel in Fig. 7 is a simulation described as “stateof the art” by Matuska et al. [45] that predicted the performance thatshould be possible from a single-glazed flat panel collector with PV cellsbonded to the absorber surface. The thermal efficiency is lower than acomparable flat plate collector due to the electrical power extraction:the curve represents operation with maximum electrical output.
The parabolic trough collector in Fig. 7 (PolyTrough 1800) [46] hasa concentration factor of 54. Its efficiency curve was taken from themanufacturer’s data sheet as a DIN CERTCO certificate was unavailable.The gross area in Fig. 7 was estimated for vertical illumination, as-suming the closest trough pitch (2m) allowing full rotation withoutinterference. Trough arrays are generally arranged in a horizontal planewhereas flat plate and evacuated tube collectors are usually mountedon a sloping roof. At lower incidence angles the PTC fill factor increasesslightly, improving the efficiency and moving the intercept with theEFP curve down to = °T 210 CM .
Domestic hot water applications do not require this high tempera-ture capability but can benefit from the reduced heat loss at low irra-diance levels. Useful heat output is commonly defined as
= −Q G τα U T( )u L M [70]. At constant TM the heat loss coefficient UL isexpected to be constant. This results in a linear relationship betweenirradiance G and output Qu, Fig. 7(b). For = °T 60 CM the heat outputfrom the conventional panel becomes negative below a critical radia-tion level G=250W/m2 i.e. the circulating pump would need to beswitched off to prevent the water cooling down. The evacuated flatpanel reduces this critical level to 60W/m2.
5.2. Simulation of monthly heat output, at constant delivery temperature,using historical weather data
A number of researchers have studied the transient response of solarcollectors or used weather data as a basis for comparisons. Zambolinand Col [47] compared flat plate and evacuated tubes collectors, ob-taining daily average efficiencies. Zima and Dziewa [48] measured and
modelled the fluid outlet temperature from a flat plate collector. Ro-dríguez-Hidalgo et al. [49] studied the importance of thermal inertia incollector efficiency models. Amrizal et al. [50] measured the timeconstant for fluid outlet temperature from a PVT panel following aradiation step. Gao et al. [51] simulated evacuated tube transient re-sponse for water-filled and U-tube collectors and found that heat ca-pacity effects required modelling to avoid over-prediction of the heatoutput. Agrawal and Tiwari [52] used average hourly climate data atfour locations in India to predict performance for a PVT module.
The University of Warwick weather data includes irradiance, windspeed and temperature sampled at 1min intervals over six years(2011–2017). The distribution of irradiance G for all times when theSun is above the horizon and in front of a south-facing panel at 30° tothe horizontal is shown in Fig. 8. As an indication of the local climate,the “Clear sky” line shows the predicted irradiance distribution (due tosolar angle to panel and zenith angle) if every day were clear. The airtemperature over the same period is very close to a Normal distributionwith mean 13.2° and standard deviation 5.9 °C.
The weather data set was used in a simulation of collector heatoutputs for four different styles of collector, Fig. 9(a).
The University of Warwick district heating main was taken as anotional example of a vacuum insulated collector application. Thepyranometer recorded the total (beam plus diffuse) radiation levels: analgorithm (Appendix A) was used to estimate the beam component andinclude incidence angle modifier effects.
The simulation uses a transient response algorithm which importsthe data set for each month and predicts the absorber temperature andheat output for each minute using a time-marching scheme (AppendixB). In terms of functionality it is similar to ScenoCalc [53] which is usedby SPF to generate DIN CERTCO certificates. Whereas ScenoCalc is anExcel application however, the present code uses Matlab to simplifyimporting over 3 million weather data records and generating outputsspanning a wide range of absorber temperatures.
The algorithm assumes that the heat transfer fluid would be pumpedwhenever the net heat output was positive and turned off at othertimes; when pumped, the fluid would be limited to the heating main
Table 3Data sources used for Fig. 7.
Key Type Manufacturer Model Data source
Optimised EFP Evacuated flat plate Simulation onlyTVP simulation Evacuated flat plate TVP V3 KeyMark test [69] websiteET Evacuated tubes EnerTec Enersol HP 70–24 [69] websiteConventional FP Flat plate Savo-Solar SF500-15 [69] websitePVT Combined PV/Thermal panel Simulation [45] with maximum electrical outputParabolic trough collector Concentrating collector NEP Solar [46] Web site (NEP simulation)
Table 4Evacuated flat plate simulation parameters used for Fig. 7.
TVP collector Optimised collector
Glass transmittance 0.948 0.97Coating absorbance 0.87 0.95Coating emissivity 0.07 0.04Collector efficiency factor F’ 0.968 0.998External heat transfer coefficient (W/m2 K) 5.2 5.2Thermal bridging loss ( = °η TΔ at 50 CM ) 0.02 0.02Aperture: gross area ratio A A/A G 0.849 0.86
Fig. 8. Annual irradiance distribution from University of Warwick weather data.
R.W. Moss et al. Applied Energy 216 (2018) 588–601
594

temperature (taken for simplicity as a constant, THM = 85 °C). While Gis below the critical level (whether over-night or during a period of poorlight) the model predicts absorber temperature to determine when thenext heat delivery period begins.
Fig. 9(b) shows the annual variation in “availability”, defined as thefraction of the time with sun shining on the collector for which theinsolation exceeds the critical level at the heating main temperature.
Comparison of the transient temperature analysis with one basedpurely on the instantaneous radiation level shows the impact of ab-sorber heat capacity on monthly output, Fig. 9(c).
In June the weather is warm and relatively little time is lost whileraising a cold absorber up to the heating main temperature; converselyin December transient effects become more significant. The dependenceon heat capacity C seen in Fig. 9(c) shows that in Winter the absorber isregularly cooled towards an asymptotic level (ambient) as opposed tofollowing a short-term linear cooling and heating time history. Thelatter case would not be significantly influenced by varying a panel’sheat capacity. The heat capacities used for Fig. 9(a) and the associatedannual efficiency and heat output are given in Table 5.
5.3. Panel area required to meet a low-temperature heat demand in Winter
UK is committed to cutting its carbon dioxide emissions by 2050 to20% of the 1990 level. It may be very difficult to substantially reduceemissions in some industrial and transport applications. Domestic heatand hot water supplies may therefore have to be almost completelycarbon-neutral by that date.
One option would be to install a sufficient area of evacuated solarcollectors to supply the required heat, even in cold weather with lowradiation levels. Conversely a PV or PVT panel could be used with theelectrical output driving a heat pump. The PV panel has a potentialadvantage in that it can be located at a distance from the property andeven perhaps in a country with more sunlight in Winter.
A “PHRIE 95” air source heat pump [54] was empirically modelledas:
= − ⩽ ⩽COP COP COP0.578 1.29, 1 5Carnot
The Carnot cycle COP was based on absorber temperature and airtemperature from the weather data.
Fig. 10 compares the output predicted using the December weatherdata for an evacuated flat plate, conventional evacuated tubes and flatplates, Matuska’s PVT and a PV panel; any electrical output is convertedto heat via a heat pump. PV and PVT electrical efficiency was assumed[45] to be
= − − °η e0.15eT0.0045( 25 C) (2)
The cross-over point at 58 °C shows that above this temperature thepanel area required to meet the heat demand would be smaller for theevacuated flat plate. The heat pump COP increases as the deliverytemperature is reduced and below 58 °C a PVT panel plus heat pumpcould meet the demand with a smaller area than evacuated flat plates.Either option would require thermal storage to provide heat on demandthroughout the day.
Given sufficient storage a temperature of 40 °C would be sufficientfor domestic hot water. The graph shows a clear advantage in adoptingunder-floor heating and similar means for using heat at the lowestpossible temperature to minimise the required panel area.
At 40 °C the PV+HP curve in Fig. 10 requires 37% more area thanthe PVT+HP. A map of daily mean solar radiation over Europe inDecember [55] shows approximately 0.45 kWh/m2 over Coventrycompared with 2.2 kWh/m2 in southern Spain. Given a sufficientelectrical transmission capability with a nominal 90% efficiency itmight be possible to replace 1m2 of roof-mounted PVT panel in the UKwith 0.31m2 of PV panel in Spain, to generate the same heat output at40 °C in December.
5.4. Annual output from thermal and PVT panels as a function of deliverytemperature
A number of papers have described possible combined heat andpower (CHP) applications for high efficiency solar collectors using ei-ther hybrid PVT panels or (Section 5.5) thermal panels driving Stirlingengines or Organic Rankine Cycle (ORC) systems.
Ancona et al. [56] investigated the suitability of a dish array to il-luminate a high efficiency PVT collector. Crisostomo et al. [57] studiedthe use of selectively absorbing nanofluids in PVT collectors. Modjinouet al. [58] tested a novel PVT panel based on micro-channel heat pipes.
Fig. 9. (a) Predicted heat transfer to a district heating main based on weather station insolation and ambient temperature data for 2011–2017, assuming that the pump switches offwhenever the heat flux would be negative. (b) “Availability” when insolation exceeds the critical level. (c) Effect of varying the absorber heat capacity for the optimised collector andconventional flat panel. Data points show nominal mc values. See Table 3 for abbreviations.
Table 5Estimates for absorber heat capacity used for the Fig. 9 (a, b) simulations together withmean annual output (kWh/m2 gross area) and annual mean efficiency over the weatherdata illuminated period for an absorber temperature of 85 °C.
Heat capacity C(J/m2 K)
Annual output(kWh/m2)
°η85 C
Optimised evacuated flat plate 12,600 678 0.607TVP 5300 594 0.532Evacuated tube 4700 392 0.351Flat plate (Savo SF500
microchannel)10,500 333 0.298
R.W. Moss et al. Applied Energy 216 (2018) 588–601
595

Bianchini et al. [59] compared the performance and installation costs ofPVT panels against separate PV and solar thermal collectors and con-cluded that a conventional flat plate collector performed better inWinter than his PVT collector due to the latter’s high loss coefficient,
=U 14.4 W/m KL2 .
Compared with a PVT panel, an evacuated flat plate has a muchlower heat loss coefficientUL and is likely to produce more heat in coldconditions with weak insolation; conversely in terms of energy pricingelectricity is more valuable than heat. A cost-benefit analysis was per-formed assuming = =v 3.2Cost of electricity (£ / kWh)
Cost of gas (£ / kWh) (as Moss [36]) leadingto a definition of instantaneous Equivalent Thermal Output
= +Q Q vWeq Th th elec, (Watts) and annual total output for a PVT (orthermal panel, setting =W 0elec ):
∫ ⎜ ⎟= + ⎛⎝
⎞⎠
+E Q vW t( )d Wh/meq Th th elec, 1 year2
This provides a clearer insight into the merits of each system than anexergy analysis. If the installation used the electrical output of the PVTpanel to power a heat pump with a coefficient of performance
=COP 3.2 the total heat output would equal Eeq Th, . Heat pumps typi-cally provide a COP in this range at delivery temperatures of 35 °C butCOP falls at higher temperatures.
A similar analysis to Section 5.2 investigated the dependence of E1on evacuated flat plate absorber temperature over the six year weatherdata period, Fig. 11.
When comparing flat plate efficiencies with the PTC beam powerefficiency at =G 1000 W/mT
2 (Fig. 7(a)) it should be noted that thebeam component estimated from the weather station data is only 52%of the total radiation (2.10 GJ/m2 versus 4.02 GJ/m2 annually). Para-bolic trough collectors typically capture none of the diffuse radiationcomponent: they therefore perform poorly in comparison to the evac-uated flat plate at the lower temperature limit in Fig. 11. The weatherdata simulation used a trough pitch of 2.13 m which for a latitude of 52°results in zero shading and highest fill factor at the maximum solarelevation (60°). For comparison purposes, gross area for a trough arrayis defined here as the projection of the horizontal trough array areaonto a 30° slope. The intention was for the projected beam-normal areato match the slope-mounted FP, ET and PVT collector areas when theSun was due South at 60° elevation. The trough collectors were assumedto track in elevation about an East-West axis but not in azimuth.
At the lowest temperature in Fig. 11 (60 °C) the value of energyproduced annually by a PVT panel (dashed line) is 59% higher than fora conventional flat plate and 4% higher than for the optimised EFP. Thismatches the conclusions of Herrando and Markides [60] regarding thepotential benefit in terms of CO2 emissions from using PVT panels in a
domestic context. Above 70 °C however the EFP becomes the mostprofitable, producing for instance 56% more energy value at 130 °Cthan the PVT panel.
A hybrid PVT panel could in principle be evacuated to improve thehigh temperature efficiency: this would give a higher equivalentthermal output than any of the cases simulated here. Such a panelwould require PV cells and wiring with very low outgassing rates. Thishas yet to be realised for flat plate PVT collectors; Abdelhamid however[61] tested a concentrating PVT collector with vacuum-insulated GaAscells cooled by mini-channels, achieving 8% electrical efficiency to-gether with 33% thermal efficiency at 365 °C.
The parabolic curve fits in Fig. 11 characterise the annual thermaloutput for analytical purposes as
∫ ⎜ ⎟= ≈ + + ⎛⎝
⎞⎠
+E Q t aT bT cd Wh/mK K1 1 year 1 12
12
(3)
The coefficients in Table 6 are defined in terms of absolute temperatureT K1 for compatibility with Section 5.5.
5.5. Potential applications in conjunction with an organic Rankine cycle
5.5.1. Effect of varying cycle peak temperature T1The thermal output from a solar collector at absolute temperature T1
may be used to drive a heat engine that rejects heat at temperature T2.This can be an effective way of either (i) generating power in situationswhere the rejected heat has no value or (ii) generating a more modestpower output when the primary purpose is heat generation (for water,space heating or storage) but the solar collector is able to operate ef-ficiently at a higher temperature than the application requires. Athermal system sized to provide a useful thermal output in Winter islikely to produce a surplus of heat in Summer: this surplus heat candrive an ORC to generate electricity.
Concentrating solar generating stations [17] operate in the firstmode and are in competition with photovoltaic (PV) panels. These aretypically large installations using concentrating collectors and a steamRankine cycle; they operate in venues with very little cloud cover.
The second situation might use non-concentrating collectors togenerate heat even in conditions of diffuse light. Temperatures aregenerally lower than with concentrating collectors leading to the use oforganic fluids instead of water for the power cycle. Freeman et al. [13]investigated solar thermal collectors supplying heat to an OrganicRankine Cycle (ORC) and Lee et al. [62] used a solar chimney to poweran ORC. Quoilin et al. [63] studied the optimal design of a troughcollector coupled to an ORC. None of these papers evaluated the per-formance of an ORC relative to the PV or PVT alternative.
Fig. 10. Potential to deliver DSHW heat in December as a function of delivery tem-perature.
Fig. 11. Effect of absorber temperature on annual heat output and (PVT) combinedequivalent output Eeq th, .
R.W. Moss et al. Applied Energy 216 (2018) 588–601
596
The excellent medium-temperature efficiency of an evacuated flatplate collector suggests that it might find some application as an ORC orStirling engine heat source in place of concentrating collector designsand that this combination might challenge PVT collectors in providingboth power and heat. A simple simulation has been performed to testthis hypothesis: as above, the concept of a “equivalent thermal output”with cost ratio =v 3.2 has been used to provide a single performancemetric. The electrical efficiency of an organic Rankine cycle may bedefined as a “Second Law efficiency” (fraction of the Carnot cycle ef-ficiency) between the same temperatures, =f η
ηORC
Carnot. The efficiency
ratio f typically lies in the range 0.3–0.5 [64,65] and depends on choiceof working fluid together with the alternator and expander efficiencies;the highest value identified by Landelle was =f 0.6.
The equivalent instantaneous thermal output may be defined interms of source and sink absolute temperaturesT T,1 2 and the heat fluxQ1obtained with the absorber at T1:
⎜ ⎟
= − +
= ⎛
⎝⎜ + ⎛
⎝− ⎞⎠
− ⎞
⎠⎟
⎛
⎝⎜
⎞
⎠⎟( )
Q Q η vQ η
Q v f
(1 )
1 1 1 W/m
eq Th ORC ORC
TT
, 1 1
122
1
To allow a significant cycle efficiency at modest source temperaturesthe sink temperature T2 was set at 333 K (≈ 60 °C) as opposed to the85 °C heating main temperature in Section 5.2. 60 °C would be suffi-cient for domestic hot water or a lower temperature “Fourth Genera-tion” heating main.
It was assumed that any practical ORC would operate between twofixed temperatures dictated by the choice of organic fluid and that itsoutput power could be modulated depending on the heat input. Themodel assumed for simplicity that sufficient flow of heat transfer fluidcould be provided such that any temperature differences between ab-sorber and ORC maximum, or ORC minimum and hot water sink, wouldbe small enough to be neglected.
The annual energy output is a function of the time history of theheat flux from the collector operating at temperature T1:
⎜ ⎟ ⎜ ⎟= ⎛
⎝⎜ + ⎛
⎝− ⎞⎠⎛⎝− ⎞
⎠⎞
⎠⎟
⎛
⎝⎜
⎞
⎠⎟E v f T
TE1 1 1 Wh/meq Th,
2
11
2
(4)
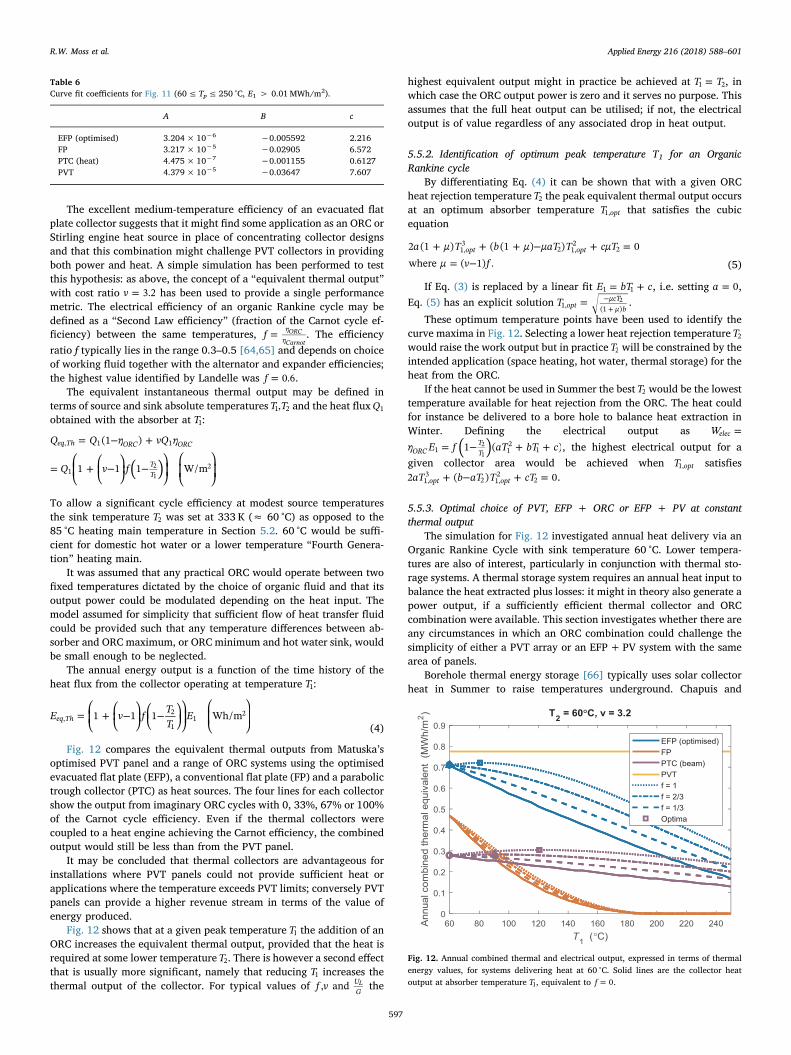
Fig. 12 compares the equivalent thermal outputs from Matuska’soptimised PVT panel and a range of ORC systems using the optimisedevacuated flat plate (EFP), a conventional flat plate (FP) and a parabolictrough collector (PTC) as heat sources. The four lines for each collectorshow the output from imaginary ORC cycles with 0, 33%, 67% or 100%of the Carnot cycle efficiency. Even if the thermal collectors werecoupled to a heat engine achieving the Carnot efficiency, the combinedoutput would still be less than from the PVT panel.
It may be concluded that thermal collectors are advantageous forinstallations where PVT panels could not provide sufficient heat orapplications where the temperature exceeds PVT limits; conversely PVTpanels can provide a higher revenue stream in terms of the value ofenergy produced.
Fig. 12 shows that at a given peak temperature T1 the addition of anORC increases the equivalent thermal output, provided that the heat isrequired at some lower temperatureT2. There is however a second effectthat is usually more significant, namely that reducing T1 increases thethermal output of the collector. For typical values of f v, and U
GL the
highest equivalent output might in practice be achieved at =T T1 2, inwhich case the ORC output power is zero and it serves no purpose. Thisassumes that the full heat output can be utilised; if not, the electricaloutput is of value regardless of any associated drop in heat output.
5.5.2. Identification of optimum peak temperature T1 for an OrganicRankine cycle
By differentiating Eq. (4) it can be shown that with a given ORCheat rejection temperatureT2 the peak equivalent thermal output occursat an optimum absorber temperature T opt1, that satisfies the cubicequation
+ + + − + == −
a μ T b μ μaT T cμTμ v f
2 (1 ) ( (1 ) ) 0where ( 1) .
opt opt1,3
2 1,2
2
(5)
If Eq. (3) is replaced by a linear fit = +E bT c1 1 , i.e. setting =a 0,Eq. (5) has an explicit solution = −
+T opt
μcTμ b1, (1 )
2 .
These optimum temperature points have been used to identify thecurve maxima in Fig. 12. Selecting a lower heat rejection temperatureT2would raise the work output but in practiceT2 will be constrained by theintended application (space heating, hot water, thermal storage) for theheat from the ORC.
If the heat cannot be used in Summer the bestT2 would be the lowesttemperature available for heat rejection from the ORC. The heat couldfor instance be delivered to a bore hole to balance heat extraction inWinter. Defining the electrical output as =Welec
= − + +( )η E f aT bT c1 ( )ORCTT1 1
21
21
, the highest electrical output for agiven collector area would be achieved when T opt1, satisfies
+ − + =aT b aT T cT2 ( ) 0opt opt1,3
2 1,2
2 .
5.5.3. Optimal choice of PVT, EFP + ORC or EFP + PV at constantthermal output
The simulation for Fig. 12 investigated annual heat delivery via anOrganic Rankine Cycle with sink temperature 60 °C. Lower tempera-tures are also of interest, particularly in conjunction with thermal sto-rage systems. A thermal storage system requires an annual heat input tobalance the heat extracted plus losses: it might in theory also generate apower output, if a sufficiently efficient thermal collector and ORCcombination were available. This section investigates whether there areany circumstances in which an ORC combination could challenge thesimplicity of either a PVT array or an EFP+PV system with the samearea of panels.
Borehole thermal energy storage [66] typically uses solar collectorheat in Summer to raise temperatures underground. Chapuis and
Table 6Curve fit coefficients for Fig. 11 (60≤ Tp≤ 250 °C, E1 > 0.01MWh/m2).
A B c
EFP (optimised) 3.204× 10⁻⁶ −0.005592 2.216FP 3.217× 10⁻⁵ −0.02905 6.572PTC (heat) 4.475× 10⁻⁷ −0.001155 0.6127PVT 4.379× 10⁻⁵ −0.03647 7.607
Fig. 12. Annual combined thermal and electrical output, expressed in terms of thermalenergy values, for systems delivering heat at 60 °C. Solid lines are the collector heatoutput at absorber temperature T1, equivalent to =f 0.
R.W. Moss et al. Applied Energy 216 (2018) 588–601
597

Bernier [67] studied a Canadian district heating system. They simulatedtwo systems with different ratios of storage volume to collector area,resulting in borehole temperatures that cycled between 45 and 70 °C(9.6 m3 storage per m2 collector) or, for lower heat losses, 10 and 15 °C(154m3 storage per m2 collector). The latter option in conjunction witha heat pump achieved much lower heat losses as well as improvedcollector efficiency.
Ground temperatures at 1m depth in the UK range from 8.8 to12.7 °C (North-South) and rise by 2.6 °C per 100m depth increase [68].As a conservative estimate for the present investigation it was assumedthat an ORC rejecting heat to a borehole might operate with heat re-jection at 25 °C and be used to produce power for the six monthsApril–September while charging the heat store. The highest feasibleefficiency ratio =f 0.6 was assumed for the ORC. Fig. 13 compares thepossible electrical output from an ORC against the same area of PVpanels. The annual thermal output profile from Fig. 11 results in a peakelectrical output for an EFP-heated system when the peak temperatureis 142 °C, Fig. 13. A similar system heated using a parabolic troughcollector would generate peak power at 191 °C but the inability toutilise the diffuse radiation component present in the Coventry weatherdata results in the PTC electrical output being only half the EFPequivalent.
At G<1000 W/m2 the efficiency curves in Fig. 7(a) compress to-wards the y-axis in accordance with Eq. (1). At 400 W/m2 (upperquartile of G, Fig. 8) the EFP and PTC efficiency curves would intersectat = °T 125 CM . i.e. >η ηPTC EFP for >T G/ 0.31M . If the PTC were re-placed by a hypothetical collector having the PTC efficiency curve butthe EFP’s ability to absorb diffuse radiation, the peak output (“PTC (allradiation)” curve, Fig. 13) would increase by 117%. The differencesbetween curves in Fig. 13 illustrate the effects of lowering UL (EFPversus PTC all radiation) and then losing the diffuse component (PTCbeam only). For reference, increasing the beam fraction to 82% (clearday), with the same irradiance, would raise the “PTC beam only” outputby a mere 47% because of the area sensitivity to incidence for beamradiation.
The university has an array of PV panels near the weather station:rather than using the electrical output data, however, a simulatedoutput was derived from the same pyranometer values used in thethermal collector predictions to ensure strict comparability. PV effi-ciency falls with panel temperature: the temperature of PV panels ad-jacent to the weather station was correlated as = + +T Tpanel a
GV28.36 5.86
(residual error 2.1 °C rms) and used in Eq. (2) to predict efficiency.Monthly mean PV output was then predicted from the weather stationdata. The mean PV efficiency in Fig. 13 is 14.6% corresponding to aneffective mean panel temperature of 31.6 °C.
The electrical output per m2 for the EFP collector plus ORC inFig. 13 is 51% of the PV panel output (59% for PTC “all radiation”);conversely the PV panel produces no useful heat. A PVT panel wouldhave similar electrical efficiency to the PV panel but (currently) lowerthermal efficiency than an EFP collector.
The EFP with an absorber temperature of 25 °C delivers 623 kWh/m2 heat over April–September. Any system generating electricity inaddition to heat will require a larger collector area than one sizedpurely for the thermal output. Fig. 14 shows the electrical output from alarger collector area for four systems designed to deliver 623 kWh heatover 6months to a 25 °C thermal store i.e. equivalent in thermal termsto an EFP of 1m2. The options considered were:
• EFP+ORC ( =f 0.6)• PTC+ORC ( =f 0.6), beam only
• PTC+ORC ( =f 0.6), all radiation• EFP (1 m2) + PV (remainder)
• PVT (1.23 m2) + PV (remainder).
The EFP/ORC maximum efficiency point at 2.1 m2 is very close to
the EFP+PV line in Fig. 14: this is coincidental. The combination of aPVT panel to provide the required heat output plus additional PV panelsto cover any available area provides the highest electrical output ofthese three options. Whilst the EFP plus ORC combination can providemore electricity than EFP+PV for panel area ratios up to 2.1, this isnot a sensible option given the complexity of such a system and thesuperior output from a PVT+PV combination. The PTC + “beamonly” ORC output is significantly less than the EFP equivalent and eventhe hypothetical “all radiation” case cannot match the PVT perfor-mance.
A fifth possibility would be to use a larger area of PVT panels in-stead of PVT+PV: this would give the same electrical output whileincreasing the heat output.
5.5.4. Efficiency requirements for thermal power cycles to compete with PVpanels
The poor electrical efficiency of the organic Rankine cycles relativeto the PV panels described above stems from the inevitable thermo-dynamic limitations of a heat engine cycle coupled with falling col-lector efficiency at high temperatures and low irradiance. Given se-lective coatings significantly better than the current state of the artand/or a sufficiently high concentration ratio it might however bepossible for solar thermal power cycles to match PV efficiency levels.
Defining the electrical efficiency of a heat engine cycle (whetherORC, steam Rankine or Stirling engine, driving an alternator) as
= = −( )η fη η f η1Elec Carnot GTT G21
the necessary collector gross efficiency ηGat an absorber temperature T1 to match a PV panel efficiency ηPV isgiven by =
⎛⎝− ⎞
⎠
ηGη
f 1
PVTT
21
.
The predicted annual heat output (Fig. 11) may be characterised interms of the annual insolation on the pyranometer plane and a meanefficiency at each absorber temperature:
∫=E η G td1 1 year
Fig. 15 compares these weather-data based mean efficiencies withthe collector efficiency required (blue line) to enable an ORC operatingat = ° = =T f25 C 298 K, 0.62 to match a 15% efficient PV panel.
Under constant G=1000W/m2 beam irradiance and working atthe optimum temperature, the efficiency curves for EFP+ORC andPTC+ORC each come within 9% of the target (blue line) to match a PVpanel. Under Coventry weather conditions however (taking the 12monthly output, Fig. 11) the mean irradiance is lower, leading to re-duced efficiency at each temperature point. The curves based on theentire pyranometer irradiance (EFP, PTC “all radiation”) demonstratethe effect of the irradiance distribution on the efficiency curve. The PTC
Fig. 13. Electrical energy output using solar collectors to power an Organic RankineCycle, compared with PV output, April–September.
R.W. Moss et al. Applied Energy 216 (2018) 588–601
598

curve “Gb” shows the additional loss in efficiency under typical UKweather conditions because a concentrating collector can only focusand absorb beam radiation.
The “EFP+ORC” curve in Fig. 14 is lower than the “PVT+PV”because the annual mean efficiencies (Fig. 15) are less than half theclear sky =G 1000 W/m2 efficiencies from Fig. 7(a).
6. Conclusions
An increase in efficiency equivalent to a reduction in heat losscoefficient UL of 3.7W/m2 K has been observed when operating flatpanel solar collectors under high vacuum.
The absorber used a flooded panel design with a black chromeplated coating. The coating emissivity was higher than intended. Theresulting overall absorber heat loss coefficient UL = 3.65W/m2 K wascomparable to that available from the best non-evacuated commercialpanels using high quality coatings. Simulations suggest that the losscoefficient could be reduced to UL = 0.42W/m2 K (gross definition),0.49 (absorber area) by combining a highly selective coating and avacuum enclosure.
Simulations of the experimental tests closely modelled the measuredefficiency.
Comparisons of efficiency data for flat plate, evacuated tube andparabolic trough solar collectors against a simulation using a highquality selective coating in an evacuated flat panel show that underhigh irradiance (G=1000W/m2) the latter has an efficiency advantagefor < °T 210 CM . An evacuated flat plate at = °T 60 CM can achieve an
efficiency higher an evacuated tube by a factor of 1.32 and higher thana conventional flat panel by a factor of 1.13. At = °T 100 CM thereshould be a 50% increase in heat output relative to either of these.
The high “medium temperature” efficiency of the evacuated platecollectors is well suited to process heat applications: at 117 °C deliverytemperature the annual output from an optimised EFP is double theoutput from a parabolic trough collector. The efficiency claims forcommercial evacuated panels by SRB and TVP are completely plausibleand there may be some potential for further improvement in terms ofcoating emissivity. Given sufficient development and manufacturinginvestment, evacuated panels could eventually replace conventionalflat plates and evacuated tubes for high efficiency applications.
The benefits of an evacuated flat plate collector become even moresignificant at lower irradiance levels. A simulation based on 6 years ofweather data (Fig. 9, Table 5) showed that an evacuated flat platecollector could deliver 104% more heat to an 85 °C heating main than aconventional flat plate collector and 73% more than an evacuated tubecollector. Transient modelling showed absorber heat capacity to have asignificant effect in Winter but little effect on output during Summermonths.
Domestic heating and hot water can use water temperatures as lowas 40 °C if under-floor heating is employed. Below 58 °C the necessarypanel area to meet a given Winter heating demand may be minimisedby using a PVT panel plus heat pump combination instead of an evac-uated flat plate (Fig. 10). There would be significant further advantagesin terms of panel area if PV solar farms could be situated in a Medi-terranean country with much higher levels of Winter insolation.
Comparing the annual value of both thermal and electrical outputs,evacuated thermal panels are preferable to the same area of PV or PVTpanels when heat is required at temperatures above 70 °C (Fig. 11).
Thermal collectors can in principle drive an Organic Rankine Cycleto provide power as well as heat. Such systems were not cost-effectivein terms of annual output compared with a combined PV/Thermalpanel (Fig. 12). Annual heat output for each style of thermal collector iswell fitted by a quadratic function of absorber temperature: this allowsthe peak output operating point for an Organic Rankine Cycle to becalculated.
Thermal collectors may be employed to charge a seasonal thermalstore. When sized purely for the required thermal demand, an EFP re-quires less area than conventional collectors. If space permits, addi-tional panel area can be used. This might be EFP collectors in asso-ciation with an Organic Rankine cycle; EFP collector plus PV panels; orPVT and PV panels. For a 25 °C store in the UK, PVT panels require 23%more panel area than EFP collectors: if this is possible, a PVT-basedsystem generates more electricity than any system using an EFP col-lector or an ORC (Fig. 14).
Under clear conditions with 1000W/m2 irradiance the output froman ORC coupled to either an EFP or a PTC would be approximately 9%less than obtained from a 15% efficiency PV panel of the same area(Fig. 15). Under UK weather conditions however the annual irradiancedistribution (together with diffuse fraction in the PTC case) results inlower collector efficiencies and the use of an ORC becomes even lesscompetitive.
Thermal collectors have a major role to play in the decarbonising ofheat but not in electricity generation.
Acknowledgements
The authors are grateful to the Engineering and Physical SciencesResearch Council (EPSRC) for funding this work as part of a colla-borative programme between Warwick, Loughborough and Ulster uni-versities, reference EP/K009915/1, EP/K010107/1 and EP/K009230/1. Matlab data and code used for the figures in this paper are openlyavailable from http://wrap.warwick.ac.uk/id/eprint/89678.
Fig. 14. Options for generating electrical power in addition to a six-monthly 623 kWhthermal output at 25 °C.
Fig. 15. Collector efficiencies that would be required in conjunction with an ORC toachieve the same electrical efficiency as a PV panel (“Required”) compared with meanefficiencies under simulated conditions.
R.W. Moss et al. Applied Energy 216 (2018) 588–601
599

Appendix A. Estimation of beam component
To allow use of incidence angle modifiers in the DIN CERTCO [69] dataset, the beam radiation component was estimated from the weatherstation’s pyranometer readings using the following formulae from Duffie & Beckman [70]:
= + ×( )( )I 1367 1 0.033cos (W/m )scπ n2365
2 where number n is the day of the year.
= + −τ a a eb ok θ
1sec where θ is the angle of the Sun from the zenith.
= −τ τ0.271 0.294d b= +G I τ τ( )clear sc b d is the expected instantaneous irradiance on a plane normal to the Sun’s direction in clear weather.
An iterative scheme commencing with a nominal diffuse fraction =f 0.5d then identifies a combination of fd and the clearness index kT thatwould convert the clear sky irradiance Gclear at some angle ϕ away from the pyranometer axis into the observed irradiance G:
= + −G G f f ϕ k( (1 )cos ) .clear d d T
The correlation of Orgill and Hollands (Duffie) is used to relate kT and fd. An effective radiation level, including the incidence angle modifier Kτα foreach collector, was then calculated as = +G G G K ϕcosE d b τα . Any ground-reflected component in the roof-mounted pyranometer reading was as-sumed to be negligible.
Appendix B. Transient collector response algorithm
The data analysis algorithm imports the data set for each month =t G T i( , , , 1: 44640)i E i a i, , and predicts the absorber temperature and heat output foreach minute using a time-marching scheme. The steady-state efficiency of each collector at =G 1000 W/m2 was correlated as a cubic formula, Eq.(1), from which the output at lower light levels could be calculated:
= − + +Q G η α T α T α T( )in i E i M i M i M i, , 0 1 , 2 ,2
3 ,3 (6)
This heat flux if positive is delivered to the heating main once the absorber has reached the heating main temperatureTHM . The analysis assumed thatthe heat transfer fluid would be pumped whenever the net heat output was positive and turned off at other times; when pumped, the fluid would belimited to the heating main temperature (taken for simplicity as a constant, THM = 85 °C). While G is below the critical level (whether over-night orduring a period of poor light) the model predicts absorber temperature to determine when the next heat delivery period begins.
For simplicity, Eq. (6) was linearised in terms of a tangent = ′ − ′Q G η U T( )i E i L M i0 , to the T Q( , )M in curve at each time step. The first order lumpedcapacity model for periods with the pump switched off is then:
= ′ − ′ −C Tt
G η U T Tdd
( ) ( )E i L i a i0 , , (7)
and has solutions over each 60 s period between weather data readings of the form = + − −T T T T e( )asymp i asympλt where =λ U
CL i, , = +T Tassymp
G ηU a i
( ),
E i
L i0
,.
C is the short-term heat capacity (J/m2 K) of the absorber under no-flow conditions and has been estimated from typical dimensions and fluidcapacity. For simplicity the mass of any cover glass has been omitted since this is not in direct thermal contact with the absorber.
This models allows the prediction of the complete absorber temperature profile for each month, starting from the assumption =T Ta1 ,1 at midnightfor the first dataset point. Solution of Eq. (7) gives the absorber temperatures for >i 1:
= + −+−T T T T T emin[ , ( ) ].i HM asymp i i asymp i
λ1 , ,
60
The heat input to the district heating main over each time step is:
=E Q tmax(0, Δ )u i u i i, ,
Eu i, is positive whenGi exceeds the critical radiation level provided that the absorber temperature Ti is not below the heating main temperature THM .The effective time period tΔ i was calculated for intervals where the switching on or off of the pump due to changing temperature or insolationbrought the heat transfer period below the nominal 60 s.
References
[1] DTI, Energy consumption in the United Kingdom; 2001<http://webarchive.nationalarchives.gov.uk/+/http:/www.berr.gov.uk/files/file11250.pdf> .
[2] Kalogirou SA. Solar Energy Engineering. 2nd ed. Academic Press; 2014.[3] Riggs BC, Biedenharn R, Dougher C, Ji YV, Xu Q, Romanin V, et al. Techno-eco-
nomic analysis of hybrid PV/T systems for process heat using electricity to subsidizethe cost of heat. Appl Energy 2017;208:1370–8.
[4] Alam M, Singh H, Suresh S, Redpath DAG. Energy and economic analysis of VacuumInsulation Panels (VIPs) used in non-domestic buildings. Appl Energy 2017;188:1–8.
[5] Leone G, Beccali M. Use of finite element models for estimating thermal perfor-mance of façade-integrated solar thermal collectors. Appl Energy2016;171:392–404.
[6] O’Hegarty R, Kinnane O, McCormack SJ. Concrete solar collectors for façade in-tegration: an experimental and numerical investigation. Appl Energy2017;206:1040–61.
[7] Moss RW, Henshall P, Arya F, Shire GSF, Eames PC, Hyde T. Simulator testing ofevacuated flat plate solar collectors for industrial heat and building integration.Solar Energy 2017. submitted for publication.
[8] Suman S, Khan MK, Pathak M. Performance enhancement of solar collectors – areview. Renew Sustain Energy Rev 2015;49:192–210.
[9] Colangelo G, Favale E, Miglietta P, de Risi A. Innovation in flat solar thermal
collectors: a review of the last ten years’ experimental results. Renew Sustain EnergyRev 2016;57:1141–59.
[10] Selvakumar N, Barshilia HC. Review of physical vapor deposited (PVD) spectrallyselective coatings for mid- and high-temperature solar thermal applications. SolEnergy Mater Sol Cells 2012;98:1–23.
[11] Colangelo G, Favale E, Miglietta P, de Risi A, Milanese M, Laforgia D. Experimentaltest of an innovative high concentration nanofluid solar collector. Appl Energy2015;154:874–81.
[12] Caër VH-L, De Chambriera E, Mertina S, Jolya M, Schaerb M, Scartezzinia J-L.Optical and morphological characterisation of low refractive index materials forcoatings on solar collector glazing. Renew Energy May 2013;53:27–34.
[13] Freeman J, Hellgardt K, Markides CN. An assessment of solar-thermal collectordesigns for small-scale combined heating and power applications in the UnitedKingdom. Heat Transfer Eng 2015;36(14–15). http://dx.doi.org/10.1080/01457632.2015.995037.
[14] Nkwetta DN, Smythe M. The potential applications and advantages of poweringsolar air-conditioning systems using concentrator augmented solar collectors. ApplEnergy 2012;89:380–6.
[15] Alobaid M, Hughes B, Calautit JK, O’Connor D, Heyes A. A review of solar drivenabsorption cooling with photovoltaic thermal systems. Renew Sustain Energy Rev2017;76:728–42.
[16] Bouvier J-L, Michaux G, Salagnac P, Kientz T, Rochier D. Experimental study of amicro combined heat and power system with a solar parabolic trough collector
R.W. Moss et al. Applied Energy 216 (2018) 588–601
600

coupled to a steam Rankine cycle expander. Sol Energy 2016;134:180–92.[17] Purohit I, Purohit P. Technical and economic potential of concentrating solar
thermal power generation in India. Renew Sustain Energy Rev 2017;78:648–66.[18] Zou B, Dong J, Yao Y, Jiang Y. An experimental investigation on a small-sized
parabolic trough solar collector for water heating in cold areas. Appl Energy2016;163:396–407.
[19] Cohen S, Grossman G. Development of a solar collector with a stationary sphericalreflector/tracking absorber for industrial process heat. Sol Energy 2016;128:31–40.
[20] Buttinger F, Beikircher T, Proll M, Scholkopf W. Development of a new flat sta-tionary evacuated CPC-collector for process heat applications. Sol Energy2010;84:1166–74.
[21] Wang J, Yin Z, Qi J, Ma G, Liu X. Medium-temperature solar collectors with all-glasssolar evacuated tubes. Energy Procedia 2015;70:126–9.
[22] Li Q, Zheng C, Shirazi A, Mousa OB, Moscia F, Scott JA. Design and analysis of amedium-temperature, concentrated solar thermal collector for air-conditioningapplications. Appl Energy 2017;190:1159–73.
[23] Mwesigye A, Meyer JP. Optimal thermal and thermodynamic performance of asolar parabolic trough receiver with different nanofluids and at different con-centration ratios. Appl Energy 2017;193:393–413.
[24] Qu W, Wang R, Hong H, Sun J, Jin H. Test of a solar parabolic trough collector withrotatable axis tracking. Appl Energy 2017. [in press].
[25] Benz N, Beikircher T. High efficiency evacuated flat-plate solar collector for processsteam production. Sol Energy 1999;65(2):111–8.
[26] Beikircher T, Möckl M, Osgyan P, Streib G. Advanced solar flat plate collectors withfull area absorber, front side film and rear side vacuum superinsulation. Sol EnergyMater Sol Cells 2015;141:308–406.
[27] Ehrmann N, Reineke-Koch R. Selectively coated high efficiency glazing for solar-thermal flat-plate collectors. Thin Solid Films 2012;520:4214–8.
[28] Brunold S, Frey R, Frei U. A comparison of three different collectors for process heatapplications. SPF publication< http://spf.ch/fileadmin/daten/publ/procheat.pdf>.
[29] Benvenuti C, Ruzinov V. The SRB evacuated flat solar panel. In: Proceedings ofECOS, 2010, p. 2-429 –434.
[30] Benvenuti C. The SRB solar thermal panel. Europhys News 2013:16–8. http://dx.doi.org/10.1051/epn/2013301.
[31] Benvenuti C. Particle accelerators and solar panels. Fisica E 2013;29(1–2):31–8.(NEG Non-evaporable getters etc).
[32] Abbate P. Presentation on the TVP evacuated panel at InterSolar 2012<https://www.youtube.com/watch?v=z_4FD4Zxwew> [accessed 12/7/2017].
[33] TVP Solar, MT-30 datasheet<http://www.tvpsolar.com/files/pagine/1464011780_MT-Power%20Datasheet%20(v4.2x)(ver5).pdf> [accessed 12/7/2017].
[34] Henshall P, Moss R, Arya F, Eames PC, Shires S, Hyde T. An evacuated enclosuredesign for solar thermal energy applications. Grand Renewable Energy 2014(GRE2014) International Conference and Exhibition, Tokyo, Japan, 27 July–1August 2014<https://dspace.lboro.ac.uk/2134/16098> .
[35] SPF catalogue of solar collector test results< http://www.spf.ch/index.php?id=111&L=6> [accessed August 2017].
[36] Moss RW, Shire GSF, Henshall P, Eames PC, Arya F, Hyde T. Optimal passage sizefor solar collector micro-channel and tube-on-plate absorbers. Sol Energy2017;153:718–31. http://dx.doi.org/10.1016/j.solener.2017.05.030.
[37] Moss RW, Shire GSF, Henshall P, Eames PC, Arya F, Hyde T. Design and fabricationof a hydro-formed absorber for an evacuated solar collector. Appl Therm Eng 2017.Submitted for publication.
[38] Lira-Cantú M, Sabio AM, Brustenga A, Gómez-Romero P. Electrochemical deposi-tion of black nickel solar absorber coatings on stainless steel AISI316L for thermalsolar cells. Sol Energy Mater Sol Cells 2005;87:685–94.
[39] Lizama-Tzec FI, Macías JD, Estrella-Gutiérrez MA, Cahue-López AC, Arés O, de CossR, et al. Electrodeposition and characterization of nanostructured black nickel se-lective absorber coatings for solar–thermal energy conversion. J Mater Sci : MaterElectron 2015;26:5553–61. http://dx.doi.org/10.1007/s10854-014-2195-5.
[40] Joly M, Antonetti Y, Python M, Gonzalez M, Gascou T, Scartezzini J-L, et al. Novelblack selective coating for tubular solar absorbers based on a sol–gel method. SolEnergy 2013;94:233–9.
[41] Gao X-H, Theiss W, Shen Y-Q, Ma P-J, Liu G. Optical simulation, corrosion behaviorand long term thermal stability of TiC-based spectrally selective solar absorbers. SolEnergy Mater Sol Cells 2017;167:150–6.
[42] McDonald GE. Spectral reflectance properties of black chrome for use as a solarselective coating. Sol Energy 1975;17:119–22.
[43] Moss RW, Shire GSF, Eames PC, Henshall P, Hyde T, Arya F. Design and commis-sioning of a virtual image solar simulator for testing thermal collectors. Sol Energy2017;159:234–42. http://dx.doi.org/10.1016/j.solener.2017.10.044. January2018.
[44] Thorpe, University of Warwick Weather Station (online)< https://www2.warwick.ac.uk/fac/cross_fac/sciencecity/programmes/internal/themes/energyefficiency/thermal/bookings/weather_station/> [accessed October 2017].
[45] Matuska T, Sourek B, Jirka V, Pokorny N. Glazed PVT collector with polysiloxaneencapsulation of PV cells: performance and economic analysis. Int J Photoenergy2015. http://dx.doi.org/10.1155/2015/718316.
[46] NEP PolyTrough 1800 datasheet accessed August 2017<http://www.nep-solar.com/wp-content/uploads/2013/11/NEP-Solar-Polytrough1800_Datasheet.pdf > .
[47] Zambolin E, Col DD. Experimental analysis of thermal performance of flat plate andevacuated tube solar collectors in stationary standard and daily conditions. SolEnergy 2010;84:1382–96.
[48] Zima W, Dziewa P. Modelling of liquid flat-plate solar collector operation in tran-sient states. In: Proc. IMechE Vol. 225 Part A (2010) J. Power and Energy pp 53–62.
[49] Rodríguez-Hidalgo MC, Rodríguez-Aumente PA, Lecuona A, Gutiérrez-Urueta GL,Ventas R. Flat plate thermal solar collector efficiency: Transient behavior underworking conditions. Part I: model description and experimental validation. ApplTherm Eng 2011;31:2394–404.
[50] Amrizal N, Chemisana D, Rosell JI. Hybrid photovoltaic–thermal solar collectorsdynamic modelling. Appl Energy 2013;101:797–807.
[51] Gao Y, Zhang Q, Fan R, Lin X, Yu Y. Effects of thermal mass and flow rate on forced-circulation solar hot-water system: comparison of water-in-glass and U-pipe evac-uated-tube solar collectors. Solar Energy 2013;98:290–301.
[52] Agrawal S, Tiwari GN. Energy and exergy analysis of hybrid micro-channel pho-tovoltaic thermal module. Sol Energy 2011;85:356–70.
[53] RISE, ScenoCalc home page< http://www.sp.se/en/index/services/solar/ScenoCalc/Sidor/default.aspx> [accessed December 2017].
[54] Evinox data sheet (downloaded 28/11/2017): < http://www.evinoxenergy.co.uk/Sites/Evinox/library/files/PHRIE%20ASHP%20Data%20Sheet.pdf > .
[55] Palz W, Greif J. Commission of the European communities. European solar radia-tion atlas. 3d ed. Springer; 1996. p. 326.
[56] Ancona MA, Bianchi M, Diolaiti E, Giannuzzi A, Marano B, Melino F, Peretto A. Anovel solar concentrator system for combined heat and power application in re-sidential sector. Appl Energy 2017;185:1199–209.
[57] Crisostomo F, Hjerrild N, Mesgari S, Li Q, Taylor RA. A hybrid PV/T collector usingspectrally selective absorbing nanofluids. Appl Energy 2017;193:1–14.
[58] Modjinou M, Ji J, Li J, Yuan W, Zhou F. A numerical and experimental study ofmicro-channel heat pipe solar photovoltaics thermal system. Appl Energy2017;206:708–22.
[59] Bianchini A, Guzzini A, Pellegrini M, Saccani C. Photovoltaic/thermal (PV/T) solarsystem: experimental measurements, performance analysis and economic assess-ment. Renew Energy 2017;111:543–55.
[60] Herrando M, Markides C. Hybrid PV and solar-thermal systems for domestic heatand power provision in the UK: techno-economic considerations. Appl Energy2016;161:512–32.
[61] Abdelhamid M, Widyolar BK, Jiang L, Winton R, Yablonovitch E, Scranton G, et al.Novel double-stage high-concentrated solar hybrid photovoltaic/thermal (PV/T)collector with nonimaging optics and GaAs solar cells reflector. Appl Energy2016;182:68–79.
[62] Lee D-S, Hung T-C, Lin J-R, Zhao J. Experimental investigations on solar chimneyfor optimal heat collection to be utilized in organic Rankine cycle. Appl Energy2015;154:651–62.
[63] Quoilin S, Orosz M, Hemond H, Lemort V. Performance and design optimization ofa low-cost solar organic Rankine cycle for remote power generation. Sol Energy2011;85:955–66.
[64] Landelle A, Tauveron N, Haberschill P, Revellin R, Colasson S. Organic Rankinecycle design and performance comparison based on experimental database. ApplEnergy 2017;204:1172–87.
[65] Su W, Zhao L, Deng S, Xu W, Yu Z. A limiting efficiency of subcritical OrganicRankine cycle under the constraint of working fluids. Energy 2018;143:458–66.
[66] Rad FM, Fung AS. Solar community heating and cooling system with boreholethermal energy storage – review of systems. Renew Sustain Energy Rev2016;60:1550–61.
[67] Chapuis S, Bernier M. Seasonal storage of solar energy in borehole heat exchangers.In: Proc. 11th International Building Performance Simulation Association (IBPSA)meeting 2009, Glasgow, 599–606.
[68] Busby J. UK shallow ground temperatures for ground coupled heat exchangers. Q JEng Geol Hydrogeol 2015;48:248–60. https://0-doi-org.pugwash.lib.warwick.-ac.uk/10.1144/qjegh2015-077.
[69] DIN CERTCO test certificates<http://www.dincertco.tuv.com> [accessed August2017].
[70] Duffie JA, Beckman WA. Solar Engineering of Thermal Processes. 4th ed. Wiley;2013.
R.W. Moss et al. Applied Energy 216 (2018) 588–601
601