iqxxs.free.friqxxs.free.fr/SSIAP/SSIAP3/Documents de base/coordination SSI... · iqxxs.free.fr
Progress In Electromagnetics Research B, Vol. 36, 53–67, 2012
PERFORMANCE ANALYSIS WITH COORDINATIONAMONG BASE STATIONS FOR NEXT GENERATIONCOMMUNICATION SYSTEM
H.-W. Tseng 1, *, Y.-H. Lee 2, J.-Y. Lin 2, C.-Y. Lo 2, andY.-G. Jan 2
1Department of Computer and Communication Engineering, De LinInstitute of Technology, Taiwan2Department of Electrical Engineering, TamKang University, Taiwan
Abstract—Next generation communication system, such as LongTerm Evolution Advanced (LTE-A), has the advantages of hightransmission rate, wide bandwidth and better bandwidth utilizationin high mobility environments. However, in such a kind of systemwhen users are distributed sparsely in the base station coveragerange the spectrum efficiency becomes worse. The emergence of newtechnologies such as the coordination among based stations makes theutilization of system bandwidth more efficient. The technology ofcoordination among base stations has other merits such as reducingnoise interference, increasing receiving diversity, improving the systemreceiving gain, etc. In this paper, the system spectrum utilizationand its associated efficiency will be investigated when the scheme ofcoordination among base stations is implemented.
1. INTRODUCTION
As new wireless communication technologies emerge, the demand fornetworks applications becomes diversified, and the request for servicequantity is also correspondingly increased. Network application hasbecome an indispensable service in human life, and then as systemdevelops, how to select or set the system parameters so that thesystem will achieve its optimal capacity becomes a vital task. Itthen incurs the issue of how to properly utilize the network resourceanytime and anywhere in its applications. Earlier generations ofwireless mobile communication systems are unable to meet the current
Received 20 July 2011, Accepted 23 September 2011, Scheduled 3 November 2011* Corresponding author: Hsien-Wei Tseng ([email protected]).
54 Tseng et al.
service providers’ request that asks for wide bandwidth and highspeed data applications and also for the extension of the systemcoverage range. The new interface standards proposed by ThirdGeneration Partnership Project (3GPP) and IEEE 802.16m all containthe advantages of high transmission data rate, broad bandwidth andwide coverage area. In this paper, how to implement the coordinationscheme among base stations to improve the system capacity will beconsidered.
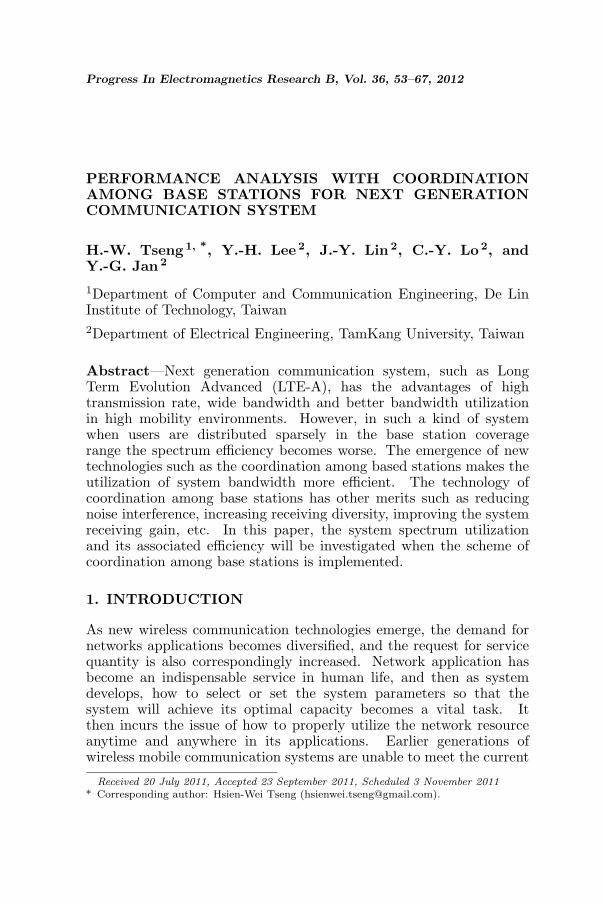
As shown in Figure 1, a user is located in the common coveragearea of many base stations. After the user is inter-connected by thesebase stations and through the implementation of the coordinationamong these base stations, the user’s effective receiving gain can beincreased, and also the interference among users can be reduced byimplementing the techniques such as Coordinated Multi-input Multi-output (Co-MIMO) and Coordinated Multiplexing (CoMP) [1–7].
In this paper, the bandwidth shared among base stations willbe analyzed when users are interconnected by many base stations,and it will then determine which is the proper situation to triggerthe coordination scheme among base stations to improve the systemcapacity. As shown in Figure 1, when base station 1 (BS1) and basestation 2 (BS2) use different carrier frequencies in their transmissions,the user equipment (UE) can be based on its received signal tonoise ratio from each base station to determine which link has betterreceiving signal quality. On the other hand, when both stations usethe same carrier frequency in their transmissions, the UE can enhanceits received signal strength by combining receiving signals from bothbase stations.
BS1
BS2
UE
CoordinatorBack Bone Back Bone
Figure 1. A UE is covered within multiple base stations.
Progress In Electromagnetics Research B, Vol. 36, 2012 55
Channel fading [8] plays an important role in the wirelesscommunication. When signal transmits through the channel it willencounter various interferences such as the multipath effect whenthe signal transmits through the buildings, forests and terrains.The multipath effect will enhance or fade transmit signal to makeit impossible at the receiver terminal to accurately determinethe transmitted signal; it needs to use statistical description tocharacterize the receiving signal strength. The channel model inwireless communication is derived through analysis and simulationof channel responses and modified through empirical measurements;many channel models have been proposed [8–19]. Summarily, thereceived signal strength at the base station/UE can be estimated fromthe following equation:
P (dBm) = Pt + Gt + Gr − PL (1)
where
Pt: Transmitting power of base station/UE (dBm).Gt: Antenna gain of UE/base station (dBi).Gr: Antenna gain of base station/UE (dBi).
PL is the path loss in dB and has value as shown in the followingEquation (2) as recommended by 3 GPP Rel.9 for Non-line ofSight (NLOS), Macro-urban base station [20]:
PL = 161.04− 7.1 log 10(W ) + 7.5 log 10(h)− (24.37− 3.7(h/hBS)2)log 10(hBS) + (43.42− 3.1 log 10(hBS))(log 10(d)− 3)+20 log 10(fc)− (3.2(log 10(11.75hUE))2 − 4.97) (2)
where the parameters are:
d: Transmission distance between the base station and the UE,10m < d < 5000m.h: Average building height, 5 m < h < 50m.W : Street width, 5m < W < 50 m.hBS: Base station antenna height, 10 m < hBS < 150m.hUE: UE antenna height, 1 m < hUE < 10m.fc: Carrier frequency (GHz).
2. USER’S ENVIRONMENT CASES
When a user is located in different coverage areas of base stations, asshown in Figure 2, three communication environments can be classified

56 Tseng et al.
Figure 2. Users environment be depicted with colors.
and are represented by different colors. The bandwidth utilizationsof these base stations in different communication environments willbe analyzed in the following sections. These three communicationenvironment cases are:
Case 1: The user is covered by one base station.The user is covered by BS1 with light blue color.The user is covered by BS2 with pink red color.The user is covered by BS3 with yellow color.Case 2: The user is covered by two base stations.The user is covered by BS2 and BS3 with red color.The user is covered by BS1 and BS3 with green color.The user is covered by BS1 and BS2 with blue color.Case 3: The user is covered by three base stations.The user is covered by BS1 BS2 and BS2 with black color.
3. SYSTEM PERFORMANCE OF BASE STATION
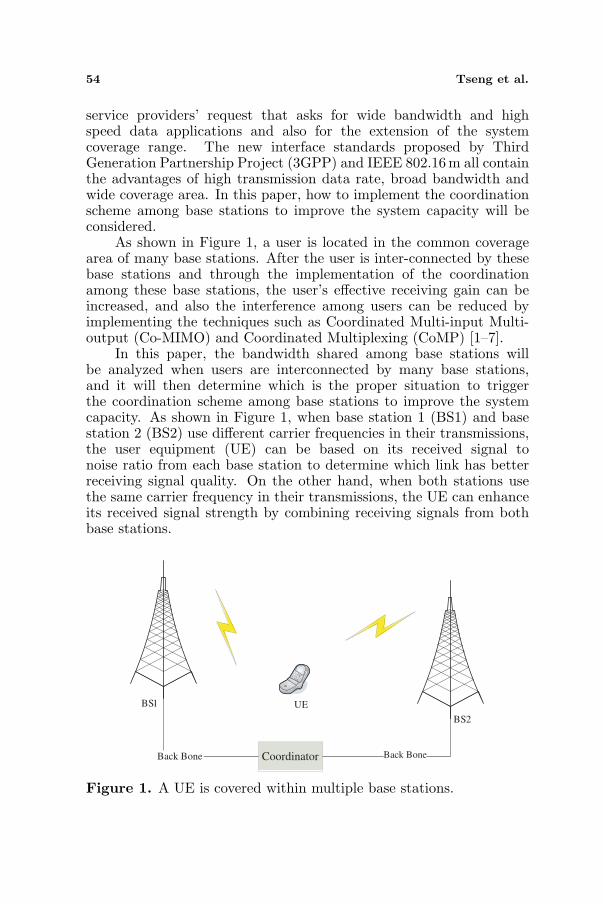
We perform the system performance simulation of LTE systemunder various communication environments and make comparison andanalysis of the system performances when coordination scheme isimplemented or not. The system simulation parameters are listedin Table 1, and the system simulation functional block is illustratedin Figure 3. The system performance simulation procedure can besummarized in the following:
1) Input system parameters into MABLAB program.2) Use MABLAB program based on certain statistical model to
generate the locations of BSs and UEs.

Progress In Electromagnetics Research B, Vol. 36, 2012 57
Table 1. LTE parameters.
Duplex Mode FDDCarrier Frequency 2 GHz
Bandwidth 10 MHzCode Rate 1/3
AMC QPSK, 16-QAM, 64QAMBS Power 1 W
BS antenna gain 17 dBiUE antenna gain 0 dBi
UE Power 200 mWBS Height 35 mUE Height 1.5 mPath Loss Macrocell urbanDL Traffic 128 KbpsUL Traffic 64 Kbps
ParameterInput
Threshold
setSer vice
Connection
Matlab
Plot Fig.Coordina
tion Switch
Generate UE
InformationAnalyzer
GenerateBS/UE
Position
ChannelModel Path
Loss
-
Figure 3. System simulation functional block diagram.
3) Generate the path loss from each pair of BS and UE by usingEquation (1).
4) Determine whether to implement coordination scheme.5) Perform system performance simulation.6) Analyze and plot the simulation results.
3.1. Analysis of Communication Environment
It is assumed that users are uniformly distributed in each base stationcoverage area that is represented within the red zone of Figure 4. Users’locations in various base stations coverage areas can be identified byusing different colors as illustrated in Figure 2. Simulated systemperformances with users location distributions kept the same areplotted in Figure 4 and Figure 5, respectively, for with and without

58 Tseng et al.
Dis
tanc
e (m
)
Distance (m)
With Coordination
Distance (m
)
Figure 4. UEs reception statis-tics: Coordination scheme is im-plemented.
Distance (m
)
Distance (m)
With Coordination
Figure 5. UEs reception statis-tics: Coordination scheme is notimplemented.
the implementation of coordination scheme. In Figure 4 when a useris located in multiple base stations coverage areas, it can receive theinformation sent from these multiple base stations so that user 1 ismarked as black since it can receive three base stations data. Similarly,users 5 and 7 are marked blue, and they can receive data sent from BS1and BS2. User 6 is red and can receive BS2 and BS3 data. User 10 hasgreen designation it receives BS1 and BS3 information. In Figure 5 itshows the result without implementing the coordination scheme. Eachuser receives information sent from only one base station, e.g., user 5receives data from BS1, and user 1, user 3, user 4, user 6, user 7, user 9each receives data sent from BS2 while BS3 sends data to user 2, user 8and user 10.
3.2. Analysis of Base Station Spectrum Utilization
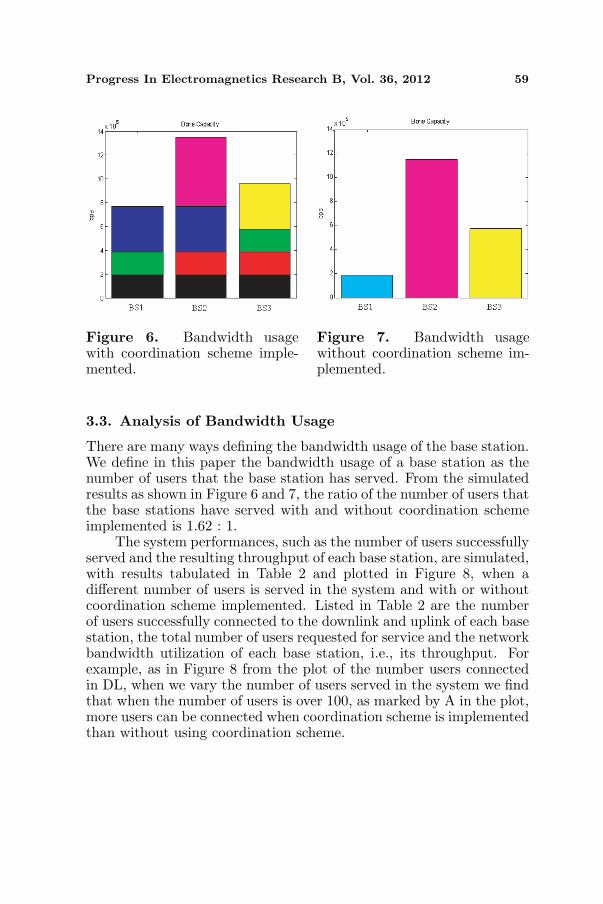
When UEs distributions as shown in Figure 4 are considered withcoordination scheme implemented, the bandwidth usages in the basestations have the results as shown in Figure 6. On the other hand,when UEs have distributions as shown in Figure 5, the base stationshave the bandwidth usages as shown in Figure 7 with no coordinationscheme implemented. Comparing the bandwidth usages in the basestations, as shown in Figures 6 and 7, it appears that under thesame users’ distribution the implementation of coordination schemewill have larger bandwidth usage than that without implementing thecoordination scheme.
Progress In Electromagnetics Research B, Vol. 36, 2012 59
Figure 6. Bandwidth usagewith coordination scheme imple-mented.
Figure 7. Bandwidth usagewithout coordination scheme im-plemented.
3.3. Analysis of Bandwidth Usage
There are many ways defining the bandwidth usage of the base station.We define in this paper the bandwidth usage of a base station as thenumber of users that the base station has served. From the simulatedresults as shown in Figure 6 and 7, the ratio of the number of users thatthe base stations have served with and without coordination schemeimplemented is 1.62 : 1.
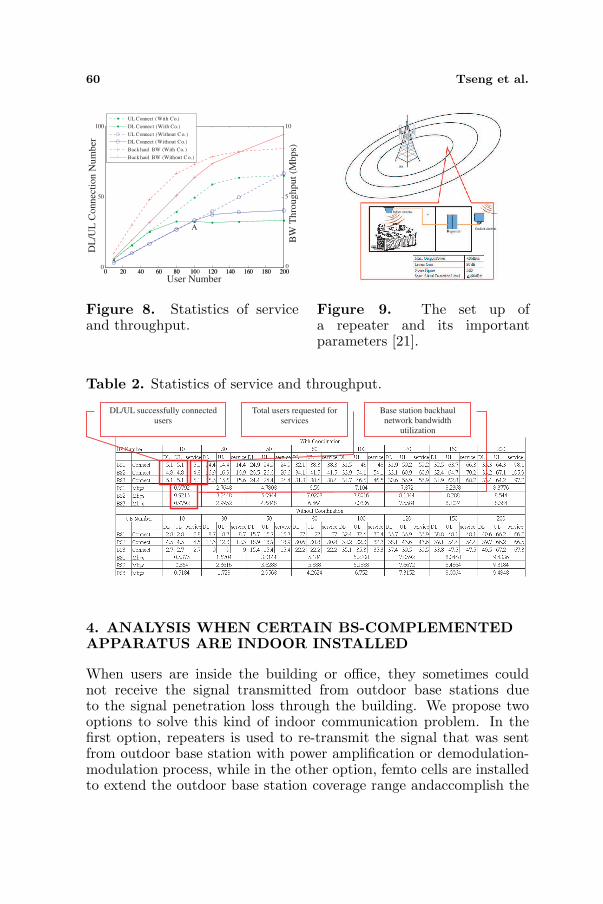
The system performances, such as the number of users successfullyserved and the resulting throughput of each base station, are simulated,with results tabulated in Table 2 and plotted in Figure 8, when adifferent number of users is served in the system and with or withoutcoordination scheme implemented. Listed in Table 2 are the numberof users successfully connected to the downlink and uplink of each basestation, the total number of users requested for service and the networkbandwidth utilization of each base station, i.e., its throughput. Forexample, as in Figure 8 from the plot of the number users connectedin DL, when we vary the number of users served in the system we findthat when the number of users is over 100, as marked by A in the plot,more users can be connected when coordination scheme is implementedthan without using coordination scheme.
60 Tseng et al.
0 20 40 60 80 100 120 140 160 180 2000
50
100
0 20 40 60 80 10 120 140 160 180 2000
5
10
UL Connect (With Co.)
DL Connect (With Co.)
UL Connect (Without C o. )
DL Connect (Without Co.)
Back haul BW (With Co. )
Back haul BW (Without C o. )
A
User Number
DL
/UL
Co
nn
ecti
on
Nu
mb
er
BW
Th
rou
gh
pu
t (M
bps)
Figure 8. Statistics of serviceand throughput.
Figure 9. The set up ofa repeater and its importantparameters [21].
Table 2. Statistics of service and throughput.
DL/UL successfully connected
users
Total users requested for
services
Base station backhaul
network bandwidth
utilization
4. ANALYSIS WHEN CERTAIN BS-COMPLEMENTEDAPPARATUS ARE INDOOR INSTALLED
When users are inside the building or office, they sometimes couldnot receive the signal transmitted from outdoor base stations dueto the signal penetration loss through the building. We propose twooptions to solve this kind of indoor communication problem. In thefirst option, repeaters is used to re-transmit the signal that was sentfrom outdoor base station with power amplification or demodulation-modulation process, while in the other option, femto cells are installedto extend the outdoor base station coverage range andaccomplish the
Progress In Electromagnetics Research B, Vol. 36, 2012 61
indoor communication requirement.
4.1. Repeater
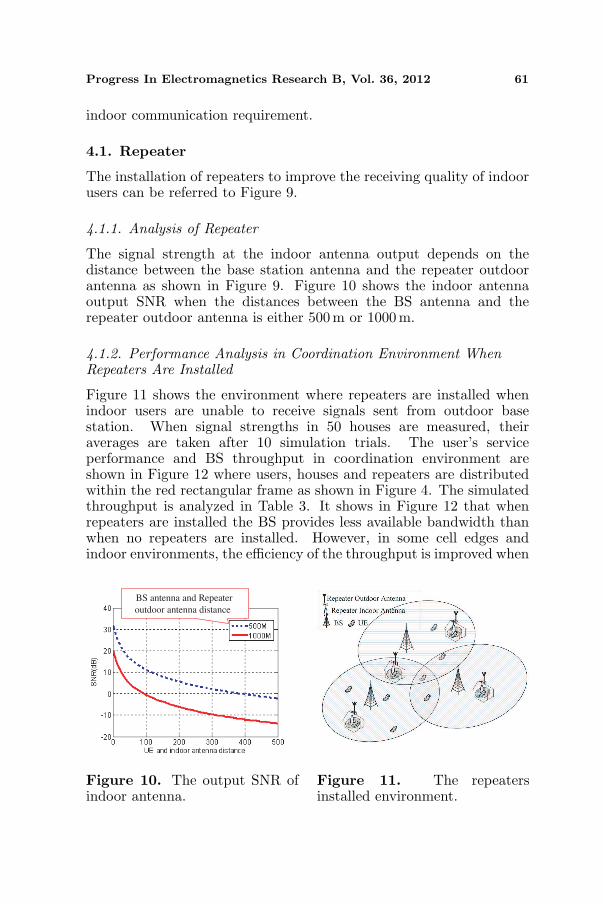
The installation of repeaters to improve the receiving quality of indoorusers can be referred to Figure 9.
4.1.1. Analysis of Repeater
The signal strength at the indoor antenna output depends on thedistance between the base station antenna and the repeater outdoorantenna as shown in Figure 9. Figure 10 shows the indoor antennaoutput SNR when the distances between the BS antenna and therepeater outdoor antenna is either 500 m or 1000 m.
4.1.2. Performance Analysis in Coordination Environment WhenRepeaters Are Installed
Figure 11 shows the environment where repeaters are installed whenindoor users are unable to receive signals sent from outdoor basestation. When signal strengths in 50 houses are measured, theiraverages are taken after 10 simulation trials. The user’s serviceperformance and BS throughput in coordination environment areshown in Figure 12 where users, houses and repeaters are distributedwithin the red rectangular frame as shown in Figure 4. The simulatedthroughput is analyzed in Table 3. It shows in Figure 12 that whenrepeaters are installed the BS provides less available bandwidth thanwhen no repeaters are installed. However, in some cell edges andindoor environments, the efficiency of the throughput is improved when
BS antenna and Repeater
outdoor antenna distance
Figure 10. The output SNR ofindoor antenna.
Figure 11. The repeatersinstalled environment.

62 Tseng et al.
Table 3. Users service quality and throughput when repeaters areinstalled.
6 MS
Number
BS No. DL UL DL UL DL UL DL UL DL UL DL UL DL UL DL UL
BS 1 connect 3.6 3.6 15.5 15 .5 25 25 31.7 40.6 32.6 47.9 32.4 5 6. 5 31 .9 63.8 31.6 63.5
BS 2 connect 5.5 5.5 16 16 25 .2 25 .9 33.6 43.9 33.4 52.3 33 59.9 34.2 66 .4 32.2 64.9
BS 3 connect 4.9 4.9 14.9 14.9 24 24 31 36.6 32.5 47 32.4 59.2 31 .9 63.9 30.7 61.8
BS 1 Mbps
BS 2 Mbps
BS 3 Mbps
Total Mbps
MS
Number
BS No. DL UL DL UL DL UL DL UL DL UL DL UL DL UL DL UL
BS 1 connect 5.1 5.1 12.8 12.8 22.6 22.6 31.6 36.7 33.4 42 31.7 53.6 32.3 62.4 32.9 65.6
BS 2 connect 4 4 13.7 13.7 23.7 23.7 32.1 36.7 32.9 47.4 32 55.9 33.2 63.9 34.1 67.1
BS 3 connect 3.9 3.9 12.4 12.4 19.4 19.4 29.9 32.8 32.5 39.2 32.2 50.3 31.6 59.2 32.3 63.7
Indoor connect 1.3 1.3 3.9 3.9 6.1 6.1 8.5 8.5 12 12 12.5 12.5 18.3 18.3 21.4 21.4
BS 1 Mbps
BS 2 Mbps
BS 3 Mbps
Total Mbps
Without Repeat er
10 30 50 80 100 120 150 200
7.2384 7.7632 8.1664 8.10880.6912 2.976 4.8 6.656
7.6224 8.0576 8.6272 8.27521.056 3.072 4.8832 7.1104
7.168 7.936 8.1728 7.88480.9408 2.8608 4.608 6.3104
22.0288 23.7568 24.9664 24.26882.688 8.9088 14.2912 20.0768
With Repeater
10 30 50 80 100 120 150 200
6.9632 7.488 8.128 8.40960.9792 2.4576 4.3392 6.3936
7.2448 7.6736 8.3392 8.65920.768 2.6304 4.5504 6.4576
6.6688 7.3408 7.8336 8.21120.7488 2.3808 3.7248 5.9264
20.8768 22.5024 24.3008 25.282.496 7.4688 12.6144 18.7776
0 20 40 60 80 100 120 140 160 180 2000
50
100
0 20 40 60 80 100 120 140 160 180 2000
5
10UL Connect(With Repeater)
DL Connect(With Repeater)
UL Connect(Without Repeater.)
DL Connect(Without Repeater)
Backhaul BW(With Repeater)
Backhaul BW(Without Repeater)
User Number
DL
/UL
Co
nn
ecti
on
Nu
mb
er
BW
Th
rou
gh
pu
t (M
bp
s)
Figure 12. Users service quan-tity and throughput with andwithout installation of repeaters.
Figure 13. Femto cell environ-ments.
repeaters are installed. From Figure 12, it is concluded that the systemwith repeaters installed can provide some services to the indoor usersso to improve the overall system throughput.

Progress In Electromagnetics Research B, Vol. 36, 2012 63
4.2. Femto Cell
Femto cells [20] are installed as shown in Figure 13 when the followingsituations are encountered such as more users trying to access thesystem or when the indoor users could not receive good quality ofoutdoor base station signals, etc.
4.2.1. Analysis of Femto Cells
The parameters relevant to femto cells and the path loss model arelisted in Table 4 [20]. When femto cells are installed, their outputSNR versus the distance between the transmitter and the receiver has
0 10 20 30 40 50 60 70 80 90 100-40
-20
0
20
40
60
80
100
R(m)
Fem
to S
NR
(dB
)
Fe mto SNR
Figure 14. SNR vs. Distance infemto cell.
0 20 40 60 80 100 120 140 160 180 2000
50
100
00
5
10
UL Connect(With Femto)
DL Connect( With Femto)
UL Connect(Without Femto)
DL Connect(Wi thou t Fe mto)
Fe mto UL/DL Connect
Backhaul BW(With Femto)
Backhaul BW(Without Fe mto)
Fe mto Backhaul BW
User Number
DL
/UL
Conn
ecti
on N
um
ber
BW
Th
rou
gh
pu
t (M
bps)
Figure 15. Users connected inthe DL/UL and throughput in thebase stations and femto cells withand without the deployment offemto cells.
Table 4. Parameters of femto cell.
BS Power 200mwBS antenna gain 5 dBi
Path LossPL(dB) = 38.46 + 20 log 10R+0.7d2D,indoor + 18.3n((n + 2)/(n + 1)− 0.46) + q ∗ Liw)
shadowing standard deviation 10q 1n
Liw 5 dB
64 Tseng et al.
the results as shown in Figure 14.In the path loss model the relevant parameters are:R: the Tx-Rx separation distance in meter.n: number of floors between the femto cell and UE.q: number of walls between the femto cell and UE.Liw: building penetration loss.d2D,indoor: the distance inside the house.
4.2.2. Performance Analysis When Coordination Is Implemented inFemto Cells
After femto cells are installed, we will discuss, in this subsection, theproper situation to exploit the coordination scheme among femto cells,and the bandwidth utilization will also be considered when variousnumbers of users are served. Listed in Table 5 and shown in Figure 15are the bandwidth utilizations of femto cells and the system servicequalities when 10 femto cells are installed, while entries listed in Table 6
Table 5. Users connection statuses when femto cells are implemented.
MS
Number
BS No. DL UL DL UL DL UL DL UL DL UL DL UL DL UL
BS 1 connect 5.3 5.3 15.9 15.9 25 25.2 29.8 42.3 28.9 49.3 29 52 30.1 53.4
BS 2 connect 5 5 16.7 16.7 26.2 26.6 30.3 43.6 30.1 53.4 30.3 54 30.1 54
BS 3 connect 4.8 4.8 13.7 13.7 22.9 22.9 28.7 36.1 29.3 48.6 28.5 52.1 28.7 52
Total Femto connect 0.4 0.4 0.9 0.9 1.3 1.3 1.5 1.5 1.9 1.9 2.6 2.6 4.2 4.2
BS 1 Mbps 0.7 0.3 2.04 1.02 3.2 1.61 3.81 2.71 3.7 3.16 3.71 3.33 3.85 3.42
BS 2 Mbps 0.6 0.3 2.14 1.07 3.35 1.7 3.88 2.79 3.85 3.42 3.88 3.46 3.85 3.46
BS 3 Mbps 0.6 0.3 1.75 0.88 2.93 1.47 3.67 2.31 3.75 3.11 3.65 3.33 3.67 3.33
Total femto Mbps 0.1 0 0.12 0.06 0.17 0.08 0.19 0.1 0.24 0.12 0.33 0.17 0.54 0.27
With femto
10 30 50 80 100 150 200
Table 6. Users connection statuses when no femto cells areimplemented.
MSNumber
BS No. DL UL DL UL DL UL DL UL DL UL DL UL DL UL
BS 1 connect 5.3 5.3 15.8 15.8 24.2 24.4 30.8 41.8 29 51.1 27.7 51.6 27.3 49.4
BS 2 connect 5.2 5.2 16.2 16.2 27.6 28.3 29.7 41.7 28.3 50.3 31.2 55.2 31.2 54.9
BS 3 connect 5.8 5.8 15.7 15.7 25.7 26.1 28.4 41.5 30.5 47.2 27.8 51.2 29.6 53.9
BS 1 Mbp .7 0.3 2.02 1.01 3.1 1.56 3.94 2.68 3.71 3.27 3.55 3.3 3.49 3.16
BS 2 Mbps 0.7 0.3 2.07 1.04 3.53 1.81 3.8 2.67 3.62 3.22 3.99 3.53 3.99 3.51
BS 3 Mbps 0.7 0.4 2.01 1 3.29 1.67 3.64 2.66 3.9 3.02 3.56 3.28 3.79 3.45
Without femto
10 30 50 80 100 150 200
0s
Progress In Electromagnetics Research B, Vol. 36, 2012 65
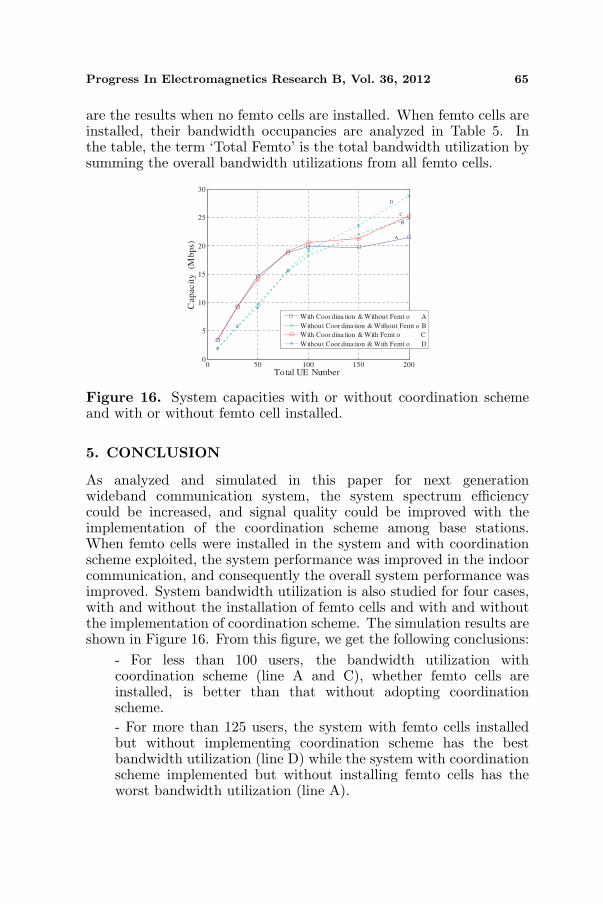
are the results when no femto cells are installed. When femto cells areinstalled, their bandwidth occupancies are analyzed in Table 5. Inthe table, the term ‘Total Femto’ is the total bandwidth utilization bysumming the overall bandwidth utilizations from all femto cells.
0 50 100 150 2000
5
10
15
20
25
30
Total UE Number
Cap
ac
ity
(M
bp
s)
With Coor dina tion & Without Femt o A
Without Coor dina tion & Without Femt o B
With Coor dina tion & With Femt o C
Without Coor dina tion & With Femt o D
A
D
C
B
Figure 16. System capacities with or without coordination schemeand with or without femto cell installed.
5. CONCLUSION
As analyzed and simulated in this paper for next generationwideband communication system, the system spectrum efficiencycould be increased, and signal quality could be improved with theimplementation of the coordination scheme among base stations.When femto cells were installed in the system and with coordinationscheme exploited, the system performance was improved in the indoorcommunication, and consequently the overall system performance wasimproved. System bandwidth utilization is also studied for four cases,with and without the installation of femto cells and with and withoutthe implementation of coordination scheme. The simulation results areshown in Figure 16. From this figure, we get the following conclusions:
- For less than 100 users, the bandwidth utilization withcoordination scheme (line A and C), whether femto cells areinstalled, is better than that without adopting coordinationscheme.- For more than 125 users, the system with femto cells installedbut without implementing coordination scheme has the bestbandwidth utilization (line D) while the system with coordinationscheme implemented but without installing femto cells has theworst bandwidth utilization (line A).

66 Tseng et al.
ACKNOWLEDGMENT
This study is partially support by the National Science Council, ROCunder contracts NSC 100-2221-E-032-031, NSC 100-2219-E-009-027.
REFERENCES
1. Lien, S. Y. and K.-C. Chen, “Statistical traffic control forcognitive radio empowered LTE-advanced with network MIMO,”IEEE Conference on Computer Communications Workshops(INFOCOM WKSHPS), 80–84, 2011.
2. Tong, Z., B. B. Li, and M. Q. Liu, “A novel downlink coordinationscheme for CoMP SU-MIMO,” International Conference onNetwork Computing and Information Security (NCIS), Vol. 1,121–125, 2011.
3. Liu, G. Y., J. H. Zhang, D. J. Jiang, L. Lei, Q. X. Wang,and F. Qin, “Downlink interference coordination and mitigationfor future LTE-advanced system,” Asia-Pacific Conference onCommunications, APCC, 225–229, 2009.
4. Rahman, M., H. Yanikomeroglu, and W. Wong, “Interferenceavoidance with dynamic inter-cell coordination for downlinkLTE system,” IEEE Wireless Communications and NetworkingConference, 1–6, 2009.
5. Brueck, S., J. Giese, L. Zhao, and A. Dekorsy, “On MAClayer throughput enhancements in LTE-A by downlink macrodiversity,” IEEE International Conference on CommunicationsWorkshops, 1–5, 2009.
6. Lee, Y.-H., Y.-G. Jan, L. Wang, Q. Chen, Q. W. Yuan, andK. Sawaya, “Using hopping technique for interference mitigationin modulated scattering array antenna system,” IEICE ElectronicsExpress, Vol. 7, No. 12, 839–843, 2010(SCI, EI, Engineering).
7. Lee, Y.-H., Y.-G. Jan, H. Huang, Q. Chen, Q. W. Yuan, andK. Sawaya, “Using LDPC coding and AMC to mitigate receivedpower imbalance in carrier aggregation communication system,”IEICE Electronics Express, Mar. 31, 2011.
8. Foschini, G. J. and M. J. Gans, “On limits of wirelesscommunications in a fading environment when using multipleantennas,” Wireless Personal Communications, Vol. 6, 311–335,Feb. 1998.
9. “IEEE 802.16 m evaluation methodology document (EMD),”IEEE 02.16m-08/004r5, Jan. 2009.
10. Hoymann, C., “Analysis and performance evaluation of the
Progress In Electromagnetics Research B, Vol. 36, 2012 67
OFDM-based metropolitan area network IEEE 802.16,” Interna-tional Journal of Computer and Telecommunications Networking,Vol. 49, 341–363, Oct. 2005.
11. Srinivasan, R., J. Zhuang, L. Jalloul, R. Novak, and J. Park,“IEEE 802.16 m Evaluation Methodology Document,” IEEE802.16 Broadband Wireless Access Working Group, 80216 m-08 003r7(SDD), Jan. 15, 2009.
12. Erceg, V., K. V. S. Hari, M. S. Smith, D. S. Baum, and P. Soma,“Channel models for fixed wireless applications,” IEEE 802.16Broadband Wireless Access Working Group, C802.16.3c-01/29r4,Jun. 2003.
13. Molisch, A. F., H. Asplund, R. Heddergott, M. Steinbauer, andT. Zwick, “The COST259 directional channel model-I. overviewand methodology,” IEEE Trans. Wireless Communication, Vol. 5,3421–3433, 2006.
14. Steinbauer, M., A. F. Molisch, and E. Bonek, “The double-directional radio channel,” IEEE Antennas and PropagationMagazine, 51–63, Aug. 2001.
15. Stallings, W., Wireless Communications and Networks, Prentice-Hall, 2002.
16. COST Action 231, “Digital mobile radio towards futuregeneration systems, final report,” Tech., Rep., EuropeanCommunities, EUR 18957, 1999.
17. Lee, H.-H., J.-H. Lee, H.-K. Song, and C.-K. Song, “Simpleand efficient received signal detection technique using channelinformation for MIMO-OFDM,” Journal of ElectromagneticWaves and Applications, Vol. 23, Nos. 11–12, 1417–1428, 2009.
18. Lee, Y.-D., D.-H. Park, and H.-K. Song, “Improved channelestimation and MAI-robust schemes for wireless OFDMAsystem,” Progress In Electromagnetics Research, Vol. 81, 213–223,2008.
19. Nam, S.-H., J.-S. Yoon, and H.-K. Song, “An elaboratefrequency offset estimation for OFDM systems,” Progress InElectromagnetics Research Letters, Vol. 4, 33–41, 2008.
20. Rel.9 3GPP TR 36.814, “Further advancements for E-UTRAphysical layer aspects,” Mar. 2010.
21. Coiler, “WiMAX Band Selective Repeater- BR-2600,” http://ww-w.coiler.com.tw.


![Transition Metal Coordination Chemistry · PDF fileTransition Metal Coordination Chemistry Prof S.M.Draper ... 1 ]- 2 + d 8 [V(CN) 6]4-[Fe(ox) ... Lewis Acid-Base Concept: parallel](https://static.fdocuments.in/doc/165x107/5aa2362a7f8b9a1f6d8cf388/transition-metal-coordination-chemistry-metal-coordination-chemistry-prof-smdraper.jpg)