Performance Analysis Tools - SAP MaxDB: The SAP...
65
1
Transcript of Performance Analysis Tools - SAP MaxDB: The SAP...

1

2
Performance Analysis Tools
MaxDB provides various tools and methods for the analysis of performance bottlenecks
and monitoring current database activities. Some of these tools were originally developed only for testing and analysis in MaxDB development, but can also be used by experienced database administrators for performance analysis.
The following are of particular importance for performance analysis:
The x_cons console for monitoring current operations
The Database Analyzer program for analyzing performance bottlenecks
The diagnostic function DIAGNOSE MONITOR for identifying long-running or poorly-processed SQL statements
The diagnostic function DIAGNOSE ANALYZE for displaying information about all current SQL statements
x_cons and Database Analyzer are stand-alone programs and are called from the operating system command line. DIAGNOSE MONITOR is a part of the core functions of MaxDB.
In SAP WebAS, all functions and results can be controlled and analyzed using transaction DB50 => Current Status or DB50 => Problem Analysis. Required parameter settings, if any, are menu-driven.
3
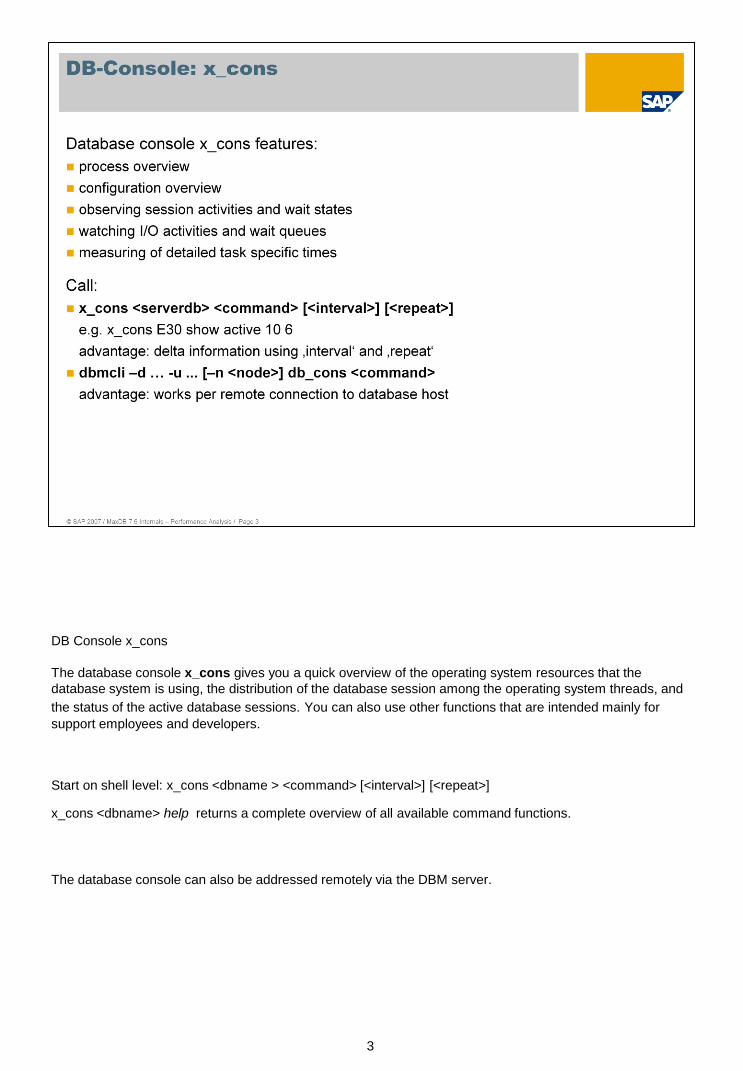
DB Console x_cons
The database console x_cons gives you a quick overview of the operating system resources that the
database system is using, the distribution of the database session among the operating system threads, and
the status of the active database sessions. You can also use other functions that are intended mainly for
support employees and developers.
Start on shell level: x_cons <dbname > <command> [<interval>] [<repeat>]
x_cons <dbname> help returns a complete overview of all available command functions.
The database console can also be addressed remotely via the DBM server.
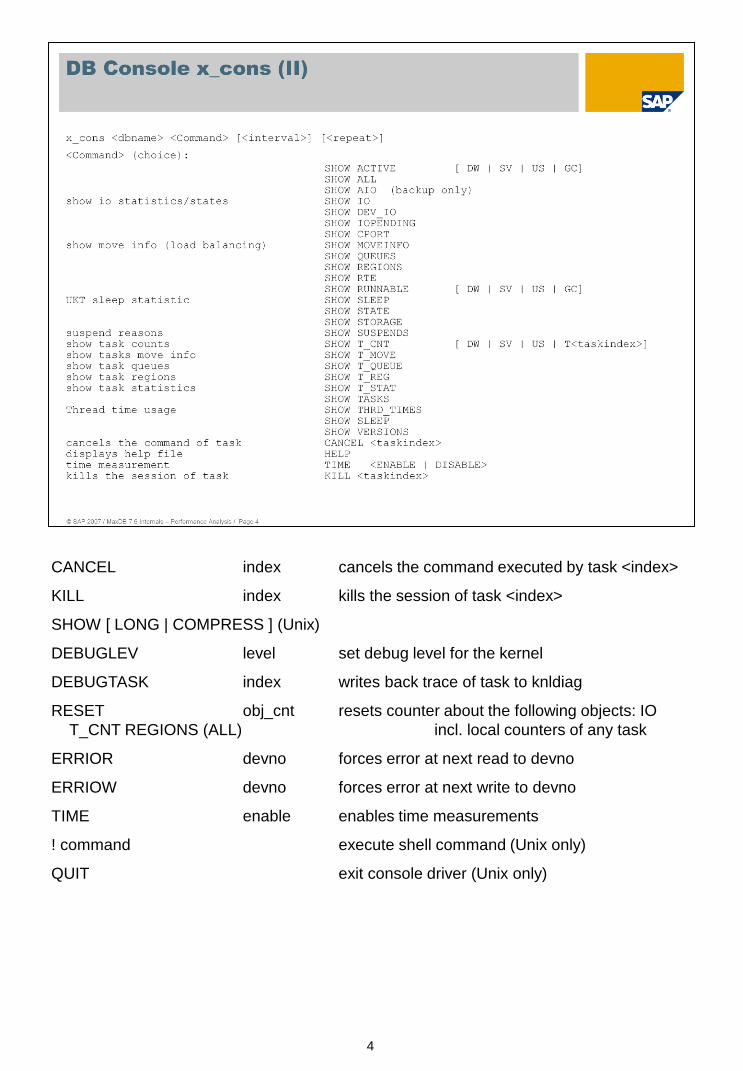
4
CANCEL index cancels the command executed by task <index>
KILL index kills the session of task <index>
SHOW [ LONG | COMPRESS ] (Unix)
DEBUGLEV level set debug level for the kernel
DEBUGTASK index writes back trace of task to knldiag
RESET obj_cnt resets counter about the following objects: IO
T_CNT REGIONS (ALL) incl. local counters of any task
ERRIOR devno forces error at next read to devno
ERRIOW devno forces error at next write to devno
TIME enable enables time measurements
! command execute shell command (Unix only)
QUIT exit console driver (Unix only)

5
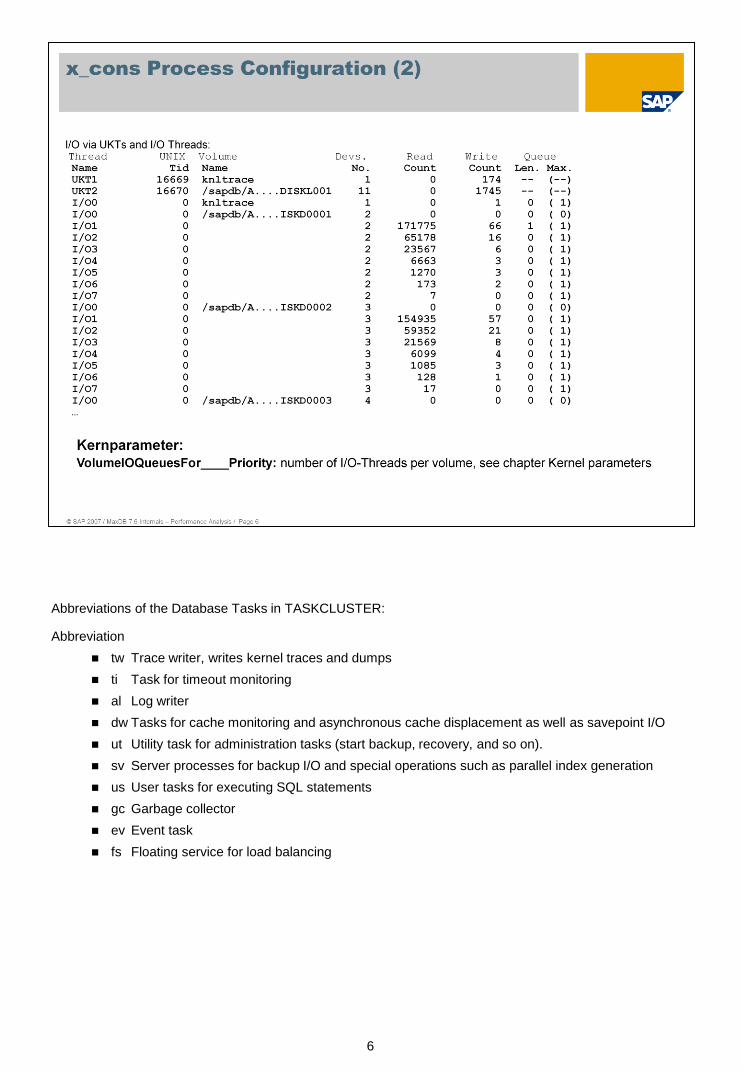
x_cons <dbname> show rte
This shows the distribution of the MaxDB threads among the operating system processes. The DB threads coordinator, console, timer, requestor and Dev0 each have their own
operating system threads. The entire database kernel runs in a single process.
However, multiple database tasks (user task, log writer, utility task, and so on) can be
located together in an operating system thread, which is called a UKT (user kernel
thread). The MaxDB runtime environment uses internal tasking to administer these
database tasks. Internal MaxDB administration takes up less operating system time,
and gives you more control over the scheduling and prioritization of individual database
sessions.
The database parameter MAXCPU is normally used to distribute the tasks automatically to
the UKTs; the (support) database parameter TASKCLUSTER (requires change in the
control file cserv.pcf) can also be used for this purpose, but only in consultation with
SAP support.
6
Abbreviations of the Database Tasks in TASKCLUSTER:
Abbreviation
tw Trace writer, writes kernel traces and dumps
ti Task for timeout monitoring
al Log writer
dw Tasks for cache monitoring and asynchronous cache displacement as well as savepoint I/O
ut Utility task for administration tasks (start backup, recovery, and so on).
sv Server processes for backup I/O and special operations such as parallel index generation
us User tasks for executing SQL statements
gc Garbage collector
ev Event task
fs Floating service for load balancing
7
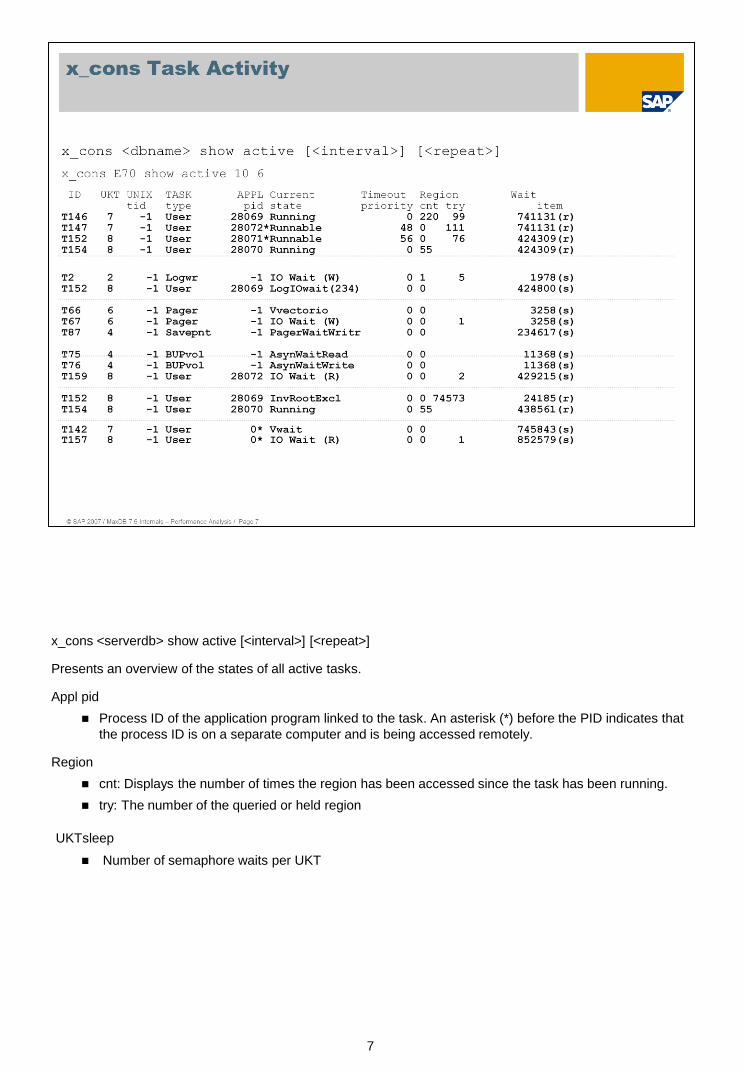
x_cons <serverdb> show active [<interval>] [<repeat>]
Presents an overview of the states of all active tasks.
Appl pid
Process ID of the application program linked to the task. An asterisk (*) before the PID indicates that
the process ID is on a separate computer and is being accessed remotely.
Region
cnt: Displays the number of times the region has been accessed since the task has been running.
try: The number of the queried or held region
UKTsleep
Number of semaphore waits per UKT
8
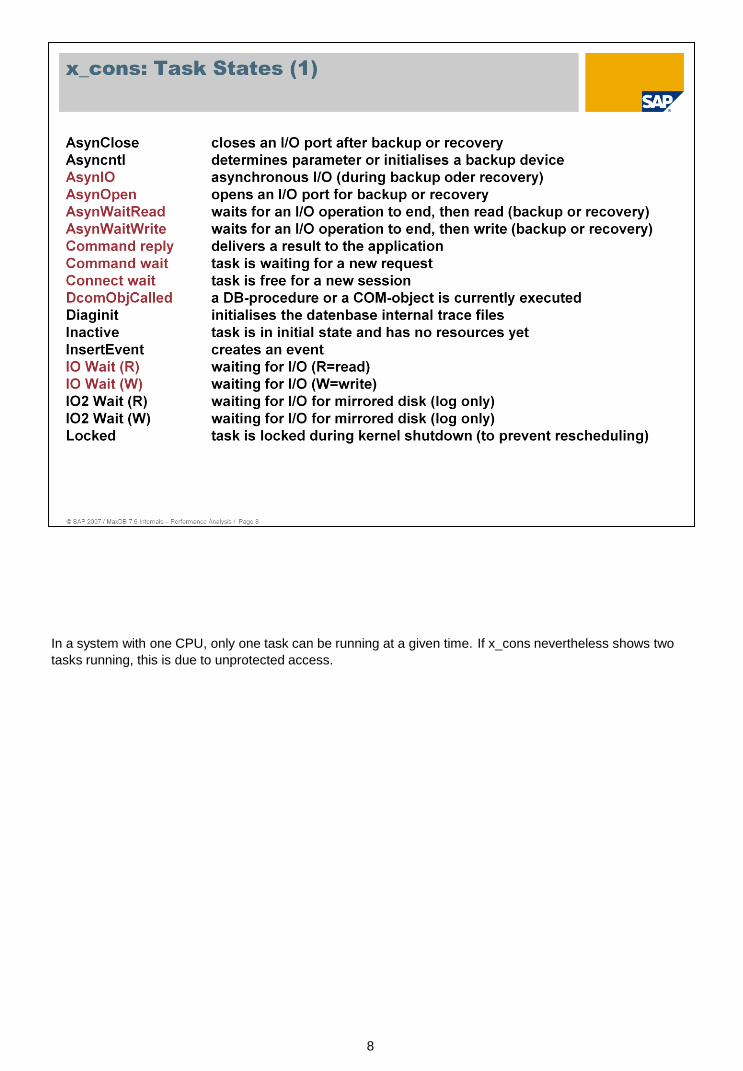
In a system with one CPU, only one task can be running at a given time. If x_cons nevertheless shows two
tasks running, this is due to unprotected access.
9

10

11
x_cons <dbname> show t_c t<task_index> displays highly- detailed measurement values for individual database tasks. In this way, you can, for example, monitor the DB activity of an application while it remains connected to a database task (no permanent release/connect).
Furthermore, with x_cons <dbname> time enable you can activate precise time measurement of the different database states. Depending on the operating system, this time measurement costs between 1% and 5% performance.
Much of the output of the 'show t_c' function was developed exclusively for developers, however, some of the values are of more general interest in special situations.
dispatcher-cnt Count of how often the task passed control to the UKT dispatcher, because it could not run, its time slot had expired, or another task was prioritized.
total_excl-cnt Number of region accesses
command-cnt Communication count between application and kernel
self_suspend-cnt Number of task suspensions in which the task remained executable but still gave up control
<dev/self>_<read/write>_io Number of I/Os via UKT (self) or DEV threads (dev)
<dev/self>_<read/write>_tm Duration of an I/O via UKT (self) or DEV threads (dev)
state_vwait Number of waits on SQL locks
avg_vwait_time Average wait time for an SQL lock
avg_rcv_rpl_t Average processing time of an SQL statement in the database kernel

‹#›
rcv_rpl_long Number of SQL statements with a processing time of more than one second
12
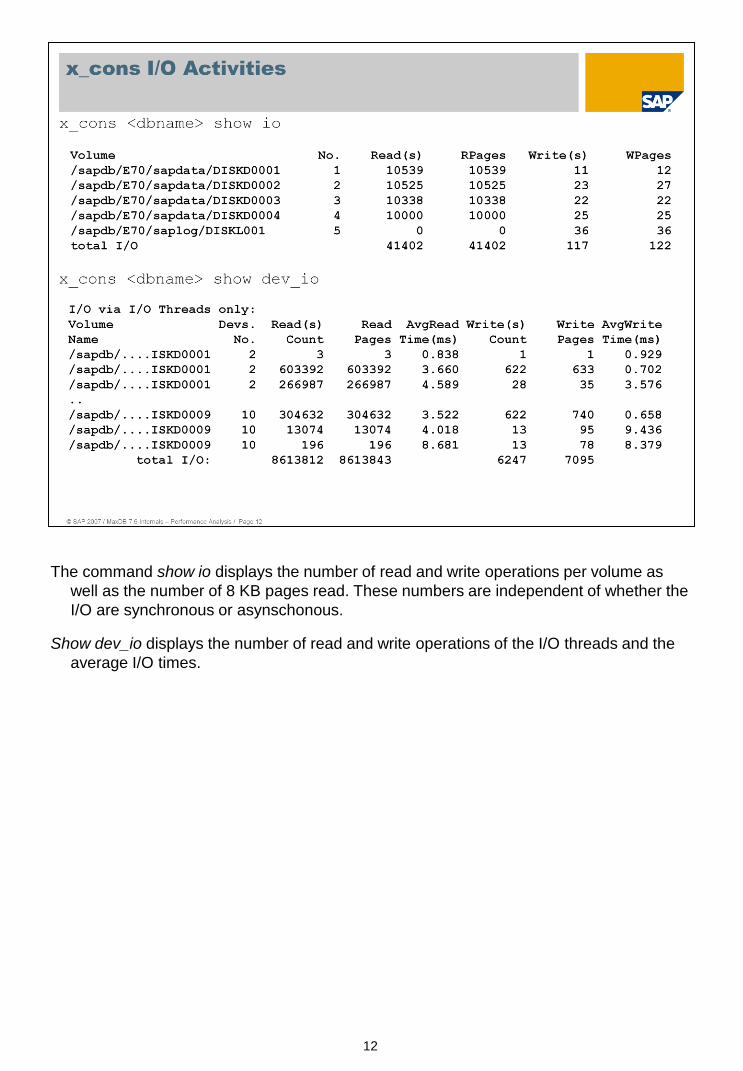
The command show io displays the number of read and write operations per volume as
well as the number of 8 KB pages read. These numbers are independent of whether the
I/O are synchronous or asynschonous.
Show dev_io displays the number of read and write operations of the I/O threads and the
average I/O times.

13
Performance Tables/ Database Console
Much of the data generated with x_cons is also accessible through tables. Thus this performance data can
also be displayed by other tools (SQLStudio, SAP WebAS->DB50).
The columns of the respective tables largely correspond to those of the database console.
14
15

16

17

18
The task manager in transaction DB50 displays all database tasks and their current status. The system
displays an overview of the database tasks and information about the current state of each individual task.
The following views are available: Active Tasks, ExecutableTasks, User Tasks (task type User), System
Tasks , All Tasks.
We use the task manager to analyze the following:
For this database MAXCPU is set to 2. Thus the database can use 2 CPUs in parallel. Task T37 is
running in another UKT (see Thread Overview, thread ID:1582) as task T61 and T63 (thread ID:1607).
Tasks T37 and T63 can both have the Running status.
We see a command (T61) that reads data from the disk to the cache - IO-WAIT (R).
In the Application column we see the process ID of the work process and via the Application Server
column we see the SAP application server.
With transaction SM50, we can identify the application that caused the long-running command using the
application PID (2887).

19
With the task manager it is possible to terminate the respective task (T37) directly on the database level.
The information in the process overview can then be used to examine the application for possible
programming errors or missing indexes.
20
21
CSN note 530394 describes bottleneck analysis with the Database Analyzer.
The DBAnalyzer is available as of version 7.3.00 Build 25.
The tools x_wizard and x_wiztrc were discontinued as of release 7.4.
Enhanceability
The tools x_wizard and x_wiztrc were not configurable. The Executables had to be recreated for each
platform every time an enhancement was carried out.
The logic and rules for monitoring with the Database Analyzer are defined by way of a configuration
file (ASCII text). In case of changes or enhancements, you only have to cahnge the configuration file in
the directory INSTROOT/env.
Release independence
As accesses to the system tables are defined in the configuration file, adjustments for new releases
only require adjusting the configuration file. Consequently, this is release-independent, but the
Database Analyzer itself is not. The configuration file takes account of the instance type (OTLP/LVC).
Remote capability
In addition to system tables, the x_wizard used output from “x_cons” that could only be generated on
the database server.
The Database Analyzer uses only system tables. The data generated by “x_cons” can be queried via
the SYSMON_…, system tables, which means they can be called remotely (e.g. via OSS).

22
Database Analyzer
For routine monitoring of database operation in the production system, an interval of 15 minutes (-t900) is
adequate. For short-term monitoring of database operation, a measuring interval of 10-30 seconds is
recommended.
If class W3 warnings occur frequently, you should certainly try to remove the bottleneck. W3 warnings
generally indicate that the runtime behavior of the database is severely compromised. If you suspect poor
search strategies (rows read/rows qualified), a more precise analysis is unavoidable. The command monitor
(DIAGNOSE MONITOR) is available for this purpose.
Not all Database Analyzer outputs are necessarily caused by actual bottlenecks. For example table scans
can be useful in certain situations, long runtimes of statements can automatically occur with large datasets
etc.
23
Configuration File: dbanalyzer.cfg
Describes ("where and why") the data to be collected or calculated (parameters). These parameter are
either taken from the database (system tables) or calculated from the parameter taken from the
database. As the manual evaluation of parameters is time-consuming, the Database Analyzer formats the
logged data.
Describes the evaluation rules (monitors) for the parameters. The monitors have up to four conditions
(Information and Warnings 1 through 3) and are logged in a way that takes account of the conditions. For logging the monitors, in the configuration file you can store a verbal assessment or even concrete
instructions for the user.

24
Up to four conditions for triggering the monitor. Conditions are boolean expressions that refer to parameters.
The top-level message is stored in the label. The label is an expression that is calculated when the monitor is
activated. This enables references to the parameters.
User-selected texts for Description and UserAction.
25

26

27
You can also call the Database Analyzers with the DBMCLI command dban_start . The Database Analyzer is then
implicitly started in the background. The Database Analyzer call can be supplemented with various options.
-n <server>
Name of the computer on which the database instance is running. If you enter this argument, you have to specify a
directory for logging with the -o switch.
-d <database>
Name of the database instance that is to be examined.
-u <user,pwd>
User name and password for authorization on the database server.
-f <configfile>
Indicates the name of the configuration file to be used. The standard setting specifies the file dbanalyzer.cfg in the
directory $INSTROOT/env.
-t <interval>,<number>
Defines the time interval (in seconds) between two evaluations. If <number> is specified, the Database Analyzer ends
automatically when it has reached the specified number.
-o <outputdir>
Specifies the directory in which the log files of the Database Analyzer are written. If you specify -n <server> at the
time of the call, you also have to specify a log directory. If you fail to specify a log directory, logging is done in the
RUNDIRECTORY of the database instance in the subdirectory analyzer.
-c <outputlevel>
Specifies that Database Analyzer output also be written to the console. In the standard setting, no output is written to
the console. With <outputlevel> you can specify how much is to be output. The possible values are 1, 2, 3 and 4.
-i Deletes (initializes) any pre-existing log files. This enables the logging of data from different databases in the same
directory, which is otherwise prohibited. The data of the previously analyzed database are deleted in the process.

28
For routine monitoring of database operation in the production system, an interval of 15
minutes (-t900) is adequate. Logging should be activated with -p to obtain a retrospective
overview of DB activities. For short-term monitoring of database operation, a measuring
interval of 10-30 seconds is recommended.

29
As of support packages 6.20 SP37, the Database Analyzer starts automatically when the SAP WebAS
system is started.
You can call the Database Analyzer from transaction DB50 -> Problem Analysis-> Bottlenecks. You can also
stop and restart it from there.
The default time interval for determining measurement data is 15 minutes. You can override this configuration
stopping and restarting the Database Analyzer.
Each time the Database Analyzer is started, information about the configuration and performance-relevant
data from system tables is output, including, for example, the number of tables that require an Update
Statistics. You can determine the table names with a Select on the system table sysupdstatwanted.
Detected bottlenecks are output in text form to rapidly provide database administrators with an overview of
the possible causes of performance problems. The analysis can be performed just once or at regular
intervals.

30
Under Expert Analysis you can view into the logs of a particular day.
Logs are implicitly deleted periodically via the program RSDBANCONTROL. You can configure how long logs
are kept using transaction DB59 in the integration data for the respective system. (6.20 as of basis SP 37).
31
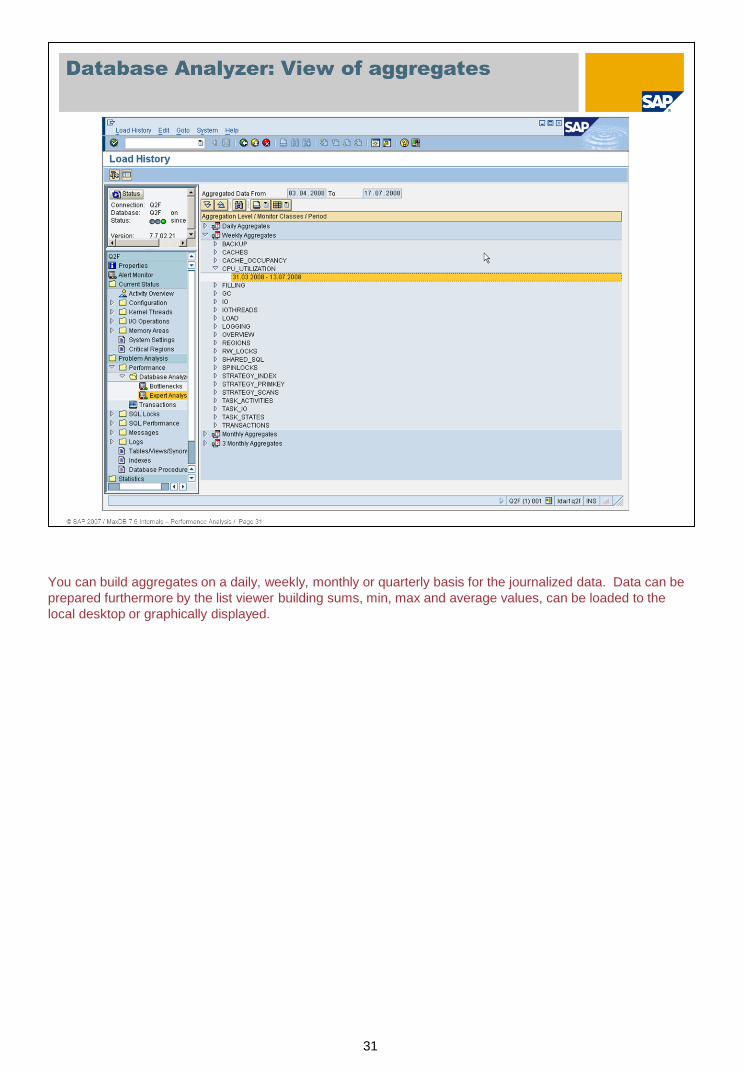
You can build aggregates on a daily, weekly, monthly or quarterly basis for the journalized data. Data can be
prepared furthermore by the list viewer building sums, min, max and average values, can be loaded to the
local desktop or graphically displayed.

32
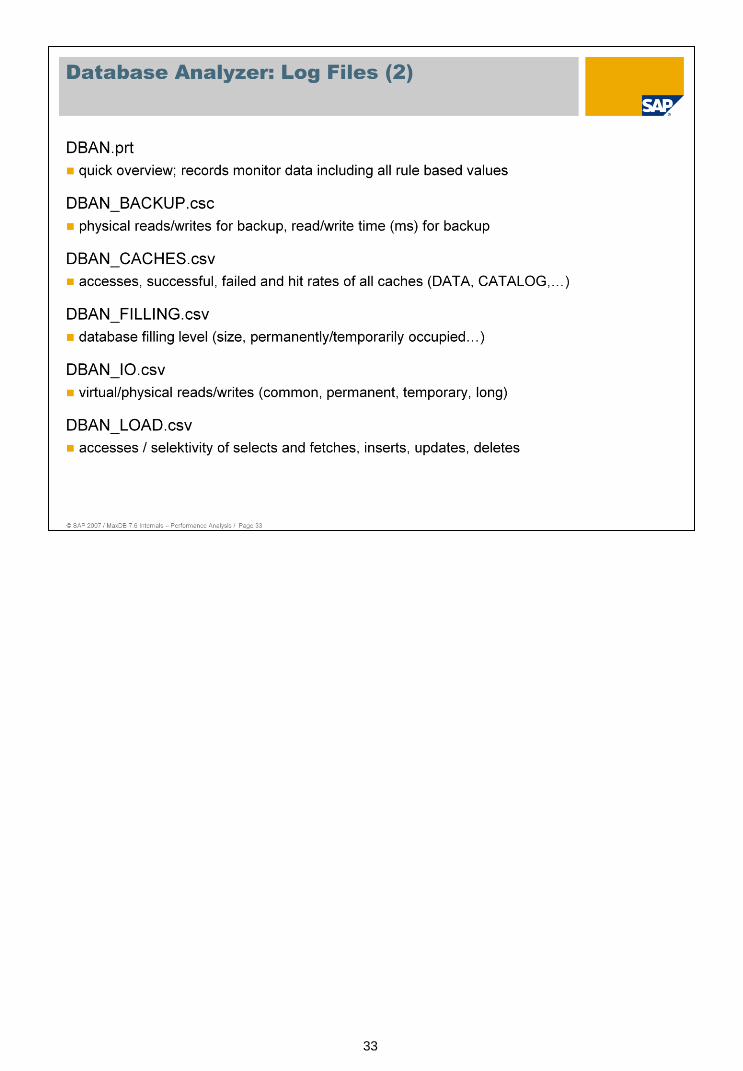
Storing performance data in the logs is useful when checking runtime behavior later.
The collected data is stored as "csv" files in the directory/YYYYMMDD specified with "-o".
If you start the Database Analyzer on the DB server, you can omit the "-o" entry. In that case, logging is done in the run directory/YYYYMMDD
A directory contains the data from one day.
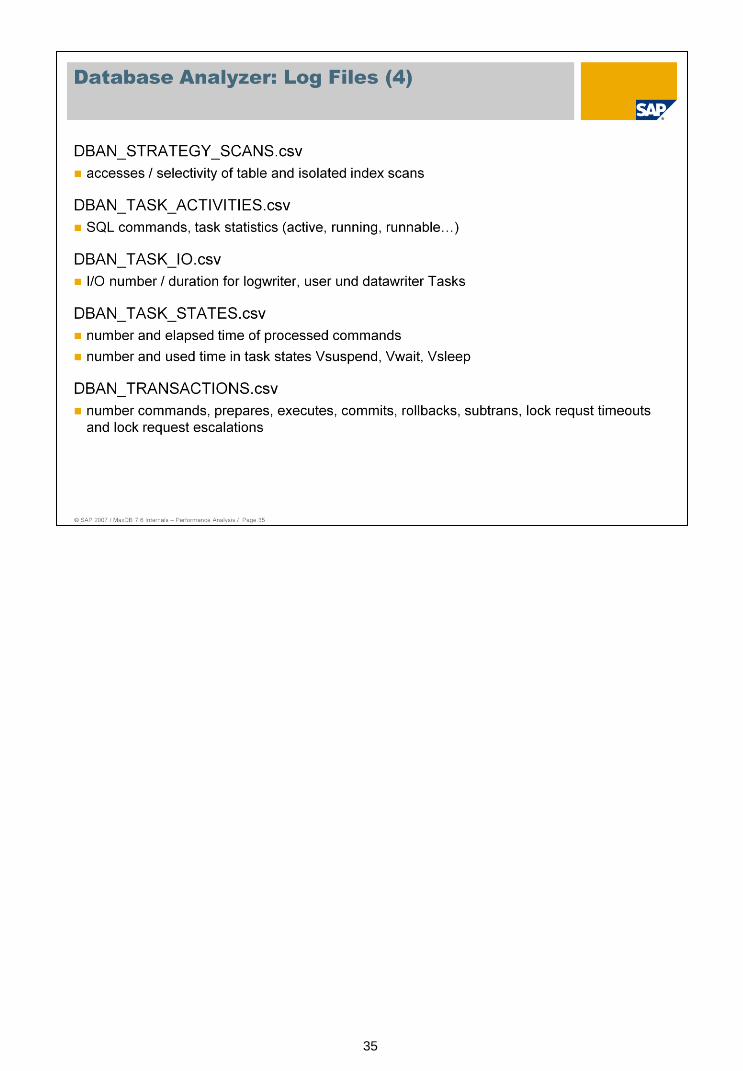
The data is grouped by contents and stored in different files. You can display the day in a table with MS Excel
and from the WebAS.
33

34
35

36
Via transaction DB59 -> Integration Data-> Automatic Monitoring, you can define the time interval at which
Database Analyzer logs are deleted.
By default, the logs are stored for 93 days.
The corresponding information in the database table SDBCCMS, however, is kept for 15 weeks. For more
information, see note 530394.
You can make your own personal settings by choosing Display/Change.

37
Database Analyzer: Data Cache
Low data cache hit rate : <percentage> %
<number of> accesses, <number> successful, <number> unsuccessful
Explanations
The hit rate is too low when accessing the database cache. The data cache hit rate for a running database
application should not be less than 98%; otherwise, too much data has to be read physically. For a short
time, lower hit rates may occur; e.g., when reading tables for the first time, or when the table does not fit into
10% of the data cache with repeated table scans (only with
UseDataCacheScanOptimization/LRU_FOR_SCAN = NO). Data cache hit rates under 98% for
intervals of 15 minutes or more must be avoided.
User response
In addition to enlarging the data cache (note the paging risk in the operating system), search for the cause of
the high read activity. Frequently, individual SQL statements cause a high percentage of the total logical and
physical read activities. Enlarging the cache only transfers the load from the disk to the CPU although an
additional index, for example, could transform a read-intensive table scan into a cheap direct access.

38
Database Analyzer: cache displacements
Cache displacements: <number of> pages/second
Explanations
Modified pages are displaced from the data cache to disk because the data used by the applications cannot
be completely kept in the data cache. If the size of the data cache were sufficient, the physical write would be
delayed until the next SAVEPOINT and then be done asynchronously. Cache displacements result in
synchronous I/O and should be avoided, if possible.
User response
Enlargement of the data cache. Particularly with larger data imports, the so-called pagers should be
activated for regular asynchronous buffer flushes between the SAVEPOINTS database parameter
DataCacheIOAreaSize, DataCacheIOAreaFlushThreshold, DataCacheLRUAreaFlushThreshold or in earlier
versions _DW_IO_AREA_SIZE, _DW_IO_AREA_FLUSH, _DW_LRU_TAIL_FLUSH).
39
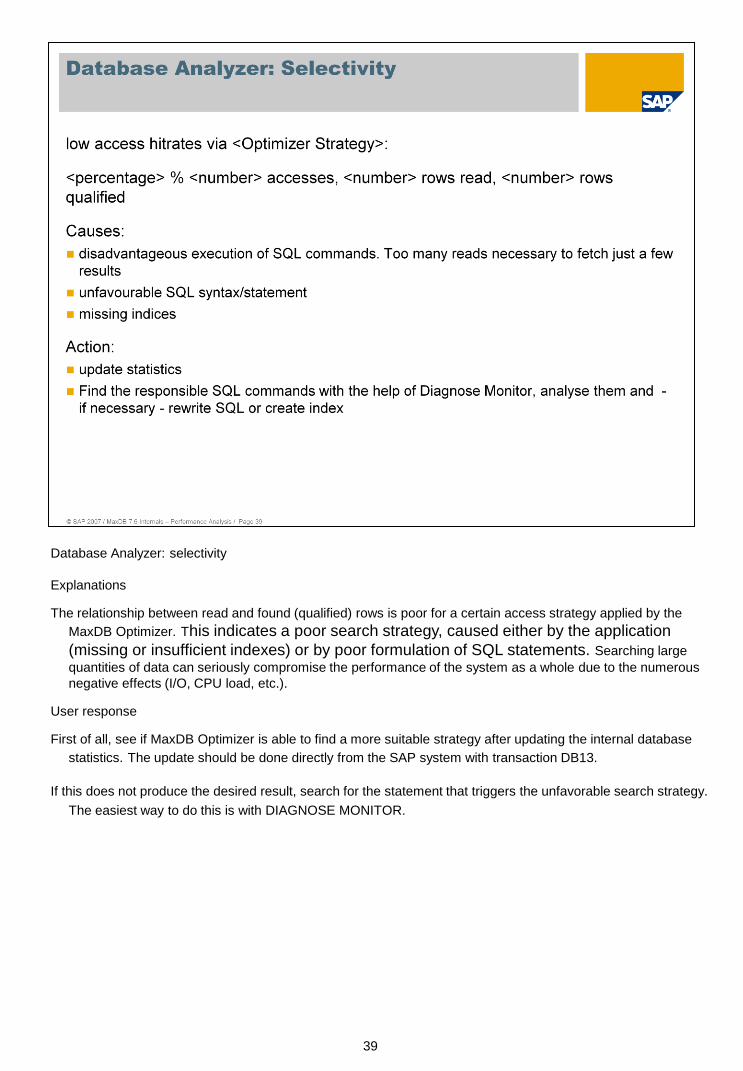
Database Analyzer: selectivity
Explanations
The relationship between read and found (qualified) rows is poor for a certain access strategy applied by the
MaxDB Optimizer. This indicates a poor search strategy, caused either by the application
(missing or insufficient indexes) or by poor formulation of SQL statements. Searching large
quantities of data can seriously compromise the performance of the system as a whole due to the numerous
negative effects (I/O, CPU load, etc.).
User response
First of all, see if MaxDB Optimizer is able to find a more suitable strategy after updating the internal database
statistics. The update should be done directly from the SAP system with transaction DB13.
If this does not produce the desired result, search for the statement that triggers the unfavorable search strategy.
The easiest way to do this is with DIAGNOSE MONITOR.

40
For detailed information on the monitor classes, choose Expert Analysis.
You get an overview of all available logs generated by the Database Analyzer. The significance of the
individual logs is described on the following slides
To display the content of a file, double-click the relevant monitor class.

41
Logging can be switched on directly in SAP WebAS using transaction DB50 or with the following dbmcli command:
dbmcli -n <dbserver> -d <dbname> -u ... -uSQL sapr3,sap sql_execute
diagnose monitor selectivity <number>
| read <number>
| time <number>
| rowno <number>
| off
Selectivity: Ratio of qualified to total records read is below the specified threshold
value
Read (page accesses): Specified number of virtual reads exceeded
Time (runtime): Runtime of the command exceeds the specified time in milliseconds
Rowno: Number of statements to be stored as specified in SYSMONITOR (default
255)
Off: Deactivation

42
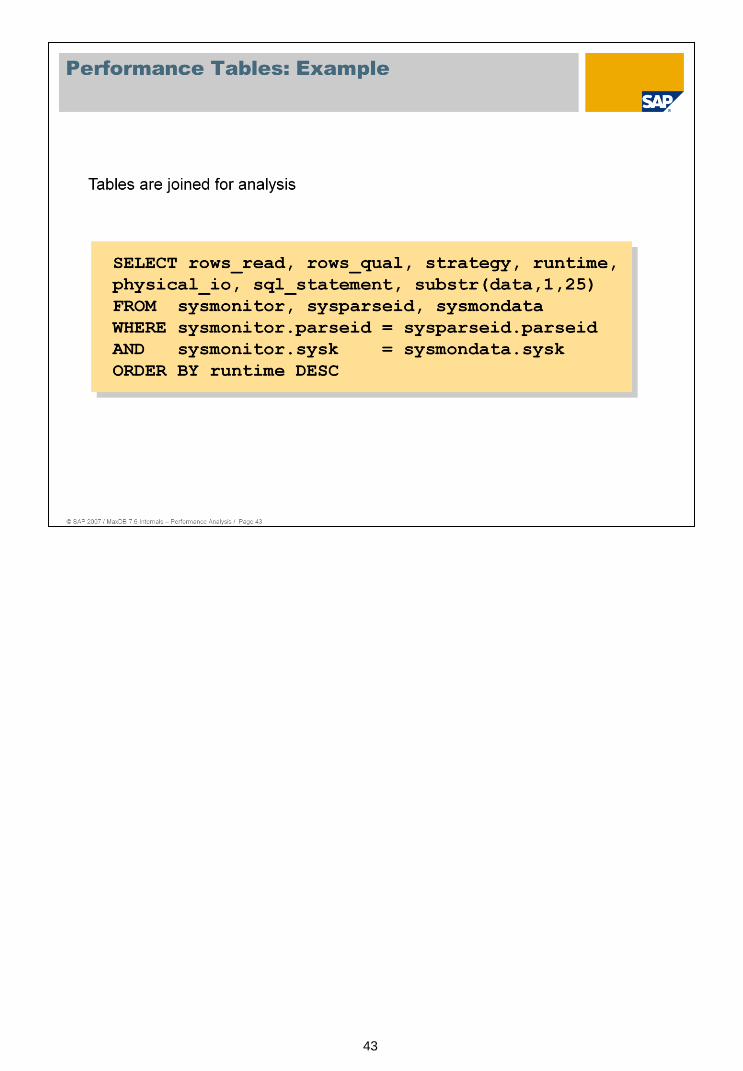
Performance tables
The tables SYSMONITOR and SYSPARSEID are filled following activation of the DIAGNOSE MONITOR.
SYSPARSEID can grow to any size, SYSMONITOR is overwritten cyclically.
The table SYSPARSEID contains the parse ID PARSEID for every parsed statement and the command string
SQL_STATEMENT.
COLUMN NAME MOD DATA TYPE CODE LEN
PARSEID KEY CHAR BYTE 12
LINKAGE KEY FIXED 1
SELECT_PARSEID OPT CHAR BYTE 12
OWNER OPT CHAR ASCII 18
SQL_STATEMENT OPT CHAR ASCII 3900
43

44
When you do a performance analysis, check the system settings to ensure that the performance analysis
tools are working.
Monitoring: If monitoring is active, general performance-relevant data is stored in the system tables. Monitoring is automatically activated by the start scripts when you start the SAP WebAS and the
database.
Monitor Data Collection: activates logging of transfer values in the Where condition of
each SQL statement in the command monitor.
Diagnose Monitor Read / Selectivity: display the settings with which the command monitor (DIAGNOSE
MONITOR) was started. If the command monitor is not active, the corresponding entries in the system
settings are missing.
Diagnose Analyze and Diagnose Analyze Filter: Resource monitor (see below)
Monitor Rows: Number of SQL statements
No of bad Indexes: indicates if there are defective indexes in the database. If an index is defective, it
cannot be used for access.

45
You start the detailed performance analysis by checking the statistics to see if there is anything unusual in
the functioning of the system today.
Display the database activities for a certain point in time. Let's have a look at Wednesday, 7 November,
2001.
The overview of database activities is logged daily by a collector
(COLLECTOR_FOR_PERFORMANCEMONITOR).
SQL Commands: Total number of SQL statements, commits, rollbacks, prepares
We see that on Wednesday, 7 November, a somewhat higher number of SQL statements was executed
than on other days.
46
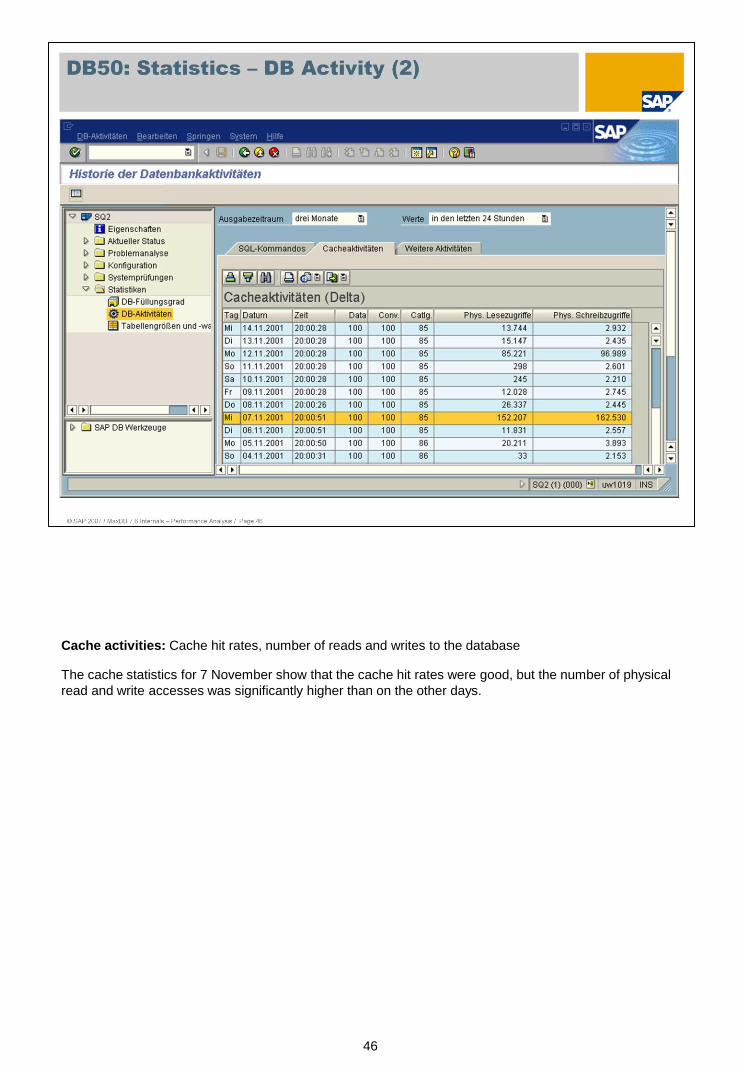
Cache activities: Cache hit rates, number of reads and writes to the database
The cache statistics for 7 November show that the cache hit rates were good, but the number of physical
read and write accesses was significantly higher than on the other days.
47
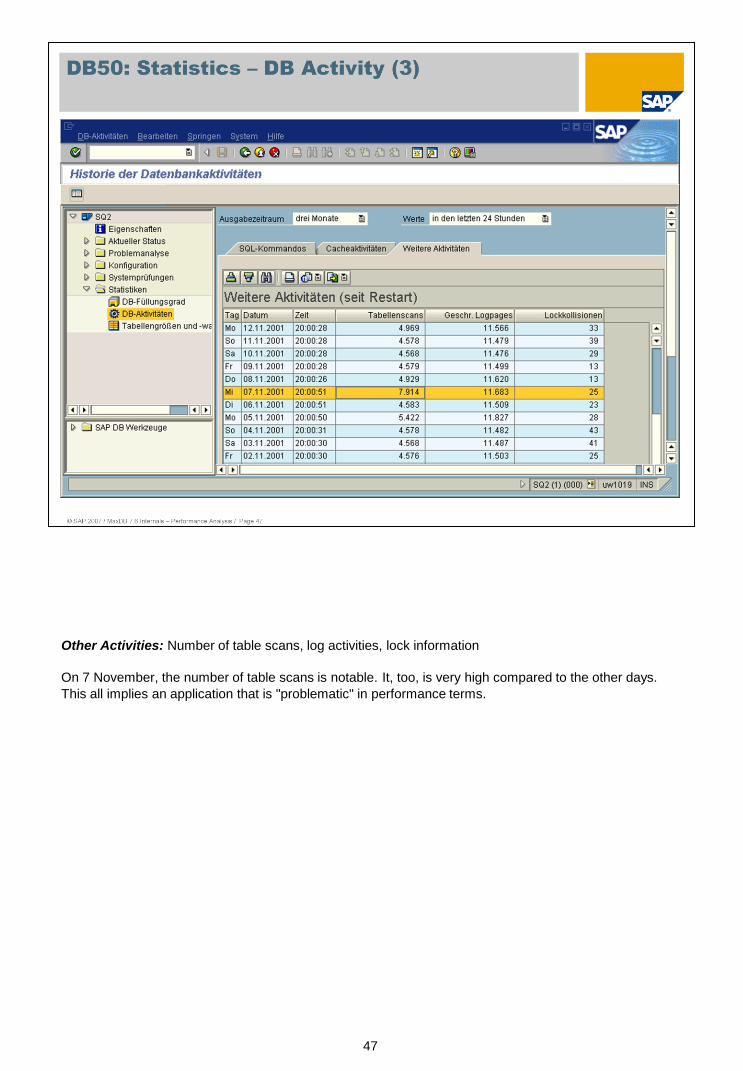
Other Activities: Number of table scans, log activities, lock information
On 7 November, the number of table scans is notable. It, too, is very high compared to the other days. This all implies an application that is "problematic" in performance terms.

48
The command monitor (Diagnose Monitor) allows you to identify long-running SQL statements. This tool is
intended for short analyses, since the number of recorded SQL statements is limited. Specify criteria to
restrict the volume and type of SQL statements that are recorded.
Within SAP WebAS, logging is activated via transaction DB50 ? Problem Analysis? SQL Performance ?
Command Monitor. You can set up various criteria in succession. A statement is logged when at least one
of the criteria is fulfilled.
Choose Command Monitor -> Change Monitor Settings to determine the recording criteria by which SQL
statements are logged in the command monitor tables.
Number of page accesses: An SQL statement is logged when the number of page accesses exceeds the
specified value.
SQL statement runtime: An SQL statement is logged when the runtime exceeds the specified value (in
seconds).
Selectivity: An SQL statement is logged in the command monitor tables if the ratio of qualified records to
records read falls below the specified percentage.
Save parameter values: Select this field if you want to log the SQL statements with their parameters.
Max. number of monitor entries: This value determines the maximum number of entries that are held in the
table SYSMONITOR before the table is overwritten.
49
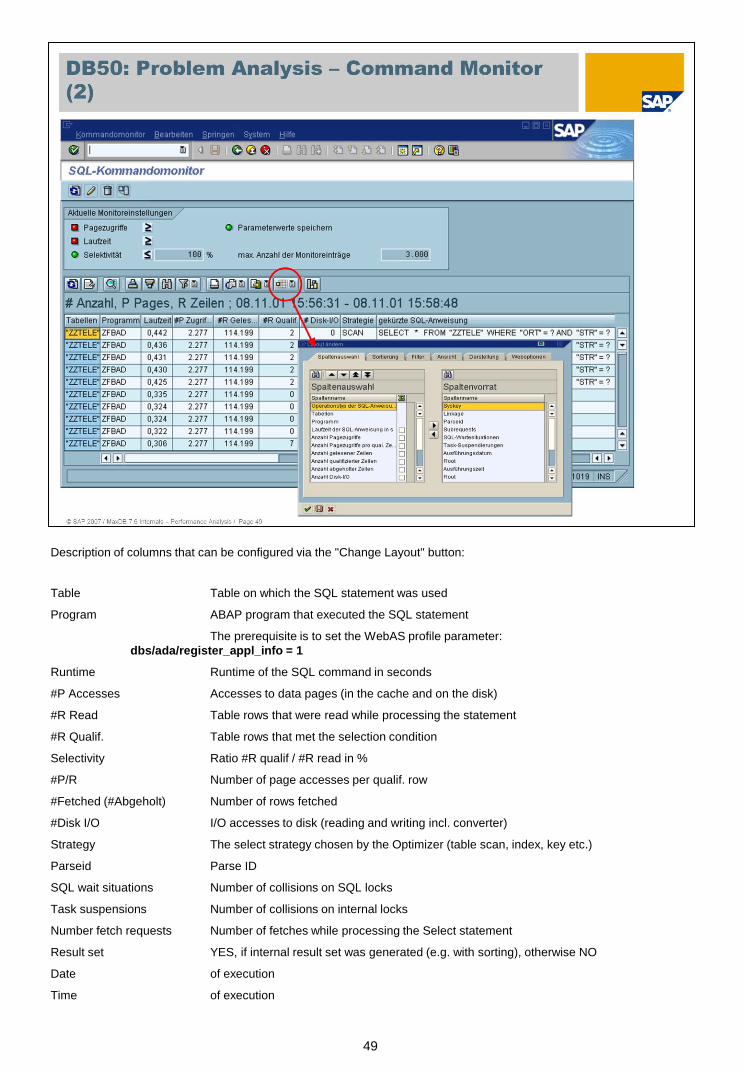
Description of columns that can be configured via the "Change Layout" button:
Table Table on which the SQL statement was used
Program ABAP program that executed the SQL statement
The prerequisite is to set the WebAS profile parameter:
dbs/ada/register_appl_info = 1
Runtime Runtime of the SQL command in seconds
#P Accesses Accesses to data pages (in the cache and on the disk)
#R Read Table rows that were read while processing the statement
#R Qualif. Table rows that met the selection condition
Selectivity Ratio #R qualif / #R read in %
#P/R Number of page accesses per qualif. row
#Fetched (#Abgeholt) Number of rows fetched
#Disk I/O I/O accesses to disk (reading and writing incl. converter)
Strategy The select strategy chosen by the Optimizer (table scan, index, key etc.)
Parseid Parse ID
SQL wait situations Number of collisions on SQL locks
Task suspensions Number of collisions on internal locks
Number fetch requests Number of fetches while processing the Select statement
Result set YES, if internal result set was generated (e.g. with sorting), otherwise NO
Date of execution
Time of execution

‹#›
Subrequests
50
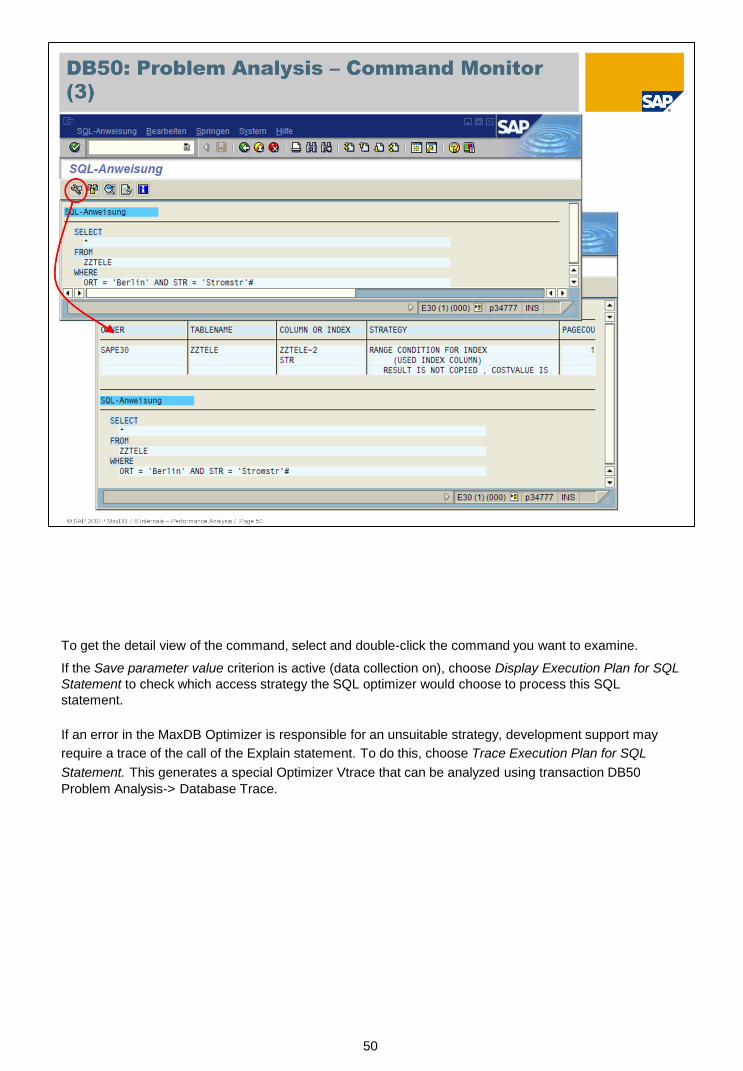
To get the detail view of the command, select and double-click the command you want to examine.
If the Save parameter value criterion is active (data collection on), choose Display Execution Plan for SQL
Statement to check which access strategy the SQL optimizer would choose to process this SQL
statement.
If an error in the MaxDB Optimizer is responsible for an unsuitable strategy, development support may
require a trace of the call of the Explain statement. To do this, choose Trace Execution Plan for SQL
Statement. This generates a special Optimizer Vtrace that can be analyzed using transaction DB50
Problem Analysis-> Database Trace.

51
The Calling point in the ABAP Program can be used to determine the BAP program from which the
statement was started. For this link to work with systems with WebAS versions below 6.40 dbsl patch 32,
set the following parameter in the instance profile of the SAP WebAS: dbs\ada\register_appl_info = 1.
In most cases, the processing of a statement can be accelerated by adjusting the ABAP code.

52
Using the Explain statement, we see that in our case the statement was executed with a table scan. That
is, the whole table was read in order records that have Berlin in the CITY column and Stromstr in the ST
column.
Here the question arises why an index wasn't used, or rather, why the SELECT was formulated in such a
way.
53
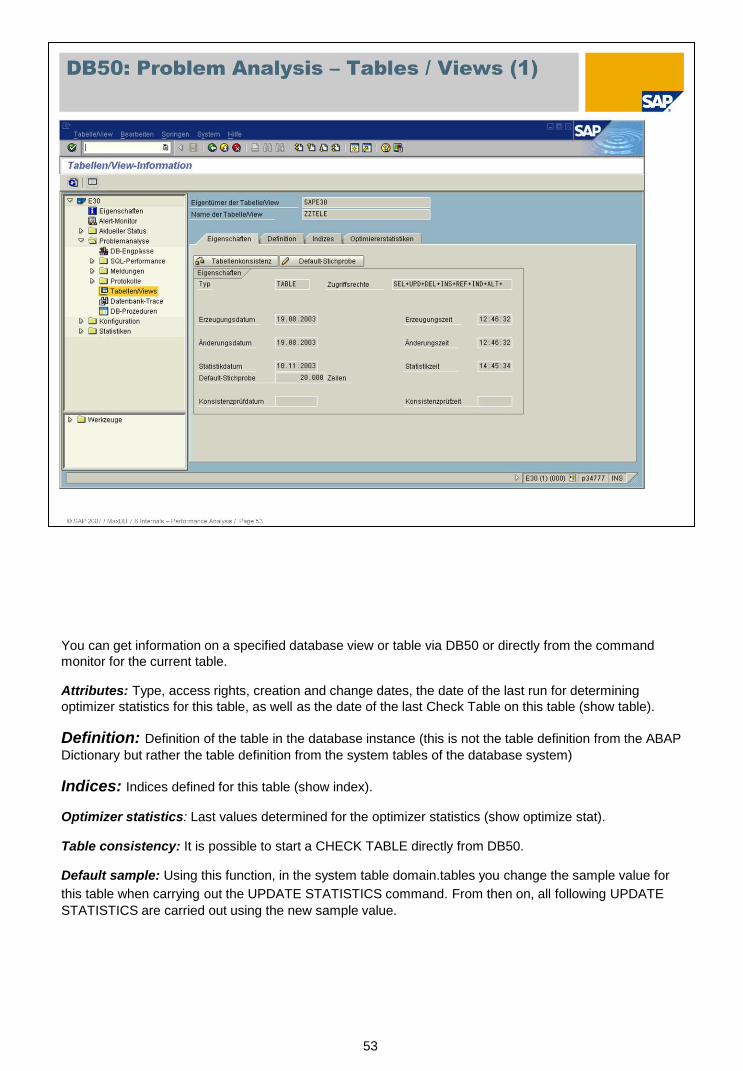
You can get information on a specified database view or table via DB50 or directly from the command
monitor for the current table.
Attributes: Type, access rights, creation and change dates, the date of the last run for determining
optimizer statistics for this table, as well as the date of the last Check Table on this table (show table).
Definition: Definition of the table in the database instance (this is not the table definition from the ABAP
Dictionary but rather the table definition from the system tables of the database system)
Indices: Indices defined for this table (show index).
Optimizer statistics: Last values determined for the optimizer statistics (show optimize stat).
Table consistency: It is possible to start a CHECK TABLE directly from DB50.
Default sample: Using this function, in the system table domain.tables you change the sample value for
this table when carrying out the UPDATE STATISTICS command. From then on, all following UPDATE
STATISTICS are carried out using the new sample value.
54
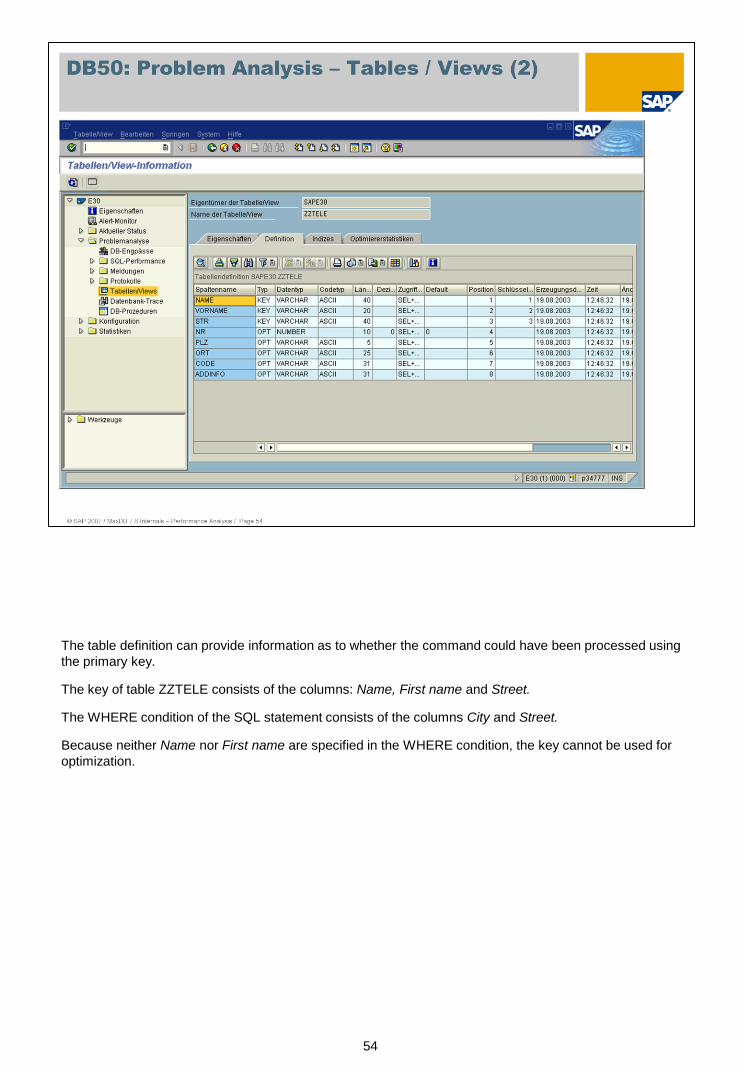
The table definition can provide information as to whether the command could have been processed using
the primary key.
The key of table ZZTELE consists of the columns: Name, First name and Street.
The WHERE condition of the SQL statement consists of the columns City and Street.
Because neither Name nor First name are specified in the WHERE condition, the key cannot be used for
optimization.

55
The optimizer statistics provide an overview about the selectivity of the individual columns.
The cost-based optimizer determines the best access strategy with the help of statistical information about
the size of the table and values within the table columns.
A cost-benefit plan is created for the various access options.
The optimizer statistics are updated by an UPDATE STATISTICS. You have the option to specify sample
values for this UPDATE STATISTICS run. There is no entry of the sample value in the system table
domain.tables.

56
Using the Indices function you can check the following:
whether indices exist for the table
whether these indices were already used by the optimizer
whether access to this index is allowed (enabled) or not allowed (disabled)
whether the index is consistent or perhaps set to BAD
via which table column the index has been created
There were 3 indices created for the table ZZTELE, and access to them is forbidden. In other words, the
indices were disabled. This could have been necessary in order to test out how a command will be
processed if the index did not exist. This feature is offered since this procedure can be performed more
quickly than if the index is first deleted and then recreated later. Often this is not possible, especially for
large table.
The command logged in the command monitor could therefore only be performed via a table scan
because the index that could be used for the optimization is inactive.
The index can be activated directly from this menu. You can do this by selecting the index and choosing
Allow index access. The column Access will be highlighted in green after performing this action.
After restarting the application, the analyzed command may no longer appear in the command monitor.

57
As of version SAP WebAS 6.20 with Basis Support Package 39, the detail display is also expanded.
Properties: Type, access rights, creation and change date
Definition: Definition of the tables in the database instance that are involved in the view (this is not the
table definition from the ABAP Dictionary but rather the table definition from the system tables of the
database system)
Create Statement: displays the create statement with which the view was created.
Keys of the Tables: all key columns of all tables involved in the view.
Indexes: Indexes defined for this table
Optimizer statistics: Last values determined for the optimizer statistics (show optimize stat).
58
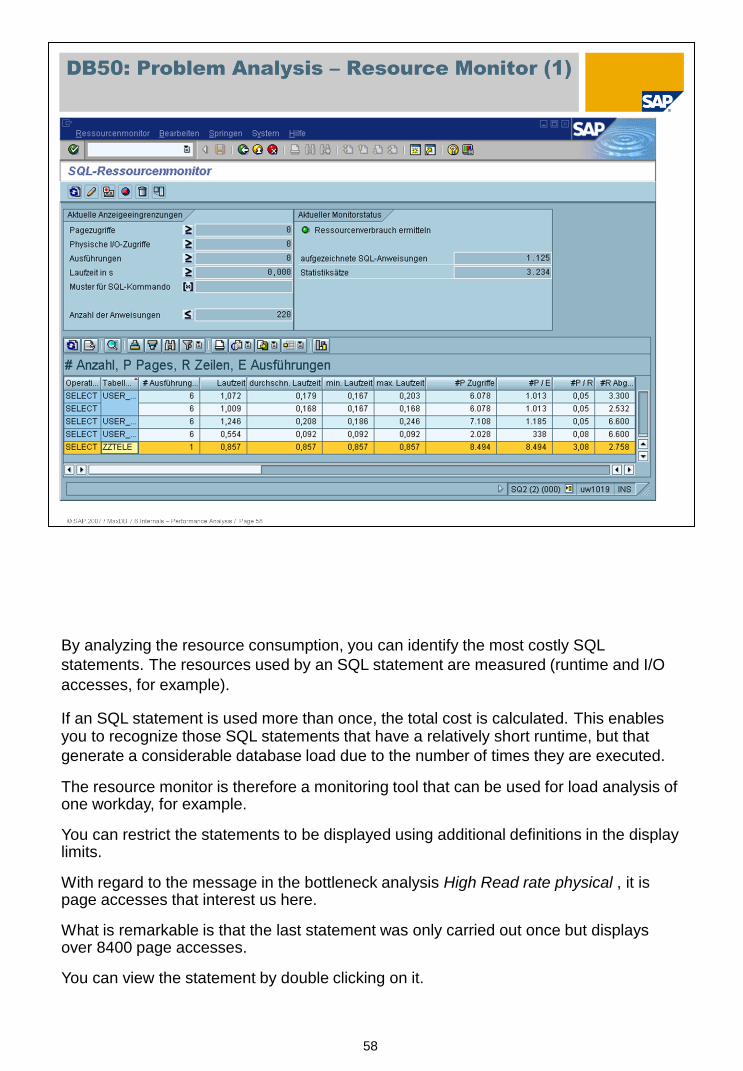
By analyzing the resource consumption, you can identify the most costly SQL
statements. The resources used by an SQL statement are measured (runtime and I/O
accesses, for example).
If an SQL statement is used more than once, the total cost is calculated. This enables you to recognize those SQL statements that have a relatively short runtime, but that
generate a considerable database load due to the number of times they are executed.
The resource monitor is therefore a monitoring tool that can be used for load analysis of one workday, for example.
You can restrict the statements to be displayed using additional definitions in the display limits.
With regard to the message in the bottleneck analysis High Read rate physical , it is page accesses that interest us here.
What is remarkable is that the last statement was only carried out once but displays over 8400 page accesses.
You can view the statement by double clicking on it.

59
Here we have a SELECT for table ZZTELE without a WHERE condition. Therefore all records of the table
are read.
In such a case, the application should be examined more closely to see whether all records of the table
are truly necessary for processing or whether using a WHERE condition as a limitation, the actual number
of records to be processed can be decreased.

60
Performance Tables
The tables SYSCMD_ANALYZE and SYSDATA_ANALYZE are generated and subsequently filled after
DIAGNOSE ANALYZE is activated.
Logging can be activated/deactivated with the following dbmcli command
dbmcli –n <SAP DB Hostname> -d <SID> -u control,control -uSQL sap<sid>,sap
sql_execute diagnose analyze on | off
During parsing, the commands are entered in SYSCMD_ANALYZE and a unique command key is
generated. Identical commands are stored only once for all concurrent sessions. Resource usage is not yet
determined.
Logging of resource usage can be activated/deactivated with the following dbmcli command
dbmcli –n <SAP DB Hostname> -d <SID> -u control,control -uSQL sap<sid>,sap
sql_execute diagnose analyze count on | off
Normal monitoring is required for this, that is, it is activated if necessary. The values are aggregated per
session under the command key in the table SYSDATA_ANALYZE.
Aggregation over several sessions must be done by the application via the command key.
The generated data can be deleted with the following dbmcli command
dbmcli –n <SAP DB Hostname> -d <SID> -u control,control -uSQL sap<sid>,sap
sql_execute diagnose analyze CLEAR COMMAND/DATA/ALL

61
As of version 7.5, MaxDB only requires statistics data for joins and selects with a
restriction of the number of records in the result, such as "WHERE ROWNUM <= n".
For the table itself, Update Statistics only determines the data if the current size
specifications are not in the file directory. This does not apply to tables that were
created with databases of version < 7.6 and for which the size specifications in the file
directory could not yet be determined.
Update Statistics determines statistics data for all columns that are primary keys or index
columns. Additionally, it determines the statistics data for all columns beyond the
primary key and index if statistics are already available.
If the optimizer discovers tables with unsuitable statistics data, it enters them in the table
SYSUPDSTATWANTED. The DBM command sql_updatestat_per_systemtable
executes an Update Statistics for all tables listed in SYSUPDSTATWANTED.
The DBM command sql_updatestat executes an Update Statistics for all tables in the
database.
Update Statistics imports the data for a table from all data volumes in parallel. This makes
it very speedy.
The programs "xpu" and "updcol" are no longer available as of version 7.6..
62
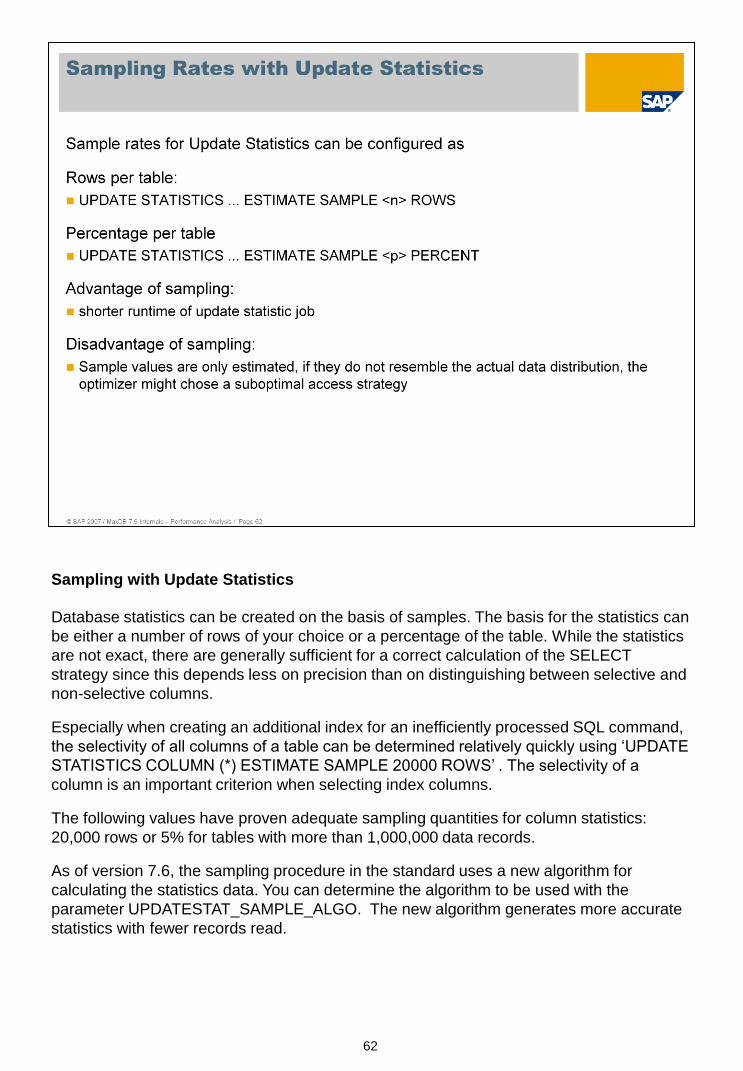
Sampling with Update Statistics
Database statistics can be created on the basis of samples. The basis for the statistics can
be either a number of rows of your choice or a percentage of the table. While the statistics
are not exact, there are generally sufficient for a correct calculation of the SELECT
strategy since this depends less on precision than on distinguishing between selective and
non-selective columns.
Especially when creating an additional index for an inefficiently processed SQL command,
the selectivity of all columns of a table can be determined relatively quickly using ‘UPDATE
STATISTICS COLUMN (*) ESTIMATE SAMPLE 20000 ROWS’ . The selectivity of a
column is an important criterion when selecting index columns.
The following values have proven adequate sampling quantities for column statistics:
20,000 rows or 5% for tables with more than 1,000,000 data records.
As of version 7.6, the sampling procedure in the standard uses a new algorithm for
calculating the statistics data. You can determine the algorithm to be used with the
parameter UPDATESTAT_SAMPLE_ALGO. The new algorithm generates more accurate
statistics with fewer records read.
63