Evaluation of dynamics | Gyroscope, Accelerometer, Inertia Measuring Unit and Kalman Filter
2168-2194 (c) 2018 IEEE. Personal use is permitted, but republication/redistribution requires IEEE permission. See http://www.ieee.org/publications_standards/publications/rights/index.html for more information.
This article has been accepted for publication in a future issue of this journal, but has not been fully edited. Content may change prior to final publication. Citation information: DOI 10.1109/JBHI.2019.2895775, IEEE Journal ofBiomedical and Health Informatics
JBHI-00785-2018
1
� Abstract— Objective: Systolic time intervals such as the pre-
ejection period (PEP) are important parameters for assessing cardiac contractility that can be measured non-invasively using seismocardiography (SCG). Recent studies have shown that specific points on accelerometer and gyroscope based SCG signals can be used for PEP estimation. However, the complex morphology and inter-subject variation of the SCG signal can make this assumption very challenging and increase the root mean squared error (RMSE) when these techniques are used to develop a global model. Methods: In this study, we compared gyroscope and accelerometer based SCG signals, individually and in combination, for estimating PEP to show the efficacy of these sensors in capturing valuable information regarding cardiovascular health. We extracted general time domain features from all the axes of these sensors and developed global models using various regression techniques. Results: In single axis comparison of gyroscope and accelerometer, angular velocity signal around head to foot axis from the gyroscope provided the lowest RMSE of 12.63r0.49 ms across all subjects. The best estimate of PEP, with a RMSE of 11.46±0.32 ms across all subjects, was achieved by combining features from the gyroscope and accelerometer. Our global model showed 30% lower RMSE when compared to algorithms used in recent literature. Conclusion: Gyroscopes can provide better PEP estimation compared to accelerometers located on the mid sternum. Global PEP estimation models can be improved by combining general time domain features from both sensors. Significance: This work can be used to develop low cost wearable heart monitoring device and to generate a universal estimation model for systolic time intervals using single or multiple sensor fusion.
Index Terms— Accelerometer, cardiovascular monitoring, ensemble regression, gyroscope, heart failure, seismocardiogram, sensor fusion, wearable sensors.
I. INTRODUCTION HE pre-ejection period (PEP) of the heart is defined as the time elapsed from the start of ventricular depolarization to the ensuing opening of the aortic valve, and is an
Research reported in this material is based on work supported by the
National Institutes of Health under Grant 1R01HL130619-A1 and the National Center for Advancing Translational Sciences of the National Institutes of Health under Award Number UL1TR002378.
M.M.H. Shandhi, B. Semiz, S. Hersek, N. Goller, F. Ayazi and O. T. Inan are with the School of Electrical and Computer Engineering at the Georgia Institute of Technology, Atlanta, GA 30332 USA (correspondence e-mail: [email protected]).
important parameter for assessing cardiac health outside of clinical settings [1-3]. In particular, the changes in PEP resulting from exercise stressors can provide insight into the ability of the heart to respond appropriately to increased sympathetic nervous system activity and increased demand for blood flow to the muscles. An important recent finding was that the clinical status of patients with heart failure (HF) – a disorder in which the heart is unable to supply enough blood to meet the demands of the body – could be assessed using SCG (and PEP) responses to exercise measured with a wearable sensing system [4-6].
The wearable system used for that study facilitates computation of PEP from electrocardiogram (ECG) and seismocardiogram (SCG) signals [7]. The Q- or R-wave of the ECG signal provides the timing information required for detecting the depolarization of the ventricles (the start of the PEP interval); the Ao “peak” on the SCG signal provides the corresponding timing for the aortic valve opening (AVO) (the end of the PEP interval) [8]. In this system, the ECG is measured using three adhesive-backed gel (Ag/AgCl) electrodes, and the SCG is measured using a low-noise, tri-axial micro-electromechanical systems (MEMS) based accelerometer positioned at the middle of the sternum.
Though promising results have been obtained with this system both in healthy subjects and in patients with HF, there are sensing and data analytics advancements that can potentially improve the accuracy with which PEP is measured. First, recent work has shown that gyroscope based measurements of chest wall vibrations may provide improved detection of heart and blood movement activity as compared to accelerometers [9-11]. A rigorous investigation is needed comparing gyroscope and accelerometer based SCG waveforms and the corresponding accuracy with which PEP can be extracted. Second, while the opening of aortic valve may be readily detectable from SCG signals in supine subjects, high inter-subject variability in SCG waveforms renders Ao peak detection inaccurate and ambiguous in many subjects standing upright or walking. Novel machine learning approaches for combining multiple features of gyroscope, accelerometer, and combined gyroscope and accelerometer based SCG measurements can be employed to address this limitation.
In this paper we perform, for the first time, a rigorous investigation of gyroscope and accelerometer based SCG measurement in the context of PEP detection accuracy. We
Performance Analysis of Gyroscope and Accelerometer Sensors for Seismocardiography-Based Wearable Pre-Ejection Period Estimation
Md Mobashir Hasan Shandhi, Student Member, IEEE, Beren Semiz, Sinan Hersek, Nazli Goller, Farrokh Ayazi, Fellow, IEEE, and Omer T. Inan, Senior Member, IEEE
T
2168-2194 (c) 2018 IEEE. Personal use is permitted, but republication/redistribution requires IEEE permission. See http://www.ieee.org/publications_standards/publications/rights/index.html for more information.
This article has been accepted for publication in a future issue of this journal, but has not been fully edited. Content may change prior to final publication. Citation information: DOI 10.1109/JBHI.2019.2895775, IEEE Journal ofBiomedical and Health Informatics
JBHI-00785-2018
2
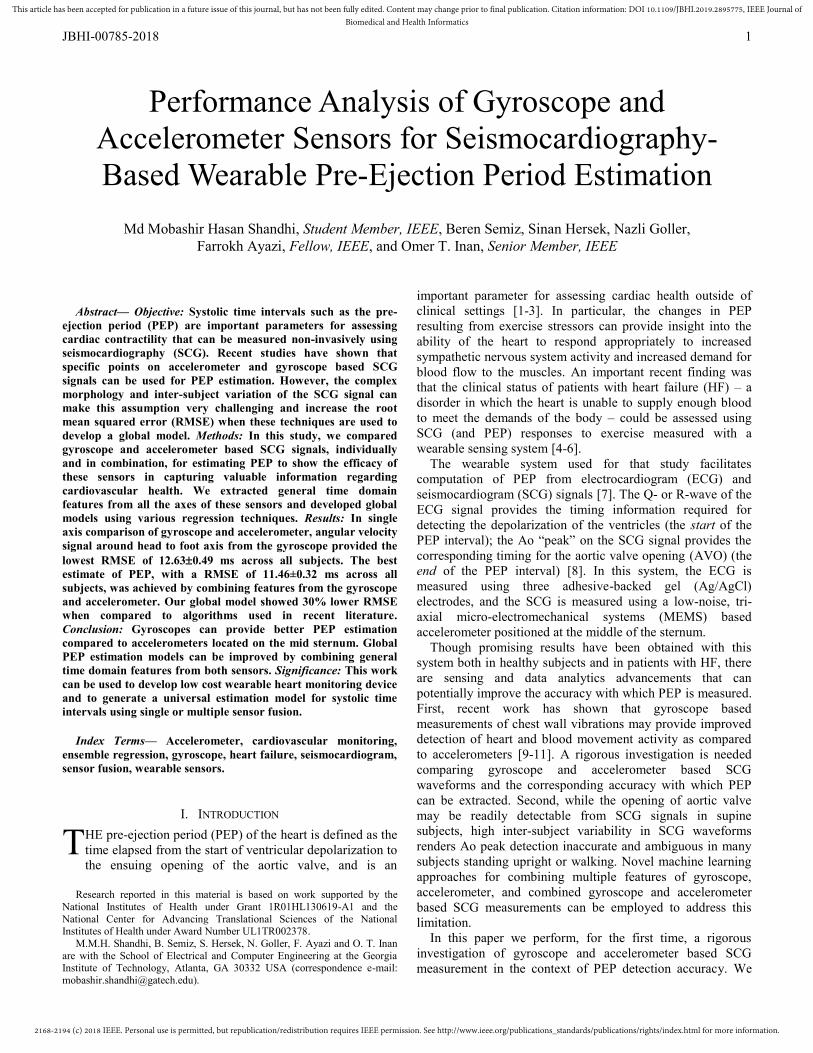
use a low-noise MEMS gyroscope with sufficiently wide bandwidth to facilitate SCG measurement. We further leverage state-of-the-art nonlinear and linear regression algorithms [12, 13] to map features of the SCG signal to AVO, as detected by a reference standard signal—the impedance cardiogram (ICG) [14, 15]. In addition to single axis based estimates, we evaluate multi-axis and multi-sensor fusion approaches to assess the possible corresponding improvement in PEP estimation. Finally, we compare our PEP estimation approaches directly against several methods from the existing literature. Fig. 1 shows a hypothetical system to estimate systolic timing intervals from wearable sensors’ fusion using our estimation method.
II. METHODS
A. Experimental Protocol The study was conducted under a protocol approved by the
Georgia Institute of Technology Institutional Review Board. A total of 17 healthy subjects (7 females and 10 males) participated in the study (Age: 26.1r4.1 years, Weight: 66.2r13.6 kg and Height: 168.2r8.9 cm). All subjects provided written informed consent before experimentation and reported no heart problems.
The purpose of the protocol was to induce changes in PEP non-invasively, and to then measure PEP with a reference standard (ICG) simultaneously with different sensors under test. Regression algorithms were then applied to compare the PEP estimation accuracy for these sensors under test compared to the reference standard. Exercise was selected as the means by which PEP was modulated non-invasively
because it is known to change PEP substantially from the resting value in a relatively short period of time.
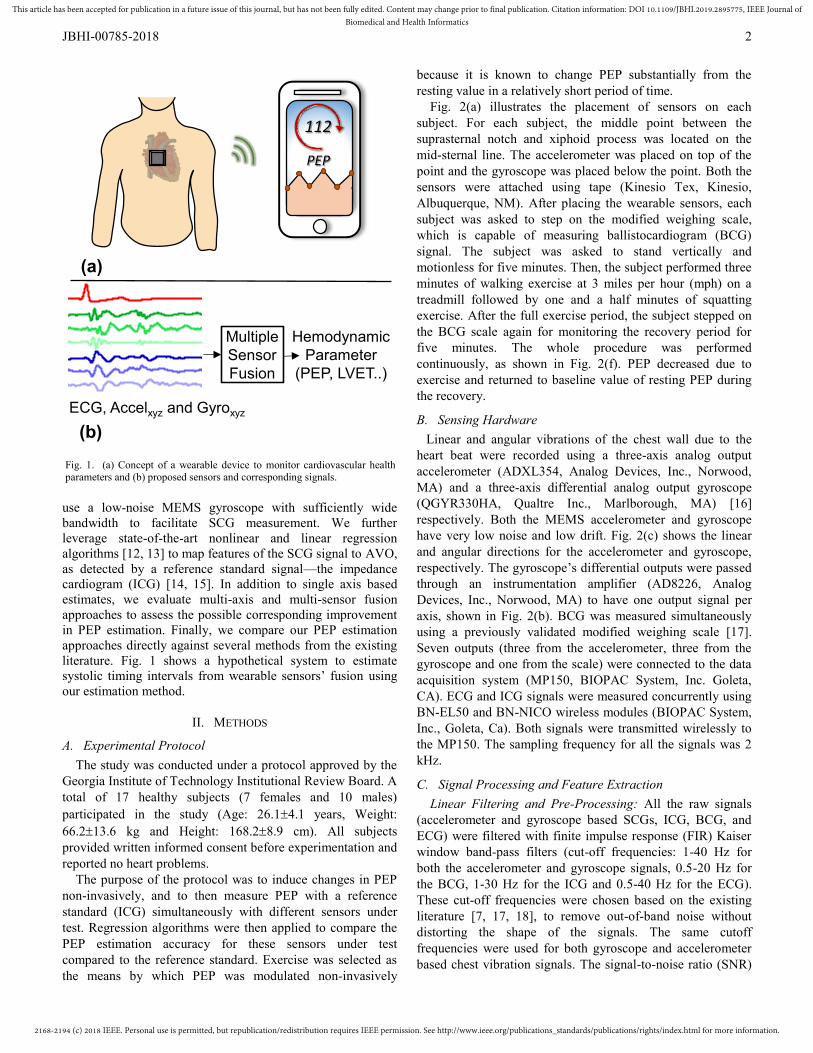
Fig. 2(a) illustrates the placement of sensors on each subject. For each subject, the middle point between the suprasternal notch and xiphoid process was located on the mid-sternal line. The accelerometer was placed on top of the point and the gyroscope was placed below the point. Both the sensors were attached using tape (Kinesio Tex, Kinesio, Albuquerque, NM). After placing the wearable sensors, each subject was asked to step on the modified weighing scale, which is capable of measuring ballistocardiogram (BCG) signal. The subject was asked to stand vertically and motionless for five minutes. Then, the subject performed three minutes of walking exercise at 3 miles per hour (mph) on a treadmill followed by one and a half minutes of squatting exercise. After the full exercise period, the subject stepped on the BCG scale again for monitoring the recovery period for five minutes. The whole procedure was performed continuously, as shown in Fig. 2(f). PEP decreased due to exercise and returned to baseline value of resting PEP during the recovery.
B. Sensing Hardware Linear and angular vibrations of the chest wall due to the
heart beat were recorded using a three-axis analog output accelerometer (ADXL354, Analog Devices, Inc., Norwood, MA) and a three-axis differential analog output gyroscope (QGYR330HA, Qualtre Inc., Marlborough, MA) [16] respectively. Both the MEMS accelerometer and gyroscope have very low noise and low drift. Fig. 2(c) shows the linear and angular directions for the accelerometer and gyroscope, respectively. The gyroscope’s differential outputs were passed through an instrumentation amplifier (AD8226, Analog Devices, Inc., Norwood, MA) to have one output signal per axis, shown in Fig. 2(b). BCG was measured simultaneously using a previously validated modified weighing scale [17]. Seven outputs (three from the accelerometer, three from the gyroscope and one from the scale) were connected to the data acquisition system (MP150, BIOPAC System, Inc. Goleta, CA). ECG and ICG signals were measured concurrently using BN-EL50 and BN-NICO wireless modules (BIOPAC System, Inc., Goleta, Ca). Both signals were transmitted wirelessly to the MP150. The sampling frequency for all the signals was 2 kHz.
C. Signal Processing and Feature Extraction Linear Filtering and Pre-Processing: All the raw signals
(accelerometer and gyroscope based SCGs, ICG, BCG, and ECG) were filtered with finite impulse response (FIR) Kaiser window band-pass filters (cut-off frequencies: 1-40 Hz for both the accelerometer and gyroscope signals, 0.5-20 Hz for the BCG, 1-30 Hz for the ICG and 0.5-40 Hz for the ECG). These cut-off frequencies were chosen based on the existing literature [7, 17, 18], to remove out-of-band noise without distorting the shape of the signals. The same cutoff frequencies were used for both gyroscope and accelerometer based chest vibration signals. The signal-to-noise ratio (SNR)
PEP
(a)
Multiple Sensor Fusion
112
(b)
Hemodynamic Parameter
(PEP, LVET..)
ECG, Accelxyz and Gyroxyz
Fig. 1. (a) Concept of a wearable device to monitor cardiovascular health parameters and (b) proposed sensors and corresponding signals.
2168-2194 (c) 2018 IEEE. Personal use is permitted, but republication/redistribution requires IEEE permission. See http://www.ieee.org/publications_standards/publications/rights/index.html for more information.
This article has been accepted for publication in a future issue of this journal, but has not been fully edited. Content may change prior to final publication. Citation information: DOI 10.1109/JBHI.2019.2895775, IEEE Journal ofBiomedical and Health Informatics
JBHI-00785-2018
3
of the ECG was found to be very poor for one of the subjects due to hardware issues, therefore data from this subject was discarded and data from the other 16 subjects were used for further processing and analysis.
As most physiological measurements are corrupted by motion artifact during exercise, which typically leads to higher noise, the signals recorded during exercise were discarded. Since the goal of this analysis was to determine which features
ECG Electrodes
ICG Current Electrodes
ICG Voltage Electrodes
R-peak Detection
Feature Extraction (Ensemble Average
and B point detection)
Median Filter
R-peak Detection
Feature Extraction
Gyro X+
Gyro X-
+-
Gyro X signal
3 Axis Accelerometer
3 Axis Gyroscope
BCG Scale
(a)
Instrumentation Amplifier AD8226
(b)
Recovery (5 min)
Squats(1.5 min)
Walking (3 min)
Rest (5 min)
(d)
(e)
(f)
Regression Model
Median Filter
EstimatedPEP
Gold Standard PEP
PE
P
ECG
ICG(
Time (minutes)
Z (Dorso-ventral)
Y (Lateral)
X (Head to Foot)
ECG
Accel and Gyro
Fig. 2. (a) The experimental setup with the subject standing on the BCG scale, with all other wearable sensors attached to the body. One accelerometer (ADXL354) and one gyroscope (QGYR330HA) are placed on the mid sternum. ECG and ICG signals are collected simultaneously. (b) Circuit connection for the conversion of differential output of the gyroscope to single output per axis, using an instrumentational amplifier (AD8226). (c) Axis labels used for the accelerometer and gyroscope, with accelerometer X axis in the head to foot direction, Y axis in the side to side (lateral) direction and Z axis in the dorso-ventral direction. Gyroscope X axis angular velocity corresponds to the rotation around head to foot axis, Y axis angular velocity corresponds to the rotation around frontal axis and Z axis angular velocity corresponds to the rotation around sagittal axis. (d) Block diagram of the segmentation for ICG signal with reference R peaks from the corresponding ECG signal, feature extraction from the ICG segments to calculate ground truth PEP. (e) Block diagram of the segmentation for accelerometer and gyroscope signals with reference R peaks from corresponding ECG signal, feature extraction from the segments to estimate PEP. (f) PEP trend with the chronology of the experiment, 5-minute rest standing on BCG scale, 3-minute walk at 3 miles per hour speed, 1.5-minute of squats and 5-minute post exercise standing on the scale. PEP remains fairly stable during the rest period, it decreases due to exercise, and returns nearly to the baseline rest values during the recovery period.
2168-2194 (c) 2018 IEEE. Personal use is permitted, but republication/redistribution requires IEEE permission. See http://www.ieee.org/publications_standards/publications/rights/index.html for more information.
This article has been accepted for publication in a future issue of this journal, but has not been fully edited. Content may change prior to final publication. Citation information: DOI 10.1109/JBHI.2019.2895775, IEEE Journal ofBiomedical and Health Informatics
JBHI-00785-2018
4
of SCG (accelerometer and gyroscope) signals were most salient in PEP estimation, we decided rather to use only the cleaner portions of the datasets – those corresponding to the initial 5-minute resting and 5-minute post-exercise recovery data. The signal processing and feature extraction were performed in Matlab 2017b with a Macbook Pro Laptop with Core i5 dual core processor and 16 GB of RAM and required approximately 54 minutes of processing time.
Ensemble Averaging: The R-wave peaks were detected on the ECG signal and all the other signals (SCG, BCG, and ICG) were segmented into individual heartbeat frames using the R peaks from the corresponding ECG signals, with a frame length equal to the minimum R-to-R interval. With frame length equal to the minimum R-to-R interval, one frame contained at a maximum one heartbeat by definition. In other cases, one frame contained less than one heartbeat. Multiple frames were ensemble averaged to get averaged frames, which reduced noise [19]. Five frames were averaged together to generate an ensemble averaged frame, with an overlap of four frames between consecutive ensemble averages. This technique of averaging was used to maximize the number of ensemble averaged frames, with a total of 13,993 heartbeat frames from 16 subjects.
Feature Extraction from ICG and BCG: The B-point and X-point of the ICG (dz/dt) frames, were extracted based on [20]. The B-point was then used as the reference standard AVO, and the ground truth PEP was obtained via calculating the R-B interval for every ensemble average frames. A high level block diagram of this process is shown in Fig. 2(d). The X-point of the ICG corresponds to the aortic valve closing (AVC). For BCG frames, I, J and K peaks were extracted following the work of Inan et al. [17].
Feature Extraction from SCG: For the accelerometer and gyroscope signals, initially we extracted and analyzed different time domain, amplitude and frequency domain features. Time domain features performed better in PEP estimation compared to amplitude and frequency domain features as PEP itself is a time domain parameter. A total of 12 time domain features were chosen for detailed analysis in this paper. These 12 features per axis were extracted from each averaged frame by an automated algorithm and every frame was visually checked to maintain the accuracy of the feature extraction. Features extracted were as follows: largest and second largest maxima locations (0-250 ms), largest and second largest maxima width (0-250 ms), largest and second largest minima location (0-250 ms), largest and second largest minima width (0-250 ms), largest maxima location (250-500 ms), largest maxima width (250-500 ms), largest minima location (250-500 ms), largest minima width (250-500 ms). Peaks and valleys in the frame were ranked according to their amplitudes, and the highest and second highest amplitude were used as the largest and second largest maxima or minima accordingly. Location was calculated as the distance from the corresponding R-peak in ms. Width was calculated as the width of the peak or valley at half-prominence, in ms. We extracted eight timing features from the systolic portion of the signal (0-250 ms) rather than putting emphasis on one location
feature, to explore how multiple points in the accelerometer and gyroscope signals are related to the AVO. Although PEP is related to the timing features from the systolic portion of the signals, we decided to explore features from the diastolic portion (250-500 ms) of the signals as well and we have extracted four timing features from the diastolic portion of the signals.
D. Regression Models Overall Framework: We trained a regression model to
estimate the PEP using the features extracted from the accelerometer and gyroscope signals described in Section II.C. For every axis, M features were extracted from N ensemble averages. These features were placed in an MNu matrix A while the corresponding PEP values were placed in an
1uN vector bPEP. A regression model was trained on these to learn the relationship between A and bPEP. Resulted trained model can then be used to estimate PEP for new heartbeat frames, from the features extracted from the accelerometer or gyroscope signals. Fig. 2(e) shows the high level block diagram of the feature extraction and regression on the accelerometer and gyroscope signals to estimate the PEP. The machine learning techniques, including various regression models, were performed using Python 3.6 with the same laptop described in Section II.C. It required approximately 20 to 60 minutes of processing time for different regression techniques based on the parameters and features used. XGBoost Regression: The majority of the research on SCG to estimate hemodynamic parameters used conventional linear regression to relate the features from SCG to the estimated parameter [11, 18, 21-23], with the underlying assumption that the relationships are linear. However, the relationship between PEP and SCG features may not be linear as is the case in most real data sets. That is, if we let Y represent PEP as a random variable and X represent one of our features, it is unlikely that f(X)=E(Y|X) would be a linear function in X [24]. Our aim was to evaluate whether a non-linear model performs better in estimating PEP compared to the standard linear models. Therefore, rather than using only linear techniques, we leveraged Extreme Gradient Boosting (XGBoost) regression, which is a relatively new machine learning algorithm that has recently gained popularity [13]. XGBoost is a computationally efficient implementation of the gradient boosting machine learning algorithm [25], and is an example of an ensemble method, combining multiple estimators to predict a variable rather than using a single estimator [26]. It generates multiple regression trees where errors from previous models are predicted by new models and are then added together. It uses a gradient descent algorithm for this addition to minimize the loss and these sequential additions are carried out until no further improvements can be made.
We used XGBoost regression (with hyper-parameter settings: learning rate=0.1, number of boosting rounds=200, column sampling factor=0.5, row sampling factor=0.5, regularization parameter (λ)=1) to estimate PEP using features extracted from different axes of the accelerometer and gyroscope based SCG signals and combination of multiple axes from the same sensor or both the sensors. Estimated PEPs
2168-2194 (c) 2018 IEEE. Personal use is permitted, but republication/redistribution requires IEEE permission. See http://www.ieee.org/publications_standards/publications/rights/index.html for more information.
This article has been accepted for publication in a future issue of this journal, but has not been fully edited. Content may change prior to final publication. Citation information: DOI 10.1109/JBHI.2019.2895775, IEEE Journal ofBiomedical and Health Informatics
JBHI-00785-2018
5
from different axes and from different combinations of axes and sensors were compared using a variation of the repeated cross-validation model assessment method discussed in [27].
Cross-Validation and Regression Model Evaluation: We first randomly paired the subjects in our dataset, which consists of 16 subjects, into eight groups. We then performed cross-validation by leaving one group (two subjects) out at each fold and trained an XGBoost regressor on the data from all subjects except the two that were left out. We then predicted PEP for the left-out subjects and repeated this seven more times leaving a different pair of subjects out each time. As a result, we have PEP predictions for all ensembles from all subjects. The root mean squared error (RMSE) was then calculated between the estimated PEP values ( ) and the ground truth PEP acquired from the ICG signals ( ):
(1)
where N=13,993, the number of ensemble average frames from 16 subjects. We used leave-two-out cross validation over leave-one-out cross validation to have more variation in the training sets, and did not have enough subjects to leave more subjects out in the cross-validation steps. We repeated the entire process 50 times with a new random pairing of subjects
each time. The cross-validation RMSE was calculated as the average of the RMSE scores from 50 repetitions. In this way, we trained a global model rather than multiple subject-specific models.
Regression for Multiple Axes: This approach was repeated for different axes of the accelerometer and gyroscope and their combination, and we compared the resulting RMSE scores. For the combination of multiple axes from the same or different sensors, features from a pair of axes or multiple axes were combined using vector concatenation and were fed into regressors. The same cross-validation procedure was used to compute the RMSE. We performed statistical analysis of the cross-validation results for single and multiple axes comparisons.
Regression for BCG Signals: Three features (R-J interval, R-I interval and R-K interval) from the ensemble averaged BCG frames were also used in similar fashion to develop another global model following the same cross-validation step stated above, to estimate PEP. Average RMSE from this model gave us the comparison between wearable sensors to the scale based cardiac hemodynamics monitoring.
E. Feature Importance Evaluation To generate global models of PEP estimation from the accelerometer and gyroscope signals, we trained XGBoost
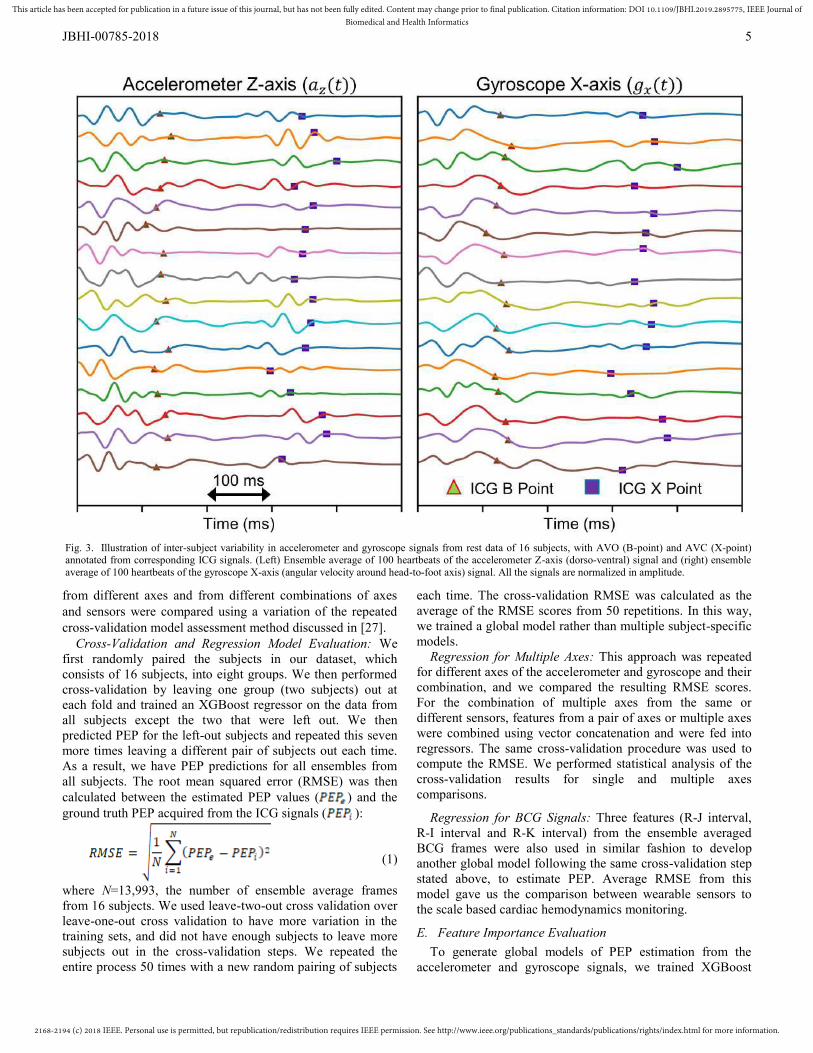
Fig. 3. Illustration of inter-subject variability in accelerometer and gyroscope signals from rest data of 16 subjects, with AVO (B-point) and AVC (X-point) annotated from corresponding ICG signals. (Left) Ensemble average of 100 heartbeats of the accelerometer Z-axis (dorso-ventral) signal and (right) ensemble average of 100 heartbeats of the gyroscope X-axis (angular velocity around head-to-foot axis) signal. All the signals are normalized in amplitude.
2168-2194 (c) 2018 IEEE. Personal use is permitted, but republication/redistribution requires IEEE permission. See http://www.ieee.org/publications_standards/publications/rights/index.html for more information.
This article has been accepted for publication in a future issue of this journal, but has not been fully edited. Content may change prior to final publication. Citation information: DOI 10.1109/JBHI.2019.2895775, IEEE Journal ofBiomedical and Health Informatics
JBHI-00785-2018
6
regressors using many features acquired from one or multiple axes from one or both of the sensors. However, some of these features are more relevant to PEP estimation than others. One advantage of using XGBoost (and other gradient boosting methods) is that, it can provide feature importance estimates from a trained predictive model. This importance indicates how useful each feature is in constructing the boosted decision trees within the model [28]. Typically, the main node of a tree is divided based on the most important feature whereas the deep nodes are divided based on less important features. The feature importance values obtained from all of the decision trees within the model are averaged to get the final relative feature importance scores. These scores can be used to rank the features. To evaluate which features generated from the accelerometer and gyroscope based SCG signals contributed more to PEP estimation, we trained an XGBoost regressor on the combination data set from all 16 subjects, with features from all the axes of the gyroscope and accelerometer. The resulting regression model was then used to generate relative feature importance scores as described above.
F. Comparing Our Estimation with Existing Literature We compared our PEP estimation method with recent PEP
estimation methods used in literature, where the researchers annotated specific points in the accelerometer and gyroscope signals using ECG as a reference signal and found those points to be well correlated with the AVO [9, 11, 29, 30]. Tadi et al. [29] and Javaid et al. [30] used a fixed length window of 90 and 200 ms respectively from ECG R peaks to find the AVO points in the dorso-ventral SCG. Yang et al. showed that the maximum peak of the envelope of rotational energy, calculated from the gyroscope signal, is close to the isovolumic moment (IM) of the accelerometer signal, where IM is the minima immediately before AVO in the accelerometer based dorso-ventral SCG signal [9]. Tadi et al. annotated the major maximum peak in angular velocity around the head-to-foot axis (from the gyroscope signal) as AVO and found strong correlation between the time interval between this point and corresponding ECG R-peak with PEP from echocardiography [11]. We have used the aforementioned algorithms to find AVO from the ensemble average heartbeat frames of corresponding accelerometer and gyroscope signals, in our dataset. We have used the same cross-validation method, described in Section II.E and calculated RMSE for each method to compare to our methods.
G. Statistical Analysis We performed statistical analysis on the cross-validated
RMSE results to compare different axes and combination of axes. In our cross-validation procedure which consisted of 50 repetitions, the random seed was fixed so that the subjects were paired in the same way in the ith repetition, for all sensor axes/combinations. Multiple comparison tests were performed on the RMSE results from the 50 repetitions to compare different axes and sensor combinations. The Friedman test was performed to detect statistical differences if exist and the Wilcoxon signed rank test was performed for post-hoc testing,
on different axes or combinations. Additionally, for the post-hoc testing Benjamini-Hochberg correction for multiple comparison was performed on the p-value. Details on these statistical tests and the reasons behind their use are discussed in [31]. We performed similar procedure to compare different regression techniques and to compare our method with different algorithms from recent literature statistically. In this work, p-values below 0.05 were considered statistically significant.
III. RESULTS AND DISCUSSION
A. Intersubject Variability A visual comparison of the complex nature and intersubject
variation in signals from both the accelerometer and gyroscope is shown in Fig. 3. AVO and AVC points, extracted from corresponding ICG signals, are marked on these signals, demonstrating that the AVO and AVC may not always correspond to specific points or patterns on the accelerometer or gyroscope signal, as often stated in existing literature. Estimation of systolic timing intervals based on this assumption might be error-prone and may work on a specific data set or subject, but not for a global model.
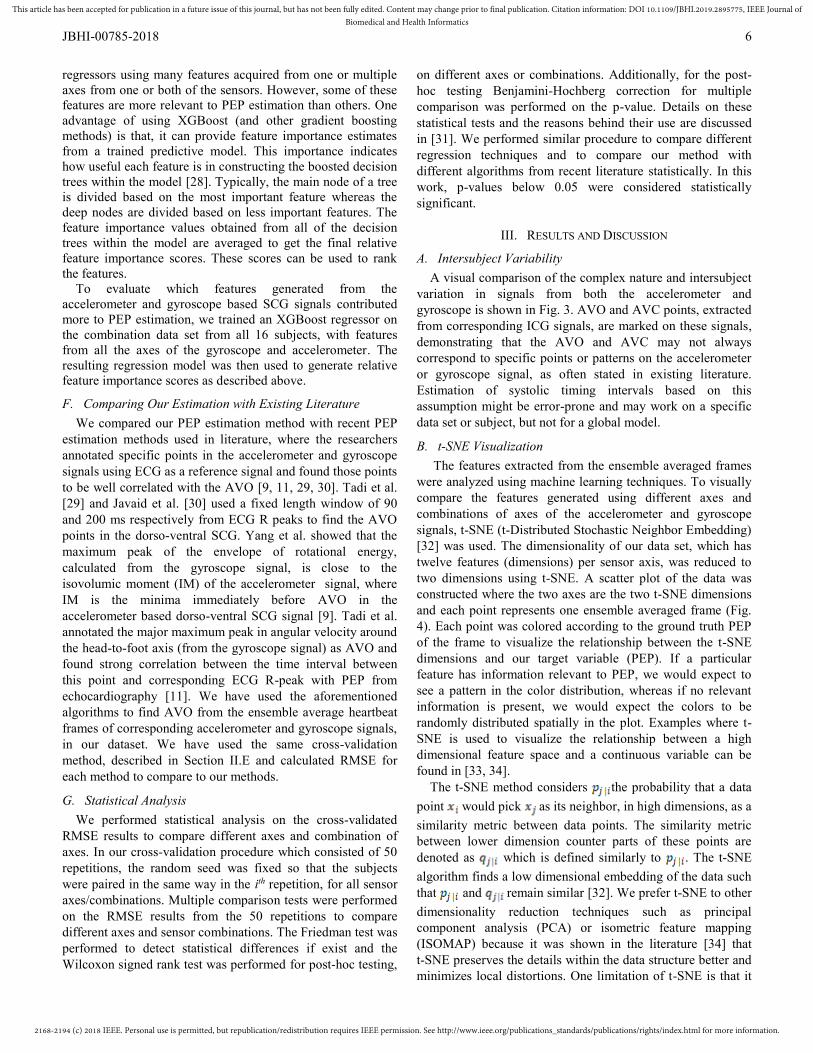
B. t-SNE Visualization The features extracted from the ensemble averaged frames
were analyzed using machine learning techniques. To visually compare the features generated using different axes and combinations of axes of the accelerometer and gyroscope signals, t-SNE (t-Distributed Stochastic Neighbor Embedding) [32] was used. The dimensionality of our data set, which has twelve features (dimensions) per sensor axis, was reduced to two dimensions using t-SNE. A scatter plot of the data was constructed where the two axes are the two t-SNE dimensions and each point represents one ensemble averaged frame (Fig. 4). Each point was colored according to the ground truth PEP of the frame to visualize the relationship between the t-SNE dimensions and our target variable (PEP). If a particular feature has information relevant to PEP, we would expect to see a pattern in the color distribution, whereas if no relevant information is present, we would expect the colors to be randomly distributed spatially in the plot. Examples where t-SNE is used to visualize the relationship between a high dimensional feature space and a continuous variable can be found in [33, 34].
The t-SNE method considers the probability that a data point would pick as its neighbor, in high dimensions, as a similarity metric between data points. The similarity metric between lower dimension counter parts of these points are denoted as which is defined similarly to . The t-SNE algorithm finds a low dimensional embedding of the data such that and remain similar [32]. We prefer t-SNE to other dimensionality reduction techniques such as principal component analysis (PCA) or isometric feature mapping (ISOMAP) because it was shown in the literature [34] that t-SNE preserves the details within the data structure better and minimizes local distortions. One limitation of t-SNE is that it
2168-2194 (c) 2018 IEEE. Personal use is permitted, but republication/redistribution requires IEEE permission. See http://www.ieee.org/publications_standards/publications/rights/index.html for more information.
This article has been accepted for publication in a future issue of this journal, but has not been fully edited. Content may change prior to final publication. Citation information: DOI 10.1109/JBHI.2019.2895775, IEEE Journal ofBiomedical and Health Informatics
JBHI-00785-2018
7
has computational complexity that is quadratic in the number of data points. To reduce computational time, our data points were down-sampled by a factor of three from 13,993 points to 4,664 points, which is sufficient for the purpose of t-SNE visualization.
Fig. 4 is showing the visual comparison among features from a single or combination of axes from the gyroscope and accelerometer with our target variable PEP. Features from scale-based BCG are also shown in the figure to compare the wearable sensor with the scale-based BCG. In case of the accelerometer and gyroscope, each data point corresponds to all the features (12, 24 or 48 based on number of axes used) collected from the ensemble averaged frames. In case of BCG
each point corresponds to three features, extracted from the ensemble average frames of BCG. These multiple dimensions (features) of data were reduced to two using t-SNE. Clear transition in the color pattern in the plots for the combination of axes over random nature in the color pattern for the single axis (both in the gyroscope and accelerometer) suggests that it is better to combine and use features from multiple axes in estimating PEP than using one axis only. While BCG is showing the best gradient in the color pattern, a combination of features from x and z axes of the accelerometer and x and y axes of the gyroscope is showing a color pattern which is the closest (compared to other four plots for single axis or pair of axes) to BCG.
C. Comparison and Combination of Accelerometer and Gyroscope
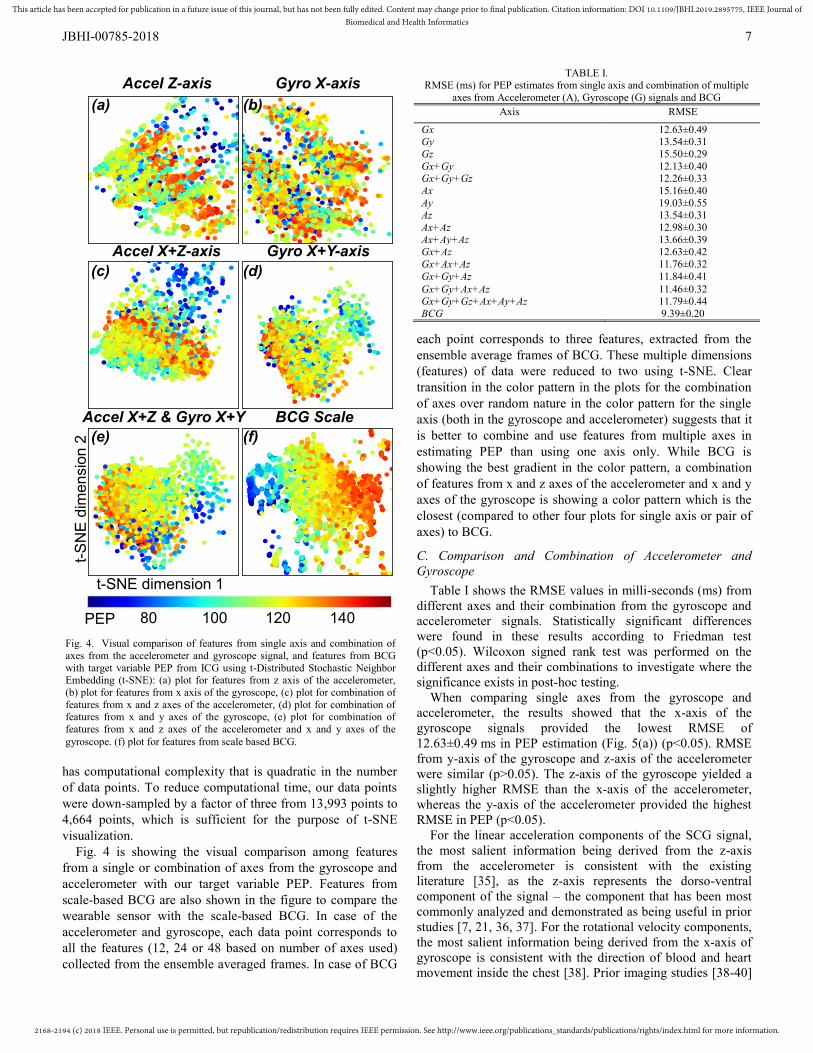
Table I shows the RMSE values in milli-seconds (ms) from different axes and their combination from the gyroscope and accelerometer signals. Statistically significant differences were found in these results according to Friedman test (p<0.05). Wilcoxon signed rank test was performed on the different axes and their combinations to investigate where the significance exists in post-hoc testing.
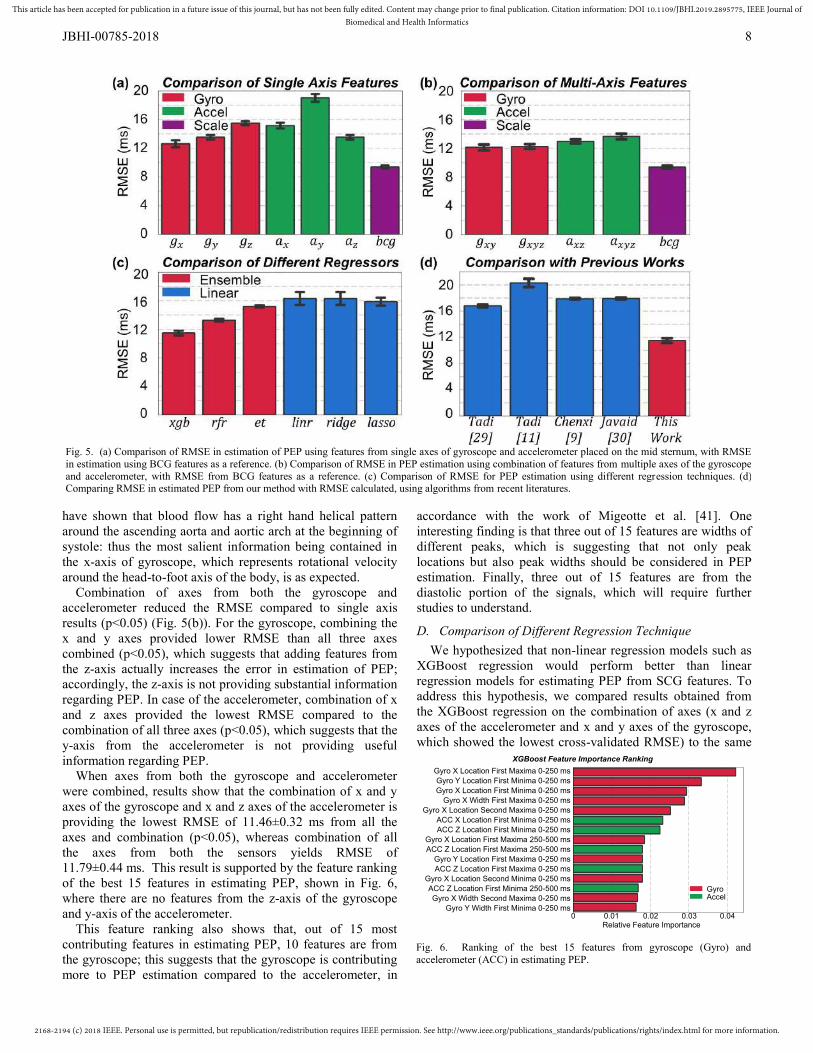
When comparing single axes from the gyroscope and accelerometer, the results showed that the x-axis of the gyroscope signals provided the lowest RMSE of 12.63±0.49 ms in PEP estimation (Fig. 5(a)) (p<0.05). RMSE from y-axis of the gyroscope and z-axis of the accelerometer were similar (p>0.05). The z-axis of the gyroscope yielded a slightly higher RMSE than the x-axis of the accelerometer, whereas the y-axis of the accelerometer provided the highest RMSE in PEP (p<0.05).
For the linear acceleration components of the SCG signal, the most salient information being derived from the z-axis from the accelerometer is consistent with the existing literature [35], as the z-axis represents the dorso-ventral component of the signal – the component that has been most commonly analyzed and demonstrated as being useful in prior studies [7, 21, 36, 37]. For the rotational velocity components, the most salient information being derived from the x-axis of gyroscope is consistent with the direction of blood and heart movement inside the chest [38]. Prior imaging studies [38-40]
Accel Z-axis Gyro X-axis
Accel X+Z-axis Gyro X+Y-axis
Accel X+Z & Gyro X+Y BCG Scale
PEP 14012010080
t-SNE dimension 1
t-SN
E d
imen
sion
2(a) (b)
(c) (d)
(e) (f)
Fig. 4. Visual comparison of features from single axis and combination of axes from the accelerometer and gyroscope signal, and features from BCG with target variable PEP from ICG using t-Distributed Stochastic Neighbor Embedding (t-SNE): (a) plot for features from z axis of the accelerometer, (b) plot for features from x axis of the gyroscope, (c) plot for combination of features from x and z axes of the accelerometer, (d) plot for combination of features from x and y axes of the gyroscope, (e) plot for combination of features from x and z axes of the accelerometer and x and y axes of the gyroscope. (f) plot for features from scale based BCG.
TABLE I. RMSE (ms) for PEP estimates from single axis and combination of multiple
axes from Accelerometer (A), Gyroscope (G) signals and BCG Axis RMSE
Gx 12.63±0.49 Gy 13.54±0.31 Gz 15.50±0.29 Gx+Gy 12.13±0.40 Gx+Gy+Gz 12.26±0.33 Ax 15.16±0.40 Ay 19.03±0.55 Az 13.54±0.31 Ax+Az 12.98±0.30 Ax+Ay+Az 13.66±0.39 Gx+Az 12.63±0.42 Gx+Ax+Az 11.76±0.32 Gx+Gy+Az 11.84±0.41 Gx+Gy+Ax+Az 11.46±0.32 Gx+Gy+Gz+Ax+Ay+Az BCG
11.79±0.44 9.39±0.20
2168-2194 (c) 2018 IEEE. Personal use is permitted, but republication/redistribution requires IEEE permission. See http://www.ieee.org/publications_standards/publications/rights/index.html for more information.
This article has been accepted for publication in a future issue of this journal, but has not been fully edited. Content may change prior to final publication. Citation information: DOI 10.1109/JBHI.2019.2895775, IEEE Journal ofBiomedical and Health Informatics
JBHI-00785-2018
8
have shown that blood flow has a right hand helical pattern around the ascending aorta and aortic arch at the beginning of systole: thus the most salient information being contained in the x-axis of gyroscope, which represents rotational velocity around the head-to-foot axis of the body, is as expected.
Combination of axes from both the gyroscope and accelerometer reduced the RMSE compared to single axis results (p<0.05) (Fig. 5(b)). For the gyroscope, combining the x and y axes provided lower RMSE than all three axes combined (p<0.05), which suggests that adding features from the z-axis actually increases the error in estimation of PEP; accordingly, the z-axis is not providing substantial information regarding PEP. In case of the accelerometer, combination of x and z axes provided the lowest RMSE compared to the combination of all three axes (p<0.05), which suggests that the y-axis from the accelerometer is not providing useful information regarding PEP.
When axes from both the gyroscope and accelerometer were combined, results show that the combination of x and y axes of the gyroscope and x and z axes of the accelerometer is providing the lowest RMSE of 11.46±0.32 ms from all the axes and combination (p<0.05), whereas combination of all the axes from both the sensors yields RMSE of 11.79±0.44 ms. This result is supported by the feature ranking of the best 15 features in estimating PEP, shown in Fig. 6, where there are no features from the z-axis of the gyroscope and y-axis of the accelerometer.
This feature ranking also shows that, out of 15 most contributing features in estimating PEP, 10 features are from the gyroscope; this suggests that the gyroscope is contributing more to PEP estimation compared to the accelerometer, in
accordance with the work of Migeotte et al. [41]. One interesting finding is that three out of 15 features are widths of different peaks, which is suggesting that not only peak locations but also peak widths should be considered in PEP estimation. Finally, three out of 15 features are from the diastolic portion of the signals, which will require further studies to understand.
D. Comparison of Different Regression Technique We hypothesized that non-linear regression models such as XGBoost regression would perform better than linear regression models for estimating PEP from SCG features. To address this hypothesis, we compared results obtained from the XGBoost regression on the combination of axes (x and z axes of the accelerometer and x and y axes of the gyroscope, which showed the lowest cross-validated RMSE) to the same
Fig. 5. (a) Comparison of RMSE in estimation of PEP using features from single axes of gyroscope and accelerometer placed on the mid sternum, with RMSE in estimation using BCG features as a reference. (b) Comparison of RMSE in PEP estimation using combination of features from multiple axes of the gyroscope and accelerometer, with RMSE from BCG features as a reference. (c) Comparison of RMSE for PEP estimation using different regression techniques. (d) Comparing RMSE in estimated PEP from our method with RMSE calculated, using algorithms from recent literatures.
Relative Feature Importance
Gyro X Location First Maxima 0-250 msGyro Y Location First Minima 0-250 msGyro X Location First Minima 0-250 ms
Gyro X Width First Maxima 0-250 msGyro X Location Second Maxima 0-250 ms
ACC X Location First Minima 0-250 msACC Z Location First Minima 0-250 ms
Gyro X Location First Maxima 250-500 msACC Z Location First Maxima 250-500 ms
Gyro Y Location First Maxima 0-250 msACC Z Location First Maxima 0-250 ms
Gyro X Location Second Minima 0-250 msACC Z Location First Minima 250-500 msGyro X Width Second Maxima 0-250 ms
Gyro Y Width First Minima 0-250 ms
GyroAccel
XGBoost Feature Importance Ranking
0 0.01 0.02 0.03 0.04
Fig. 6. Ranking of the best 15 features from gyroscope (Gyro) and accelerometer (ACC) in estimating PEP.
2168-2194 (c) 2018 IEEE. Personal use is permitted, but republication/redistribution requires IEEE permission. See http://www.ieee.org/publications_standards/publications/rights/index.html for more information.
This article has been accepted for publication in a future issue of this journal, but has not been fully edited. Content may change prior to final publication. Citation information: DOI 10.1109/JBHI.2019.2895775, IEEE Journal ofBiomedical and Health Informatics
JBHI-00785-2018
9
combination (same feature set) but using other regression models. We compared XGBoost regression to ordinary linear, Ridge, Lasso, random forest (RF) and extra trees (ET) regression techniques. Ordinary linear, Ridge and Lasso are all linear regression techniques, whereas XGBoost, RF and ET are ensemble learning algorithms. Ensemble methods using regression tree estimators can fit complicated non-linear functions robustly compared to linear models. For Ridge and Lasso, the regularization parameter α was varied between 10-3 to 102 logarithmically. For RF and ET, regressors contained 200 trees and column sampling factor was chosen as 0.5, similar to the XGBoost model parameters. For these ensemble models, each tree was trained on a subset of features consisting of featuresn features. The cross-
validated RMSE results were compared for the different regression models, keeping the same features and dataset and only the regression technique was altered. As hypothesized, XGBoost produced the lowest RMSE (Fig. 5(c), p<0.05) when different regression techniques were compared. Ordinary least squares regression resulted in an RMSE that was 4 ms higher (p<0.05) compared to XGBoost. Linear regression results does not improve with the introduction of L2 regularization via Ridge regression. Fig. 5(c) is showing the result only for αridge=1. However, results did not change substantially for the range of αridge values tested. L1 regularization via Lasso regression decreases RMSE results by only 0.2 ms (p<0.05). Out of the three ensemble methods tested, RF regression performed better than ET regression (p<0.05), while XGBoost performed the best. As hypothesized, the relation between the extracted SCG features and PEP was better characterized by non-linear models rather than linear ones, used in existing literature. Ensemble methods produced lower RMSE compared to linear methods. Automatic feature selection performed by the ensemble methods might be more effective than intrinsic feature selection (due to shrinkage of regression coefficients) used in L1 or L2 regularization.
E. Comparison with Algorithms from Existing Literature Fig. 5(d) shows the comparison of RMSE in estimating PEP using features via algorithms from recent publications. As expected, PEP estimation using specific points on the accelerometer or gyroscope is providing higher (more than 30%) RMSE compared to our PEP estimation using combination of x and y axes of the gyroscope and x and z axes of the accelerometer (p<0.05). RMSE was similar (p>0.05) for PEP estimation models based on features following Javaid et al. [30] and Yang et al. [9]. These results demonstrate that emphasizing specific points (as in the existing literature) from the accelerometer or gyroscope signal in estimating PEP can increase the error of estimation in a global model, due to intersubject variation and complex morphology of the signals. As a result, these approaches may not be applicable as a universal model across subjects or across studies. As an alternative, our work suggests that general time domain features from these signals can provide necessary information regarding PEP and constitute a better-performing global model, which can reduce the
complexity in feature extraction techniques. Another point to note is that, in all four algorithms, researchers used one peak/point from a single axis in the accelerometer or gyroscope signal, whereas we are using combination of features from multiple axes from both the sensors.
IV. CONCLUSION AND FUTURE WORK In this paper, we have compared gyroscope and
accelerometer based SCG signals and developed a global model to estimate PEP and compared our estimation with the ground truth PEP extracted from a simultaneously-recorded ICG signal. We have demonstrated that the combination of general time domain features from multiple axes of both accelerometer and gyroscope provides a better estimation of PEP compared to the use of specific locations or patterns from single axes of these sensors due to intersubject variability in these signals. In the case of individual sensors, the gyroscope provided more valuable information regarding PEP compared to the accelerometer for our dataset, when the sensors are placed on the mid sternum. It was also shown that the relationship between SCG signal features and PEP can be modelled using ensemble learning techniques to develop the universal model. Finally, this work highlights the advantages of sensor fusion for developing wearable sensors to monitor cardiac health.
In this paper, we collected data from healthy subjects and used the signals acquired from the mid sternum only. Future work should look at the signals from different locations and data from patients with cardiovascular diseases as well to assess how the model performs with higher intersubject variability and take necessary measures to obtain more accurate estimation of PEP. Exercise signals were not used for PEP estimation in this work. Future work should focus on exercise data to assess the possible estimation of PEP during movement with these regression methods. Gravity vector projection on different postures was not considered in this work. Future work can take this into account and can use this as a feature in the prediction model to see if it improves the prediction accuracy. Future work should also focus on estimation of left ventricular ejection time, stroke volume, and other cardio-mechanical parameters. In this work, we explored the relationship between PEP and features from the diastolic portion of both accelerometer and gyroscope signal. Future work can be conducted to investigate the underlying mechanisms.
REFERENCES [1] R. C. Talley, J. F. Meyer, and J. L. McNay, "Evaluation of the pre-
ejection period as an estimate of myocardial contractility in dogs," The American journal of cardiology, vol. 27, no. 4, pp. 384-391, 1971.
[2] D. B. Newlin and R. W. Levenson, "Pre‐ejection period: Measuring beta‐adrenergic influences upon the heart," Psychophysiology, vol. 16, no. 6, pp. 546-552, 1979.
[3] A. M. Weissler, W. S. Harris, and C. D. Schoenfeld, "Systolic time intervals in heart failure in man," Circulation, vol. 37, no. 2, pp. 149-159, 1968.
[4] O. T. Inan et al., "Activity-contextualized wearable ballistocardiogram measurements can classify decompensated versus compensated heart failure patients," ed: Am Heart Assoc, 2016.
2168-2194 (c) 2018 IEEE. Personal use is permitted, but republication/redistribution requires IEEE permission. See http://www.ieee.org/publications_standards/publications/rights/index.html for more information.
This article has been accepted for publication in a future issue of this journal, but has not been fully edited. Content may change prior to final publication. Citation information: DOI 10.1109/JBHI.2019.2895775, IEEE Journal ofBiomedical and Health Informatics
JBHI-00785-2018
10
[5] O. T. Inan et al., "Using ballistocardiography to monitor left ventricular function in heart failure patients," Journal of Cardiac Failure, vol. 22, no. 8, p. S45, 2016.
[6] O. T. Inan et al., "Novel Wearable Seismocardiography and Machine Learning Algorithms Can Assess Clinical Status of Heart Failure Patients," Circulation: Heart Failure, 2017 (In Press).
[7] M. Etemadi, O. T. Inan, J. A. Heller, S. Hersek, L. Klein, and S. Roy, "A wearable patch to enable long-term monitoring of environmental, activity and hemodynamics variables," IEEE transactions on biomedical circuits and systems, vol. 10, no. 2, pp. 280-288, 2016.
[8] K. Tavakolian, "Systolic time intervals and new measurement methods," Cardiovascular engineering and technology, vol. 7, no. 2, pp. 118-125, 2016.
[9] C. Yang, S. Tang, and N. Tavassolian, "Utilizing Gyroscopes Towards the Automatic Annotation of Seismocardiograms," Sensors, vol. 16738, p. 1, 2016.
[10] C. Yang and N. Tavassolian, "Combined Seismo-and Gyro-cardiography: A More Comprehensive Evaluation of Heart-Induced Chest Vibrations," IEEE Journal of Biomedical and Health Informatics, 2017.
[11] M. J. Tadi et al., "Gyrocardiography: A New Non-invasive Monitoring Method for the Assessment of Cardiac Mechanics and the Estimation of Hemodynamic Variables," Scientific Reports, vol. 7, no. 1, p. 6823, 2017.
[12] T. Chen and T. He, "Xgboost: extreme gradient boosting," R package version 0.4-2, 2015.
[13] T. Chen and C. Guestrin, "Xgboost: A scalable tree boosting system," in Proceedings of the 22nd acm sigkdd international conference on knowledge discovery and data mining, 2016, pp. 785-794: ACM.
[14] W. Kubicek, R. Patterson, and D. Witsoe, "Impedance cardiography as a noninvasive method of monitoring cardiac function and other parameters of the cardiovascular system," Annals of the New York Academy of Sciences, vol. 170, no. 1, pp. 724-732, 1970.
[15] R. Patterson, "Fundamentals of impedance cardiography," IEEE Engineering in Medicine and Biology magazine, vol. 8, no. 1, pp. 35-38, 1989.
[16] D. Serrano et al., "Environmentally-robust high-performance tri-axial bulk acoustic wave gyroscopes," in Position, Location and Navigation Symposium (PLANS), 2016 IEEE/ION, 2016, pp. 5-8: IEEE.
[17] O. Inan, M. Etemadi, R. Wiard, L. Giovangrandi, and G. Kovacs, "Robust ballistocardiogram acquisition for home monitoring," Physiological measurement, vol. 30, no. 2, p. 169, 2009.
[18] A. Q. Javaid et al., "Quantifying and reducing motion artifacts in wearable seismocardiogram measurements during walking to assess left ventricular health," IEEE Transactions on Biomedical Engineering, vol. 64, no. 6, pp. 1277-1286, 2017.
[19] L. Sörnmo and P. Laguna, Bioelectrical signal processing in cardiac and neurological applications. Academic Press, 2005.
[20] M. Etemadi, O. T. Inan, L. Giovangrandi, and G. T. Kovacs, "Rapid assessment of cardiac contractility on a home bathroom scale," IEEE transactions on information technology in biomedicine, vol. 15, no. 6, pp. 864-869, 2011.
[21] K. Tavakolian, A. P. Blaber, B. Ngai, and B. Kaminska, "Estimation of hemodynamic parameters from seismocardiogram," in Computing in Cardiology, 2010, 2010, pp. 1055-1058: IEEE.
[22] P. Castiglioni, A. Faini, G. Parati, and M. Di Rienzo, "Wearable seismocardiography," in Engineering in Medicine and Biology Society, 2007. EMBS 2007. 29th Annual International Conference of the IEEE, 2007, pp. 3954-3957: IEEE.
[23] K. Tavakolian et al., "Myocardial contractility: A seismocardiography approach," in Engineering in Medicine and Biology Society (EMBC), 2012 Annual International Conference of the IEEE, 2012, pp. 3801-3804: IEEE.
[24] C. M. Bishop, Pattern recognition and machine learning. springer, 2006.
[25] J. H. Friedman, "Greedy function approximation: a gradient boosting machine," Annals of statistics, pp. 1189-1232, 2001.
[26] T. G. Dietterich, "Ensemble learning," The handbook of brain theory and neural networks, vol. 2, pp. 110-125, 2002.
[27] A. Dupuy and R. M. Simon, "Critical review of published microarray studies for cancer outcome and guidelines on statistical analysis and reporting," Journal of the National Cancer Institute, vol. 99, no. 2, pp. 147-157, 2007.
[28] T. Hastie, R. Tibshirani, and J. Friedman, "The elements of statistical learning New York," NY: Springer, pp. 115-163, 2001.
[29] M. J. Tadi and J. Mojtaba, "A new algorithm for segmentation of cardiac quiescent phases and cardiac time intervals using seismocardiography," in Sixth International Conference on Graphic and Image Processing. International Society for Optics and Photonics, 2015, pp. 94432K-94432K.
[30] A. Q. Javaid, N. F. Fesmire, M. A. Weitnauer, and O. T. Inan, "Towards robust estimation of systolic time intervals using head-to-foot and dorso-ventral components of sternal acceleration signals," in Wearable and Implantable Body Sensor Networks (BSN), 2015 IEEE 12th International Conference on, 2015, pp. 1-5: IEEE.
[31] R. Tibshirani, "Regression shrinkage and selection via the lasso," Journal of the Royal Statistical Society. Series B (Methodological), pp. 267-288, 1996.
[32] L. v. d. Maaten and G. Hinton, "Visualizing data using t-SNE," Journal of Machine Learning Research, vol. 9, no. Nov, pp. 2579-2605, 2008.
[33] B. Anchang et al., "Visualization and cellular hierarchy inference of single-cell data using SPADE," Nature protocols, vol. 11, no. 7, pp. 1264-1279, 2016.
[34] G. J. Berman, D. M. Choi, W. Bialek, and J. W. Shaevitz, "Mapping the stereotyped behaviour of freely moving fruit flies," Journal of The Royal Society Interface, vol. 11, no. 99, p. 20140672, 2014.
[35] O. T. Inan et al., "Ballistocardiography and seismocardiography: A review of recent advances," IEEE journal of biomedical and health informatics, vol. 19, no. 4, pp. 1414-1427, 2015.
[36] M. Di Rienzo et al., "Wearable seismocardiography: Towards a beat-by-beat assessment of cardiac mechanics in ambulant subjects," Autonomic Neuroscience, vol. 178, no. 1, pp. 50-59, 2013.
[37] F. I. Marcus et al., "Accelerometer‐Derived Time Intervals during Various Pacing Modes in Patients with Biventricular Pacemakers: Comparison with Normals," Pacing and Clinical Electrophysiology, vol. 30, no. 12, pp. 1476-1481, 2007.
[38] M. Markl, P. J. Kilner, and T. Ebbers, "Comprehensive 4D velocity mapping of the heart and great vessels by cardiovascular magnetic resonance," Journal of Cardiovascular Magnetic Resonance, vol. 13, no. 1, p. 7, 2011.
[39] H. G. Bogren and M. H. Buonocore, "4D magnetic resonance velocity mapping of blood flow patterns in the aorta in young vs. elderly normal subjects," Journal of Magnetic Resonance Imaging: An Official Journal of the International Society for Magnetic Resonance in Medicine, vol. 10, no. 5, pp. 861-869, 1999.
[40] U. Morbiducci et al., "In vivo quantification of helical blood flow in human aorta by time-resolved three-dimensional cine phase contrast magnetic resonance imaging," Annals of biomedical engineering, vol. 37, no. 3, p. 516, 2009.
[41] P.-F. Migeotte, V. Mucci, Q. Delière, L. Lejeune, and P. van de Borne, "Multi-dimensional kineticardiography a new approach for wearable cardiac monitoring through body acceleration recordings," in XIV Mediterranean Conference on Medical and Biological Engineering and Computing 2016, 2016, pp. 1125-1130: Springer.
View publication statsView publication stats