
Performance Analysis of Centrifugal Pump Operating as Turbine...CENTRIFUGAL PUMP AS TURBINE The use...
14
International Journal of Engineering Research and General Science Volume 3, Issue 3, May-June, 2015 ISSN 2091-2730 6 www.ijergs.org PERFORMANCE ANALYSIS OF CENTRIFUGAL PUMP OPERATING AS TURBINE FOR IDENTIFIED MICRO/PICO HYDRO SITE OF ETHIOPIA Edessa Dribssa , Tilahun Nigussie, Bazen Tsegaye Department of Mechanical Engineering, Addis Ababa Institute of Technology (AAIT), Addis Ababa, Ethiopia [email protected] Abstract— The research on ‗pumps as turbines‘ at this critical phase of developing decentralized small hydro systems is appropriate for many reasons. The conventional turbine technologies like pelton and cross flow turbines that have been implemented in the micro hydro sector have to be custom-made and are therefore more expensive. They also need expert design and precise manufacturing skills for a good performance. This often becomes a bottleneck especially for smaller projects below 20 KWs of installed capacity. An alternative approach of using well-known ‗pump as turbine‘ technology can be contemplated and popularized. Pumps are readily available all over the world in every shape and size, mainly due to the ever-increasing demand for pumping application [7]. This research presents CFD based prediction of performance analysis of PAT for Dabis Hydro site which is located in West Shewa zone of Ethiopia, at 8°52'38.97" N latitude and 37°47'04.95" E longitude. According to secondary source data, the site is characterized by a minimum flow rate of 0.025 m 3 /s and a gross head of 17m.The estimated output power for this site is 2.70 kW. The numerical study of a centrifugal pump running as turbine at different operation conditions was achieved using commercial CFD software Ansys CFX. 3D Navier–Stokes equations were solved using Ansys CFX. The standard k turbulence model was chosen for turbulence model. Using results from simulation, complete characteristic curves of the pump in normal and reverse modes were obtained. After that, the performance of PAT was estimated using various methods proposed by different researchers. Experimental data from AAIT is used to test the accuracy of various correlations that can be used to generate turbine-mode operation curves from pump curves. And the simulation result of the PAT at best efficiency point (BEP) was compared with results obtained using published empirical formulas and the prediction method proposed by Stephanoff [15] showed acceptable result. The efficiency of the pump is greatly improved beyond the BEP when the impeller tips is made round. As the impeller speed increase, impeller torque decreases. Whereas as the rotational speed of the PAT increases, the power outputs as well as the efficiency of the PAT increase until the impeller speed reaches 1400 RPM. Lastly, the effect of draft tube on PAT was simulated and studied. The results show that the PAT head increase when draft tube is added to the system. Keywords— Pump As Turbine, CFD, Performance prediction, Efficiency, Impeller tip rounding, Draft tube, Impeller speed effect.
Transcript of Performance Analysis of Centrifugal Pump Operating as Turbine...CENTRIFUGAL PUMP AS TURBINE The use...
International Journal of Engineering Research and General Science Volume 3, Issue 3, May-June, 2015 ISSN 2091-2730
6 www.ijergs.org
PERFORMANCE ANALYSIS OF CENTRIFUGAL PUMP
OPERATING AS TURBINE FOR IDENTIFIED MICRO/PICO
HYDRO SITE OF ETHIOPIA
Edessa Dribssa , Tilahun Nigussie, Bazen Tsegaye
Department of Mechanical Engineering, Addis Ababa Institute of Technology (AAIT), Addis Ababa, Ethiopia
Abstract— The research on ‗pumps as turbines‘ at this critical phase of developing decentralized small hydro systems is appropriate
for many reasons. The conventional turbine technologies like pelton and cross flow turbines that have been implemented in the micro
hydro sector have to be custom-made and are therefore more expensive. They also need expert design and precise manufacturing skills
for a good performance. This often becomes a bottleneck especially for smaller projects below 20 KWs of installed capacity. An
alternative approach of using well-known ‗pump as turbine‘ technology can be contemplated and popularized. Pumps are readily
available all over the world in every shape and size, mainly due to the ever-increasing demand for pumping application [7].
This research presents CFD based prediction of performance analysis of PAT for Dabis Hydro site which is located in West Shewa
zone of Ethiopia, at 8°52'38.97" N latitude and 37°47'04.95" E longitude. According to secondary source data, the site is characterized
by a minimum flow rate of 0.025 m3/s and a gross head of 17m.The estimated output power for this site is 2.70 kW. The numerical
study of a centrifugal pump running as turbine at different operation conditions was achieved using commercial CFD software Ansys
CFX. 3D Navier–Stokes equations were solved using Ansys CFX. The standard k turbulence model was chosen for turbulence
model. Using results from simulation, complete characteristic curves of the pump in normal and reverse modes were obtained. After
that, the performance of PAT was estimated using various methods proposed by different researchers. Experimental data from AAIT
is used to test the accuracy of various correlations that can be used to generate turbine-mode operation curves from pump
curves. And the simulation result of the PAT at best efficiency point (BEP) was compared with results obtained using published
empirical formulas and the prediction method proposed by Stephanoff [15] showed acceptable result. The efficiency of the pump is
greatly improved beyond the BEP when the impeller tips is made round. As the impeller speed increase, impeller torque decreases.
Whereas as the rotational speed of the PAT increases, the power outputs as well as the efficiency of the PAT increase until the
impeller speed reaches 1400 RPM. Lastly, the effect of draft tube on PAT was simulated and studied. The results show that the PAT
head increase when draft tube is added to the system.
Keywords— Pump As Turbine, CFD, Performance prediction, Efficiency, Impeller tip rounding, Draft tube, Impeller speed effect.
International Journal of Engineering Research and General Science Volume 3, Issue 3, May-June, 2015 ISSN 2091-2730
7 www.ijergs.org
INTRODUCTION
The rising electricity cost in Ethiopia has caused rural areas to start investigating means of reducing their energy consumption.
Micro/Pico-hydro power is the small-scale extraction of energy from falling water from a local river to power a small village in rural
areas using turbine. Micro and Pico hydro power generation has particularly become a major focus of Ethiopian electricity sector for
off-grid rural electrification in order to improve sustainable energy [3].
Centrifugal pumps are used to raise liquids from a lower to a higher level by creating the required pressure with the help of centrifugal
action. But when the direction of flow is reversed, they can be made to operate in a turbine mode. The use of centrifugal pump as
turbine for electricity power generation was inspired by several researchers [7, 9-14]. The problem aroused from the use of high cost
convention turbine for micro-hydro projects can be successful solved by utilizing Pump as Turbine (PAT) as a solution [18].
CENTRIFUGAL PUMP AS TURBINE
The use of pump to transfer fluid from lower pressure to higher pressure in industrial and other areas has been applicable for several
decades [5]. Recently; however the use of pump-as-turbine (PAT) systems has become popular. In such a system a pump is operated
in reverse so that it functions as a turbine. According to Chapallaz [6], PATs are practically applicable in the areas of power
generation. Standard pumps are now more and more used in MHP/PHP schemes (5 to 500 kW). For pumped storage scheme, pump-
turbines are specifically used to operate in both modes; pumping water into an elevated storage lake over night at low tariff electricity
and during the day, generating peak demand electricity through the same machine operating in turbine mode.
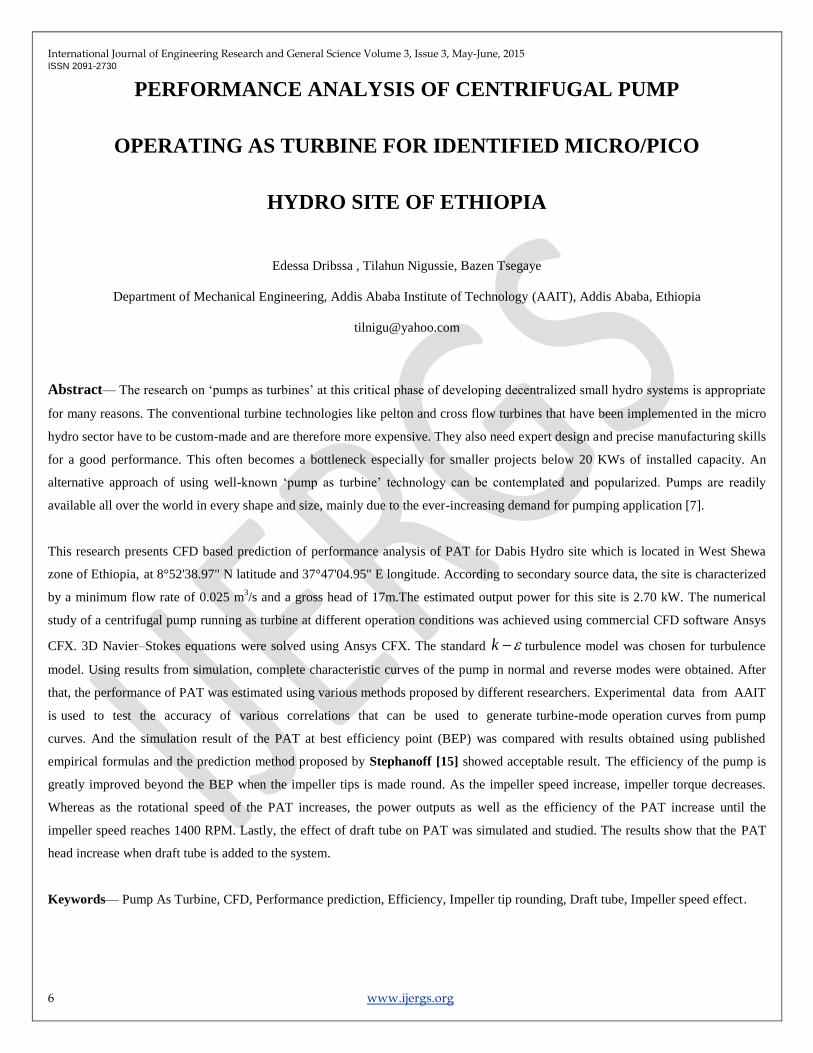
The appropriate operating range of a reversible pump-turbine depends on the available head and flow rate on a hydro site. Chapallaz
[6] presented a selection chart based on more than 80 test results of pump working in turbine mode. Fig.1 shows the range of head and
flow rate for various types of PAT. From fig.1, it can be observed that centrifugal pumps can be used in turbine mode for head range
10 - 150 m and up to 0.5 m3/s flow rate.
Fig.1: General range of application of different PAT types [6].
International Journal of Engineering Research and General Science Volume 3, Issue 3, May-June, 2015 ISSN 2091-2730
8 www.ijergs.org
MODELLING OF CENTRIFUGAL PUMP AS TURBINE
Modeling of the geometry of a centrifugal pump running in turbine mode involves defining the impeller and volute components.
Geometric modeling of draft tube is also considered since it is one of the major components in PAT system.
A. Creating of Impeller and Volute
The volute and the impeller are generated using CF turbo. CF turbo is software package used to model and design turbo
machineries like pumps, ventilators, compressors, turbines interactively. The software is easy to use and does enable quick generation
and variation of impeller and volute geometries. The selected pump specification to operate in turbine mode is tabulated in Table 1.
Table 1: Centrifugal pump impeller specification
Impeller Geometry Parameter Inlet Outlet
No. of Blades 5
Eye Diameter 44 mm
Impeller Diameter 101.5 mm 200 mm
Blade width 32 mm 20 mm
Blade angle 18 o 40
o
Blade thickness 2.4 mm 4.2 mm
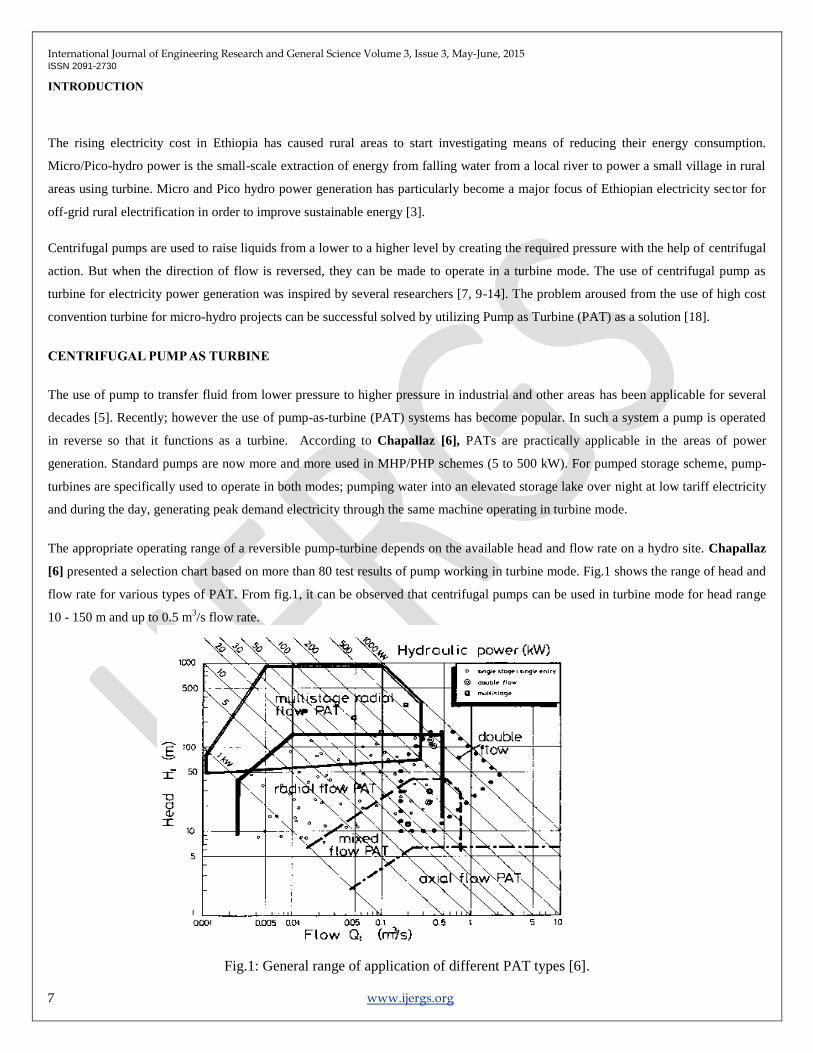
Using CF turbo graphics user interface (GUI), two components of the pump; namely the impeller and volute casing are modeled. Due
to the periodic nature of the impeller geometry, only a single blade passage of the complete impeller model of the original pump is
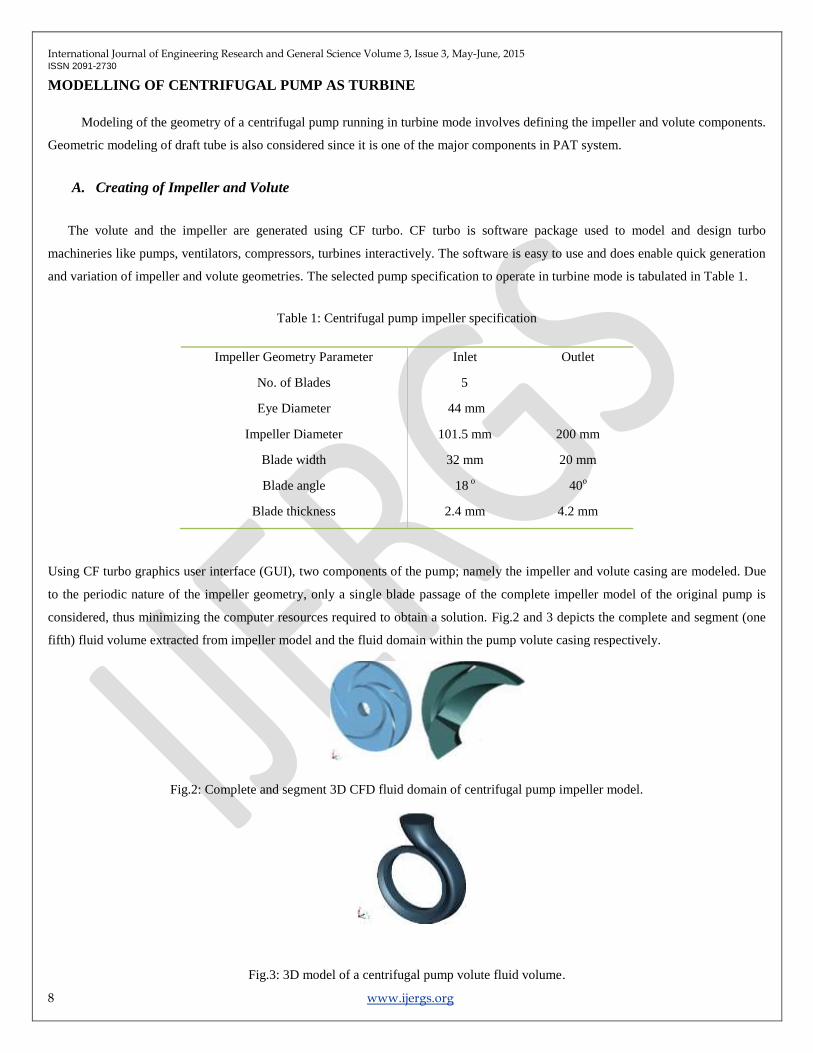
considered, thus minimizing the computer resources required to obtain a solution. Fig.2 and 3 depicts the complete and segment (one
fifth) fluid volume extracted from impeller model and the fluid domain within the pump volute casing respectively.
Fig.2: Complete and segment 3D CFD fluid domain of centrifugal pump impeller model.
Fig.3: 3D model of a centrifugal pump volute fluid volume.
International Journal of Engineering Research and General Science Volume 3, Issue 3, May-June, 2015 ISSN 2091-2730
9 www.ijergs.org
B. Creating of Draft tube
Draft tubes are usually used on PAT to partially regain the velocity energy at the diffuser throat of the PAT outlet (pump inlet).Due to
gradual expansion of area toward the outlet section of the draft tube; the kinetic energy of the water then can be transformed into
pressure which will increase the net turbine head of the installation.
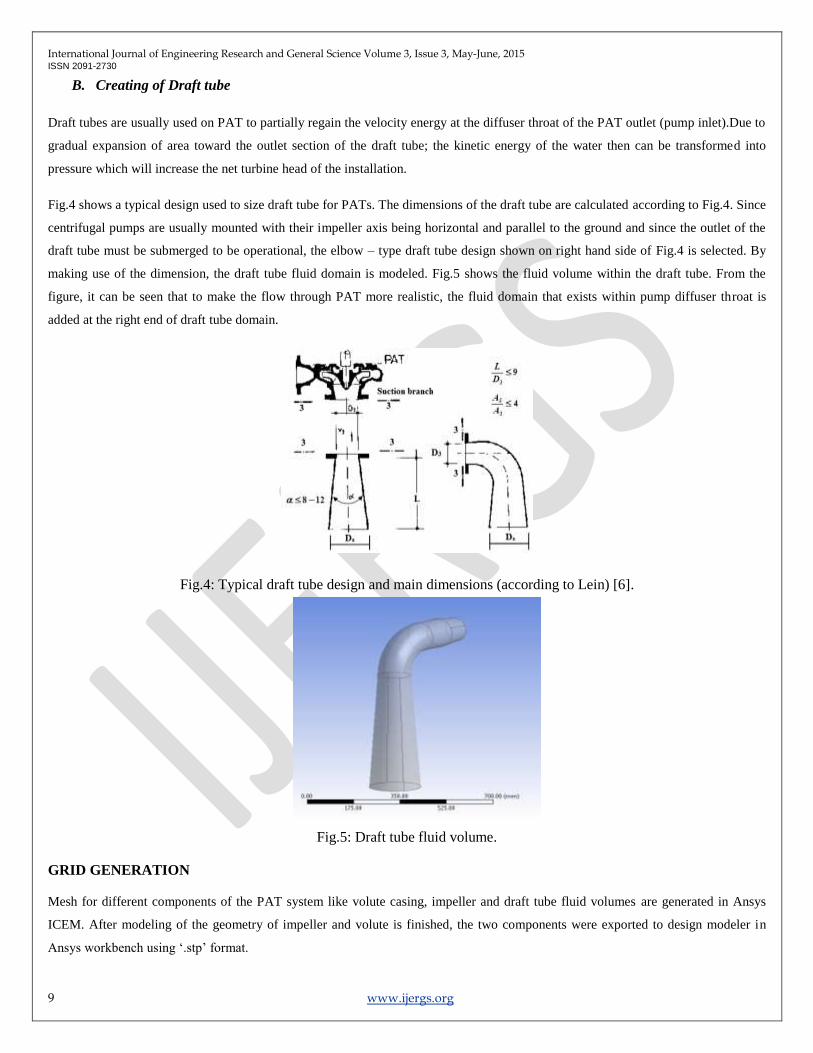
Fig.4 shows a typical design used to size draft tube for PATs. The dimensions of the draft tube are calculated according to Fig.4. Since
centrifugal pumps are usually mounted with their impeller axis being horizontal and parallel to the ground and since the outlet of the
draft tube must be submerged to be operational, the elbow – type draft tube design shown on right hand side of Fig.4 is selected. By
making use of the dimension, the draft tube fluid domain is modeled. Fig.5 shows the fluid volume within the draft tube. From the
figure, it can be seen that to make the flow through PAT more realistic, the fluid domain that exists within pump diffuser throat is
added at the right end of draft tube domain.
Fig.4: Typical draft tube design and main dimensions (according to Lein) [6].
Fig.5: Draft tube fluid volume.
GRID GENERATION
Mesh for different components of the PAT system like volute casing, impeller and draft tube fluid volumes are generated in Ansys
ICEM. After modeling of the geometry of impeller and volute is finished, the two components were exported to design modeler in
Ansys workbench using ‗.stp‘ format.
International Journal of Engineering Research and General Science Volume 3, Issue 3, May-June, 2015 ISSN 2091-2730
10 www.ijergs.org
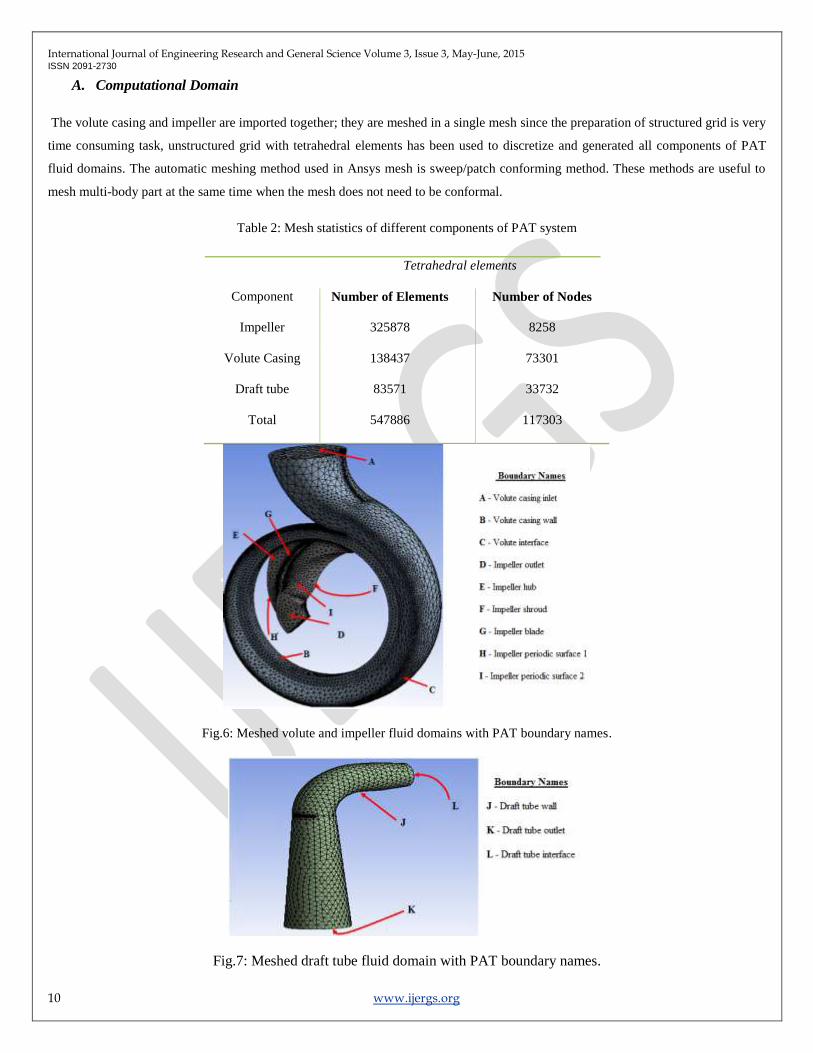
A. Computational Domain
The volute casing and impeller are imported together; they are meshed in a single mesh since the preparation of structured grid is very
time consuming task, unstructured grid with tetrahedral elements has been used to discretize and generated all components of PAT
fluid domains. The automatic meshing method used in Ansys mesh is sweep/patch conforming method. These methods are useful to
mesh multi-body part at the same time when the mesh does not need to be conformal.
Table 2: Mesh statistics of different components of PAT system
Tetrahedral elements
Component Number of Elements Number of Nodes
Impeller 325878 8258
Volute Casing 138437 73301
Draft tube 83571 33732
Total 547886 117303
Fig.6: Meshed volute and impeller fluid domains with PAT boundary names.
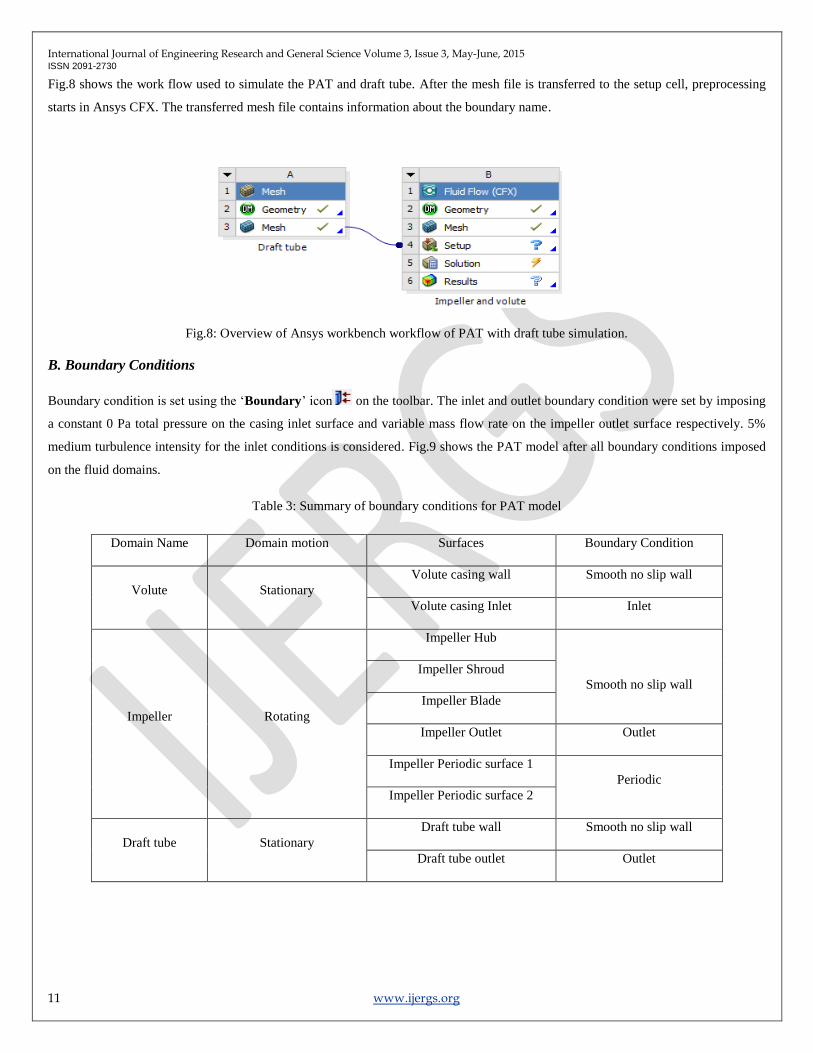
Fig.7: Meshed draft tube fluid domain with PAT boundary names.
International Journal of Engineering Research and General Science Volume 3, Issue 3, May-June, 2015 ISSN 2091-2730
11 www.ijergs.org
Fig.8 shows the work flow used to simulate the PAT and draft tube. After the mesh file is transferred to the setup cell, preprocessing
starts in Ansys CFX. The transferred mesh file contains information about the boundary name.
Fig.8: Overview of Ansys workbench workflow of PAT with draft tube simulation.
B. Boundary Conditions
Boundary condition is set using the ‗Boundary‘ icon on the toolbar. The inlet and outlet boundary condition were set by imposing
a constant 0 Pa total pressure on the casing inlet surface and variable mass flow rate on the impeller outlet surface respectively. 5%
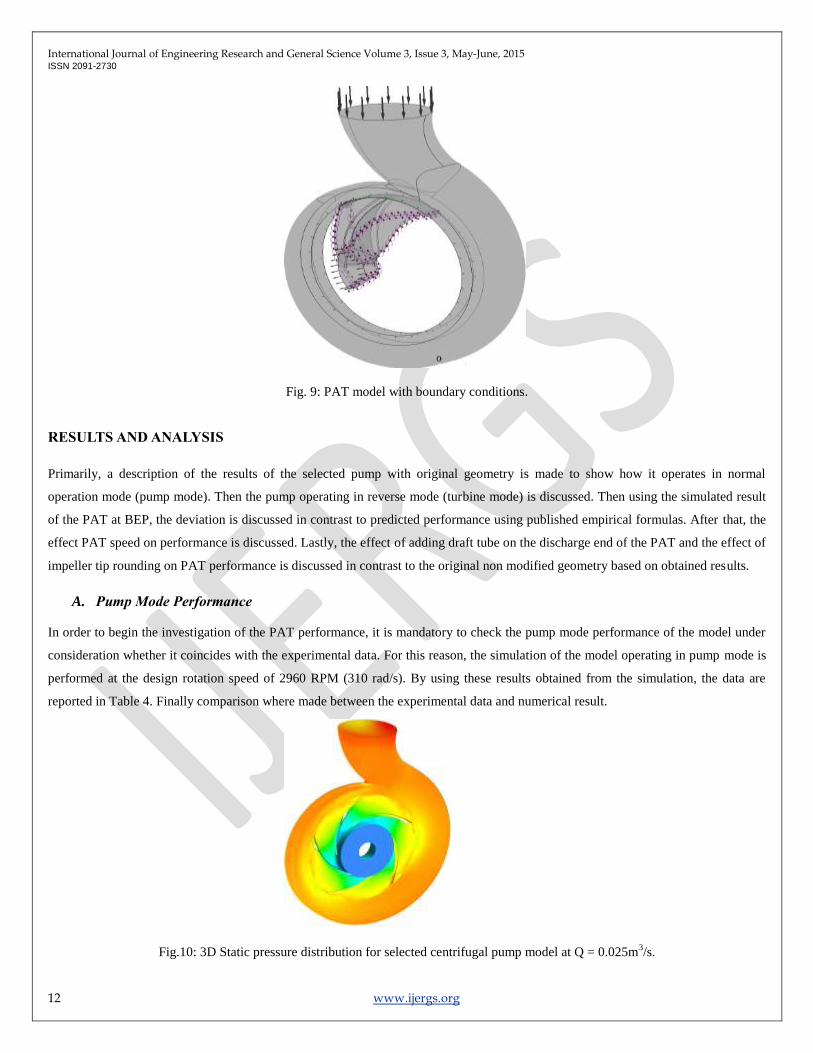
medium turbulence intensity for the inlet conditions is considered. Fig.9 shows the PAT model after all boundary conditions imposed
on the fluid domains.
Table 3: Summary of boundary conditions for PAT model
Domain Name Domain motion Surfaces Boundary Condition
Volute Stationary
Volute casing wall Smooth no slip wall
Volute casing Inlet Inlet
Impeller Rotating
Impeller Hub
Smooth no slip wall
Impeller Shroud
Impeller Blade
Impeller Outlet Outlet
Impeller Periodic surface 1
Periodic
Impeller Periodic surface 2
Draft tube Stationary
Draft tube wall Smooth no slip wall
Draft tube outlet Outlet
International Journal of Engineering Research and General Science Volume 3, Issue 3, May-June, 2015 ISSN 2091-2730
12 www.ijergs.org
Fig. 9: PAT model with boundary conditions.
RESULTS AND ANALYSIS
Primarily, a description of the results of the selected pump with original geometry is made to show how it operates in normal
operation mode (pump mode). Then the pump operating in reverse mode (turbine mode) is discussed. Then using the simulated result
of the PAT at BEP, the deviation is discussed in contrast to predicted performance using published empirical formulas. After that, the
effect PAT speed on performance is discussed. Lastly, the effect of adding draft tube on the discharge end of the PAT and the effect of
impeller tip rounding on PAT performance is discussed in contrast to the original non modified geometry based on obtained results.
A. Pump Mode Performance
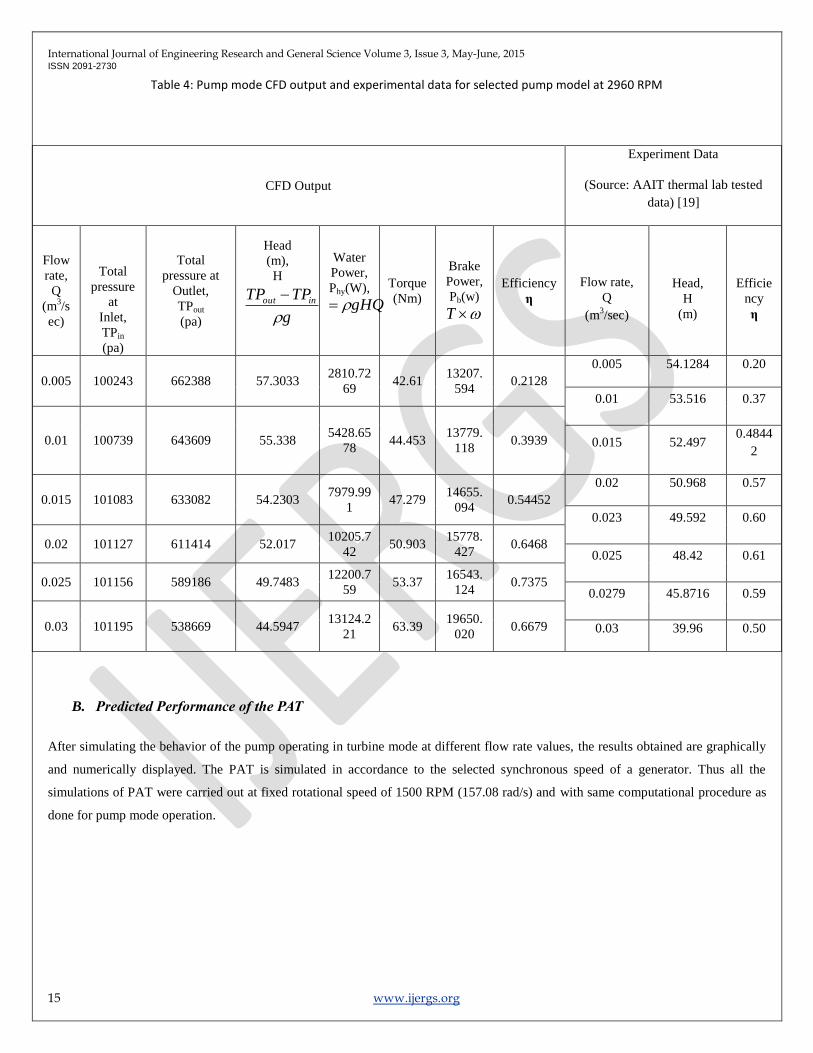
In order to begin the investigation of the PAT performance, it is mandatory to check the pump mode performance of the model under
consideration whether it coincides with the experimental data. For this reason, the simulation of the model operating in pump mode is
performed at the design rotation speed of 2960 RPM (310 rad/s). By using these results obtained from the simulation, the data are
reported in Table 4. Finally comparison where made between the experimental data and numerical result.
Fig.10: 3D Static pressure distribution for selected centrifugal pump model at Q = 0.025m3/s.
International Journal of Engineering Research and General Science Volume 3, Issue 3, May-June, 2015 ISSN 2091-2730
13 www.ijergs.org
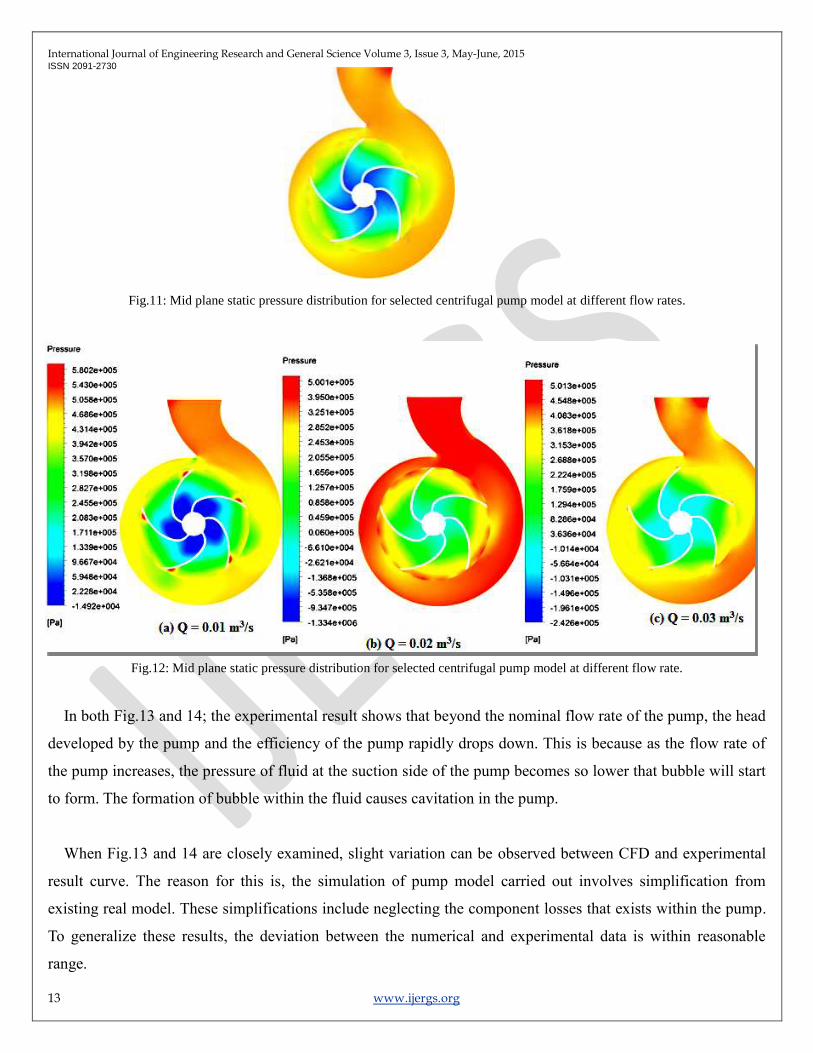
Fig.11: Mid plane static pressure distribution for selected centrifugal pump model at different flow rates.
Fig.12: Mid plane static pressure distribution for selected centrifugal pump model at different flow rate.
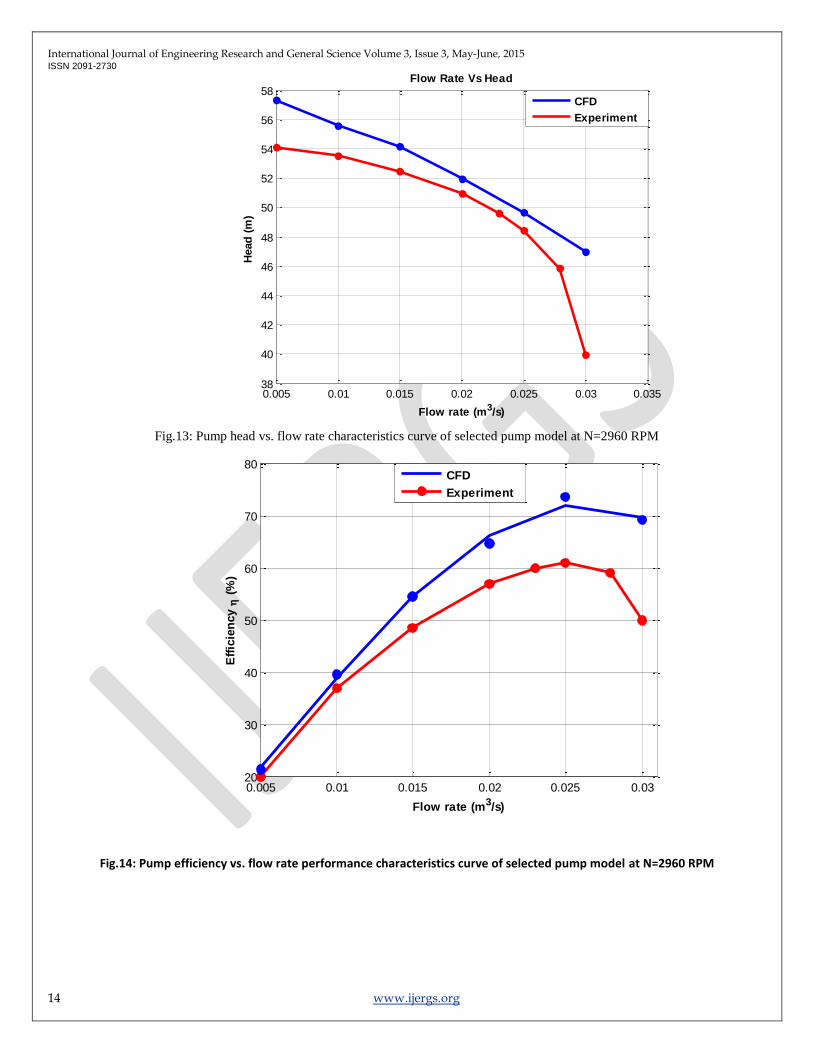
In both Fig.13 and 14; the experimental result shows that beyond the nominal flow rate of the pump, the head
developed by the pump and the efficiency of the pump rapidly drops down. This is because as the flow rate of
the pump increases, the pressure of fluid at the suction side of the pump becomes so lower that bubble will start
to form. The formation of bubble within the fluid causes cavitation in the pump.
When Fig.13 and 14 are closely examined, slight variation can be observed between CFD and experimental
result curve. The reason for this is, the simulation of pump model carried out involves simplification from
existing real model. These simplifications include neglecting the component losses that exists within the pump.
To generalize these results, the deviation between the numerical and experimental data is within reasonable
range.
International Journal of Engineering Research and General Science Volume 3, Issue 3, May-June, 2015 ISSN 2091-2730
14 www.ijergs.org
0.005 0.01 0.015 0.02 0.025 0.03 0.03538
40
42
44
46
48
50
52
54
56
58Flow Rate Vs Head
Flow rate (m3/s)
Head
(m
)
CFD
Experiment
0.005 0.01 0.015 0.02 0.025 0.0320
30
40
50
60
70
80
Flow rate (m3/s)
Eff
icie
ncy
(%
)
CFD
Experiment
Fig.13: Pump head vs. flow rate characteristics curve of selected pump model at N=2960 RPM
Fig.14: Pump efficiency vs. flow rate performance characteristics curve of selected pump model at N=2960 RPM
International Journal of Engineering Research and General Science Volume 3, Issue 3, May-June, 2015 ISSN 2091-2730
15 www.ijergs.org
Table 4: Pump mode CFD output and experimental data for selected pump model at 2960 RPM
B. Predicted Performance of the PAT
After simulating the behavior of the pump operating in turbine mode at different flow rate values, the results obtained are graphically
and numerically displayed. The PAT is simulated in accordance to the selected synchronous speed of a generator. Thus all the
simulations of PAT were carried out at fixed rotational speed of 1500 RPM (157.08 rad/s) and with same computational procedure as
done for pump mode operation.
CFD Output
Experiment Data
(Source: AAIT thermal lab tested
data) [19]
Flow
rate,
Q
(m3/s
ec)
Total
pressure
at
Inlet,
TPin
(pa)
Total
pressure at
Outlet,
TPout
(pa)
Head
(m),
H
g
TPTP inout
Water
Power,
Phy(W),
gHQ
Torque
(Nm)
Brake
Power,
Pb(w)
T
Efficiency
η
Flow rate,
Q
(m3/sec)
Head,
H
(m)
Efficie
ncy
η
0.005 100243
662388
57.3033 2810.72
69 42.61
13207.
594 0.2128
0.005 54.1284 0.20
0.01 53.516 0.37
0.01 100739 643609 55.338 5428.65
78 44.453
13779.
118 0.3939 0.015 52.497
0.4844
2
0.015 101083 633082 54.2303 7979.99
1 47.279
14655.
094 0.54452
0.02 50.968 0.57
0.023 49.592 0.60
0.02 101127 611414 52.017 10205.7
42 50.903
15778.
427 0.6468
0.025 48.42 0.61
0.025 101156 589186 49.7483 12200.7
59 53.37
16543.
124 0.7375
0.0279 45.8716 0.59
0.03 101195 538669 44.5947 13124.2
21 63.39
19650.
020 0.6679 0.03 39.96 0.50
International Journal of Engineering Research and General Science Volume 3, Issue 3, May-June, 2015 ISSN 2091-2730
16 www.ijergs.org
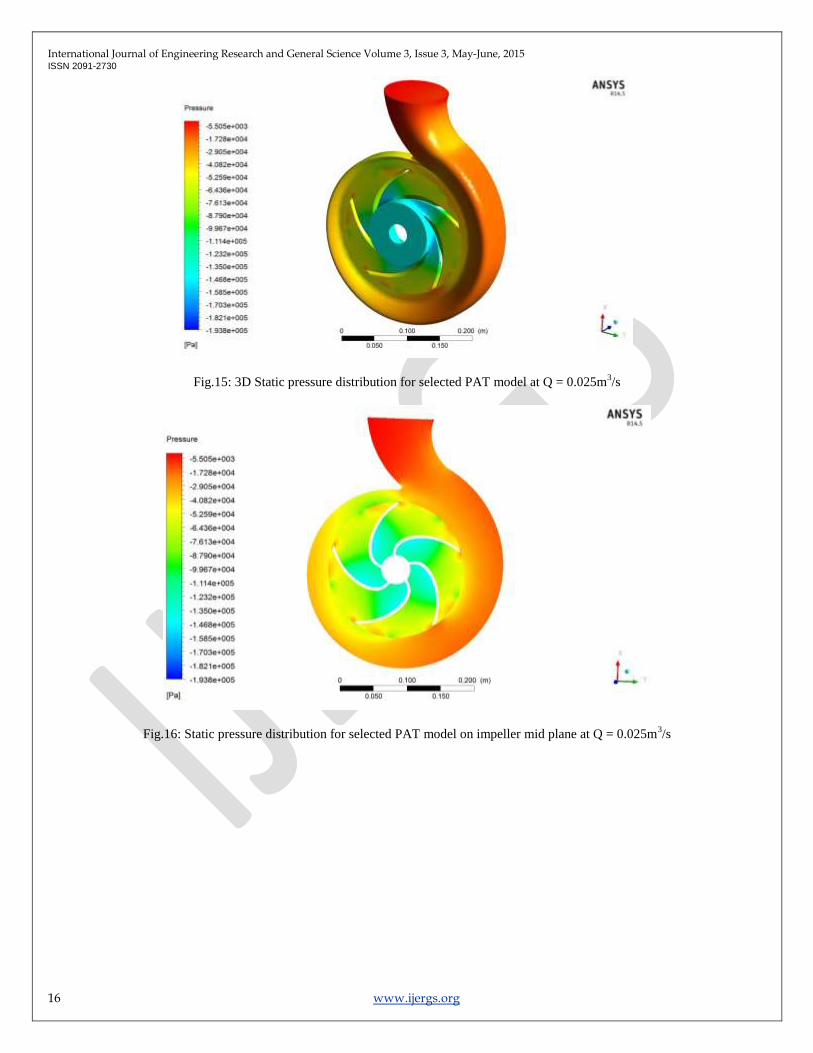
Fig.15: 3D Static pressure distribution for selected PAT model at Q = 0.025m3/s
Fig.16: Static pressure distribution for selected PAT model on impeller mid plane at Q = 0.025m3/s
International Journal of Engineering Research and General Science Volume 3, Issue 3, May-June, 2015 ISSN 2091-2730
17 www.ijergs.org
0.01 0.015 0.02 0.025 0.03 0.035 0.04 0.0450
5
10
15
20
25
30
Flow Rate Vs Head
Flow rate (m3/s)
Head
(m
)
Be
st
Eff
icie
nc
y P
oin
t
To
rqu
e,T
= 0
H =(-5.985Q3 - 0.53Q2 - 0.0076Q + 0.0001)10-5
Nt=1500 RPM
fitted data
0 0.005 0.01 0.015 0.02 0.025 0.03 0.035 0.04 0.045-5
0
5
10
15
20
25
30
35
40
45Flow Rate Vs Torque
Flow Rate(m3/s)
To
rqu
e (
Nm
)
Be
st
Eff
icie
nc
y P
oin
t
To
rqu
e,T
= 0
Nt=1500 RPM
fitted data
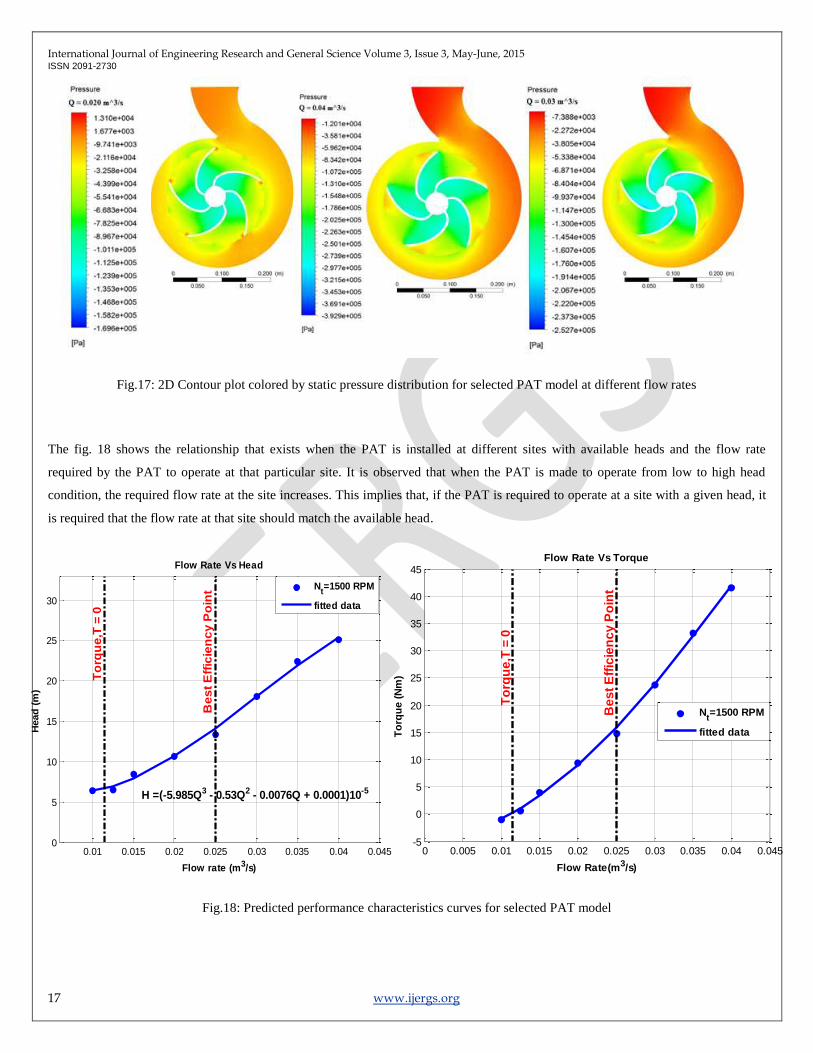
Fig.17: 2D Contour plot colored by static pressure distribution for selected PAT model at different flow rates
The fig. 18 shows the relationship that exists when the PAT is installed at different sites with available heads and the flow rate
required by the PAT to operate at that particular site. It is observed that when the PAT is made to operate from low to high head
condition, the required flow rate at the site increases. This implies that, if the PAT is required to operate at a site with a given head, it
is required that the flow rate at that site should match the available head.
Fig.18: Predicted performance characteristics curves for selected PAT model
International Journal of Engineering Research and General Science Volume 3, Issue 3, May-June, 2015 ISSN 2091-2730
18 www.ijergs.org
ACKNOWLEDGMENT
We thank all the extension and GIZ staff who provided us with information about micro hydro potential site with description of the
site.
CONCLUSION
Performance analysis of PAT using CFD code Ansys CFX is made on a centrifugal pump. A 3D geometric model for the selected
centrifugal pump is used to compute the steady state solution in turbine mode. The results are presented using different graphical
displays of pressure and velocity distribution of the PAT model. Numerical results are also obtained from the simulation to evaluate
the performance characteristics of various models under consideration.
To check the consistency of the selected centrifugal pump with the model, the first simulation is made considering the original pump
running in normal operating mode. The numerical result of the simulation in direct operating pump mode shows a good agreement
with the experimental tested results. The turbine mode characteristic curves at angular velocity 1500 RPM are also prepared using the
simulation result when the centrifugal pump operates in reverse mode. The PAT simulation results showed that when the PAT is made
to operate from low to high head condition, the required flow rate at the site also increases. And the power output vs. flow rate
characteristic curve of the PAT shows that when the PAT is installed at different hydro site with flow rate matching the available head
based on the head – flow rate characteristic curve, the power output of the PAT increases. The maximum efficiency of the PAT is
obtained when it operate sat 0.025 m3/sec flow rate and 13.378 m head. The head value at BEP, predicted by Stephanoff [15] method,
has closer result with the CFD value.
The effect of round trailing edge is also simulated and compared with the original trimmed impeller tip. The results show that round
trailing edge has caused lower head and higher efficiency value compared to the trimmed edge.PAT speed at constant head and flow
rate is also considered to evaluate the effect on the PAT performance. The numerical result shows that as the impeller speed increases,
both the power output and efficiency of the PAT increase until 1400 RPM. And the result also showed that the impeller torque
decreases as the result of increasing the speed. Lastly, The effect of draft tube when added PAT is also analyzed and the result shows
the draft tube causes the head to increase while the overall system efficiency get lower.
REFERENCES:
[1]. ―Water Sector Development Program‖, Main Report, vol. 1, 2002.
[2]. AkliluDalelo, ―Rural Electrification in Ethiopia: Opportunities and Bottlenecks‖.
[3].Meder K., ―Application of Environment Assessment Related to GIZ ECO Micro Hydropower Plants in the Sidama
Zone/Ethiopia‖, MSc Thesis, Heidelberg University, 2011.
[4].―EEPCo Report‖, 2001.
[5]. Rama S. R. Gorla and Aijaz A. Khan, ―Turbo Machinery Design and Theory‖, 2003.
[6]. Chapallaz J.M., Eichenberger P., Fischer G., ―Manual on Pumps Used as Turbines‖, Vieweg, Braunschweig, 1992.

International Journal of Engineering Research and General Science Volume 3, Issue 3, May-June, 2015 ISSN 2091-2730
19 www.ijergs.org
[7].Singh P., ―Optimization of Internal Hydraulics and of System Design for Pumpsas Turbines with Field Implementation and
Evaluation‖, Ph.D. Thesis,University of Karlsruhe,2005.
[8].AbebeTilahun,―Assessmentof Micro Hydro Power Potential of Selected Ethiopian Rivers- A Case Studyin the North-West Part of
the Country‖,MSc thesis, Addis Ababa Institute of Technology, 2011.
[9]. Sonia Rawal& J.T Kshirsagar, ―Numerical Simulation on a Pump Operating in a Turbine‖, Proceedings of the Twenty – Third
International Pump Users Symposium, 2007, pp. 21-27.
[10].DerakhshanS. &Nourbakhsh A., ―Experimental Study of Characteristic Curves of centrifugal pumps working as turbines in
different specific speeds‖, Experimental Thermal and Fluid Science,vol. 32, 2008, pp. 800–807.
[11]. DerakhshanS. &Nourbakhsh A., ―Theoretical, Numerical and Experimental Investigation of Centrifugal Pumps in Reverse
Operation‖, Experimental Thermal and Fluid Science,vol. 32, 2008, pp.1620 –1627.
[12]. Barrio R., Fernández J., ParrondoJ. and BlancoE., ―Performance Prediction of a Centrifugal Pump Working in Direct and
Reverse Mode Using Computational Fluid Dynamics‖,International Conference on Renewable Energies and Power Quality, 2010.
[13].Hyoung Woo Oh,―Applied Computational Fluid Dynamics‖, 2012.
[14]. ―Reference Guide for Ansys CFX 14.5‖, 2012.
[15].Claudio Alatorre-Frenk, ―Cost Minimization in Micro-Hydro Systems Using Pumps as Turbines‖,Ph.D. Thesis, University of
Warwick, 1994.
[16]. Nautiya H., Varun, Kumar A. and Yadav S., ―Experimental Investigation of Centrifugal Pump Working as Turbine for Small
Hydropower Systems‖, Energy Science and Technology, vol. 1, no. 1, 2011, pp. 79-86.
[17].Williams A., ―Pumps as Turbine: A User‘s Guide‖, 1997.
[18]. Agarwal T.,―Review of Pump as Turbine (PAT) for Micro-Hydropower‖, International Journal of Emerging Technology and
Advanced Engineering, vol. 2, 2012, pp. 163-169.
[19]. ―Laboratory Manual and Test Data‖, Addis Ababa University, Mechanical Engineering Department