Performance analysis of berth configurations at container ...
24
OR Spectrum (2010) 32:453–476 DOI 10.1007/s00291-010-0201-8 REGULAR ARTICLE Performance analysis of berth configurations at container terminals Iris F. A. Vis · Roel G. van Anholt Published online: 9 March 2010 © The Author(s) 2010. This article is published with open access at Springerlink.com Abstract The containerized trade market has been growing rapidly since its intro- duction. The capacity of ships and the amount of containers being transshipped at container terminals increases significantly. Terminals should handle their operations efficiently to provide the necessary capacity and customer service. In designing a con- tainer terminal, terminal management has to consider the choice for a certain type of berth. In this paper, we compare by means of a simulation study the performance of traditional one-sided marginal berths and indented berths. An indented berth enables quay cranes to unload and load containers from both sides of the ship. As a result, more quay cranes can work on a single ship. As main performance measure in this comparison we use the total vessel operation time required to unload and load a ship. This time depends next to crane productivity also on the efficiency of the transportation and storage and retrieval processes in the terminal. We have performed a sensitivity analysis in which we also study the relation between the selection of an indented berth and other design and control issues in the terminal. Keywords Container terminals · Indented berth · Performance analysis · Design · Simulation I. F. A. Vis (B ) · R. G. van Anholt Department of Information Systems and Logistics, Faculty of Economics and Business Administration, VU University Amsterdam, De Boelelaan 1105, 1081 HV Amsterdam, The Netherlands e-mail: [email protected] R. G. van Anholt e-mail: [email protected] 123
Transcript of Performance analysis of berth configurations at container ...

OR Spectrum (2010) 32:453–476DOI 10.1007/s00291-010-0201-8
REGULAR ARTICLE
Performance analysis of berth configurationsat container terminals
Iris F. A. Vis · Roel G. van Anholt
Published online: 9 March 2010© The Author(s) 2010. This article is published with open access at Springerlink.com
Abstract The containerized trade market has been growing rapidly since its intro-duction. The capacity of ships and the amount of containers being transshipped atcontainer terminals increases significantly. Terminals should handle their operationsefficiently to provide the necessary capacity and customer service. In designing a con-tainer terminal, terminal management has to consider the choice for a certain type ofberth. In this paper, we compare by means of a simulation study the performance oftraditional one-sided marginal berths and indented berths. An indented berth enablesquay cranes to unload and load containers from both sides of the ship. As a result,more quay cranes can work on a single ship. As main performance measure in thiscomparison we use the total vessel operation time required to unload and load a ship.This time depends next to crane productivity also on the efficiency of the transportationand storage and retrieval processes in the terminal. We have performed a sensitivityanalysis in which we also study the relation between the selection of an indented berthand other design and control issues in the terminal.
Keywords Container terminals · Indented berth · Performance analysis ·Design · Simulation
I. F. A. Vis (B) · R. G. van AnholtDepartment of Information Systems and Logistics,Faculty of Economics and Business Administration,VU University Amsterdam, De Boelelaan 1105,1081 HV Amsterdam, The Netherlandse-mail: [email protected]
R. G. van Anholte-mail: [email protected]
123

454 I. F. A. Vis, R. G. van Anholt
1 Introduction
Since the 1950s, more and more cargo is being containerized and export and importis increasing on a global scale. The high growth rate of containerized trade is morerecently initiated by the uprising of the Far East. The capacity of ships has beenextended up to 12,000 twenty feet equivalent unit container (TEU) to ensure that allcontainers can be transported worldwide from port to port. Ports should be responsiveand on guard to handle and to transship these massive volumes of containers. Dockingtimes of ships should be as short as possible to satisfy carriers and the shippers ofcontainerized goods. In other words, all terminal processes should be performed asefficiently as possible.
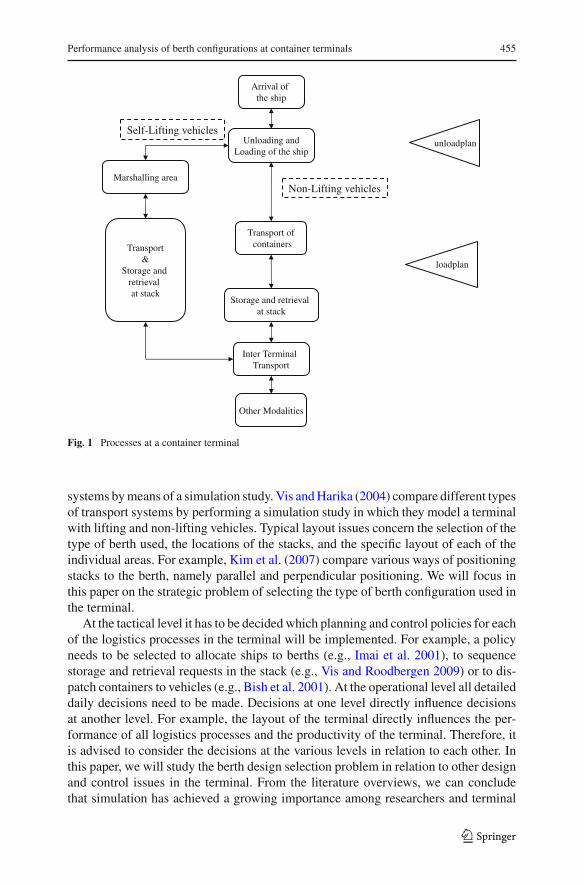
These processes are illustrated in Fig. 1 and can be described as follows. An arrivingship will moor at a berth. Quay cranes are positioned on the quays at the berth. Thesecranes unload containers according to an unload plan. Next, these containers need tobe transported to the storage area (i.e., stack). Different types of transport systems canbe used. When a terminal uses vehicles without lifting capabilities (e.g., automatedguided vehicles), a vehicle needs to be available to receive the container the momentthe container has been taken out off the ship’s hold or deck. In that way delays in theunloading process can be limited. Consequently, the (un-)loading and transportationprocesses depend on each other. Self-lifting vehicles (e.g., straddle carriers) are ableto lift a container from the ground. When such a type of vehicle is deployed, quaycranes will position retrieved containers at a marshalling area at the quay. Here, the(un-)loading and transportation processes are decoupled. A marshalling area usuallyhas a finite capacity which depends on the available space at the quay. A self-liftingvehicle needs to lift a container before this area is completely full. In that way, a quaycrane can continue its operation without any delays.
The transport vehicles transship the containers to the stack to be stored. A stackconsists of multiple blocks of containers. Each block of containers has multiple par-allel rows, each with a fixed number of storage locations. Containers will be storedtemporarily upon further transportation to their (final) destinations by other modes oftransportation. Different types of storage equipment can be used to store and retrievecontainers from the stack. (Automated) yard cranes span multiple rows of containers.They receive containers from the transport vehicles and store them into the stack. Ifself-lifting vehicles execute the transportation process, it can be decided to have themstore the containers in the stack by themselves. All processes can be executed in areverse order to load containers on a ship. A load plan indicates the order in whichcontainers should be loaded on the ship.
Terminal management needs to address multiple decision problems to design anefficient container terminal. Vis and De Koster (2003), Steenken et al. (2004) andmore recently Stahlbock and Voss (2008) provide an overview of all relevant decisionproblems and related literature. As described in Vis and De Koster (2003), three plan-ning and control levels can be distinguished in this design process. At the strategiclevel, long-term decisions are taken which are mainly related to the terminal layoutand selection of the transport and storage systems to be used. The selection of thetransport and storage systems directly influences the way all logistics processes willbe performed as explained in Fig. 1. Vis (2006) compares different types of storage
123
Performance analysis of berth configurations at container terminals 455
Arrival of the ship
Unloading andLoading of the ship
Transport ofcontainers
Storage and retrieval at stack
Inter Terminal Transport
Other Modalities
unloadplan
loadplan
Marshalling area
Transport&
Storage and retrieval at stack
Self-Lifting vehicles
Non-Lifting vehicles
Fig. 1 Processes at a container terminal
systems by means of a simulation study. Vis and Harika (2004) compare different typesof transport systems by performing a simulation study in which they model a terminalwith lifting and non-lifting vehicles. Typical layout issues concern the selection of thetype of berth used, the locations of the stacks, and the specific layout of each of theindividual areas. For example, Kim et al. (2007) compare various ways of positioningstacks to the berth, namely parallel and perpendicular positioning. We will focus inthis paper on the strategic problem of selecting the type of berth configuration used inthe terminal.
At the tactical level it has to be decided which planning and control policies for eachof the logistics processes in the terminal will be implemented. For example, a policyneeds to be selected to allocate ships to berths (e.g., Imai et al. 2001), to sequencestorage and retrieval requests in the stack (e.g., Vis and Roodbergen 2009) or to dis-patch containers to vehicles (e.g., Bish et al. 2001). At the operational level all detaileddaily decisions need to be made. Decisions at one level directly influence decisionsat another level. For example, the layout of the terminal directly influences the per-formance of all logistics processes and the productivity of the terminal. Therefore, itis advised to consider the decisions at the various levels in relation to each other. Inthis paper, we will study the berth design selection problem in relation to other designand control issues in the terminal. From the literature overviews, we can concludethat simulation has achieved a growing importance among researchers and terminal
123

456 I. F. A. Vis, R. G. van Anholt
Quay cranes
Stack blocks
Q4
Q3
Q2
Q1
S3
S2
S1
S6
S5
S4
Fig. 2 Marginal berth with stacks (specific numbers will be introduced in Sect. 2)
operators to compare layout and system alternatives, to test optimization methods andto study the impact of one decision on another (Steenken et al. 2004).
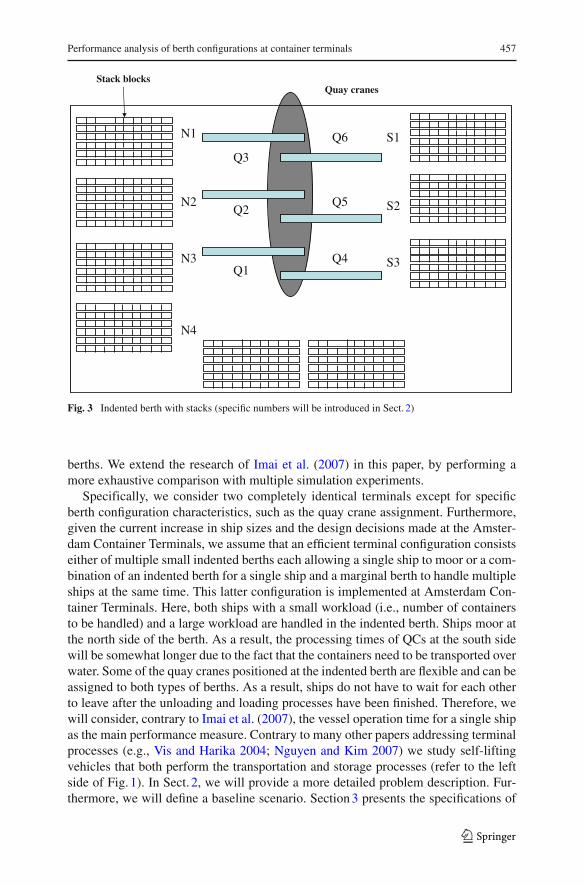
The objective of this research is to study the strategic decision problem of select-ing a type of berth for a container terminal. We perform a comparative analysis onvarious types of berth configurations by means of a simulation and study the impacton the logistics processes in the rest of the terminal. A traditional berth, also referredto as a marginal berth, consists of a single quay where ships can moor. An indentedberth has quays at three sides of the ship. This type of berth enables quay cranes tounload and load ships at both sides of the ship and to stack containers around the ship.As a result, more quay cranes can work simultaneously on a single ship. If all otherterminal processes are designed well (i.e., layout, amount of equipment and controlpolicies) it might be expected that the terminal productivity will increase comparedto a marginal berth. Possible designs for terminals with marginal and indented berthsare, respectively, depicted in Figs. 2 and 3. Worldwide only the Amsterdam ContainerTerminals (formerly: Ceres Paragon Terminal) in Amsterdam, The Netherlands hasan indented berth. Therefore, we use data obtained from this terminal in our research.
Imai et al. (2007) were among the first authors to study an indented berth. Theauthors study the berth allocation problem in indented berths. The model allows formultiple ships to moor at this type of berth at the same time. A direct consequence isthat the inner most ship at the berth never can leave earlier than the outer most ships.Given this specific constraint and assumptions on different space requirements for eachtype of berth, the authors perform a simulation study to compare both types of berths.It is concluded that the total service time for serving multiple ships at the same time ishigher with an indented berth due to waiting times. In their experiments, the authorsassume that a large ship in an indented berth actually occupies cranes operating at twoberths. As a result, fewer ships can be handled at the same time compared to marginal
123
Performance analysis of berth configurations at container terminals 457
Quay cranesStack blocks
S3
S2
S1
N3
N2
N1
N4
Q1
Q2
Q3
Q6
Q5
Q4
Fig. 3 Indented berth with stacks (specific numbers will be introduced in Sect. 2)
berths. We extend the research of Imai et al. (2007) in this paper, by performing amore exhaustive comparison with multiple simulation experiments.
Specifically, we consider two completely identical terminals except for specificberth configuration characteristics, such as the quay crane assignment. Furthermore,given the current increase in ship sizes and the design decisions made at the Amster-dam Container Terminals, we assume that an efficient terminal configuration consistseither of multiple small indented berths each allowing a single ship to moor or a com-bination of an indented berth for a single ship and a marginal berth to handle multipleships at the same time. This latter configuration is implemented at Amsterdam Con-tainer Terminals. Here, both ships with a small workload (i.e., number of containersto be handled) and a large workload are handled in the indented berth. Ships moor atthe north side of the berth. As a result, the processing times of QCs at the south sidewill be somewhat longer due to the fact that the containers need to be transported overwater. Some of the quay cranes positioned at the indented berth are flexible and can beassigned to both types of berths. As a result, ships do not have to wait for each otherto leave after the unloading and loading processes have been finished. Therefore, wewill consider, contrary to Imai et al. (2007), the vessel operation time for a single shipas the main performance measure. Contrary to many other papers addressing terminalprocesses (e.g., Vis and Harika 2004; Nguyen and Kim 2007) we study self-liftingvehicles that both perform the transportation and storage processes (refer to the leftside of Fig. 1). In Sect. 2, we will provide a more detailed problem description. Fur-thermore, we will define a baseline scenario. Section 3 presents the specifications of
123
458 I. F. A. Vis, R. G. van Anholt
the simulation model. Results for all experiments including the baseline scenario anda sensitivity analysis will be described in Sect. 4. Section 5 presents conclusions.
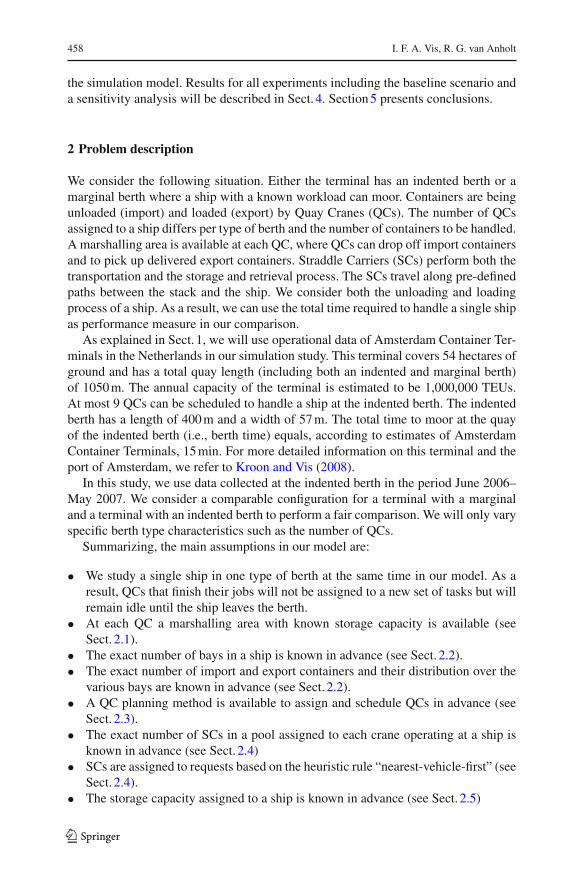
2 Problem description
We consider the following situation. Either the terminal has an indented berth or amarginal berth where a ship with a known workload can moor. Containers are beingunloaded (import) and loaded (export) by Quay Cranes (QCs). The number of QCsassigned to a ship differs per type of berth and the number of containers to be handled.A marshalling area is available at each QC, where QCs can drop off import containersand to pick up delivered export containers. Straddle Carriers (SCs) perform both thetransportation and the storage and retrieval process. The SCs travel along pre-definedpaths between the stack and the ship. We consider both the unloading and loadingprocess of a ship. As a result, we can use the total time required to handle a single shipas performance measure in our comparison.
As explained in Sect. 1, we will use operational data of Amsterdam Container Ter-minals in the Netherlands in our simulation study. This terminal covers 54 hectares ofground and has a total quay length (including both an indented and marginal berth)of 1050 m. The annual capacity of the terminal is estimated to be 1,000,000 TEUs.At most 9 QCs can be scheduled to handle a ship at the indented berth. The indentedberth has a length of 400 m and a width of 57 m. The total time to moor at the quayof the indented berth (i.e., berth time) equals, according to estimates of AmsterdamContainer Terminals, 15 min. For more detailed information on this terminal and theport of Amsterdam, we refer to Kroon and Vis (2008).
In this study, we use data collected at the indented berth in the period June 2006–May 2007. We consider a comparable configuration for a terminal with a marginaland a terminal with an indented berth to perform a fair comparison. We will only varyspecific berth type characteristics such as the number of QCs.
Summarizing, the main assumptions in our model are:
• We study a single ship in one type of berth at the same time in our model. As aresult, QCs that finish their jobs will not be assigned to a new set of tasks but willremain idle until the ship leaves the berth.
• At each QC a marshalling area with known storage capacity is available (seeSect. 2.1).
• The exact number of bays in a ship is known in advance (see Sect. 2.2).• The exact number of import and export containers and their distribution over the
various bays are known in advance (see Sect. 2.2).• A QC planning method is available to assign and schedule QCs in advance (see
Sect. 2.3).• The exact number of SCs in a pool assigned to each crane operating at a ship is
known in advance (see Sect. 2.4)• SCs are assigned to requests based on the heuristic rule “nearest-vehicle-first” (see
Sect. 2.4).• The storage capacity assigned to a ship is known in advance (see Sect. 2.5)
123

Performance analysis of berth configurations at container terminals 459
Discharging process
QCs tranship import containers from ship
to shore
Containers are picked up by SCs
Containers are dropped into the
stack by SCs
If a QC finishes discharging, it can start loading export
containers
The SCs retrieve export containers
from the stack
Containers are transported to the
stack by SCs
The SCs transport the export
containers to the QCs
The SCs drop the export containers
under the QCs in a buffer area
QCs tranship export containers from the
shore onto the vessel
Arrival ship
Departure ship
Loading process
Fig. 4 Schematic overview of processes to handle a single ship which will be incorporated in the simulationmodel
Terminal configurations and relevant input data for each type of berth are known inadvance and specified in the remainder of this section.
2.1 Terminal configuration and processes
Figure 4 provides a general overview of all terminal processes incorporated in thesimulation study. The processes start with unloading (i.e., discharging) the ship andtransporting the containers to the stack. When a QC finishes unloading, the loadingprocess for that QC can start. As a result, it might occur that one QC is still unloadingwhile the other one already started with the loading process.
SCs transport the containers to the ship. The model ends when the final containerhas been loaded on the ship. These processes match the general process description asprovided in Sect. 1. The terminal layouts of a marginal and indented berth are repre-sented in respectively Figs. 2 and 3. In the terminal, respectively, six and seven stackblocks with a similar total stack capacity (see Sect. 2.5) has been assigned for thevessel operations. Namely, stack blocks N1–N4 at the north side of the berth and stackblocks S1–S3 at the south side of the berth are used for ships at the indented berth. Themarginal berth uses six stack blocks S1–S6 at the south side of the berth. At each QC,a marshalling area is located to position containers. The capacity differs per side of theberth and equals either 2 (north side of indented berth) or 3 (south side of the indented
123
460 I. F. A. Vis, R. G. van Anholt
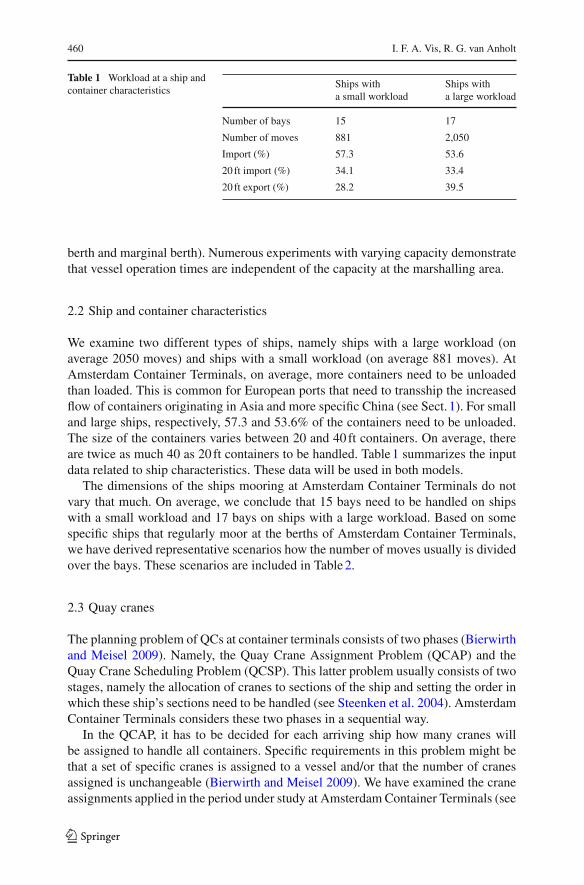
Table 1 Workload at a ship andcontainer characteristics
Ships with Ships witha small workload a large workload
Number of bays 15 17
Number of moves 881 2,050
Import (%) 57.3 53.6
20 ft import (%) 34.1 33.4
20 ft export (%) 28.2 39.5
berth and marginal berth). Numerous experiments with varying capacity demonstratethat vessel operation times are independent of the capacity at the marshalling area.
2.2 Ship and container characteristics
We examine two different types of ships, namely ships with a large workload (onaverage 2050 moves) and ships with a small workload (on average 881 moves). AtAmsterdam Container Terminals, on average, more containers need to be unloadedthan loaded. This is common for European ports that need to transship the increasedflow of containers originating in Asia and more specific China (see Sect. 1). For smalland large ships, respectively, 57.3 and 53.6% of the containers need to be unloaded.The size of the containers varies between 20 and 40 ft containers. On average, thereare twice as much 40 as 20 ft containers to be handled. Table 1 summarizes the inputdata related to ship characteristics. These data will be used in both models.
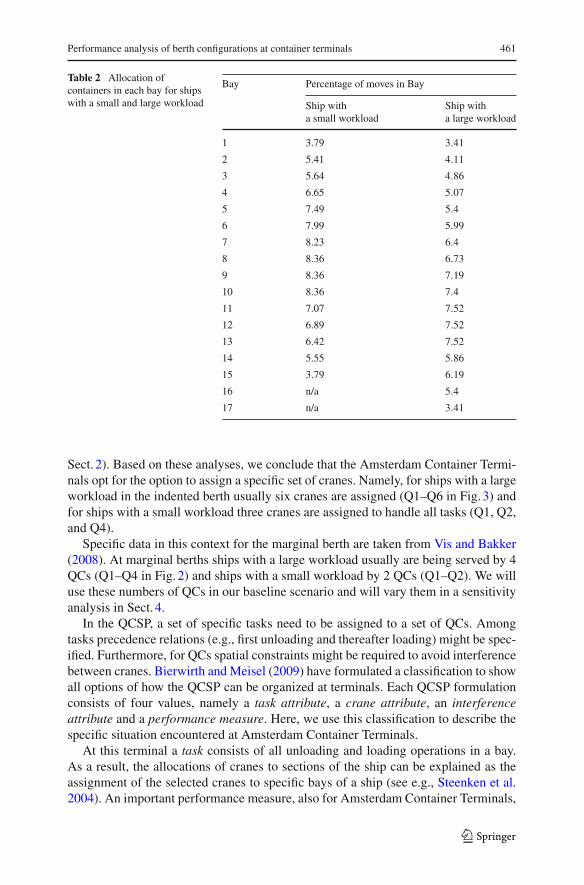
The dimensions of the ships mooring at Amsterdam Container Terminals do notvary that much. On average, we conclude that 15 bays need to be handled on shipswith a small workload and 17 bays on ships with a large workload. Based on somespecific ships that regularly moor at the berths of Amsterdam Container Terminals,we have derived representative scenarios how the number of moves usually is dividedover the bays. These scenarios are included in Table 2.
2.3 Quay cranes
The planning problem of QCs at container terminals consists of two phases (Bierwirthand Meisel 2009). Namely, the Quay Crane Assignment Problem (QCAP) and theQuay Crane Scheduling Problem (QCSP). This latter problem usually consists of twostages, namely the allocation of cranes to sections of the ship and setting the order inwhich these ship’s sections need to be handled (see Steenken et al. 2004). AmsterdamContainer Terminals considers these two phases in a sequential way.
In the QCAP, it has to be decided for each arriving ship how many cranes willbe assigned to handle all containers. Specific requirements in this problem might bethat a set of specific cranes is assigned to a vessel and/or that the number of cranesassigned is unchangeable (Bierwirth and Meisel 2009). We have examined the craneassignments applied in the period under study at Amsterdam Container Terminals (see
123
Performance analysis of berth configurations at container terminals 461
Table 2 Allocation ofcontainers in each bay for shipswith a small and large workload
Bay Percentage of moves in Bay
Ship with Ship witha small workload a large workload
1 3.79 3.41
2 5.41 4.11
3 5.64 4.86
4 6.65 5.07
5 7.49 5.4
6 7.99 5.99
7 8.23 6.4
8 8.36 6.73
9 8.36 7.19
10 8.36 7.4
11 7.07 7.52
12 6.89 7.52
13 6.42 7.52
14 5.55 5.86
15 3.79 6.19
16 n/a 5.4
17 n/a 3.41
Sect. 2). Based on these analyses, we conclude that the Amsterdam Container Termi-nals opt for the option to assign a specific set of cranes. Namely, for ships with a largeworkload in the indented berth usually six cranes are assigned (Q1–Q6 in Fig. 3) andfor ships with a small workload three cranes are assigned to handle all tasks (Q1, Q2,and Q4).
Specific data in this context for the marginal berth are taken from Vis and Bakker(2008). At marginal berths ships with a large workload usually are being served by 4QCs (Q1–Q4 in Fig. 2) and ships with a small workload by 2 QCs (Q1–Q2). We willuse these numbers of QCs in our baseline scenario and will vary them in a sensitivityanalysis in Sect. 4.
In the QCSP, a set of specific tasks need to be assigned to a set of QCs. Amongtasks precedence relations (e.g., first unloading and thereafter loading) might be spec-ified. Furthermore, for QCs spatial constraints might be required to avoid interferencebetween cranes. Bierwirth and Meisel (2009) have formulated a classification to showall options of how the QCSP can be organized at terminals. Each QCSP formulationconsists of four values, namely a task attribute, a crane attribute, an interferenceattribute and a performance measure. Here, we use this classification to describe thespecific situation encountered at Amsterdam Container Terminals.
At this terminal a task consists of all unloading and loading operations in a bay.As a result, the allocations of cranes to sections of the ship can be explained as theassignment of the selected cranes to specific bays of a ship (see e.g., Steenken et al.2004). An important performance measure, also for Amsterdam Container Terminals,
123
462 I. F. A. Vis, R. G. van Anholt
is an economic utilization of the cranes. A set of tasks will be scheduled per QC andin the resulting schedules it will be indicated that the bays will be handled one by onewhile working in one direction along the ship. Initial positions of cranes are known.Furthermore, specific safety margins between QCs are respected to avoid interference.Namely, opposite cranes need to have one 40 ft bay in between. Cranes that work nextto each other need to have two bays in between. An important performance mea-sure is the finishing time of a QC, which is being recorded by Amsterdam ContainerTerminals.
The following heuristic is applied to solve the QCSP problem at Amsterdam Con-tainer Terminals.
1. Each crane is assigned to a set of bays such that (1) a well-balanced workload overthe cranes is obtained; (2) each crane can directly start operations without inter-fering with opposite and neighboring cranes; (3) each bay is exclusively servedby one QC.
2. Each QC unloads bay by bay. In a bay a QC unloads vertically from the inner tothe outer site of a bay.
3. To avoid crossing, QCs move from bay to bay in an identical direction along thevessel (i.e., unidirectional schedules, Meisel and Bierwirth 2009). After handlinga specific bay, the QC needs to cross to the next bay. Idle times might occur dueto the fact that the QC might need to wait to confirm the space constraints and toavoid interference with the cranes.
4. After finishing unloading, a QC starts loading bay by bay while working exactlythe other way round.
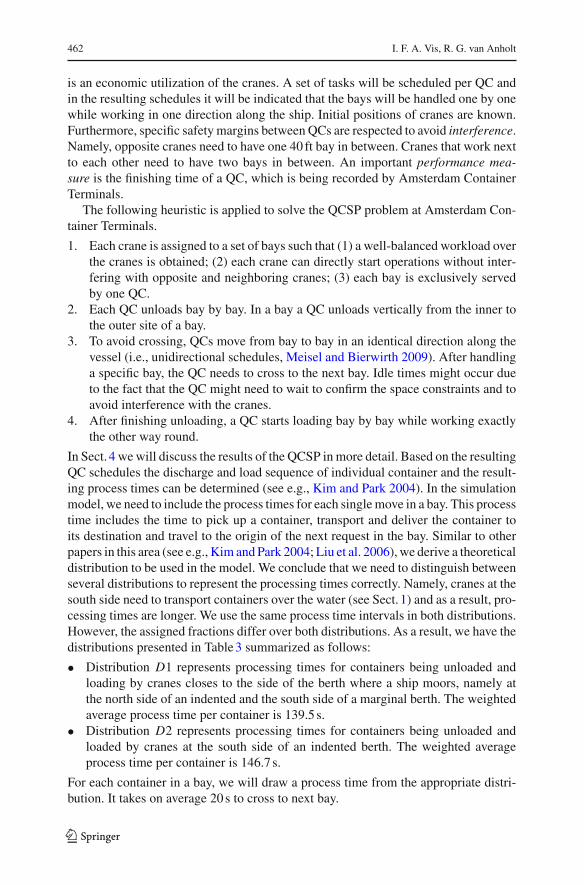
In Sect. 4 we will discuss the results of the QCSP in more detail. Based on the resultingQC schedules the discharge and load sequence of individual container and the result-ing process times can be determined (see e.g., Kim and Park 2004). In the simulationmodel, we need to include the process times for each single move in a bay. This processtime includes the time to pick up a container, transport and deliver the container toits destination and travel to the origin of the next request in the bay. Similar to otherpapers in this area (see e.g., Kim and Park 2004; Liu et al. 2006), we derive a theoreticaldistribution to be used in the model. We conclude that we need to distinguish betweenseveral distributions to represent the processing times correctly. Namely, cranes at thesouth side need to transport containers over the water (see Sect. 1) and as a result, pro-cessing times are longer. We use the same process time intervals in both distributions.However, the assigned fractions differ over both distributions. As a result, we have thedistributions presented in Table 3 summarized as follows:
• Distribution D1 represents processing times for containers being unloaded andloading by cranes closes to the side of the berth where a ship moors, namely atthe north side of an indented and the south side of a marginal berth. The weightedaverage process time per container is 139.5 s.
• Distribution D2 represents processing times for containers being unloaded andloaded by cranes at the south side of an indented berth. The weighted averageprocess time per container is 146.7 s.
For each container in a bay, we will draw a process time from the appropriate distri-bution. It takes on average 20 s to cross to next bay.
123

Performance analysis of berth configurations at container terminals 463
Table 3 Empirical distributionsD1 and D2 of process times ofQCs operating at the north sideof an indented berth or the southside of the marginal berth(see Figs. 2 and 3)
D1 fraction D2 fraction Interval (s)
Lower bound Upper bound
0.034 0.041 50.0 63.7
0.070 0.063 63.7 77.4
0.135 0.111 77.4 91.1
0.164 0.142 91.1 104.8
0.147 0.143 104.8 118.5
0.101 0.100 118.5 132.2
0.066 0.074 132.2 145.9
0.054 0.058 145.9 159.6
0.038 0.044 159.6 173.3
0.027 0.031 173.3 187.0
0.024 0.025 187.0 200.7
0.016 0.023 200.7 214.4
0.017 0.019 214.4 228.1
0.013 0.015 228.1 241.8
0.011 0.011 241.8 255.5
0.012 0.013 255.5 269.2
0.008 0.009 269.2 282.9
0.008 0.009 282.9 296.6
0.006 0.008 296.6 310.3
0.005 0.005 310.3 324.0
0.004 0.005 324.0 337.7
0.004 0.005 337.7 351.4
0.004 0.006 351.4 365.1
0.003 0.004 365.1 378.8
0.003 0.005 378.8 392.5
0.003 0.004 392.5 406.2
0.003 0.004 406.2 419.9
0.002 0.004 419.9 433.6
0.001 0.002 433.6 447.3
0.002 0.002 447.3 461.0
0.003 0.002 461.0 474.7
0.002 0.002 474.7 488.4
0.001 0.002 488.4 502.1
0.001 0.002 502.1 515.8
0.002 0.002 515.8 529.5
0.001 0.001 529.5 543.2
0.001 0.001 543.2 556.9
0.001 0.001 556.9 570.6
0.002 0.001 570.6 584.3
0.001 0.001 584.3 598.0
123

464 I. F. A. Vis, R. G. van Anholt
Table 4 Distances (in m) in theterminal with a marginal berthbetween stack and ship (and viceversa) (see also Fig. 2)
From/to S1 S2 S3 S4 S5 S6
S1
S2 208
S3 333 185
S4 278 280 437
S5 284 286 291 168
S6 440 290 295 324 178
Q1 51 150 80 417 271 275
Q2 223 75 170 325 271 275
Q3 133 105 260 235 241 365
Q4 51 199 354 299 305 461
In Sect. 3, we will explain how we have modeled the QCSP method in our simulationapproach.
2.4 Straddle carriers
SCs transport one container at a time. Per QC a pool of 3 SCs is used and as a result anSC only works for a specific QC. We have performed multiple experiments to selectone out of the commonly used heuristic rules “nearest vehicle first”, “random”, “cycli-cal” and “Largest distance first” (e.g., Egbelu and Tanchoco 1984). The results showedthat none of the selection rules outperforms the other ones. The main reason for this isthat a container requests an empty SC from a small pool of vehicles. The probabilitythat multiple empty vehicles are available at the same time is small. As a result, mostof the time each selection rule will result in the same assignment. Based on theseresults, we have decided to apply the rule “nearest-vehicle-first” in all experiments.
An SC will be assigned to a container the moment the QC starts unloading thecontainer. An SC will transport the container to its destination via the shortest path.Distances for a marginal berth are given in Table 4. Distances in the terminal with anindented berth are represented in Table 5. An SC needs 22 s to pick up or put down acontainer at the marshalling area (Vis and Harika 2004).
2.5 Stack and storage capacity
Import containers will be transported to one of the stack blocks. In each block, wedistinguish between specific rows for 20 and 40 ft containers. Given the average dis-tribution of 20 and 40 ft containers in the terminal (see Table 1) we assume that ineach stack block after each four rows of 40 ft containers, one row is assigned to 20 ftcontainers. The stacking height equals 3. Stack capacity in each of the blocks dependson the type of berth and is indicated in Table 6. The total storage capacity is similarfor both types of berths.
123

Performance analysis of berth configurations at container terminals 465
Table 5 Distances (in m) in theterminal with an indented berthbetween stack and ship (and viceversa) (see also Fig. 3)
From/to N1 N2 N3 N4 S1 S2 S3
N1 x
N2 x x
N3 299 154 x
N4 381 236 x x
S1 x x 565 562 x
S2 x x 420 417 x x
S3 513 367 x x 331 186 x
Q1 266 121 94 175 x x 328
Q4 x x 405 402 221 76 171
Q2 175 60 184 266 x x 419
Q5 x x 496 493 130 106 262
Q3 85 151 275 357 x x 510
Q6 x x 587 584 51 197 352
Table 6 Storage capacity ofeach of the stack blocks(see Figs. 2 and 3)
20 feet 40 feet
Indented
N1 228 444
N2 252 504
N3 168 294
N4 84 189
Indented and marginal
S1 252 504
S2 252 504
S3 294 567
Marginal
S4 252 504
S5 252 504
S6 294 567
The time to pick up an export container or to store an import container in thestack including driving times equals on average 58 s [calculated with operational dataobtained from Vis and Harika (2004)]. Import containers will be stored in the stackwhich is nearest to the marshalling area and that still has an empty spot available.Rows in each stack block will be filled one by one. Export containers will be ran-domly picked from stacks S3, N3, and N4 (for the indented berth) and S1, S2, and S3(for the marginal berth). These stack blocks are located closest to the head side of theberth.
We have performed an extensive sensitivity analysis on the values of the input vari-ables in Table 1 to study their impact on the results in relation to various performancemeasures. We have concluded that the outcomes are insensitive to the values of the
123

466 I. F. A. Vis, R. G. van Anholt
various input parameters and, therefore, we used the values as described in this sectionin our simulation model and experiments. The values of the other more design orientedinput data as defined here will be used in a baseline scenario.
3 Simulation model
We have used Arena 11.0 as simulation software. We have created two simulationmodels, one for the indented berth and one for the marginal berth. The input data asdescribed in Sect. 2 has been used in the models. As indicated in Fig. 4, we considerboth the unloading and loading processes of a ship, which are similar for both types ofberths. Different modeling techniques are required for these two processes and there-fore, we discuss them subsequently. Based on the description in Sect. 2, Fig. 5 presentsa schematic overview of all steps related to the unloading process to be included inthe simulation model. This overview can be summarized as follows by using somespecific Arena terminology (in italic) to illustrate how the various elements have beenmodeled.
The model starts with the arrival of a ship. As discussed, a fixed number of con-tainers to be unloaded are created. It is being decided if the container is a 20 or 40 ftcontainer (see Table 1). A fixed number of QCs handle all containers. Each containeris assigned to a specific bay as described in Sect. 2 and indicated in Table 2. Next tothat, each QC is assigned to a bay following the guidelines as mentioned in step 1 ofthe QCSP being performed.
The container in the first bay seizes a QC. When the QC starts unloading this con-tainer, an SC (belonging to the pool of vehicles of this QC) is seized to transport thecontainer. The container is delayed by the QC during a certain process time dependingon the physical location of the crane (see Table 3). The QC needs to decide if thereis place in the marshalling area and might be delayed if no empty spot is available.The QC will be released by the container the moment the container is available at themarshalling area and can start a new job in the same bay according to the specifiedorder as illustrated in Sect. 2. If both the SC has arrived and the container is availableat the marshalling area, than the SC can pick up the container. Before the SC leaves,the nearest available place in one of the stacks is assigned to the container. The SCdrives into the stack to place the container on its assigned location which will take aspecified handling time (see Sect. 2). The SC will be released by the container and canstart a new transportation task for its QC. If all assigned import containers in a specificbay are handled by a QC, then the QC can move to the next bay and start unloadingcontainers in that bay. However, first it needs to be decided if the QC can move to thenext bay. If not, the QC waits and regularly it is checked if the QC can move to thenext bay. This specific QC waiting time is considered as a special type of idle timeand will be recorded separately. If all unloading containers in all assigned bays arehandled by a QC, the QC can start with the loading process. Consequently, unloadingand loading can take place at the same time in the terminal.
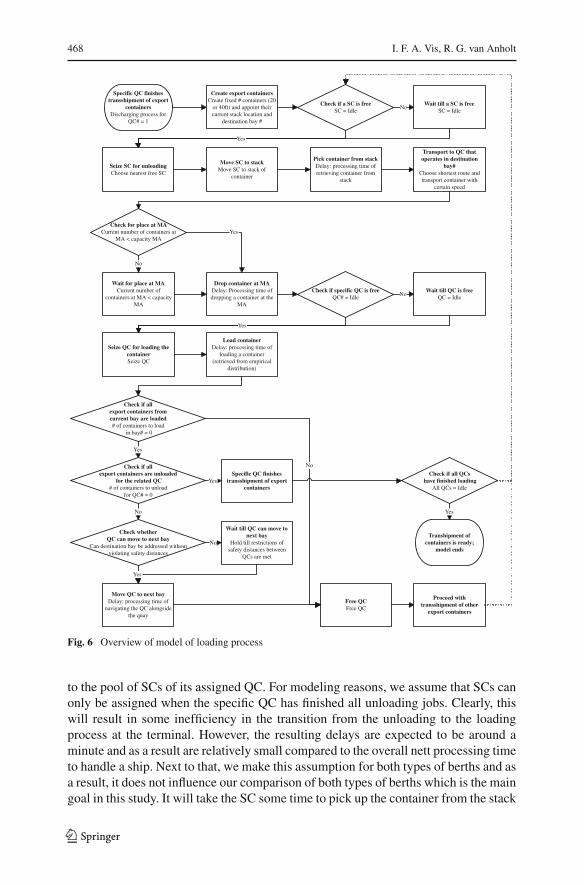
The loading process is depicted in Fig. 6. For each export container, it has to bedecided which QC needs to load the container. Furthermore, it has to be decided whichsize the container has and where it is stored. The container requests an SC that belongs
123

Performance analysis of berth configurations at container terminals 467
Wait till QC is freeQC = Idle
Create import containersCreate fixed # entities, either
20 or 40ft containers and appoint their bay #
Ship moors at quayCheck for each
QC if the status is idleQC# = Idle
No
Seize QC for unloadingSeize QC
Check if a SC is freeSC = Idle
Yes
Wait till a SC is freeSC = Idle
No
Seize SC for unloadingChoose nearest free SC
Yes
Move SC to QCMove SC to MA
(Marshalling Area) beneath QC
Wait till QC dropped container
Wait for signal that QC placed container at MA
Unload containerDelay: processing time of
unloading a container (retrieved from empirical
distribution)
Check for place at MACurrent number of containers at
MA < capacity MA
Wait for place at MACurrent number of
containers at MA < capacity MA
No
Drop container at MAGive signal that QC is
placed at the MA
Pick up containerDelay: processing time of
picking up container
Yes
Choose stack locationChoose stack, stackbox and street. Selection based on closest street with empty
places
Transport to stack locationChoose shortest route and transport container with
certain speed
Choose specific spot in stack
Depending on size (20/40ft) a free location is chosen up
to 3 high
Place container in stackDelay: processing time of
stacking container with SC
Free SCFree SC
Check if allimport containers from
current bay are unloaded# of containers to unload
in bay# = 0
Yes
Check whetherQC can move to next bay
Can destination bay be addressed without violating safety distances
Wait till QC can move to next bay
Hold till restrictions of distance between QCs are
met
Move QC to next bayDelay: processing time of
navigating the QC alongside the quay
No
Yes
Free QCFree QC
No
Specific QC finishes transshipment of import
containersDischarging process for
QC# = 1
Proceed with transshipment of other
importcontainers
Check if allimport containers are unloaded
for the related QC# of containers to
unload for QC# = 0
No
Yes
Fig. 5 Overview of model of unloading process
123
468 I. F. A. Vis, R. G. van Anholt
Create export containersCreate fixed # containers (20
or 40ft) and appoint their current stack location and
destination bay #
Specific QC finishes transshipment of export
containersDischarging process for
QC# = 1
Check if a SC is freeSC = Idle
Wait till a SC is freeSC = Idle
No
Seize SC for unloadingChoose nearest free SC
Yes
Move SC to stackMove SC to stack of
container
Pick container from stackDelay: processing time of retrieving container from
stack
Transport to QC that operates in destination
bay#Choose shortest route and transport container with
certain speed
Check for place at MACurrent number of containers at
MA < capacity MA
Wait for place at MACurrent number of
containers at MA < capacity MA
No
Drop container at MADelay: Processing time of dropping a container at the
MA
Yes
Wait till QC is freeQC = Idle
Check if specific QC is freeQC# = Idle
No
Seize QC for loading the containerSeize QC
Yes
Load containerDelay: processing time of
loading a container (retrieved from empirical
distribution)
Check if allexport containers fromcurrent bay are loaded# of containers to load
in bay# = 0
Yes
Check whetherQC can move to next bay
Can destination bay be addressed without violating safety distances
Wait till QC can move to next bay
Hold till restrictions of safety distances between
QCs are met
Move QC to next bayDelay: processing time of
navigating the QC alongside the quay
No
Free QCFree QC
No
Yes
Check if allexport containers are unloaded
for the related QC# of containers to unload
for QC# = 0
No
Transhipment of containers is ready;
model ends
Specific QC finishes transshipment of export
containersYes
Proceed with transshipment of other
export containers
Check if all QCs have finished loading
All QCs = Idle
Yes
Fig. 6 Overview of model of loading process
to the pool of SCs of its assigned QC. For modeling reasons, we assume that SCs canonly be assigned when the specific QC has finished all unloading jobs. Clearly, thiswill result in some inefficiency in the transition from the unloading to the loadingprocess at the terminal. However, the resulting delays are expected to be around aminute and as a result are relatively small compared to the overall nett processing timeto handle a ship. Next to that, we make this assumption for both types of berths and asa result, it does not influence our comparison of both types of berths which is the maingoal in this study. It will take the SC some time to pick up the container from the stack
123

Performance analysis of berth configurations at container terminals 469
(see Sect. 2). Thereafter, the container is being transported to the marshalling area. Ifsufficient place is available at the marshalling area the container will be dropped off,which will take a specified time (see Sect. 2). Otherwise, the SC will be delayed untilan empty spot becomes available. After being released by the container, the straddlecarrier can start a new transportation request. The QCs have the final task to place thecontainers onto the ship which will take a certain process time as specified in Table 3.Similar to the unloading process, it needs to be checked before moving to the next bayif this will not result in interference between cranes.
All process times involved in the model are modeled as a delay, except the transportprocess between the border of the stack and the marshalling area. This quay side trans-port is modeled with the use of guided vehicles. All distances involved are representedin Tables 4 and 5.
We assume in both models that all equipment and staff are continuously in opera-tion without break-downs and breaks. As a result, we will use the nett time requiredto handle a ship as performance measure for both models. Using the data providedin Sect. 2 and the simulation model described here, we have created a baseline sce-nario for both types of berths. We will discuss in the next section the results for bothconfigurations.
4 Results
In this section, we report results of multiple experiments that have been performed.First, we discuss how we validated our model and we introduce relevant performancemeasures. Second, we present the results of a baseline scenario. Finally, we study therelation between selecting an indented berth and other control issues in the terminal.
4.1 Model validation
We have performed two steps to validate our model. First of all, an extensive sensitivityanalysis has been performed on all input data to be sure that changes in the selectedvalues did not impact the final results. Next to that, we have compared the outcomeswith the actual performance obtained at Amsterdam Container Terminals. It could beconcluded that the model reproduces reality.
4.2 Performance measurement
Several performance measures can be used to compare the two different terminal con-figurations. We can distinguish between internal and external performance measures.Liner services are the core clients of a container terminal. Liner services are judgingcontainer terminals on different aspects. The most important ones are the location,price, and vessel delay.
Vessel delay is the time that a vessel needs to spend at the container terminal to beunloaded and loaded. The docking time indicates the total time required to moor atthe quay, to prepare for and to perform the unloading and loading processes. The timerequired to moor at an indented berth equals 15 min and might be somewhat lowerfor a marginal berth (see Sect. 2). The preparation time can be considered to be equal
123

470 I. F. A. Vis, R. G. van Anholt
for both types of berths. Therefore, the main performance measure under study hereequals the vessel operation time (i.e., actual time required to perform unloading andloading processes). As mentioned in Sect. 3, we exclude break-downs and breaks fromour model. As a result, we study the nett vessel operation time.
Important internal performance measures for the terminal are related to the per-formance of the equipment. SCs and QCs are capital intensive material handlingequipment at terminals and so those utilization rates should be maximized. In caseof a low utility, it might have been more efficient to deploy fewer vehicles and staff.Utilization rates are interrelated to the QC productivity and the vessel operation time,but we have listed them separately.
Summarizing, we use,
• Nett vessel operation time is the actual time required to perform unloading andloading processes excluding breakdowns, breaks, docking and preparation times
• SC utilization is the SC operation time/SC scheduled time• QC utilization is the QC working time/ nett vessel operation time.• QC productivity is the number of moves per hour
The next step is to obtain a reliable comparison between both types of berths we needto simulate multiple ships. Handling a ship can be considered as a terminating systemand as a result multiple replications need to be performed for each experiment. Byusing the formula of Law and Kelton (2000) we have calculated that a replication sizeof 100 is sufficient for all experiments in this paper. Thus, we randomly generate foreach experiment 100 replications and calculate the average value among these 100replications for each of the selected performance measures.
4.3 Baseline situation
For each type of berth, we study the vessel operation times for both a single ship witha small and a large workload. In our simulation study, we simulate one ship at a timeas explained as before. As a result, we have first simulated four scenarios representingthe baseline situation which was defined in Sects. 2 and 3. For each experiment, wehave determined the allocation of QCs to bays based on the specific number of movesin each bay as defined in Table 2 and by applying the heuristic rule as defined in step1 of the QCSP (see Sect. 2.3). The baseline scenario is summarized in Table 7.
As a result, we perform four simulation experiments separately with a sufficientnumber of replications for each one. We distinguish between small and large shipsbeing processed at either a marginal or an indented berth. Consequently, we can exam-ine the performance of a single ship in both types of berths and compare the resultsbetween both types of berths for both types of ships. Figure 7 presents the averagevessel operation times resulting from these experiments.
As shown in Fig. 7, the indented berth outperforms the marginal berth by far. Ves-sels with a large workload are served within 17.58 h by 6 QCs at an indented berth.At a marginal berth it takes 4 QCs on average 24.03 h. Vessels with a small workloadare served within 13.49 h 3 QCs at an indented berth. 2 QCs at a marginal berth use19.40 h on average. A t-test confirms with 99% certainty that the indented and mar-ginal berth differ in vessel operation time. Vessel operation times for vessels with a
123

Performance analysis of berth configurations at container terminals 471
Table 7 Four baseline scenarios describing the assignment of specific cranes, the related distribution D1or D2 for process times of QCs (see Table 3) and the bay assignment resulting from step 1 of the heuristicspecified in Sect. 2.3
Ships with a small workload Ships with a large workload
QC Bay Distribution QC Bay Distributionassignment allocation for process assignment allocation for process
times times
Marginal berth
QC1 B1–B8 D1 QC1 B1–B5 D1
QC2 B9–B15 D1 QC2 B6–B9 D1
QC3 B10–B12 D1
QC4 B13–B17 D1
Indented berth
QC1 B1–B6 D1 QC1 B1–B4 D1
QC4 B7–B10 D2 QC4 B5–B7 D2
QC2 B11–B15 D1 QC2 B8–B9 D1
QC5 B10–B11 D2
QC3 B12–B14 D1
QC6 B15–B17 D2
13.49
19.4017.58
24.03
0.00
5.00
10.00
15.00
20.00
25.00
30.00
Indented - small (3 QCs)
Marginal - small (2 QCs)
Indented - large (6 QCs)
Marginal - large (4 QCs)
Ves
sel o
pera
tion
time
(in
hour
s)
Vessel operation time (in hours)
Fig. 7 Indented versus marginal berth in baseline situation
large workload are 27% lower at an indented berth. Vessels with a small workload canbe served 30% quicker at an indented berth.
At an indented berth more QCs can be deployed since only one bay safety distanceneeds to be retained. Contrary at a marginal berth safety margins of two bays betweenneighboring cranes are defined. QC waiting times (as depicted in Table 8 in italic forthe baseline scenario) to avoid interference at marginal berths are lower due these lessrestricting safety margins. However, the additional waiting times at indented berths aretotally absorbed in lower vessel operation times. It can be noticed that the utilizationof QCs is directly related to the utilization of SCs and at a similar level for both themarginal and indented berth (as depicted in Table 8 in italic for the baseline scenario).
123

472 I. F. A. Vis, R. G. van Anholt
Table 8 Overview of results for the various performance measures for both types of berths with a varyingnumber of QCs (italic: baseline case)
#QCs QC QC SC QC waiting Nett vesselproductivitya utilizationb utilizationc time for QC operation
movement to timee
next bayd
Small-indented
3 24.02 90.7 71.2 0.017 13.49
4 23.34 78.2 61.1 0.882 12.10
5 22.43 85.8 67.5 2.604 9.09
6 20.79 84.9 66.8 5.550 8.35
Small-marginal
2 24.25 93.7 76.9 0.000 19.40
3 24.15 90.8 74.7 0.033 13.38
4 21.87 87.4 72.0 0.046 11.52
Large-indented
3 24.06 92.6 74.7 0.017 30.66
4 23.88 85.2 68.4 0.034 25.27
5 22.77 83.9 67.7 4.316 21.45
6 22.97 84.3 68.1 3.099 17.58
Large-marginal
2 24.31 97.5 81.8 0.000 43.22
3 24.37 91.3 76.9 0.033 30.72
4 24.02 88.7 74.4 0.033 24.03
a The average of ‘the number of moves per QC divided by the QC operation time’ from all QCs (measuredin # moves per hour)b The average of ‘the operating time divided by the vessel operation time’ from all QCs (measured inpercentage)c The average of ‘the operating time divided by the scheduled time’ from all QCs (measured in percentage)d The sum of all waiting times for QC divided by movement to next bay (measured in hours)e Total operation time (measured in hours)
We will elaborate on these conclusion in Sects. 4.4 and 4.5 by varying the number ofequipment assigned to perform operations.
From the results of our baseline scenario, we conclude that more QCs can bedeployed at an indented berth and that vessel operation times will increase accord-ingly despite higher QCs waiting times to avoid QC interferences. Next, we will studythe effects of a varying number of QCs on the various performance measures.
4.4 Varying number of QCs
Table 8 presents an overview of the results of the baseline situation in italic for bothtypes of berths and the results if we vary the number of QCs. The QC productivity
123

Performance analysis of berth configurations at container terminals 473
varies between 20 and 25 moves per hour in both the marginal and indented berth. In allscenarios, we notice that deploying more QCs results in a decreased QC productivity.
For example, increasing the number of QCs from 3 to 6 for a ship with a large work-load at an indented berth results in a decrease of productivity of 4.5%. An importantcause of the reduction of QC productivity is the increasing amount of waiting timesresulting from QCs that wait to safely navigate to subsequent bays. These waitingtimes increase with 181% if we double the number of QCs for a ship with a largeworkload at the indented berth. However, net vessel operation times decrease with43% in this case. We conclude that an increased number of QCs will result in lowervessel operation times although QCs crane drivers will experience higher waitingtimes to avoid crane interference. Consequently, these significant waiting times seemnot impact the vessel operation times as long as they do not concern the bottleneckQC with the highest workload.
Similar figures can be noticed for ships with a small workload at an indented berth.Vessel operation times decrease with 38% while QC productivity decreases with 13%when the number of QCs is altered from 3 to 6. Here, QC waiting times even increasewith 325%. Ships with a small workload have fewer containers to be handled in anumber of bays that is slightly smaller than in ships with a large workload. As a result,QCs will change bays more often.
At marginal berths, we also notice that doubling the number of QCs from 2 to 4results in a decrease in productivity of QCs and vessel operation times. QC waitingtimes at marginal berths are much smaller than at an indented berth. For 2 QCs, thesewaiting times are even zero. This can be explained as follows: workload is equallydistributed over both QCs and for a ship with 15 or 17 bays this clearly results in alarge distance (measured in bays) directly from the start.
So far, we compared vessel operation times for the case in which we assigned aspecific number of QCs to each ship depending on the characteristics of the berthand the QC scheduling approach. As a result, we compared the realistic situation inwhich a higher number of QCs was assigned to a ship in an indented berth than to aship in a marginal berth (see Sect. 4.3). Comparing scenarios with a similar numberof QCs shows that the marginal berth profits from lower waiting times of QCs. Nextto that, QCs at the south side of the indented berth experience, on average, highercycle times due to the transport over water. As a result, marginal berths with a similaramount of QCs deployed will result in somewhat lower vessel operation times. Thisdemonstrates that to profit in an optimal way of the advantages of an indented berth asufficient number of QCs should be assigned to a ship at both sides of the berth.
Utilization rates of material equipment (see Table 8) will usually be lower whenmore equipment is assigned to perform operations. Next to that, in our QC schedul-ing approach we strive for an equal workload distribution which largely defines theutilization rates of both types of material handling equipment. The indented-smallscenario with 4 QCs, however, generates somewhat counter-intuitive results from thisperspective. Although less QCs are deployed, the utilization rates of both QCs andSCs decrease compared to the scenarios with 5 and 6 QCs. So far, we reported theaverage utilization over all QCs. The four individual QCs in this scenario have anaverage utilization rate of, respectively, 99, 78, 71, and 64%. The average workload ofeach QC (expressed in a percentage of the total number of moves) is, respectively, 32,
123
474 I. F. A. Vis, R. G. van Anholt
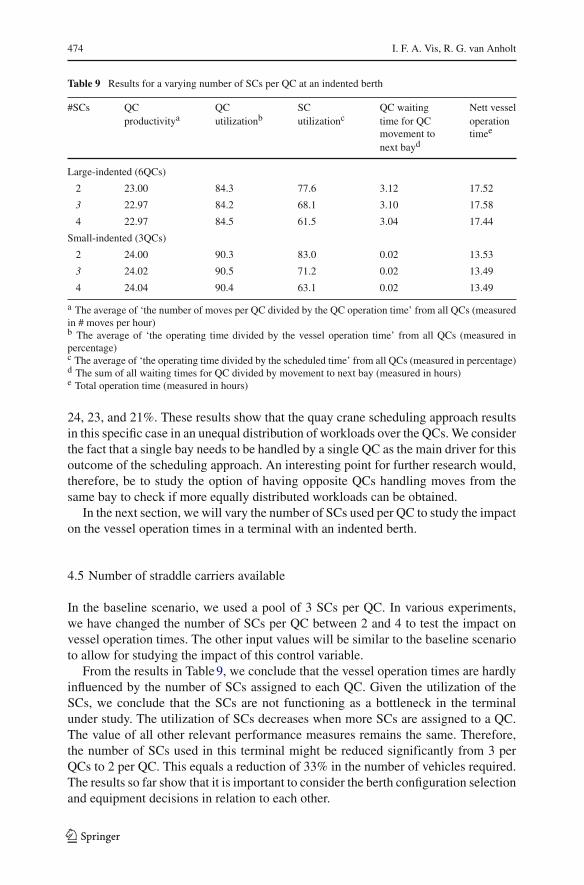
Table 9 Results for a varying number of SCs per QC at an indented berth
#SCs QC QC SC QC waiting Nett vesselproductivitya utilizationb utilizationc time for QC operation
movement to timee
next bayd
Large-indented (6QCs)
2 23.00 84.3 77.6 3.12 17.52
3 22.97 84.2 68.1 3.10 17.58
4 22.97 84.5 61.5 3.04 17.44
Small-indented (3QCs)
2 24.00 90.3 83.0 0.02 13.53
3 24.02 90.5 71.2 0.02 13.49
4 24.04 90.4 63.1 0.02 13.49
a The average of ‘the number of moves per QC divided by the QC operation time’ from all QCs (measuredin # moves per hour)b The average of ‘the operating time divided by the vessel operation time’ from all QCs (measured inpercentage)c The average of ‘the operating time divided by the scheduled time’ from all QCs (measured in percentage)d The sum of all waiting times for QC divided by movement to next bay (measured in hours)e Total operation time (measured in hours)
24, 23, and 21%. These results show that the quay crane scheduling approach resultsin this specific case in an unequal distribution of workloads over the QCs. We considerthe fact that a single bay needs to be handled by a single QC as the main driver for thisoutcome of the scheduling approach. An interesting point for further research would,therefore, be to study the option of having opposite QCs handling moves from thesame bay to check if more equally distributed workloads can be obtained.
In the next section, we will vary the number of SCs used per QC to study the impacton the vessel operation times in a terminal with an indented berth.
4.5 Number of straddle carriers available
In the baseline scenario, we used a pool of 3 SCs per QC. In various experiments,we have changed the number of SCs per QC between 2 and 4 to test the impact onvessel operation times. The other input values will be similar to the baseline scenarioto allow for studying the impact of this control variable.
From the results in Table 9, we conclude that the vessel operation times are hardlyinfluenced by the number of SCs assigned to each QC. Given the utilization of theSCs, we conclude that the SCs are not functioning as a bottleneck in the terminalunder study. The utilization of SCs decreases when more SCs are assigned to a QC.The value of all other relevant performance measures remains the same. Therefore,the number of SCs used in this terminal might be reduced significantly from 3 perQCs to 2 per QC. This equals a reduction of 33% in the number of vehicles required.The results so far show that it is important to consider the berth configuration selectionand equipment decisions in relation to each other.
123
Performance analysis of berth configurations at container terminals 475
5 Conclusions
In this paper, we have studied the effect of different types of berth configurations onvessel operation times at container terminals. We have considered both traditional one-sided berths and indented berths. At the latter type of berth, quay cranes can handlecontainers from both sides of the ship. Straddle carriers both execute the transportationprocess and storage and retrieval processes at the stack. Simulation models for eachtype of berth have been created in which all relevant logistics processes required forunloading and loading a vessel have been implemented.
We demonstrated that for large ships vessel operation times are, on average, 27%lower at an indented berth. Small vessels can be served, on average, 30% quicker at anindented berth. We show that to profit in an optimal way of the double sided handlingof a ship a sufficient number of QCs should be assigned to the ship. We conclude thatvessel operation times decrease when more QCs are deployed, although QC produc-tivity decreases slightly and QC waiting times increase significantly due to increasingwaiting times of QCs to remain the safety distance.
It can be concluded that fewer straddle carriers can be deployed to achieve sim-ilar vessel operation times. Other design aspects seem to have less effect on vesseloperation times. In further research, it might be interesting to consider several designaspects simultaneously. Next to that, a more sophisticated QC scheduling approachmight need to be developed that, for example, allows for splitting the workload of abay by assigning it to opposite cranes to decrease processing times.
Acknowledgments The authors thank Sandra L. J. van Meersbergen for her contribution in the simulationproject that was performed for Amsterdam Container Terminals.
Open Access This article is distributed under the terms of the Creative Commons Attribution Noncom-mercial License which permits any noncommercial use, distribution, and reproduction in any medium,provided the original author(s) and source are credited.
References
Bierwirth C, Meisel F (2009) A survey of berth allocation and quay crane scheduling problems in containerterminals. Eur J Oper Res. doi:10.1016/j.ejor.2009.05.031
Bish EK, Leong T, Li C, Ng JWC, Simchi-Levi D (2001) Analysis of a new vehicle scheduling and locationproblem. Naval Res Logist 48:363–385
Egbelu PJ, Tanchoco JMA (1984) Characterization of automatic guided vehicle dispatching rules. Int JProd Res 22(3):359–374
Imai A, Nishimura E, Papadimitriou S (2001) The dynamic berth allocation problem for a container port.Transport Res Part B 35:401–417
Imai A, Nishimura E, Hattori M, Papadimitriou S (2007) Berth allocation at indented berths for mega-containerships. Eur J Oper Res 179:579–593
Kim KH, Park YM (2004) A crane scheduling method for port container terminals. Eur J Oper Res 156:752–768
Kim KH, Park YM, Jin MJ (2007) An optimal lay-out of container yards. OR Spectr 30(4):675–695Kroon R, Vis IFA (2008) Seriously ceres. In: Ioannou P (eds) Intelligent freight transportation, Chap 6.
Taylor and Francis, pp 87–106Law AM, Kelton WD (2000) Simulation modeling and analysis, 3rd edn. McGraw-Hill, New YorkLiu J, Wan YW, Wang L (2006) Quay crane scheduling at container terminals to minimize the maximum
relative tardiness of vessel departures. Navel Res Logist 53:60–74
123

476 I. F. A. Vis, R. G. van Anholt
Meisel F, Bierwirth C (2009) Heuristics for the integration of crane productivity in the berth allocationproblem. Transport Res Part E 45:196–209
Nguyen VD, Kim KH (2007) A dispatching method for automated lifting vehicles in automated port con-tainer terminals. In: Paper presented at the international conference on intelligent manufacturing andlogistics systems (IML 2007), Kitakyushu, Japan, 26–28 February 2007
Stahlbock R, Voss S (2008) Operations research at container terminals: a literature update. OR Spectr30:1–52
Steenken D, Voss S, Stahlbock R (2004) Container terminal operation and operations research—a classifi-cation and literature review. OR Spectr 26:3–49
Vis IFA (2006) A comparative analysis of storage and retrieval equipment at a container terminal. Int J ProdEcon 103:680–693
Vis IFA, Bakker M (2008) Dispatching and layout rules at an automated container terminal. In: Ellis K etal (eds) Progress in material handling research: 2008. Material Handling Institute, Charlotte, NorthCarolina, pp 685–703
Vis IFA, De Koster R (2003) Transshipment of containers at a container terminal: an overview. Eur J OperRes 147:1–16
Vis IFA, Harika I (2004) Comparison of vehicle types at an automated container terminal. OR Spectr26:117–143
Vis IFA, Roodbergen KJ (2009) Scheduling of container storage and retrieval. Oper Res 57:456–467
123