Performance Analysis of 70 kW - Kathmandu University · Performance Analysis of 70 kW Micro-class...
15
Transcript of Performance Analysis of 70 kW - Kathmandu University · Performance Analysis of 70 kW Micro-class...

Performance Analysis of 70 kWMicro-class Francis Hydro Turbine by CFD
1
Anup KCFlow Informatics Lab, Korea Maritime and Ocean University, Busan, South Korea
Current AffiliationDepartment of Mechanical Engineering, Kathmandu University, Nepal
4/7/2014
International Symposium on Current Research in Hydraulic Turbines IV
Supervisor
• Prof. LEE, Young Ho, Ph.DFlow Informatics LabDepartment of Mechanical and Energy System EngineeringSchool of EngineeringKorea Maritime and Ocean UniversityBusan, South Korea
4/7/2014 2
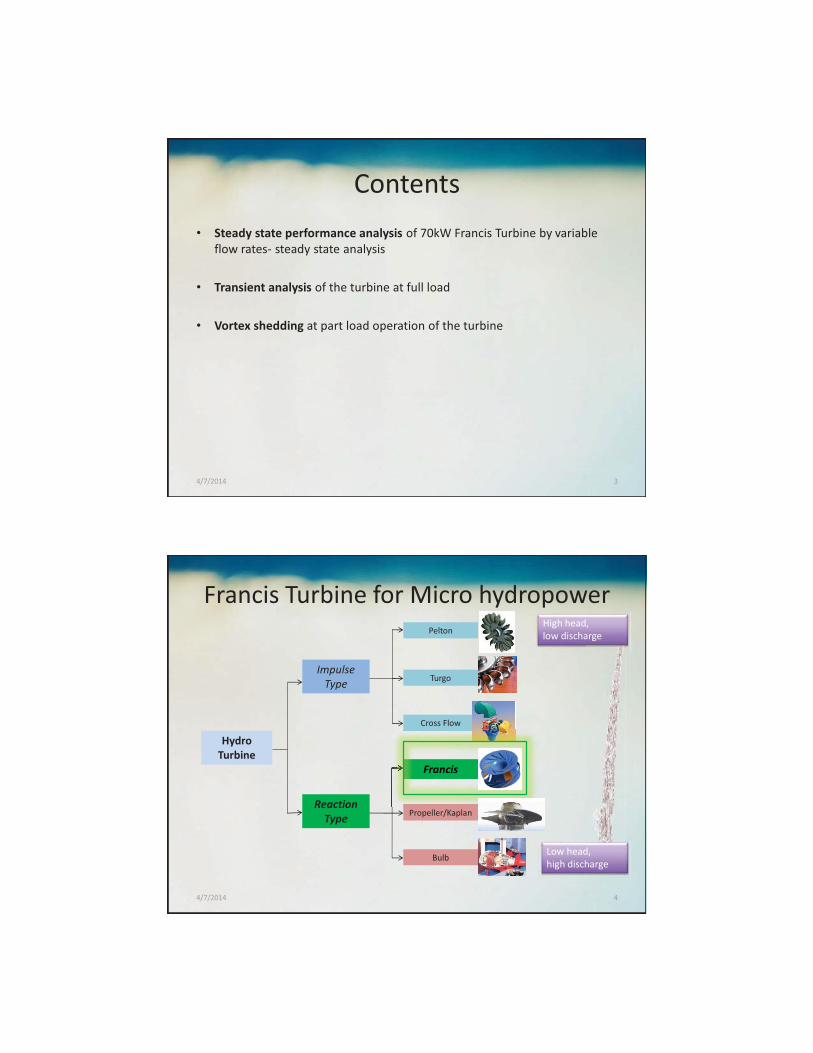
Contents• Steady state performance analysis of 70kW Francis Turbine by variable
flow rates- steady state analysis
• Transient analysis of the turbine at full load
• Vortex shedding at part load operation of the turbine
4/7/2014 3
Francis Turbine for Micro hydropowerHigh head,low discharge
Low head,high discharge
Hydro Turbine
Impulse Type
Reaction Type
Francis
Cross Flow
Turgo
Pelton
Propeller/Kaplan
Bulb
Francis
4/7/2014 4
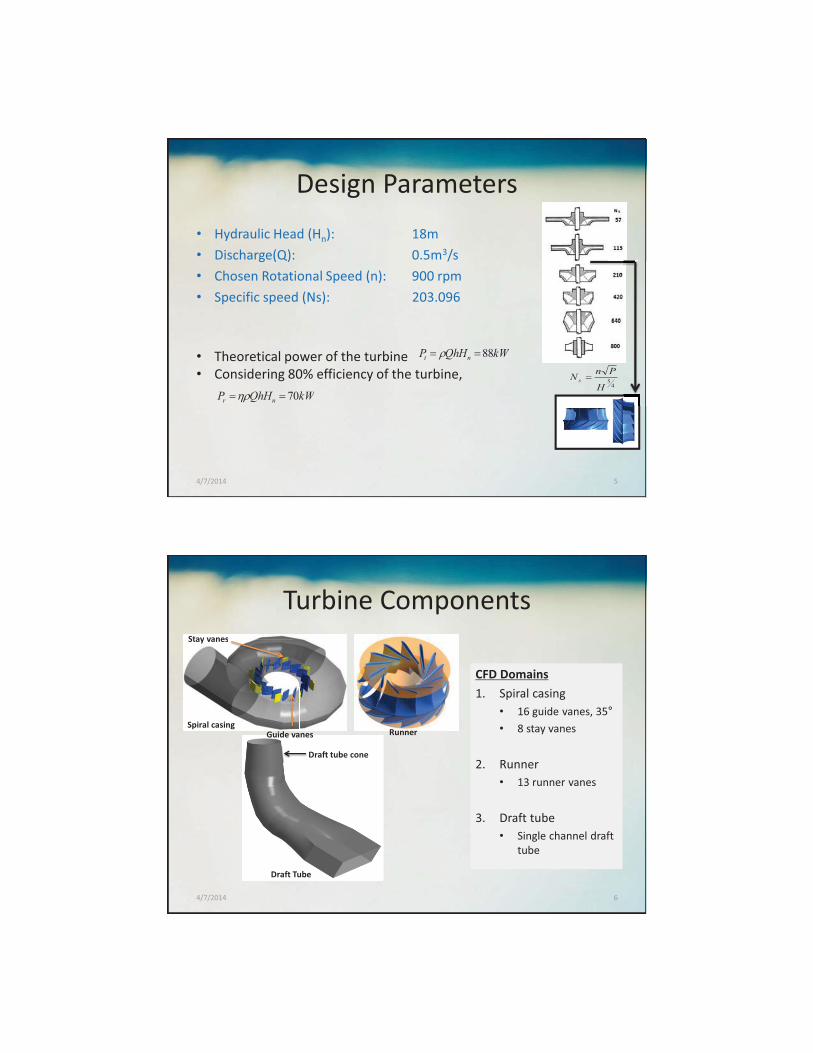
Design Parameters• Hydraulic Head (Hn): 18m• Discharge(Q): 0.5m3/s• Chosen Rotational Speed (n): 900 rpm• Specific speed (Ns): 203.096
• Theoretical power of the turbine • Considering 80% efficiency of the turbine,
kWQhHP nt 88�� �
kWQhHP nr 70����45
H
PnNs �
4/7/2014 5
Turbine Components
CFD Domains1. Spiral casing
• 16 guide vanes, 35• 8 stay vanes
2. Runner• 13 runner vanes
3. Draft tube• Single channel draft
tube
4/7/2014 6
Spiral casingGuide vanes
Stay vanes
Runner
Draft Tube
Draft tube cone
4/7/2014 7
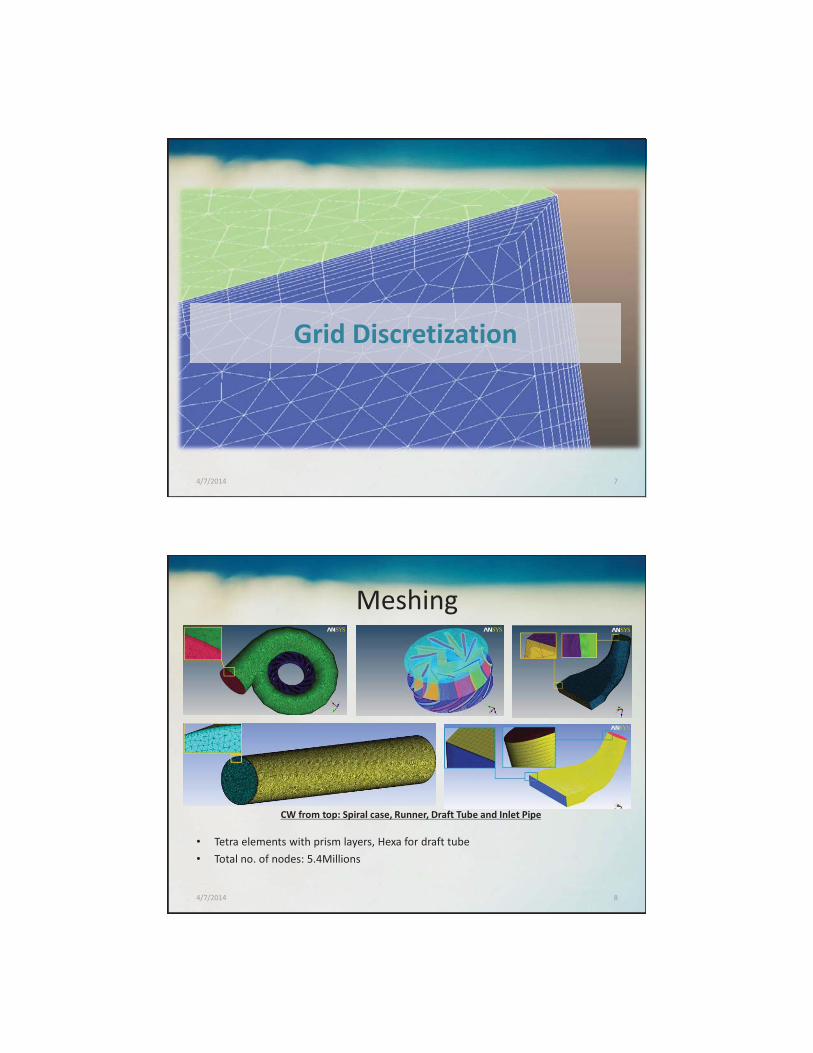
Grid Discretization
Meshing
• Tetra elements with prism layers, Hexa for draft tube• Total no. of nodes: 5.4Millions
4/7/2014 8
CW from top: Spiral case, Runner, Draft Tube and Inlet Pipe
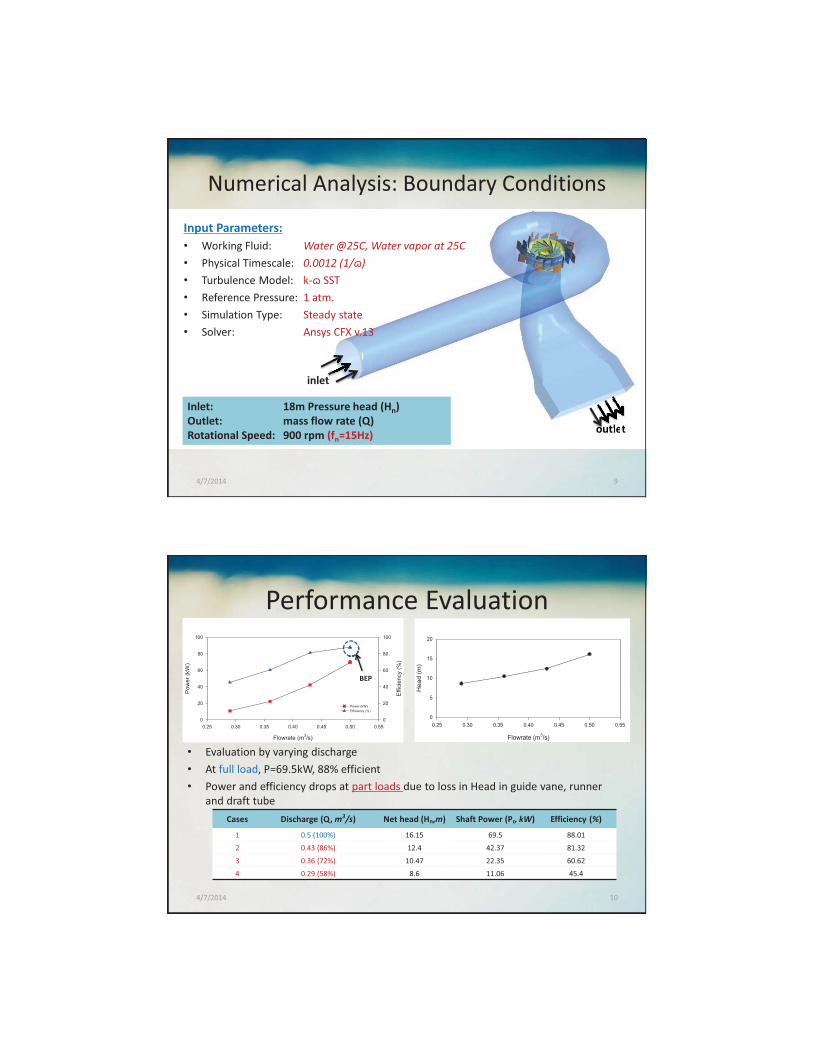
Numerical Analysis: Boundary Conditions
Input Parameters:• Working Fluid: Water @25C, Water vapor at 25C• Physical Timescale: 0.0012 (1/ɷ)• Turbulence Model: k-ɷ SST• Reference Pressure: 1 atm.• Simulation Type: Steady state• Solver: Ansys CFX v.13
4/7/2014 9
inlet
outlet
t
etetleleleoututt
Inlet: 18m Pressure head (Hn)Outlet: mass flow rate (Q)Rotational Speed: 900 rpm (fn=15Hz)
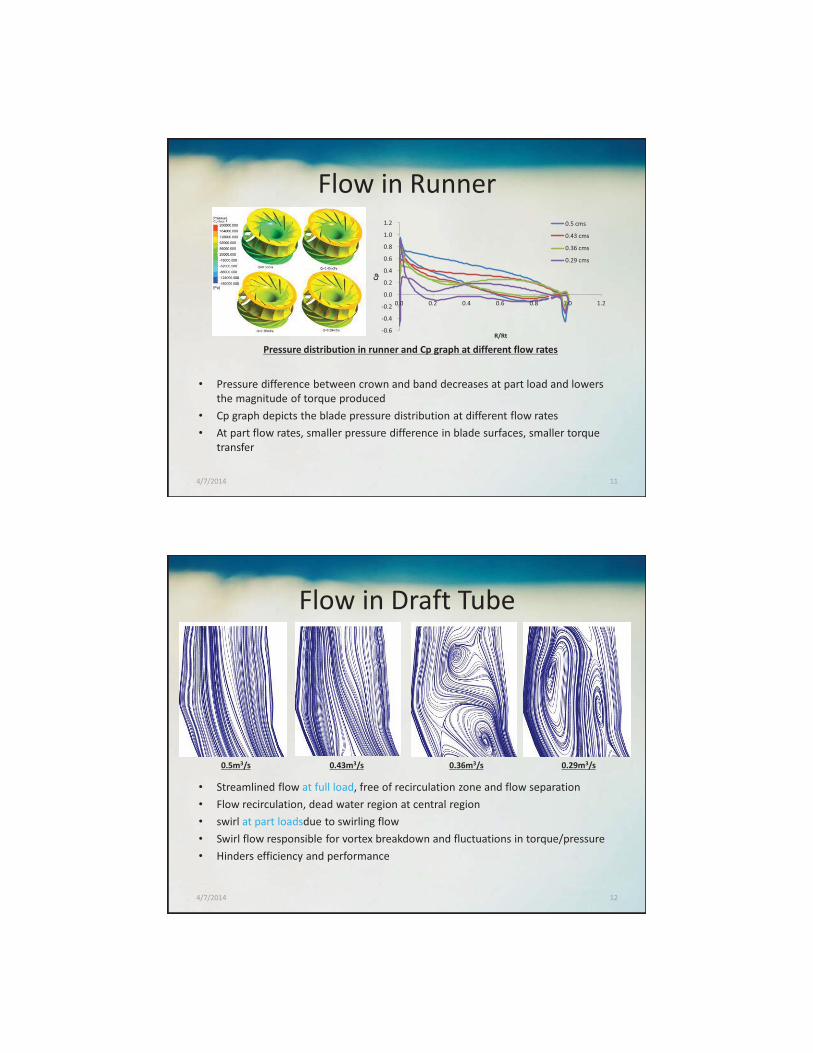
Performance Evaluation
• Evaluation by varying discharge• At full load, P=69.5kW, 88% efficient• Power and efficiency drops at part loads due to loss in Head in guide vane, runner
and draft tubeCases Discharge (Q, m3/s) Net head (Hn,m) Shaft Power (Pr, kW) Efficiency (%)
1 0.5 (100%) 16.15 69.5 88.01
2 0.43 (86%) 12.4 42.37 81.32
3 0.36 (72%) 10.47 22.35 60.62
4 0.29 (58%) 8.6 11.06 45.4
Flowrate (m3/s)
0.25 0.30 0.35 0.40 0.45 0.50 0.55
Pow
er (k
W)
0
20
40
60
80
100
Effi
cien
cy (%
)
0
20
40
60
80
100
Power (kW)Efficiency (%)
Flowrate (m3/s)
0.25 0.30 0.35 0.40 0.45 0.50 0.55
Hea
d (m
)
0
5
10
15
20
4/7/2014 10
BEP
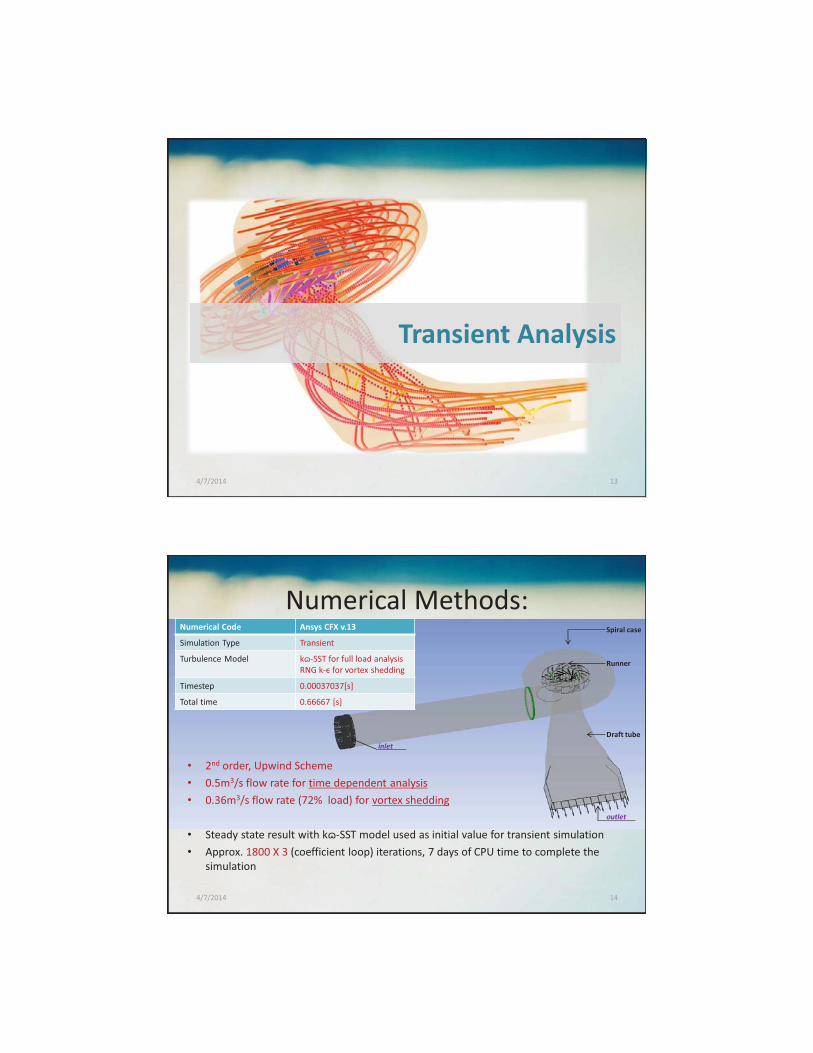
Flow in Runner
• Pressure difference between crown and band decreases at part load and lowers the magnitude of torque produced
• Cp graph depicts the blade pressure distribution at different flow rates• At part flow rates, smaller pressure difference in blade surfaces, smaller torque
transfer
4/7/2014 11
Pressure distribution in runner and Cp graph at different flow rates
-0.6
-0.4
-0.2
0.0
0.2
0.4
0.6
0.8
1.0
1.2
0.0 0.2 0.4 0.6 0.8 1.0 1.2
Cp
R/Rt
0.5 cms
0.43 cms
0.36 cms
0.29 cms
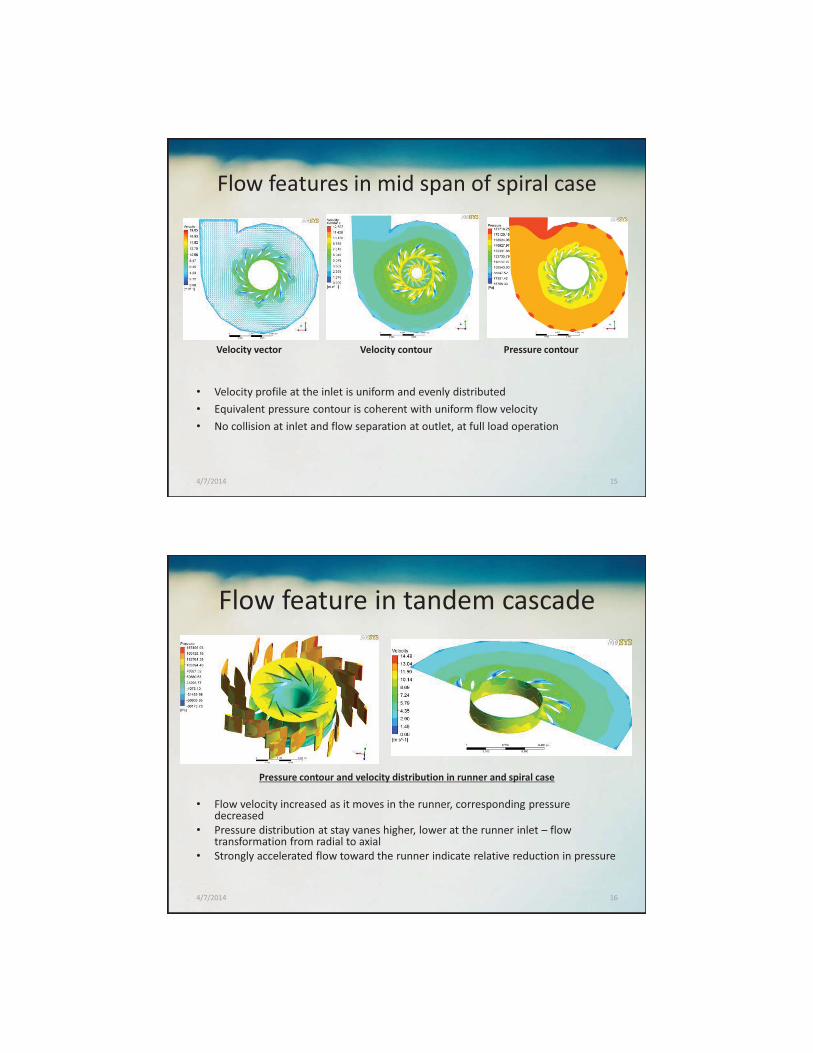
Flow in Draft Tube
• Streamlined flow at full load, free of recirculation zone and flow separation• Flow recirculation, dead water region at central region• swirl at part loadsdue to swirling flow• Swirl flow responsible for vortex breakdown and fluctuations in torque/pressure• Hinders efficiency and performance
4/7/2014 12
0.43m3/s 0.36m3/s 0.29m3/s0.5m3/s
4/7/2014 13
Transient Analysis
Numerical Methods:
• 2nd order, Upwind Scheme• 0.5m3/s flow rate for time dependent analysis• 0.36m3/s flow rate (72% load) for vortex shedding
• Steady state result with kɷ-SST model used as initial value for transient simulation• Approx. 1800 X 3 (coefficient loop) iterations, 7 days of CPU time to complete the
simulation
Spiral case
Runner
Draft tube
Numerical Code Ansys CFX v.13
Simulation Type Transient
Turbulence Model kɷ-SST for full load analysisRNG k-ϵ for vortex shedding
Timestep 0.00037037[s]
Total time 0.66667 [s]
4/7/2014 14
inlet
outlet
Flow features in mid span of spiral case
• Velocity profile at the inlet is uniform and evenly distributed• Equivalent pressure contour is coherent with uniform flow velocity• No collision at inlet and flow separation at outlet, at full load operation
Velocity vector Velocity contour Pressure contour
4/7/2014 15
Flow feature in tandem cascade
• Flow velocity increased as it moves in the runner, corresponding pressure decreased
• Pressure distribution at stay vanes higher, lower at the runner inlet – flow transformation from radial to axial
• Strongly accelerated flow toward the runner indicate relative reduction in pressure
4/7/2014 16
Pressure contour and velocity distribution in runner and spiral case
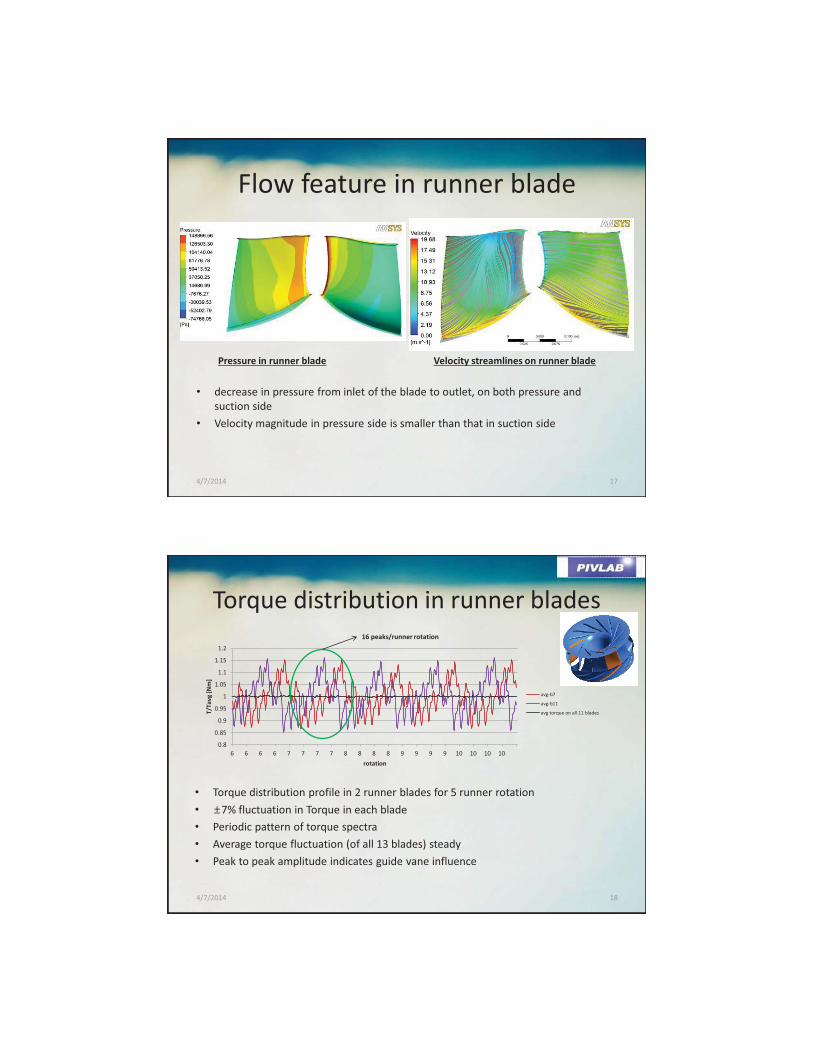
Flow feature in runner blade
• decrease in pressure from inlet of the blade to outlet, on both pressure and suction side
• Velocity magnitude in pressure side is smaller than that in suction side
4/7/2014 17
Pressure in runner blade Velocity streamlines on runner blade
Torque distribution in runner blades
• Torque distribution profile in 2 runner blades for 5 runner rotation• 7% fluctuation in Torque in each blade• Periodic pattern of torque spectra• Average torque fluctuation (of all 13 blades) steady• Peak to peak amplitude indicates guide vane influence
0.8
0.85
0.9
0.95
1
1.05
1.1
1.15
1.2
6 6 6 6 7 7 7 7 8 8 8 8 9 9 9 9 10 10 10 10
T/Ta
vg [N
m]
rotation
avg-b7
avg-b11
avg torque on all 11 blades
16 peaks/runner rotation
4/7/2014 18
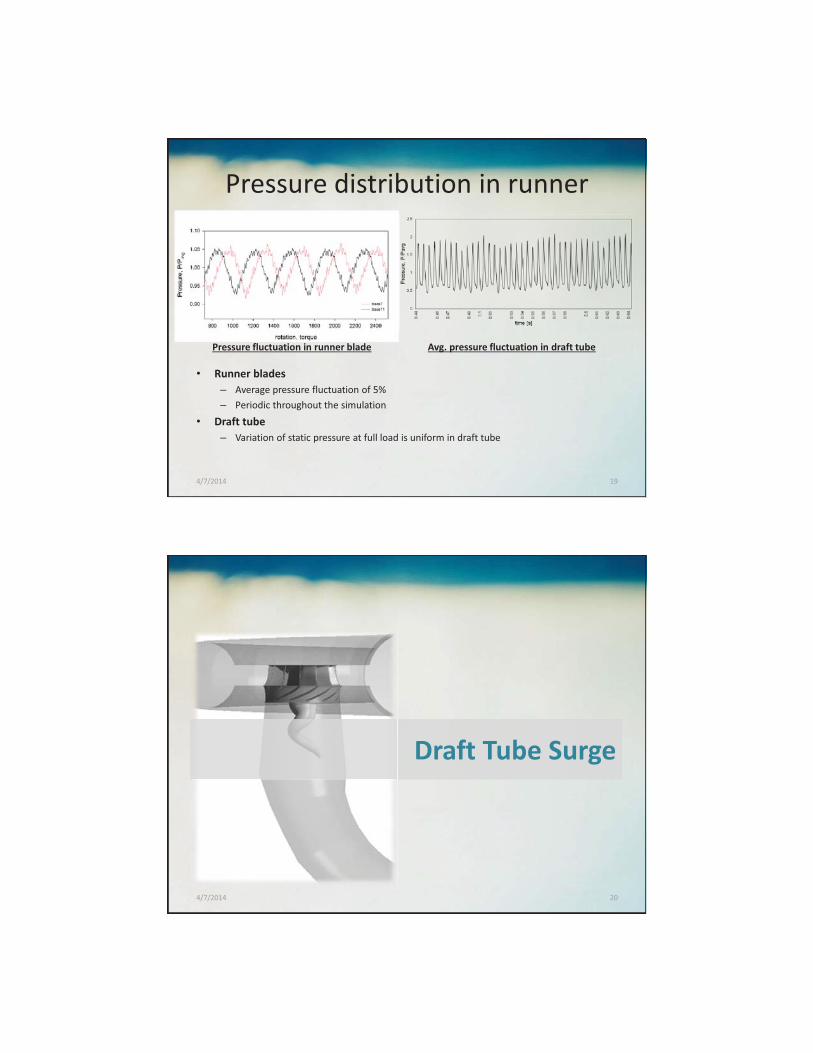
Pressure distribution in runner
• Runner blades– Average pressure fluctuation of 5%– Periodic throughout the simulation
• Draft tube– Variation of static pressure at full load is uniform in draft tube
4/7/2014 19
Pressure fluctuation in runner blade Avg. pressure fluctuation in draft tube
4/7/2014 20
Draft Tube Surge
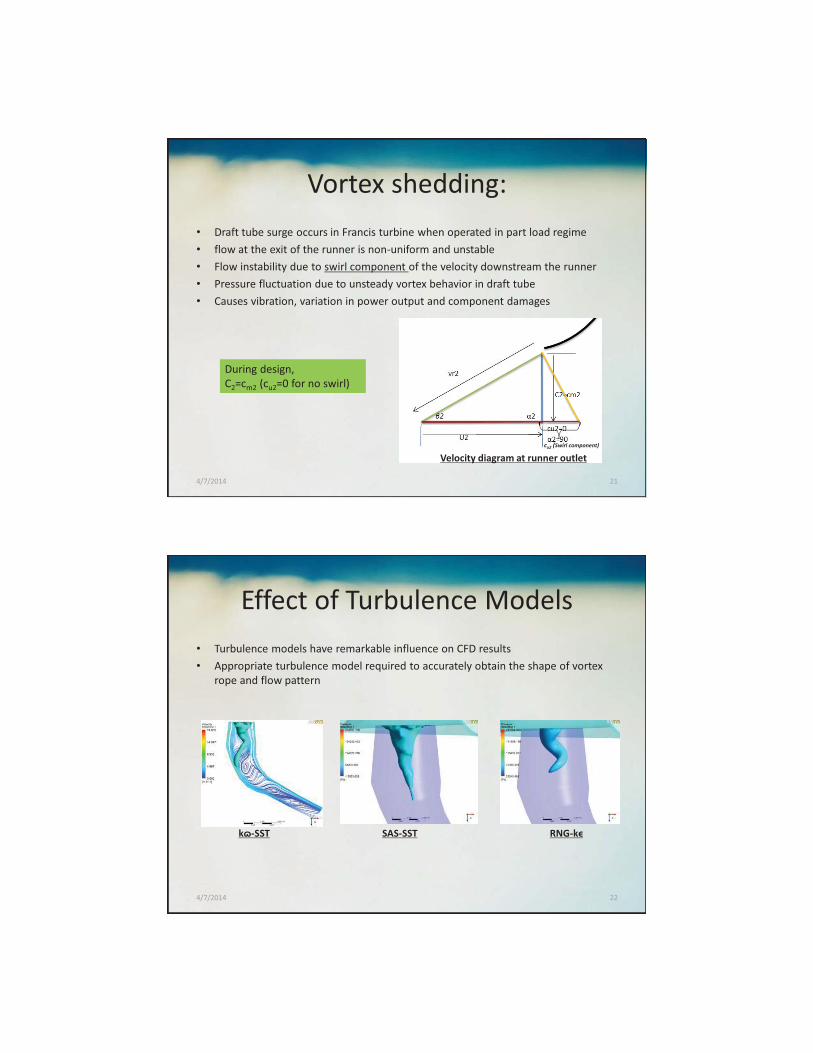
Vortex shedding:• Draft tube surge occurs in Francis turbine when operated in part load regime• flow at the exit of the runner is non-uniform and unstable• Flow instability due to swirl component of the velocity downstream the runner• Pressure fluctuation due to unsteady vortex behavior in draft tube• Causes vibration, variation in power output and component damages
Velocity diagram at runner outletcu2 (Swirl component)
4/7/2014 21
During design, C2=cm2 (cu2=0 for no swirl)
Effect of Turbulence Models• Turbulence models have remarkable influence on CFD results• Appropriate turbulence model required to accurately obtain the shape of vortex
rope and flow pattern
kɷ-SST SAS-SST RNG-kϵ
4/7/2014 22
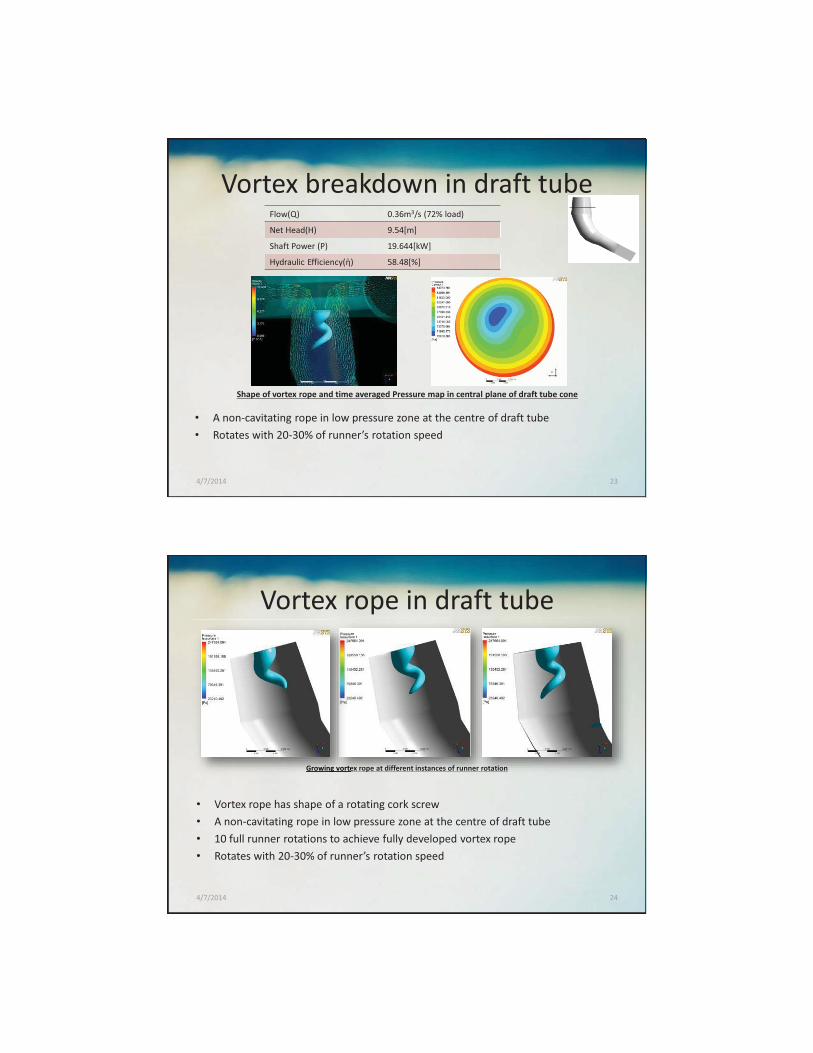
Vortex breakdown in draft tube
• A non-cavitating rope in low pressure zone at the centre of draft tube• Rotates with 20-30% of runner’s rotation speed
Flow(Q) 0.36m3/s (72% load)
Net Head(H) 9.54[m]
Shaft Power (P) 19.644[kW]
Hydraulic Efficiency(ὴ) 58.48[%]
Shape of vortex rope and time averaged Pressure map in central plane of draft tube cone
4/7/2014 23
Vortex rope in draft tube
• Vortex rope has shape of a rotating cork screw• A non-cavitating rope in low pressure zone at the centre of draft tube• 10 full runner rotations to achieve fully developed vortex rope• Rotates with 20-30% of runner’s rotation speed
4/7/2014 24
Growing vortex rope at different instances of runner rotationggGrowGrowininng ng vovorte
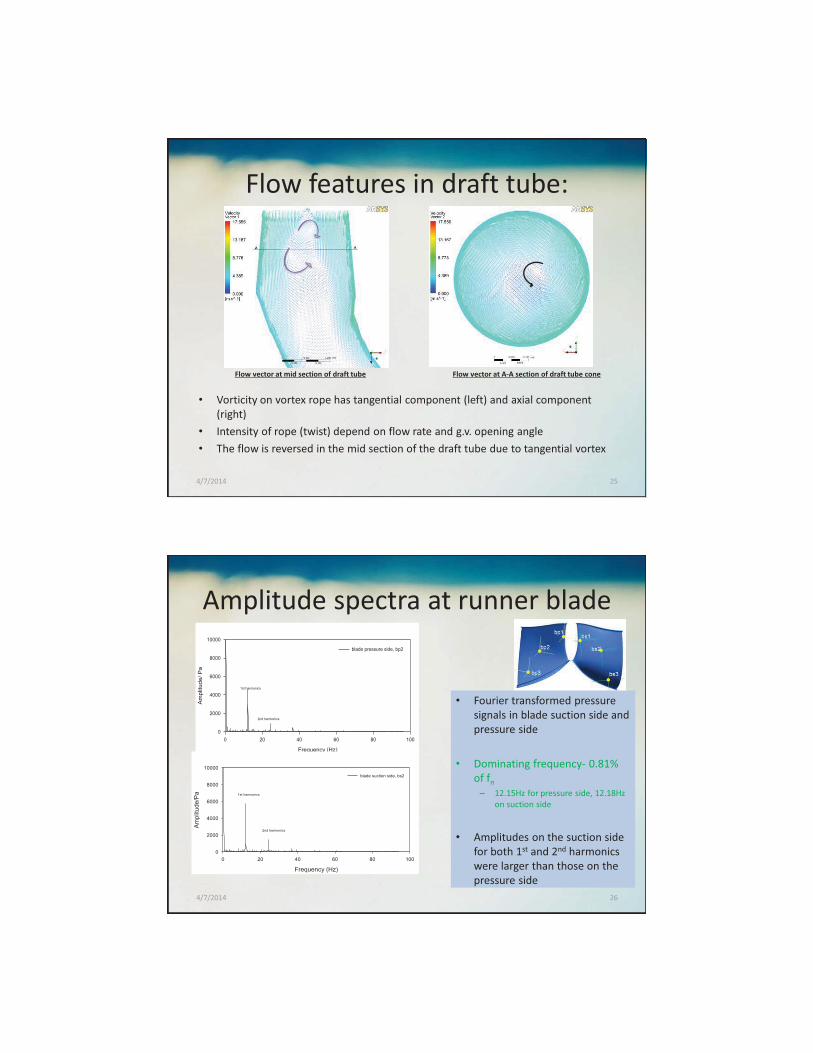
Flow features in draft tube:
• Vorticity on vortex rope has tangential component (left) and axial component (right)
• Intensity of rope (twist) depend on flow rate and g.v. opening angle• The flow is reversed in the mid section of the draft tube due to tangential vortex
Flow vector at mid section of draft tube Flow vector at A-A section of draft tube cone
4/7/2014 25
Amplitude spectra at runner blade
• Fourier transformed pressure signals in blade suction side and pressure side
• Dominating frequency- 0.81% of fn– 12.15Hz for pressure side, 12.18Hz
on suction side
• Amplitudes on the suction side for both 1st and 2nd harmonics were larger than those on the pressure side
4/7/2014 26
Frequency (Hz)
0 20 40 60 80 100
Am
plitu
de/ P
a
0
2000
4000
6000
8000
10000
blade pressure side, bp2
1st harmonics
2nd harmonics
Frequency (Hz)
0 20 40 60 80 100
Ampl
itude
/Pa
0
2000
4000
6000
8000
10000blade suction side, bs2
1st harmonics
2nd harmonics
Conclusion• Design of micro scale Francis Hydro turbine• BEP: 18m head, 0.5m3/s, 35 guide vane angle• 69.7kW at 88% efficiency
• Time dependent analysis to analyze rotor stator interaction• Fluctuation of pressure and torque due to the interaction between guide vanes
and runner
• At part load operation, flow in draft tube suffers instability- swirling flow• Results in vortex shedding, induces pressure fluctuation/vibration• Rotated approx. with 19% the rotational frequency of runner
• Different vortex control techniques are tried as further study
4/7/2014 27
4/7/2014 28