Performance & Analytics Solutions
34
Performance & Analytics Solutions A Logibec initiative
Transcript of Performance & Analytics Solutions
Performance & Analytics Solutions
A Logibec initiative
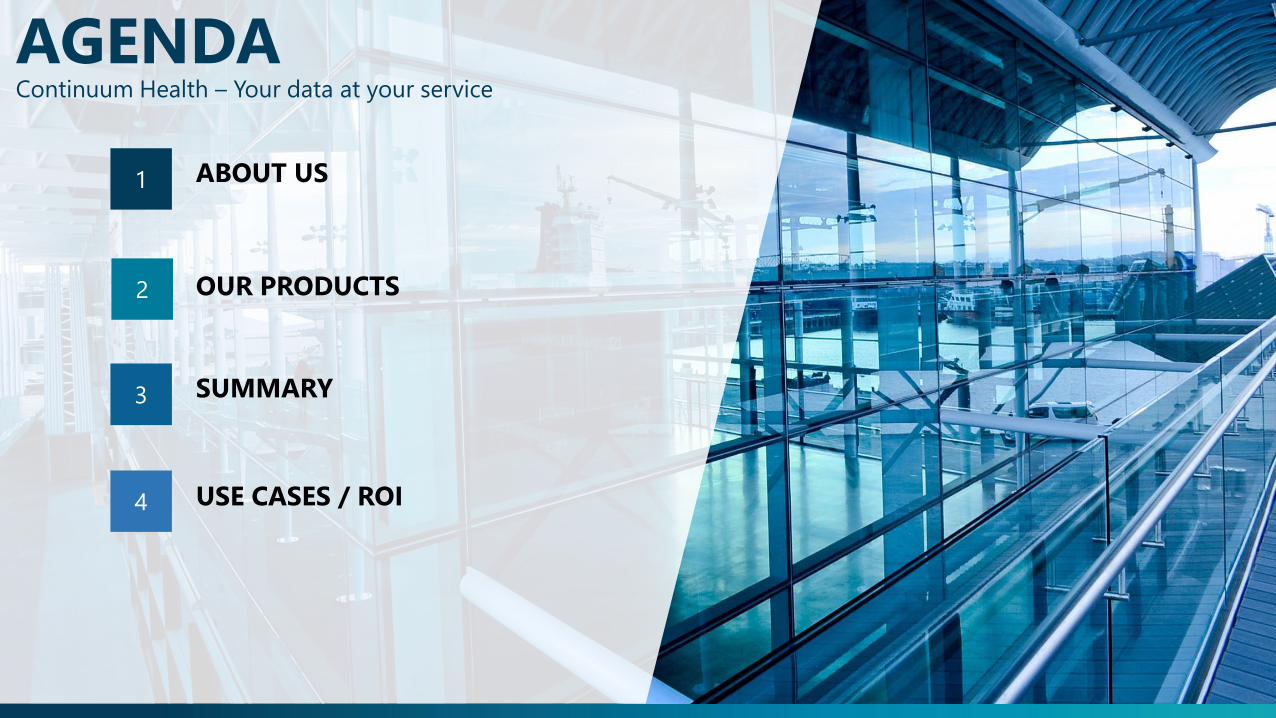
AGENDAContinuum Health – Your data at your service
1
3
4
2 OUR PRODUCTS
ABOUT US
SUMMARY
USE CASES / ROI
©Lo
gib
ec
inc.
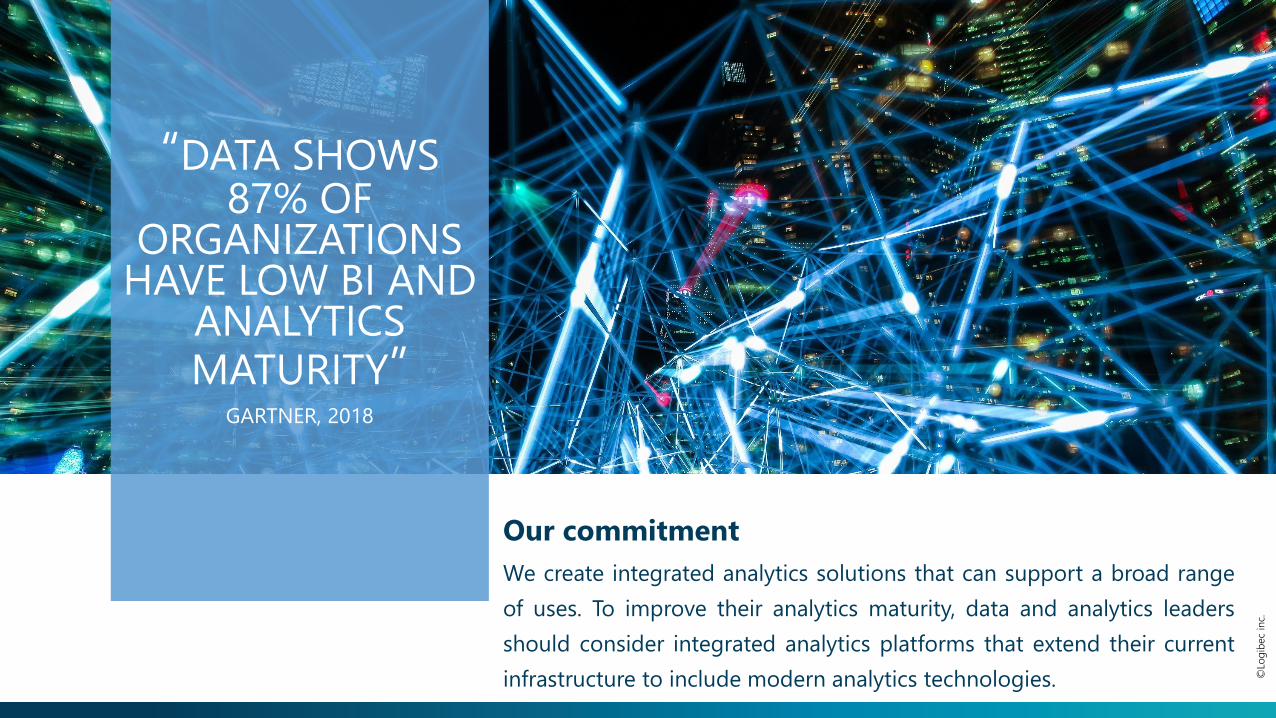
Our commitment
We create integrated analytics solutions that can support a broad range
of uses. To improve their analytics maturity, data and analytics leaders
should consider integrated analytics platforms that extend their current
infrastructure to include modern analytics technologies.
“DATA SHOWS 87% OF
ORGANIZATIONS HAVE LOW BI AND
ANALYTICS MATURITY”
GARTNER, 2018
©Lo
gib
ec
inc.
Next Generation Performance Analytics Solutions
ABOUT US
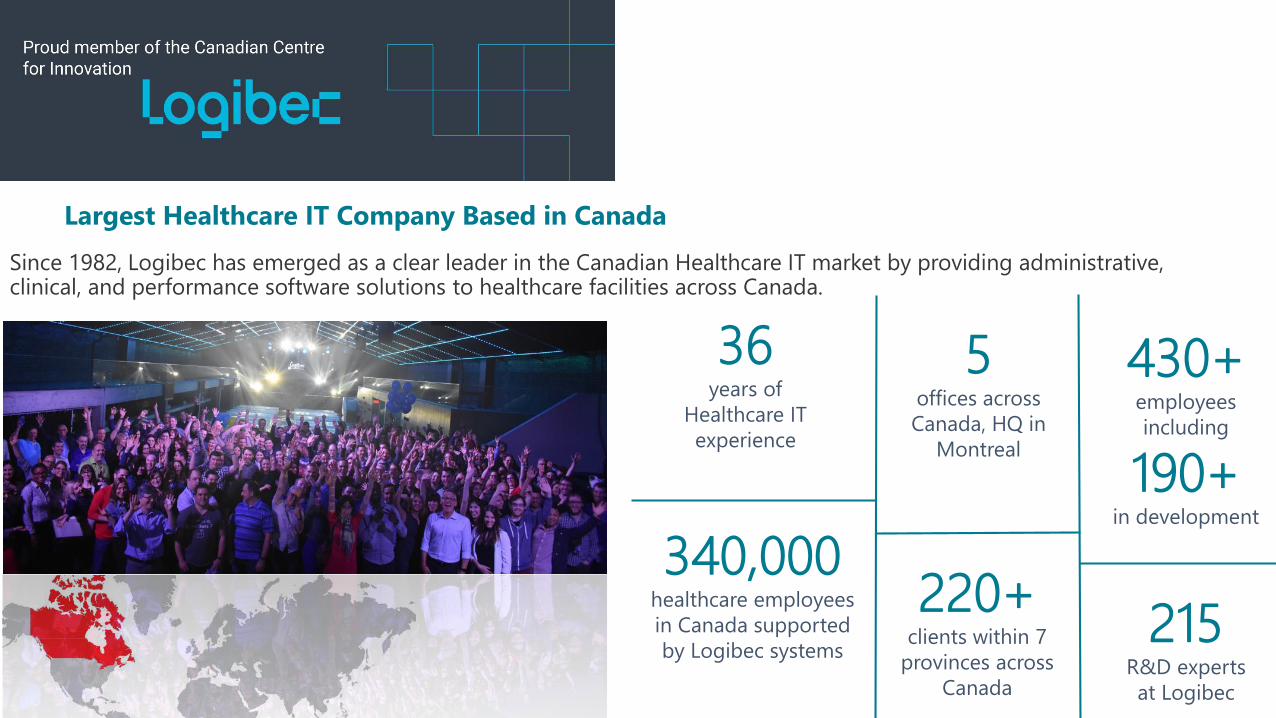
Largest Healthcare IT Company Based in Canada
Since 1982, Logibec has emerged as a clear leader in the Canadian Healthcare IT market by providing administrative, clinical, and performance software solutions to healthcare facilities across Canada.
430+employees
including
190+in development
215R&D experts
at Logibec
5offices across
Canada, HQ in
Montreal
220+clients within 7
provinces across
Canada
340,000healthcare employees
in Canada supported
by Logibec systems
36years of
Healthcare IT
experience
6
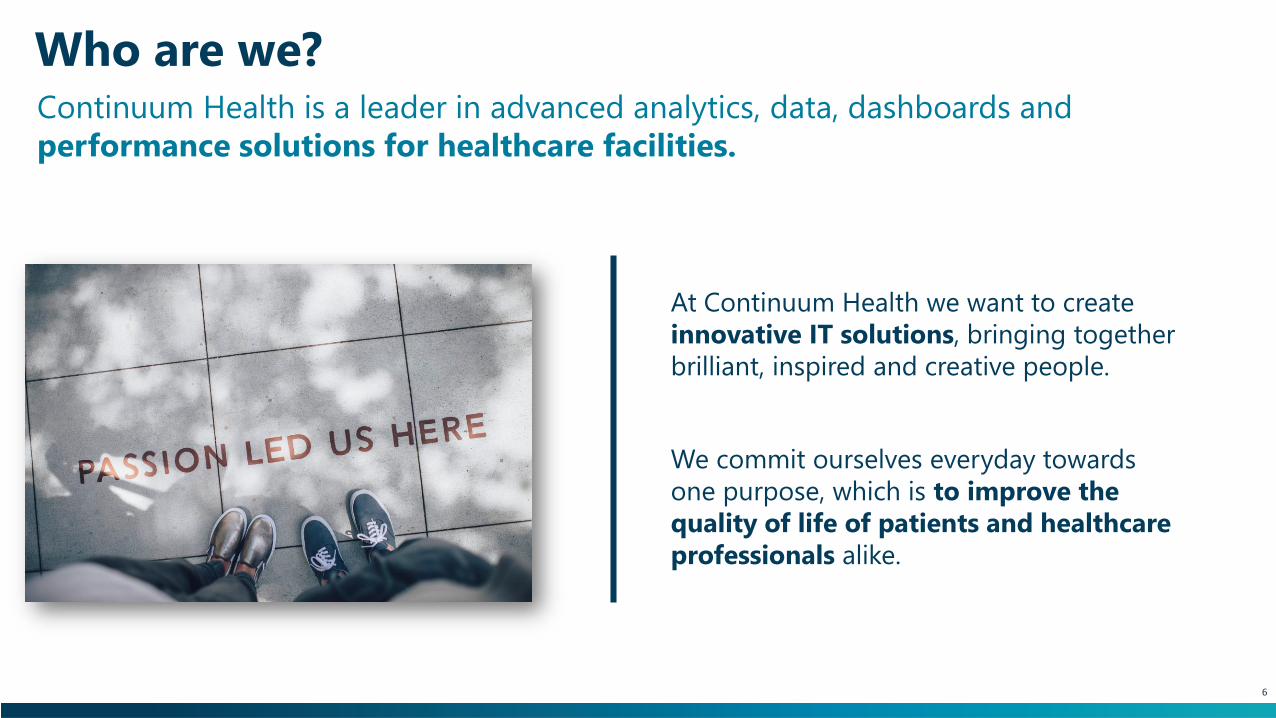
Continuum Health is a leader in advanced analytics, data, dashboards and
performance solutions for healthcare facilities.
We commit ourselves everyday towards
one purpose, which is to improve the
quality of life of patients and healthcare
professionals alike.
At Continuum Health we want to create
innovative IT solutions, bringing together
brilliant, inspired and creative people.
Who are we?
©Lo
gib
ec
inc.
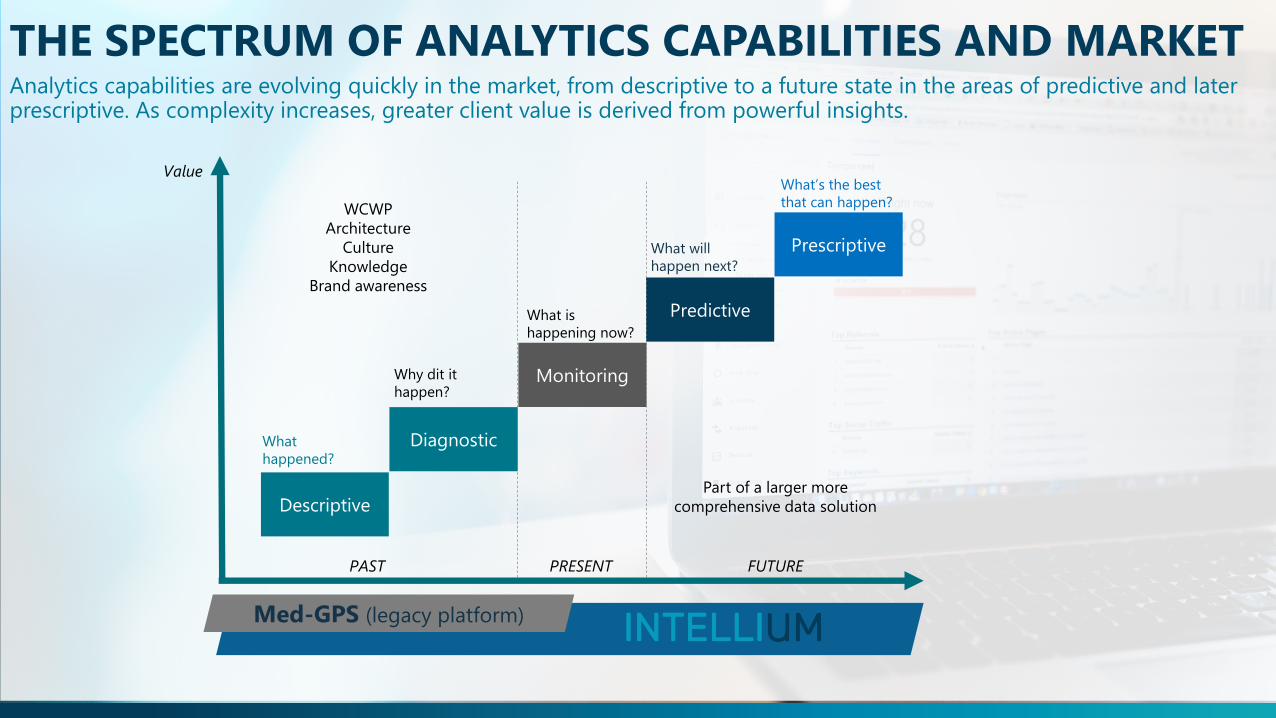
Descriptive
Predictive
Prescriptive
Diagnostic
Monitoring
What
happened?
Why dit it
happen?
What is
happening now?
What will
happen next?
What’s the best
that can happen?
THE SPECTRUM OF ANALYTICS CAPABILITIES AND MARKET
PAST PRESENT FUTURE
Analytics capabilities are evolving quickly in the market, from descriptive to a future state in the areas of predictive and later prescriptive. As complexity increases, greater client value is derived from powerful insights.
Part of a larger more
comprehensive data solution
Med-GPS (legacy platform)
WCWP
Architecture
Culture
Knowledge
Brand awareness
Value
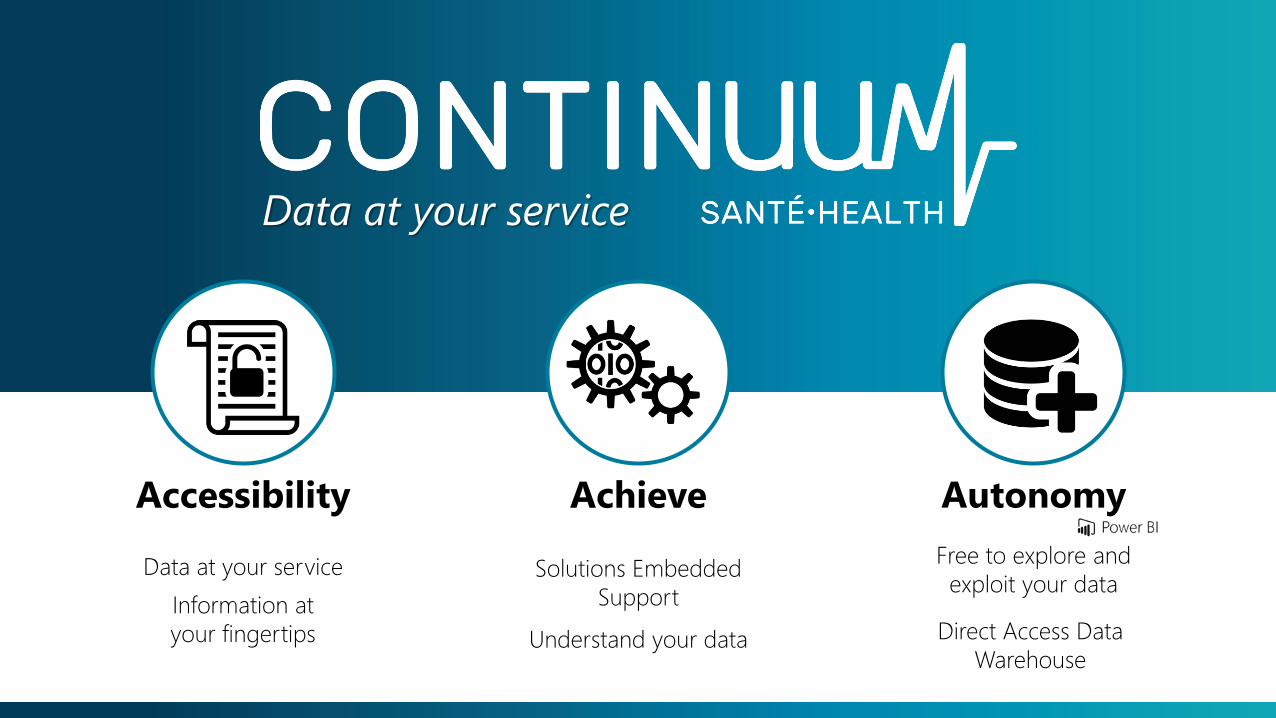
Data at your service
Accessibility AutonomyAchieve
Data at your service
Information at
your fingertips
Solutions Embedded
Support
Free to explore and
exploit your data
Direct Access Data
WarehouseUnderstand your data
©Lo
gib
ec
inc.
Continuum Core & Intellium – Leveraging data to your advantage
OUR SOLUTIONS

©Lo
gib
ec
inc.
Comprehensive & Patient-centric data store
Clients, Data Sources & Solutions
Acute care hospitals
Community care centers
Primary care centers
Emergency department
Long-term care facilities
Ambulatory clinics
Health authorities
Next generation performance analytics solution
Realtime monitoring
Trajectory of care & patient
cohortes
Clinical and financial
performance
Patient flow management
Activity based costing
High user management
Demographical analisys &
Projection
Data quality
©Lo
gib
ec
inc.
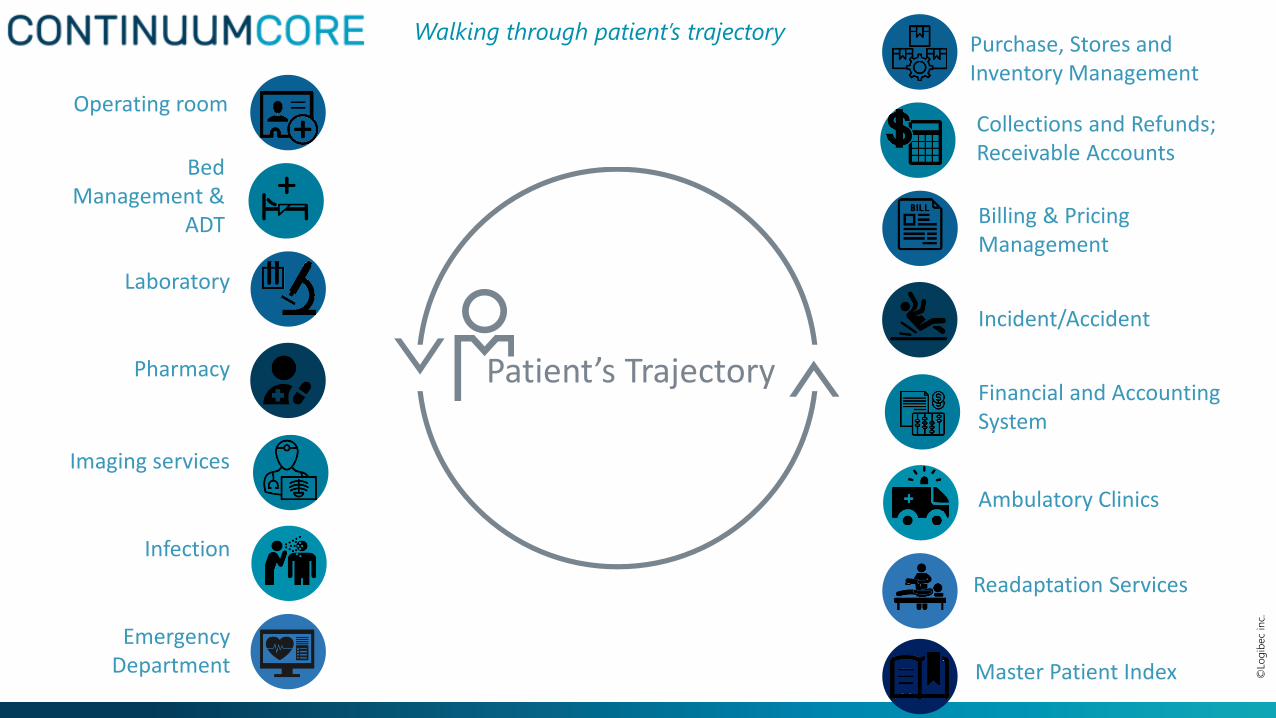
Walking through patient’s trajectory
Patient’s TrajectoryPharmacy
BedManagement &
ADT
Financial and AccountingSystem
Laboratory
Emergency Department
Imaging services
Collections and Refunds; Receivable Accounts
Purchase, Stores and Inventory Management
Operating room
Billing & Pricing Management
Master Patient Index
Readaptation Services
Ambulatory Clinics
Infection
Incident/Accident
©Lo
gib
ec
inc.
12
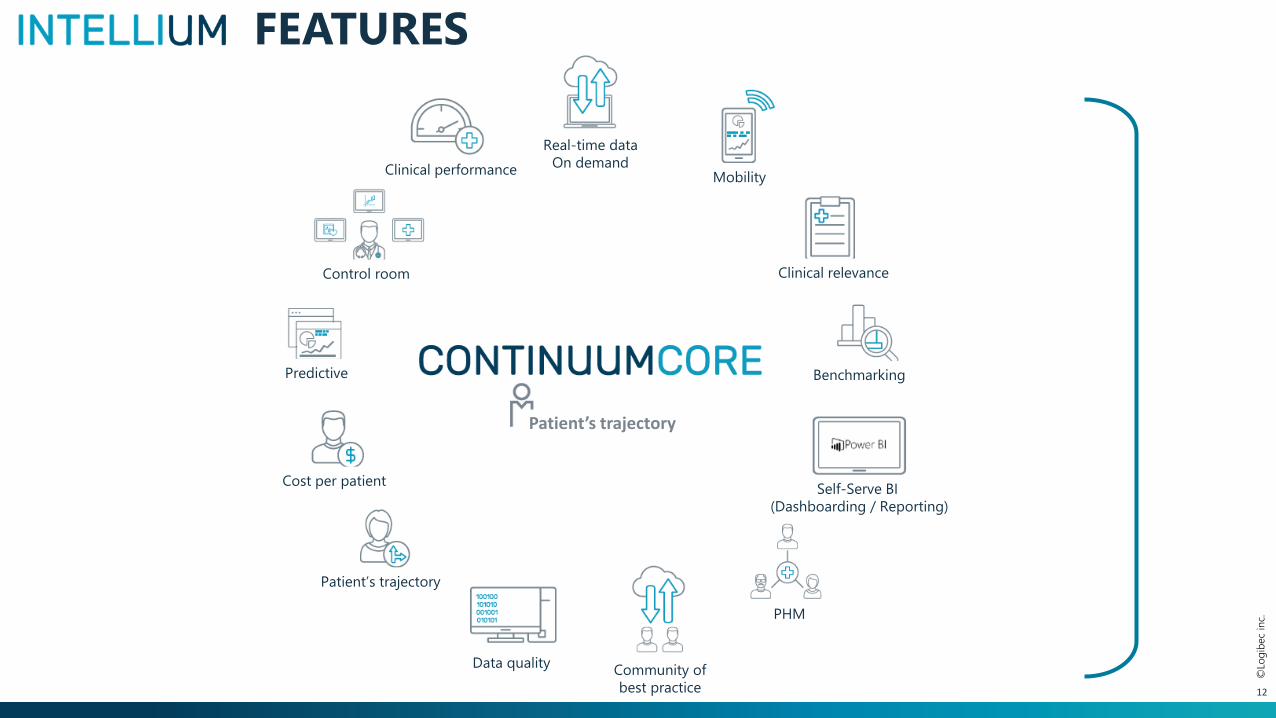
Control room
Predictive
Cost per patient
Patient’s trajectory
Data quality
PHM
Self-Serve BI
(Dashboarding / Reporting)
Benchmarking
Clinical relevance
Mobility
Real-time data
On demandClinical performance
Patient’s trajectory
Community of
best practice
FEATURES
©Lo
gib
ec
inc.
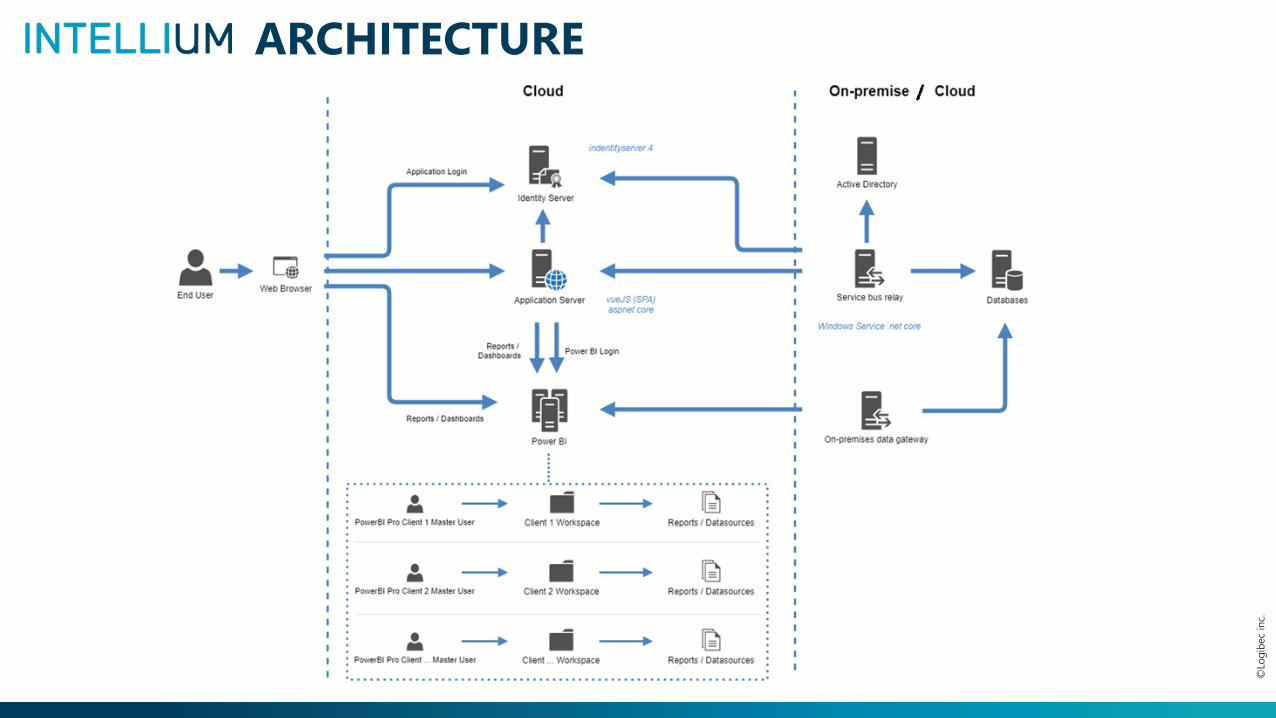
ARCHITECTURE
©Lo
gib
ec
inc.
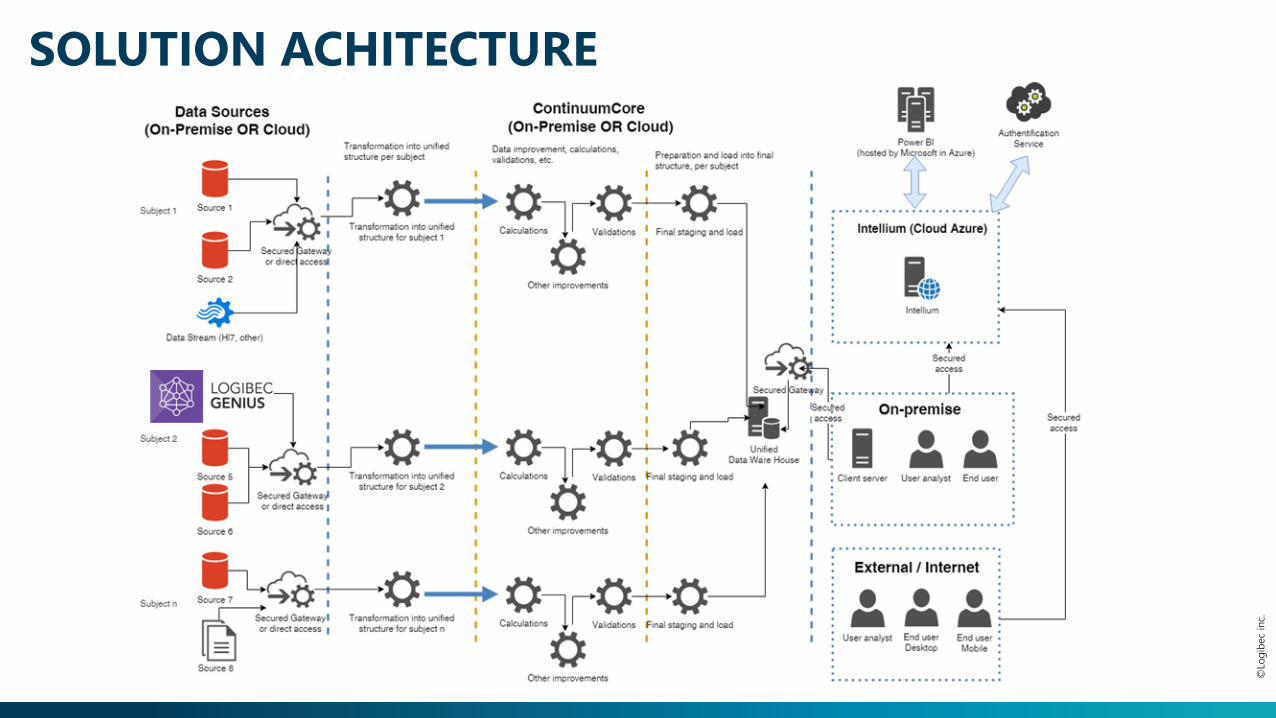
SOLUTION ACHITECTURE
©Lo
gib
ec
inc.
With us, your data becomes a strategic advantage
SUMMARY
©Lo
gib
ec
inc.
16
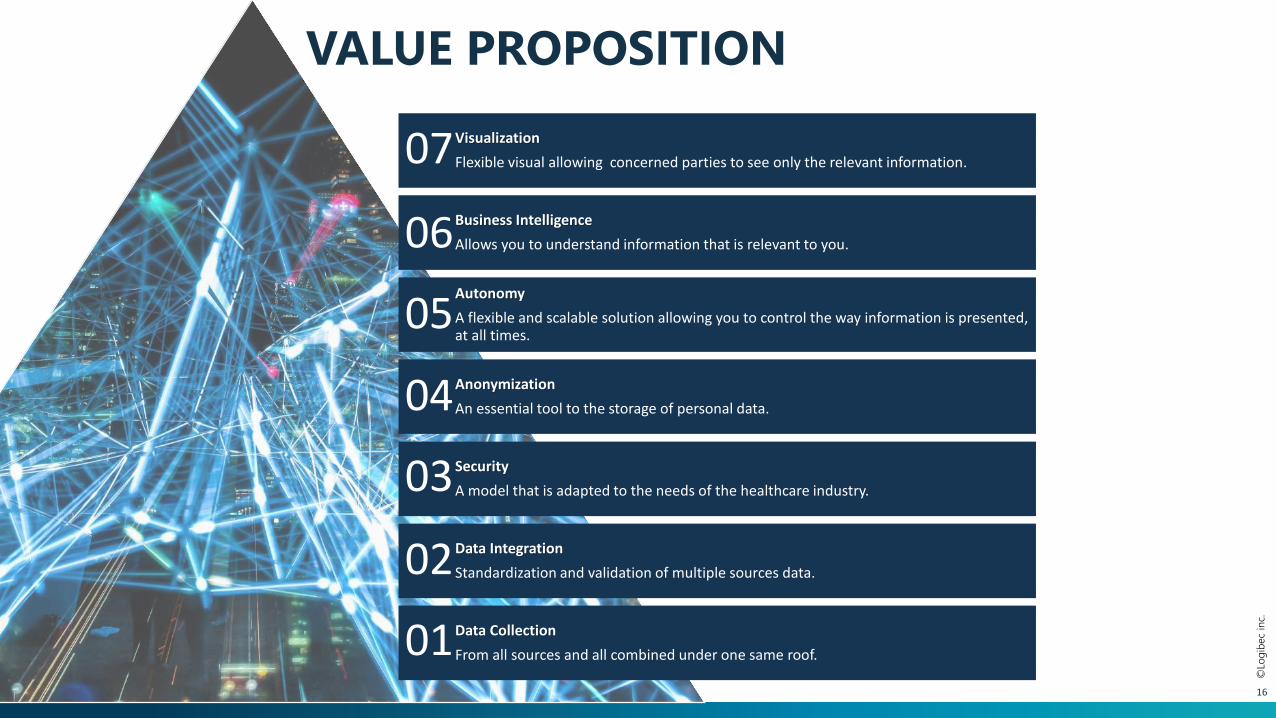
Visualization
Flexible visual allowing concerned parties to see only the relevant information.
Business Intelligence
Allows you to understand information that is relevant to you.
Autonomy
A flexible and scalable solution allowing you to control the way information is presented, at all times.
Anonymization
An essential tool to the storage of personal data.
Security
A model that is adapted to the needs of the healthcare industry.
Data Integration
Standardization and validation of multiple sources data.
Data Collection
From all sources and all combined under one same roof.
VALUE PROPOSITION
01
02
03
04
05
06
07
©Lo
gib
ec
inc.
17
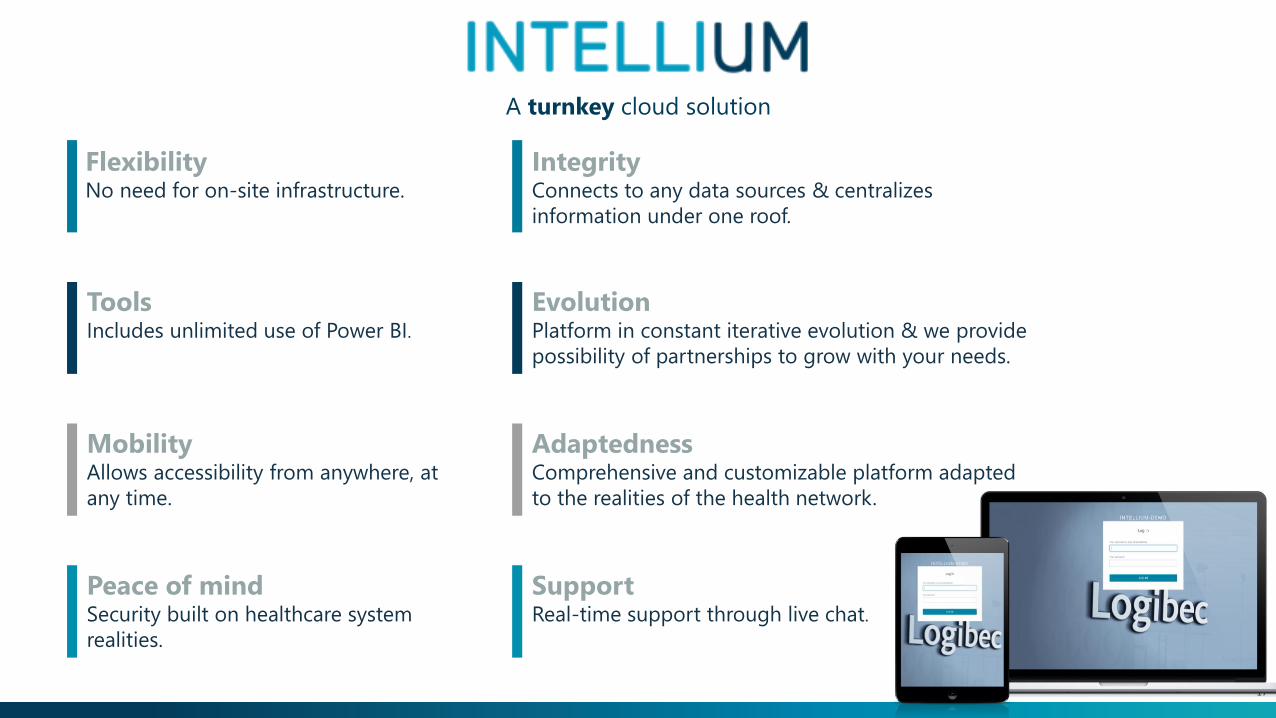
A turnkey cloud solution
FlexibilityNo need for on-site infrastructure.
ToolsIncludes unlimited use of Power BI.
MobilityAllows accessibility from anywhere, at
any time.
Peace of mindSecurity built on healthcare system
realities.
IntegrityConnects to any data sources & centralizes
information under one roof.
EvolutionPlatform in constant iterative evolution & we provide
possibility of partnerships to grow with your needs.
AdaptednessComprehensive and customizable platform adapted
to the realities of the health network.
SupportReal-time support through live chat.
©Lo
gib
ec
inc.
18
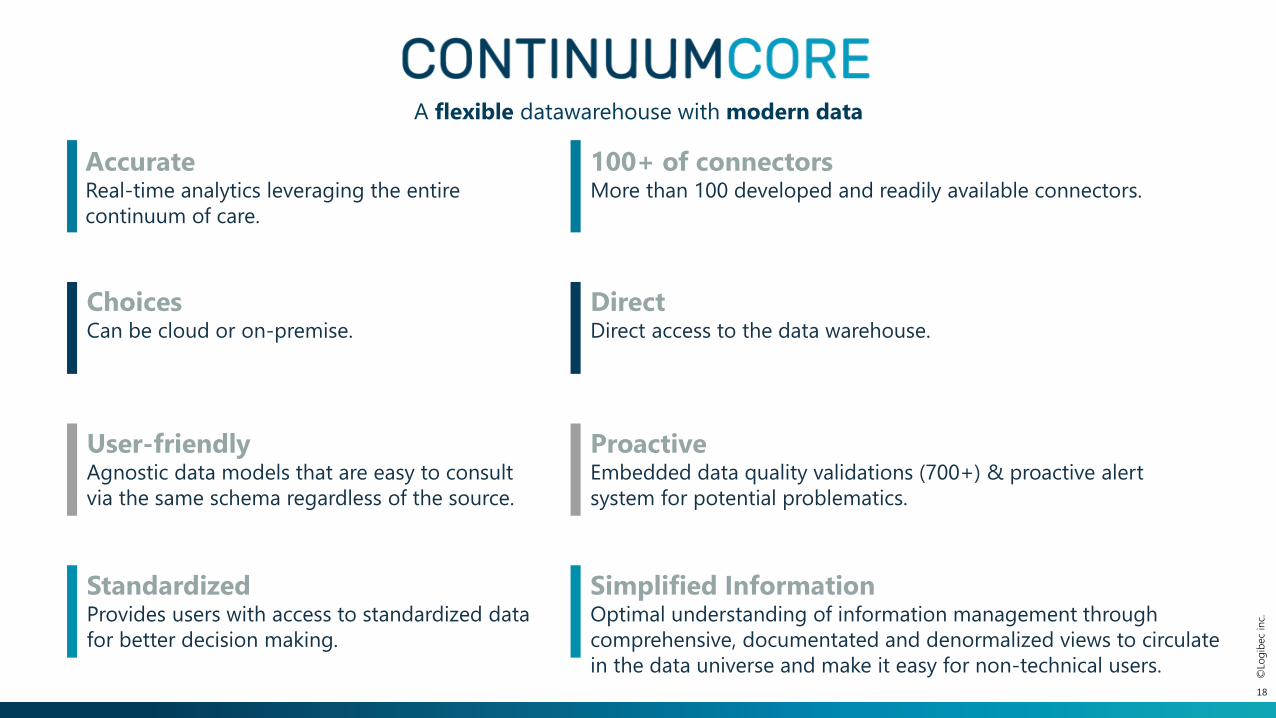
AccurateReal-time analytics leveraging the entire
continuum of care.
ChoicesCan be cloud or on-premise.
User-friendlyAgnostic data models that are easy to consult
via the same schema regardless of the source.
StandardizedProvides users with access to standardized data
for better decision making.
100+ of connectorsMore than 100 developed and readily available connectors.
DirectDirect access to the data warehouse.
ProactiveEmbedded data quality validations (700+) & proactive alert
system for potential problematics.
Simplified InformationOptimal understanding of information management through
comprehensive, documentated and denormalized views to circulate
in the data universe and make it easy for non-technical users.
A flexible datawarehouse with modern data
©Lo
gib
ec
inc.
19
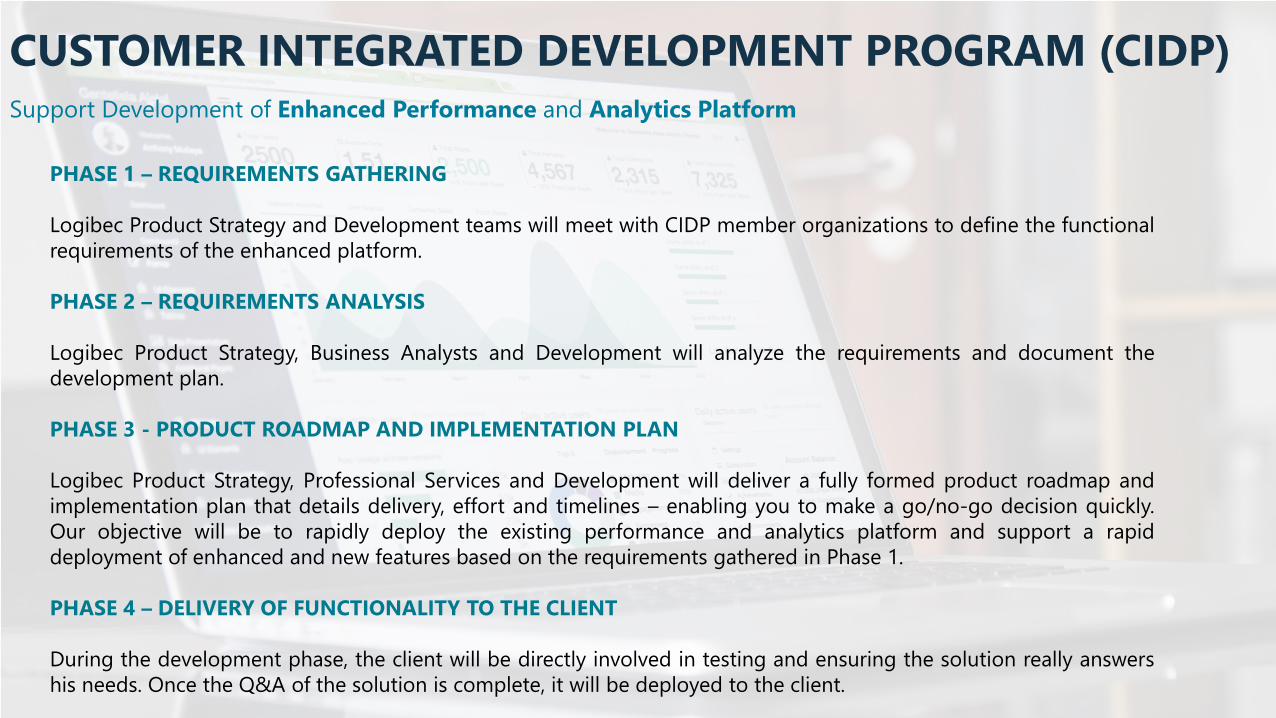
PHASE 1 – REQUIREMENTS GATHERING
Logibec Product Strategy and Development teams will meet with CIDP member organizations to define the functional
requirements of the enhanced platform.
PHASE 2 – REQUIREMENTS ANALYSIS
Logibec Product Strategy, Business Analysts and Development will analyze the requirements and document the
development plan.
PHASE 3 - PRODUCT ROADMAP AND IMPLEMENTATION PLAN
Logibec Product Strategy, Professional Services and Development will deliver a fully formed product roadmap and
implementation plan that details delivery, effort and timelines – enabling you to make a go/no-go decision quickly.
Our objective will be to rapidly deploy the existing performance and analytics platform and support a rapid
deployment of enhanced and new features based on the requirements gathered in Phase 1.
PHASE 4 – DELIVERY OF FUNCTIONALITY TO THE CLIENT
During the development phase, the client will be directly involved in testing and ensuring the solution really answers
his needs. Once the Q&A of the solution is complete, it will be deployed to the client.
Support Development of Enhanced Performance and Analytics Platform
CUSTOMER INTEGRATED DEVELOPMENT PROGRAM (CIDP)
©Lo
gib
ec
inc.
USE CASES / ROI
Using Continuum Solutions
©Lo
gib
ec
inc.
21
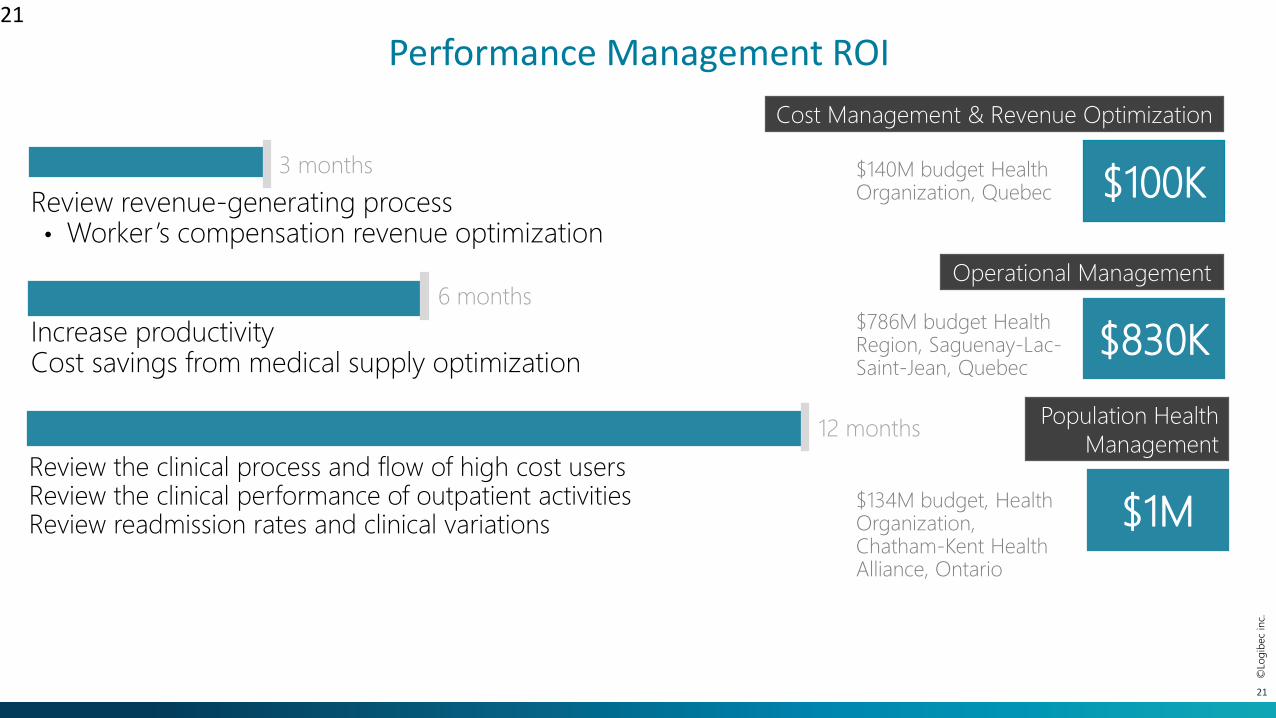
Performance Management ROI
Review revenue-generating process• Worker’s compensation revenue optimization
Review the clinical process and flow of high cost usersReview the clinical performance of outpatient activitiesReview readmission rates and clinical variations
Increase productivity Cost savings from medical supply optimization
3 months
6 months
12 months
$830K
$100K
$1M$134M budget, Health Organization, Chatham-Kent Health Alliance, Ontario
$786M budget Health Region, Saguenay-Lac-Saint-Jean, Quebec
$140M budget Health Organization, Quebec
Cost Management & Revenue Optimization
Operational Management
Population Health
Management
21
©Lo
gib
ec
inc.
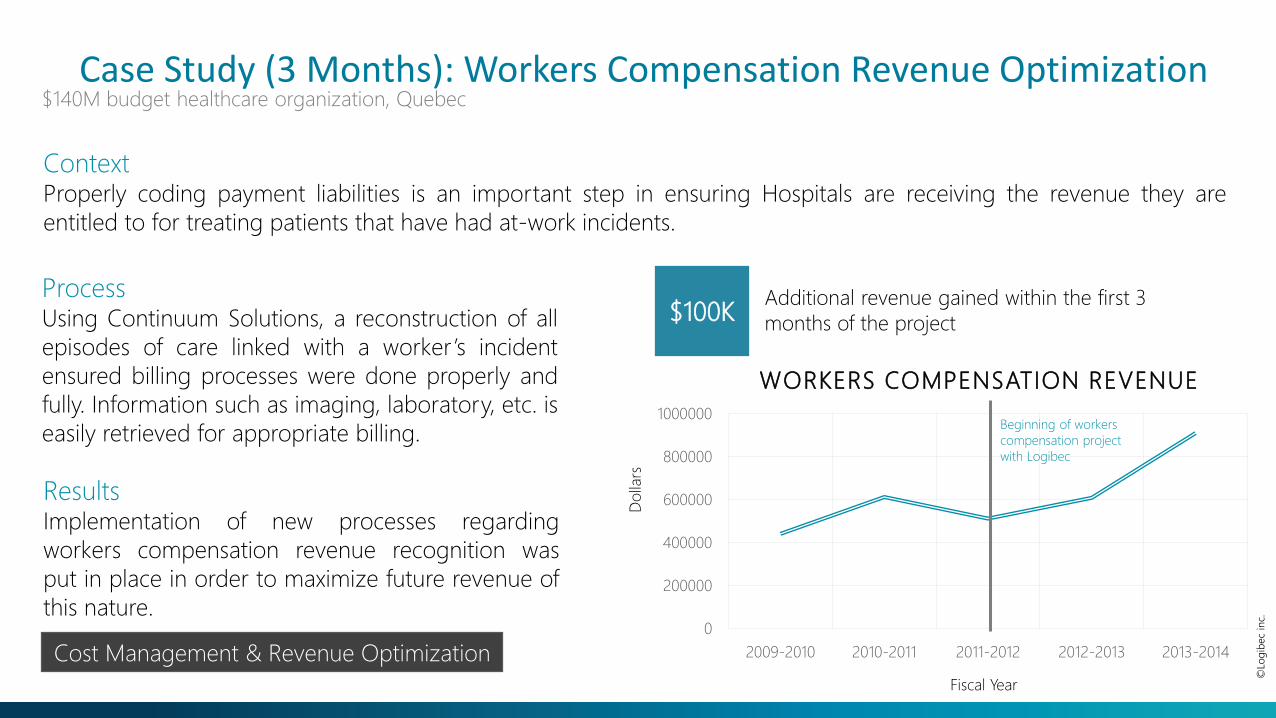
Case Study (3 Months): Workers Compensation Revenue Optimization$140M budget healthcare organization, Quebec
ContextProperly coding payment liabilities is an important step in ensuring Hospitals are receiving the revenue they are
entitled to for treating patients that have had at-work incidents.
ProcessUsing Continuum Solutions, a reconstruction of all
episodes of care linked with a worker’s incident
ensured billing processes were done properly and
fully. Information such as imaging, laboratory, etc. is
easily retrieved for appropriate billing.
ResultsImplementation of new processes regarding
workers compensation revenue recognition was
put in place in order to maximize future revenue of
this nature.
$100KAdditional revenue gained within the first 3
months of the project
0
200000
400000
600000
800000
1000000
2009-2010 2010-2011 2011-2012 2012-2013 2013-2014
WORKERS COMPENSATION REVENUE
Do
llars
Fiscal Year
Beginning of workers
compensation project
with Logibec
Cost Management & Revenue Optimization
©Lo
gib
ec
inc.
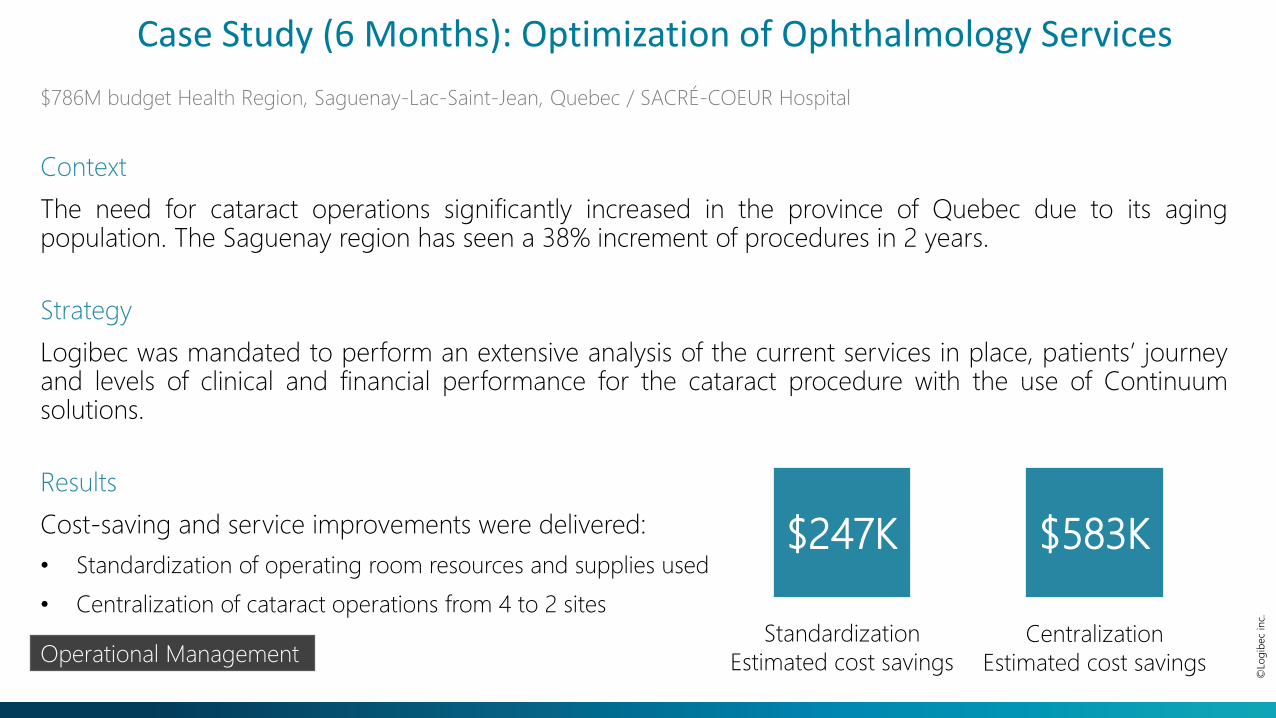
Context
The need for cataract operations significantly increased in the province of Quebec due to its agingpopulation. The Saguenay region has seen a 38% increment of procedures in 2 years.
Strategy
Logibec was mandated to perform an extensive analysis of the current services in place, patients’ journeyand levels of clinical and financial performance for the cataract procedure with the use of Continuumsolutions.
Results
Cost-saving and service improvements were delivered:
• Standardization of operating room resources and supplies used
• Centralization of cataract operations from 4 to 2 sites
$247K
Standardization
Estimated cost savings
$583K
Centralization
Estimated cost savings
Case Study (6 Months): Optimization of Ophthalmology Services
$786M budget Health Region, Saguenay-Lac-Saint-Jean, Quebec / SACRÉ-COEUR Hospital
Operational Management
©Lo
gib
ec
inc.
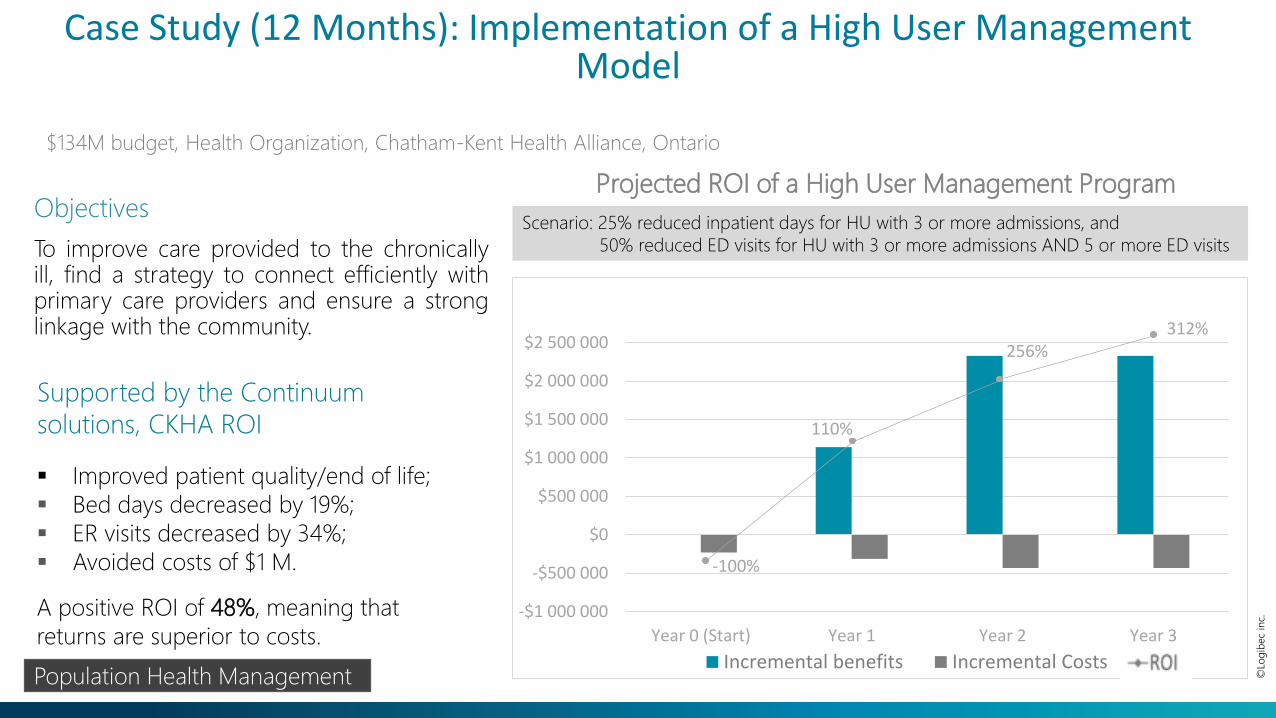
Scenario: 25% reduced inpatient days for HU with 3 or more admissions, and
50% reduced ED visits for HU with 3 or more admissions AND 5 or more ED visits
Case Study (12 Months): Implementation of a High User Management Model
Supported by the Continuum
solutions, CKHA ROI
▪ Improved patient quality/end of life;
▪ Bed days decreased by 19%;
▪ ER visits decreased by 34%;
▪ Avoided costs of $1 M.
A positive ROI of 48%, meaning that
returns are superior to costs.
Objectives
To improve care provided to the chronicallyill, find a strategy to connect efficiently withprimary care providers and ensure a stronglinkage with the community.
$134M budget, Health Organization, Chatham-Kent Health Alliance, Ontario
-$1 000 000
-$500 000
$0
$500 000
$1 000 000
$1 500 000
$2 000 000
$2 500 000
Year 0 (Start) Year 1 Year 2 Year 3
Incremental benefits Incremental Costs
-100%
110%
256%312%
Projected ROI of a High User Management Program
Population Health Management
©Lo
gib
ec
inc.
APPENDICES
©Lo
gib
ec
inc.
26
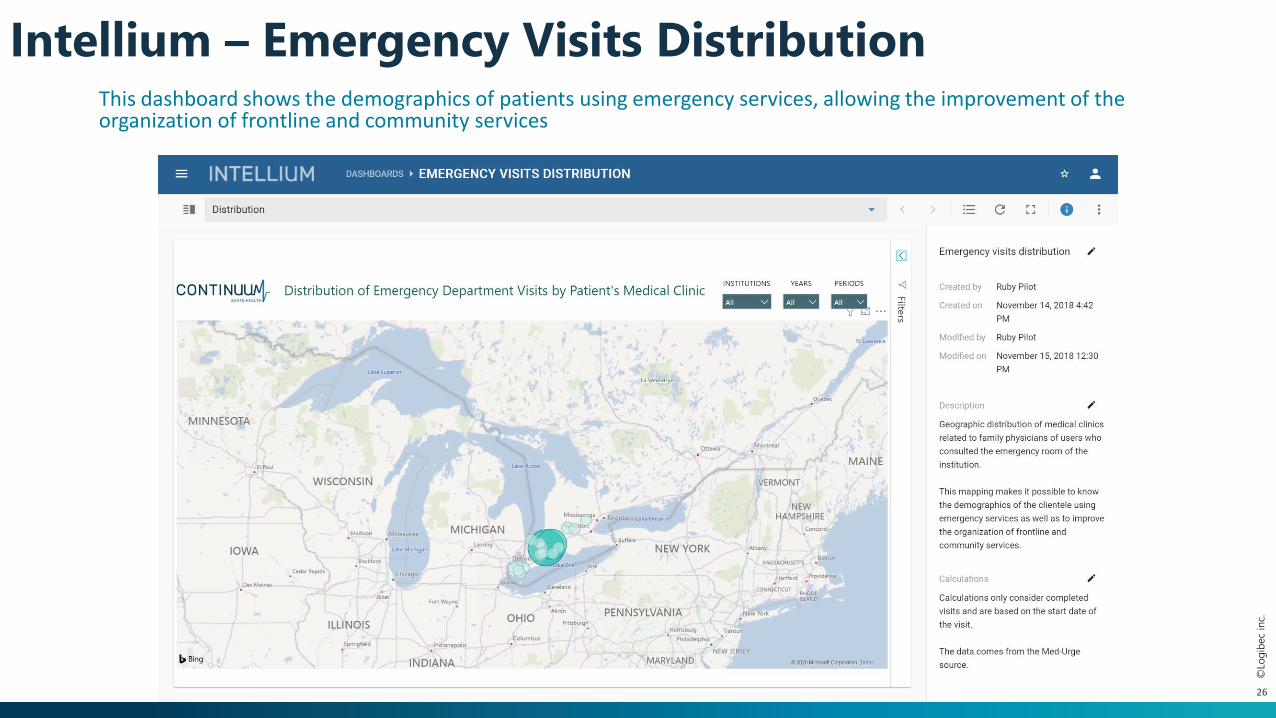
Intellium – Emergency Visits DistributionThis dashboard shows the demographics of patients using emergency services, allowing the improvement of the organization of frontline and community services

©Lo
gib
ec
inc.
27
Intellium – Overview: real-time ED situationReal-time information provided anytime and on any device to have a complete overview of the emergency department situation and make quick decisions

©Lo
gib
ec
inc.
Intellium – Complications analysisIndicators set analyzing postoperative infections, accident, and complications during the hospital stay. Because complications and infections can be very closely related to an increasing length of stay, this is a key indicator in care / process management. KPIs are built in to alert you when exceeding literature accepted standards.
©Lo
gib
ec
inc.
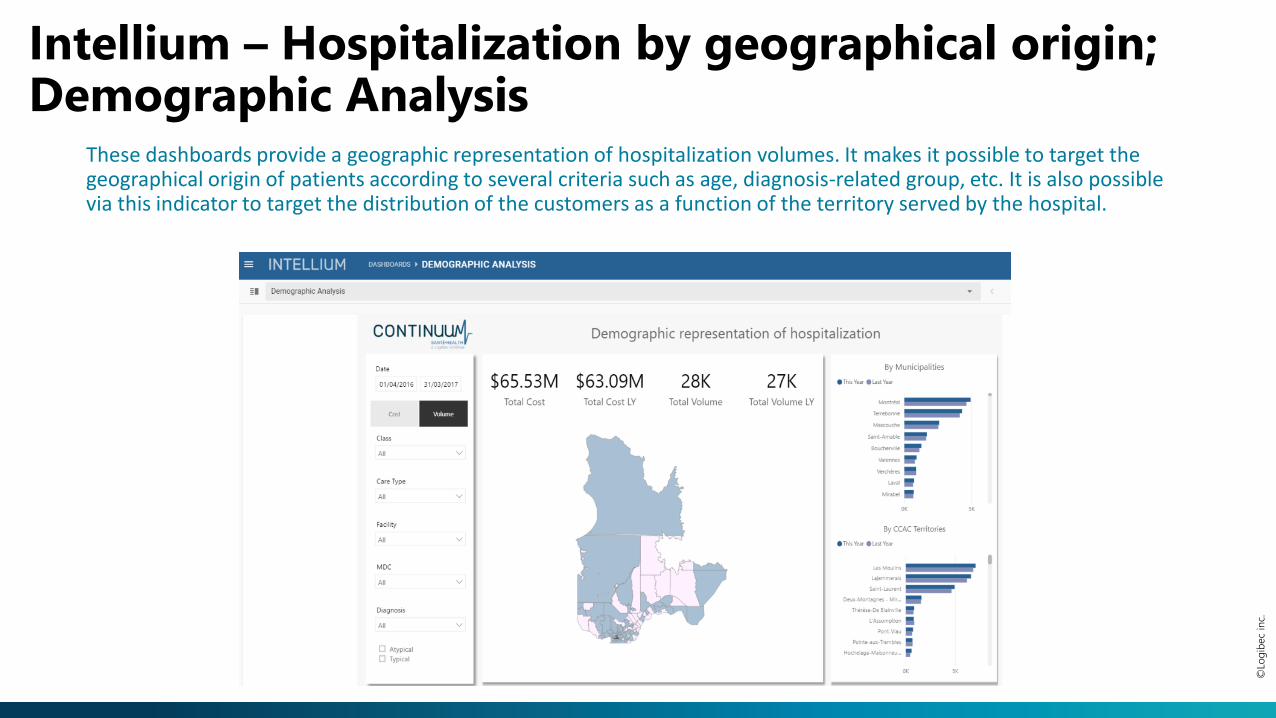
Intellium – Hospitalization by geographical origin; Demographic Analysis
These dashboards provide a geographic representation of hospitalization volumes. It makes it possible to target the geographical origin of patients according to several criteria such as age, diagnosis-related group, etc. It is also possible via this indicator to target the distribution of the customers as a function of the territory served by the hospital.

©Lo
gib
ec
inc.
Intellium – Operating room
Indicators showing the use of the rooms by month, by specialties, with the rate and reason of cancellations. It allows users to evaluate the efficiency of rooms and the planning of operations by month or period of the year.

©Lo
gib
ec
inc.
Intellium – Readmission rate An overview of the readmission rate of your healthcare establishment comparing actual and previous years, as well as by clinical domain
©Lo
gib
ec
inc.
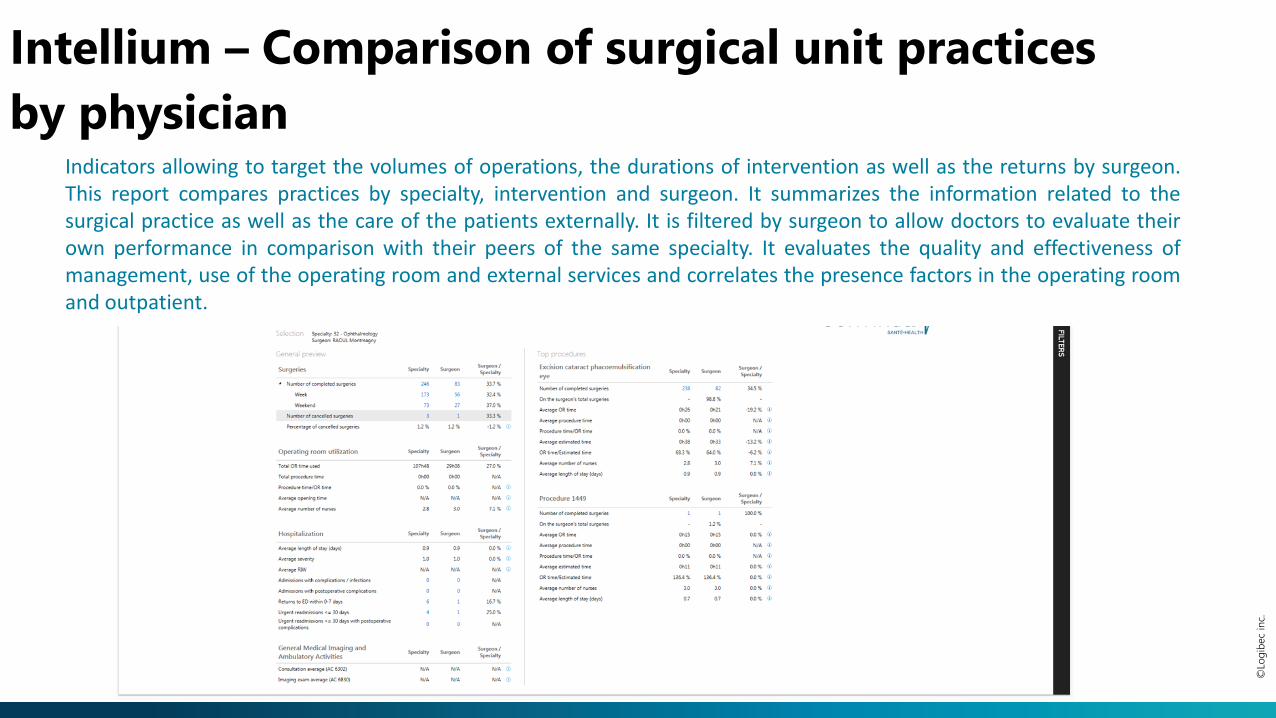
Intellium – Comparison of surgical unit practices
by physicianIndicators allowing to target the volumes of operations, the durations of intervention as well as the returns by surgeon.This report compares practices by specialty, intervention and surgeon. It summarizes the information related to thesurgical practice as well as the care of the patients externally. It is filtered by surgeon to allow doctors to evaluate theirown performance in comparison with their peers of the same specialty. It evaluates the quality and effectiveness ofmanagement, use of the operating room and external services and correlates the presence factors in the operating roomand outpatient.
©Lo
gib
ec
inc.
33
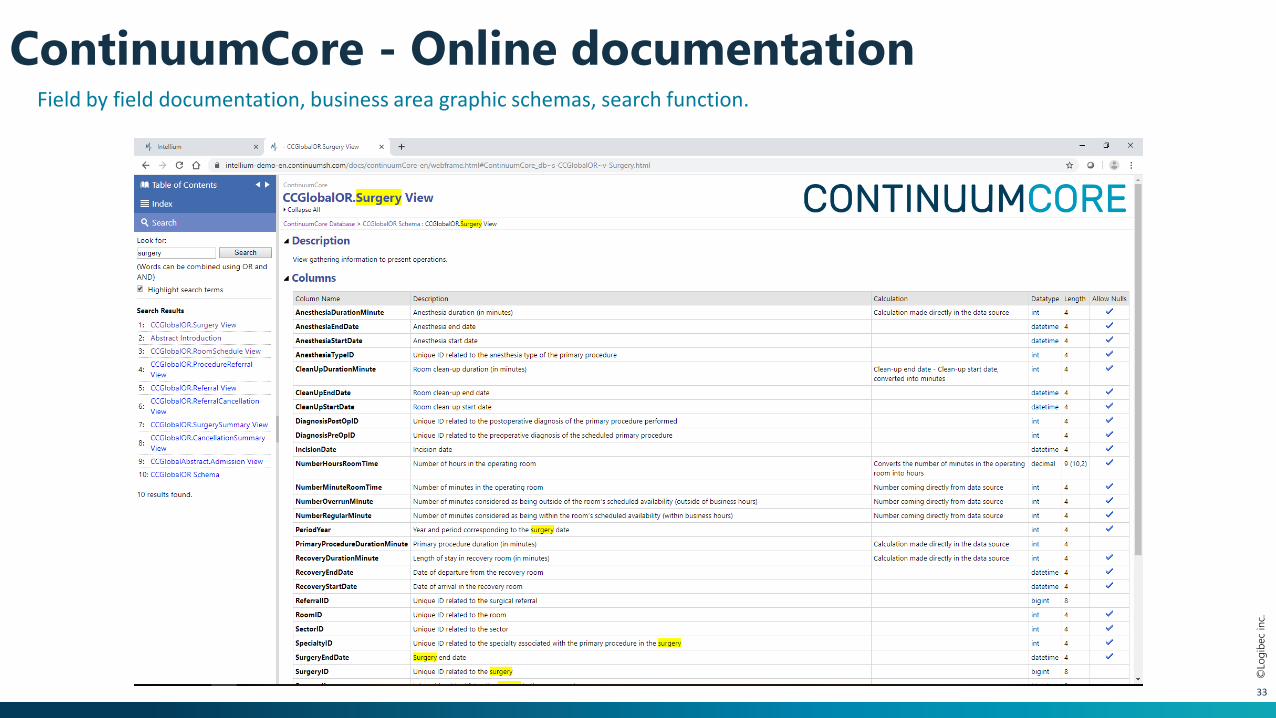
ContinuumCore - Online documentationField by field documentation, business area graphic schemas, search function.
www.continuumsh.com [email protected] T. 1 800 361-9659
For Information
Gabriel DelisleDirector, Continuum Health