Valuation of New Goods under Perfect and Imperfect Competition

1
Perfect and Imperfect Real-Time Monitoring in a
Minimum-Effort Game
Cary Deck Nikos Nikiforakis1 Department of Economics Department of Economics
Walton College of Business University of Melbourne University of Arkansas email: [email protected]
email: [email protected]
June 24, 2010
Abstract
This paper presents the results from a minimum-effort game in which individuals can
observe the choices of others in real time. We find that under perfect monitoring
almost all groups coordinate at the payoff-dominant equilibrium. However, when
individuals can only observe the actions of their immediate neighbors in a circle
network, monitoring improves neither coordination nor efficiency relative to a
baseline treatment without real-time monitoring. We argue that the inefficiency of
imperfect monitoring is due to information uncertainty, that is, uncertainty about the
interpretation of the information available regarding the actions of others.
Keywords: minimum effort game, information uncertainty, real time monitoring,
circle network, cheap talk.
JEL Classification: C72, C92, D82
1 Correspondence should be directed to Dr. Nikos Nikiforakis, Department of Economics, The University of Melbourne, 3010, Victoria, Australia. Phone: +61 383449717. Fax: +61 38344 6899, e-mail: [email protected]

2
1. Introduction
A successful organization, whether large or small, must coordinate the actions of
its individual members. The impact of the inefficiency arising from coordination
failure can be so substantial as to determine which firms dominate an industry (e.g.
Ichniowski, Shaw and Prennushi, 1997; Knez and Simester, 2001; Milgrom and
Roberts, 1992) and influence the development of countries (Hirschman, 1958;
Kremer, 1993; Murphy, Shleifer and Vishny, 1989; Myrdal, 1957; Rosenstein-Rodan,
1943). Accordingly, economists have devoted considerable attention to understanding
how coordination failure can be avoided.
This paper contributes to this literature by showing how the ability to monitor the
concurrent actions of others affects group coordination in a laboratory experiment. As
a testing ground we use the minimum-effort game (see Table 1). The game, which has
multiple Pareto-ranked pure-strategy Nash equilibria, models situations in which the
group outcome depends on the performance of the ‘weakest link.’ An important
feature of the minimum-effort game is the tension that exists between the secure
action and the action required to maximize earnings. The secure choice is to exert
minimal effort which maximizes the minimum possible payoff. However, in order to
maximize earnings each group member must exert maximal effort.
A large body of experiments on the minimum-effort game has established that
when individuals are not able to monitor the actions of others they have difficulty in
coordinating at the payoff-dominant equilibrium (see Devetag and Ortmann, 2007).
The leading explanation for coordination failure is strategic uncertainty, that is,
uncertainty regarding the actions of others due to the existing tension in incentives. As
Van Huyck, Battalio and Beil (1990; p.247) explain “some subjects conclude that it is
too ‘risky’ to choose the payoff-dominant action.”2
Strategic uncertainty implies that allowing individuals to monitor the actions of
others could lead to improvements in coordination and efficiency. We study the
impact of monitoring on coordination under perfect real-time monitoring when
individuals can observe the actions of all group members in real time; imperfect real-
time monitoring when individuals can only observe the concurrent actions of their
immediate neighbors in a circle network; and no real-time monitoring when
2 In line with this explanation, Goeree and Holt (2005) show that outcomes in the minimum-effort game are a function of the cost of effort: the lower the cost is the more likely groups are to coordinate at the payoff-dominant equilibrium.

3
individuals make their choices with no information about the concurrent choices of
others.
Real-time monitoring should not be confused with ex-post monitoring. Ex-post
monitoring means that individuals can observe the choices of others at the end of a
period, that is, after earnings are realized. Based on this information, subjects can
adjust their behavior in the following period. While our study is the first to examine
the impact of real-time monitoring on coordination, at least four studies have
examined the effect of perfect ex-post monitoring. The results are mixed. Berninghaus
and Ehrhart (2001) and Brandts and Cooper (2006) find that perfect ex-post
monitoring reduces coordination failure. In contrast, Devetag (2005) and Van Huyck,
Battalio and Beil (1990) find that perfect ex-post monitoring leads to outcomes which
are as inefficient as those under no monitoring.
Real-time monitoring is common outside the laboratory. Employees working on a
team project can usually monitor the progress of their colleagues and adjust their
effort accordingly. For example, they can work harder to finish the project earlier if
others have been working hard or they can slow down if others appear to be taking
longer. Furthermore, the ability to monitor the actions of others in real time removes
some of the uncertainty associated with exerting greater effort. For this reason, we
expect that, all else equal, real-time monitoring will lead to more efficient outcomes
than ex-post monitoring.
A novel feature of our study is the analysis of imperfect monitoring. In naturally
occurring settings it may not be feasible to provide perfect monitoring. This begs the
question: Will imperfect monitoring improve efficiency? In principle, strategic
uncertainty is greater under imperfect than under perfect monitoring. However,
circular networks (like the one we investigate) allow information to flow among
individuals. That is, a person can indirectly monitor her neighbor’s neighbor. So if,
for example, one observes his neighbor choosing a high level of effort he might
conclude that his neighbor’s neighbor is also choosing a high level of effort. For this
reason, we hypothesize that that imperfect monitoring will improve efficiency relative
to the condition without real-time monitoring, but lead to outcomes no more efficient
than under perfect monitoring.
The paper proceeds as follows. The next section offers a brief review of studies
related to the experiment presented in this paper. Section 3 describes the experimental
design and procedures. Section 4 presents the results from the experiment. Our main

4
findings are the following: Under perfect monitoring, almost all groups manage to
eventually coordinate at the payoff-dominant equilibrium. However, under imperfect
monitoring, efficiency is as low as in our baseline treatment without real-time
monitoring. This result is perhaps surprising given that individuals are placed in a
circular network which allows the flow of information from one group member to
another. In section 5, we provide evidence suggesting that imperfect monitoring does
not fully eliminate strategic uncertainty due to information uncertainty, that is,
uncertainty about the correct interpretation of the available information concerning
the actions of others. Section 6 concludes by discussing the implications of our results
and suggesting questions that can be addressed in future research.
2. Literature review
To date there here have been only a few studies on the effects of real-time
monitoring. All of these studies have focused exclusively on social dilemmas.
Dorsey (1992) was the first to conduct an experiment using real-time monitoring.
In some treatments, subjects were only allowed to increase their contribution over
time (a kind of commitment), while in other treatments they were allowed to both
increase and decrease their contributions (cheap talk). Dorsey studied the effects of
these rules on cooperation by using a linear voluntary contribution mechanism and a
provision-point mechanism.3 The results show that, in general, real time monitoring
improves cooperation rates, but that this effect is significant only when a provision
point is used and contributions are irrevocable. The latter is presumably due to the
fact that the irrevocability of contributions alleviates any concerns about last minute
defections.4
Kurzban, Rigdon and Wilson (2008) study behavior in a real-time trust game.5
The real-time environment allows first movers to evaluate the intentions of the second
movers, but also provides incentives for second movers to avoid exploiting the first-
movers’ trust early in the game. The authors report that while results are mixed, in
general, real-time monitoring improves efficiency. 3 The linear voluntary contribution mechanism is analogous to a Prisoner’s Dilemma with n players and m strategies (see Gangadharan and Nikiforakis 2009). The provision-point mechanism is similar to the voluntary contribution mechanism. The difference is that unless a certain level of cooperation is reached, the public good is not provided. 4 Similar results are reported in Goren, Kurzban and Rapoport (2003), Goren, Rapoport and Kurzban (2004), Kurzban, McCabe, Smith and Wilson (2001), and Duffy, Ochs and Vesterlund (2007). 5 The trust game is a social dilemma in which two players move sequentially. One player makes a money transfer to another which increases total surplus. The second player must then decide whether to return a part of the money he received.

5
Our experiment contributes towards a better understanding of the properties of
real-time monitoring. The fact that we use a coordination game simplifies our
analysis relative to previous studies by removing any concerns that individuals may
have regarding the existence of free-riding incentives.
Note that in our experiment subjects can adjust their intended level of effort both
upwards and downwards. Therefore, the decisions during a period are a form of cheap
talk. Numerous previous studies have shown that costless pre-play communication
improves coordination and increases efficiency in coordination games (see Bangun,
Chaudhuri, Prak and Zhou 2006; Blume and Ortmann 2007; Cooper, De Jong,
Forsythe and Ross 1992; Duffy and Feltovich 2002, 2006; Van Huyck, Gillette and
Battalio 1992). These results provide additional support for our hypothesis that real-
time monitoring will have a positive effect on coordination. We are not aware of any
studies in which cheap talk occurs only between a subset of the parties involved. In
this context, our Neighbors treatment resembles the well-known children’s game
“Broken Telephone” or “Chinese Whispers”.
3. The experiment
The minimum-effort game
The experiment uses the minimum-effort game of Van Huyck et al. (1990). The
basic game is as follows. Let e1, …, en denote the effort level chosen by n players in a
group. The dollar payoff for each individual i is
πi (ei, e-i) = a + b * min (ei, e-i) – c * ei
where e-i = min(e1, …, ei-1, ei+1, ..., en) and ei ∈ {1, 2, ... e }. In the experiment the
payoff function and the parameter values a = 0.6, b = 0.25, c = 0.1, e = 7 and n = 6
are common information.
The parameters used in the experiment generate the payoff matrix seen in Table
1. The game has seven Pareto-ranked pure-strategy Nash equilibria in which ei=ej for
all i and j.6 The payoff-dominant equilibrium is ei = 7 for all i. The maximum payoff
is therefore πi(7, 7) = 1.65. However, choosing ei = 7 is risky in the sense that the
player might earn πi(7, 1) = 0.15. The action that maximizes the minimum possible
payment, and thus the safest choice, is ei = 1. Choosing ei = 1 guarantees πi(1, ) =
0.75.
6 The game also has a continuum of mixed-strategy equilibria (see Anderson, Goeree, and Holt, 2001).

6
Experimental treatments
Behavior in the basic game is investigated in three experimental treatments. The
treatments differ with respect to the subjects’ monitoring abilities. In the Baseline
treatment individuals cannot monitor the choices of others before making a decision.
The game in Baseline is therefore equivalent to the static game. In the Neighbors
treatment individuals can observe the concurrent effort choices of their two immediate
neighbors in a circle network. Finally, in the Community treatment individuals can
observe the concurrent effort choices of all five other group members.
Group composition remains the same for the duration of the experiment in all
treatments. Despite this, participants cannot identify the other group members as there
are always multiple groups in each experimental session.
The game is repeated 10 times. At the beginning of each period, individuals are
given 60 seconds in which they can choose their effort level, ei. The starting value for
effort is ei = 1. At any point during the period, effort can be adjusted upwards or
downwards subject to the constraint that 1 < ei < 7. The effort level at the end of 60
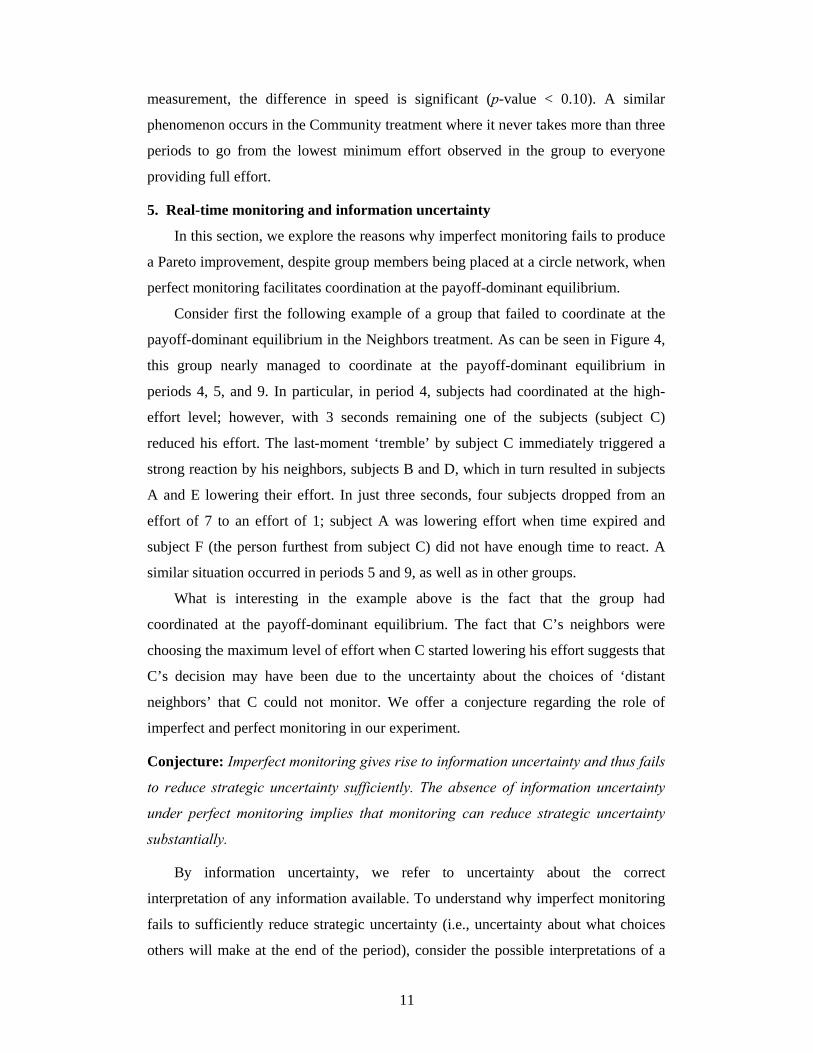
seconds is used to determine payoffs. A sample screen from the Neighbors treatment
is shown in Figure 1. As can be seen, subjects can observe the remaining decision
time and adjust their own choice using arrows (both on the left edge of the screen). A
profit calculator is provided to assist subjects with their decisions (bottom of the
screen). The experimental design is summarized in Table 2.
Information
To focus on the impact of real-time monitoring, individuals in all treatments are
informed about the final choice of each group member. Therefore, all of the
treatments involve ex-post monitoring, and thus our approach for evaluating the
positive effects of real-time monitoring is conservative. Apart from the real-time
information, at the end of each of the 10 periods, each individual is informed about
his payoff from the period. Participants are also given a table with information about
their past actions in the experiment and the associated payoffs (see Figure 1).
The payoff function, the size of the groups, the matching protocol, the number of
periods and the information to be received are explicit in the instructions and common

7
knowledge.7 Note that to simplify the discussion, when discussing monitoring
henceforth, we will be referring to real-time monitoring unless otherwise specified.
Hypothesis
In all three treatments, the Nash equilibrium predictions of the static game are
identical. However, the nature of monitoring in each treatment could impact on
equilibrium selection.
The Baseline treatment is similar to previous experiments with perfect ex-post
monitoring and includes fixed groupings. These factors are expected to have a
positive effect on coordination and profitability as compared to previous results
obtained using random groupings and no ex-post monitoring (see Schmidt, Shupp,
Walker and Ostrom 2003; Van Huyck, Battalio, and Beil 1990).
Intuition suggests that perfect monitoring in the Community treatment should
improve coordination and efficiency as strategic uncertainty is greatly (if not fully)
reduced. This hypothesis is supported by the empirical evidence from the studies
discussed in section 2.
Predicting the effect of imperfect monitoring is less straightforward. Subjects
have an intermediate level of information and thus one might expect effort choices to
lie somewhere between that in Community and Baseline. At the same time, the effort
choice of one’s neighbor reflects information about what others are doing and thus
one can indirectly monitor everyone in the group. Therefore our a priori hypothesis is
as follows:
Hypothesis: Efficiency will be higher with perfect monitoring (Community) than
without monitoring (Baseline). Efficiency with imperfect monitoring (Neighbors) will
be at least as high as without monitoring, but not higher than with perfect monitoring.
Procedures
One hundred and eighty students from Chapman University participated in the
experiment (60 participants per treatment). Students were drawn from the general
undergraduate population. Each student took part in only one of the treatments.
Sessions lasted approximately forty five minutes on average including instruction
time. After reading the instructions and answering a set of control questions which
ensured that subjects understood the properties of the game, a summary of the
7 The experimental instructions, questionnaire, and summary announcements can be downloaded at www.economics.unimelb.edu.au/nnikiforakis.

8
instructions was read aloud. Participants were paid in cash at the completion of the
experiment. Participants received a show up payment of $7. Average salient earnings
were $10.42.
4. Results
We use four metrics for evaluating group performance in the different treatments:
minimum effort, total effort, wasted effort and profit. Given our ordered hypothesis,
all tests are one-sided Mann-Whitney tests unless otherwise noted. Information at the
group-level can be found in Table A1 in the appendix.
Minimum and Total Effort
The left panel of Figure 2 presents the average minimum effort level in each
period for every treatment. The right panel of Figure 2 presents the average total
effort in each period by treatment. Three patterns from these figures are noteworthy.
First, imperfect monitoring increases neither the minimum nor the total effort
level relative to the Baseline. This is somewhat unexpected given that individuals are
placed in a circle network. The performance is not significantly different for either
metric (p-values 0.323 and 0.381 for minimum effort and total effort, respectively).
Second, in contrast to imperfect monitoring, perfect monitoring facilitates
coordination at the payoff-dominant equilibrium. Eight of the ten groups managed to
coordinate at the payoff-dominant equilibrium.8 The minimum level of effort is
significantly higher in Community than in either Baseline or Neighbors (p-values
0.017 and 0.051, respectively). The difference in average total effort between
Community and Neighbors is significant (p-value = 0.065). The difference in average
total effort between Community and the Baseline is marginally insignificant (p-value
= 0.128).
Third, effort levels tend to increase over time in all three treatments. This can in
part be explained by the fixed matching and the revelation of individual effort levels
at the end of the period. The increase in the minimum effort level is significant in all 8 A post-experiment questionnaire (together with evidence presented later in Figure 5 and Table A1) suggest that one member in each of the two groups that failed to reach the payoff-dominant equilibrium had not understood correctly the incentives in the game despite having completed the control questionnaire. Their behavior and responses suggests that they perceived the game as a social dilemma rather than a coordination game. This may have been due to prior exposure of the participants to social dilemmas or other competitive environments. These incidents demonstrate the fragility of coordination in minimum effort games. Many of the statistical comparisons presented in this subsection would have lower p-values if these groups were omitted from the analysis. That the comparisons remain significant when the groups are included, demonstrates the substantial improvement in coordination with perfect monitoring.

9
treatments based on a Spearman test (p-values<0.01). The upward trend could suggest
that groups in the Baseline and the Neighbors treatment would perhaps eventually
coordinate on the payoff-dominant equilibrium if the experiment was to last longer.
The aggregate information presented in Figure 2, however, masks the considerable
between-group variation in these treatments.
Figure 3 presents the evolution of minimum effort separately for each group.
Five of the ten groups in the Baseline treatment were able to coordinate on the
payoff-dominant equilibrium after steady gradual improvements. Of the remaining
five groups, four quickly collapsed and remained at (or near) the lowest effort level
providing further evidence to the finding discussed in the introduction that perfect ex-
post monitoring does not necessarily lead to coordination at the payoff-dominant
equilibrium. In the Neighbors treatment, only four of the ten groups managed to
coordinate at the payoff-dominant equilibrium. Of the remaining six groups, five
collapsed at the lowest effort level suggesting that extending the duration of the
experiment would not necessarily lead to further increases in minimum and total
effort. Result 1 summarizes the main findings from this subsection.
Result 1: Minimum and total effort are highest under perfect monitoring
(Community). Imperfect monitoring (Neighbors) increases significantly neither the
minimum effort nor the total effort relative to the Baseline treatment without real-
time monitoring.
Profit and Wasted Effort
Perhaps the most appropriate measure of efficiency is the experimental profits of
individuals in each treatment. Despite the fact that the minimum effort level in the
Neighbors treatment is similar to that in the Baseline treatment, it is possible that
imperfect monitoring has a positive effect on average profits (and efficiency) by
reducing coordination failure (i.e. ei ≠ e-i for some i).
To measure the extent of coordination failure we define wasted effort as
1
*min{ , }n
i i ii
WE e n e e−=
= −∑ . Average wasted effort is highest in Baseline (8.05)
followed by Neighbors (4.76) and Community (2.31). Using group-level
observations, the difference between Community and Baseline is significant (p-value
< 0.001) as are the differences between Community and Neighbors (p-value = 0.061)
and Baseline and Neighbors (p-value = 0.014, respectively). It is interesting to note

10
that, the reduction in wasted effort is manifest immediately. Wasted effort in the first
period is highest in Baseline (15.90) followed by Neighbors (10.40) and Community
(5.10) (all pairwise comparisons, p-value < 0.015), despite there being no statistical
difference between any of the three treatments in terms of minimum effort.
Profits in the experiment reflect the minimum effort exerted in a treatment as
well as wasted effort. Given that the minimum effort is not significantly different in
Baseline and Neighbors while imperfect monitoring reduces wasted effort, it is
interesting to see whether profits are higher in the Neighbors treatment than in the
Baseline treatment. If a group coordinated on the payoff-dominant outcome in every
period then each subject would have earned $16.50. The worst possible payoff
outcome is where one person chooses the minimum effort while everyone else
chooses the maximum effort every period resulting in an average payoff of $2.50.
Average profit per subject was $12.37 in the Community treatment, $10.00 in the
Neighbors treatment, and $8.59 in the Baseline. Therefore, efficiency measured as the
percentage of possible gains achieved was 71% in Community, 53% in Neighbors,
and 45% in the Baseline.9 Average profit is significantly higher in the Community
treatment than in either the Baseline or the Neighbors treatment (p-values = 0.010 and
0.076, respectively). Despite the monitoring opportunities that exist in Neighbors,
profit is not statistically higher than it is in Baseline (p-value = 0.145). Therefore, we
conclude that real-time monitoring does not improve efficiency in our experiment.
Result 2 summarizes the main findings from this subsection.
Result 2: Profits are highest under perfect monitoring (Community). Despite
reducing wasted effort, profits are not significantly higher under imperfect
monitoring (Neighbors) relative to the Baseline treatment without real-time
monitoring.
Speed of Pareto improvement
One pattern that distinguishes the Neighbors from the Baseline treatment is the
speed at which efforts increase across periods; the rate of increase from a low
minimum effort to the optimal level is much faster in the Neighbors treatment (Figure
3). Using the number of periods from the lowest minimum effort to the maximum
level conditional on the maximum level being obtained by period 10, as the unit of 9 Efficiency is calculated as (realized profit – minimum possible profit)/(maximum possible profit – minimum profit) or in this case (realized profit – $2.50)/$14. Since the minimum and maximum profit are the same across treatments the same statistical results hold for efficiency that hold for profit.
11
measurement, the difference in speed is significant (p-value < 0.10). A similar
phenomenon occurs in the Community treatment where it never takes more than three
periods to go from the lowest minimum effort observed in the group to everyone
providing full effort.
5. Real-time monitoring and information uncertainty
In this section, we explore the reasons why imperfect monitoring fails to produce
a Pareto improvement, despite group members being placed at a circle network, when
perfect monitoring facilitates coordination at the payoff-dominant equilibrium.
Consider first the following example of a group that failed to coordinate at the
payoff-dominant equilibrium in the Neighbors treatment. As can be seen in Figure 4,
this group nearly managed to coordinate at the payoff-dominant equilibrium in
periods 4, 5, and 9. In particular, in period 4, subjects had coordinated at the high-
effort level; however, with 3 seconds remaining one of the subjects (subject C)
reduced his effort. The last-moment ‘tremble’ by subject C immediately triggered a
strong reaction by his neighbors, subjects B and D, which in turn resulted in subjects
A and E lowering their effort. In just three seconds, four subjects dropped from an
effort of 7 to an effort of 1; subject A was lowering effort when time expired and
subject F (the person furthest from subject C) did not have enough time to react. A
similar situation occurred in periods 5 and 9, as well as in other groups.
What is interesting in the example above is the fact that the group had
coordinated at the payoff-dominant equilibrium. The fact that C’s neighbors were
choosing the maximum level of effort when C started lowering his effort suggests that
C’s decision may have been due to the uncertainty about the choices of ‘distant
neighbors’ that C could not monitor. We offer a conjecture regarding the role of
imperfect and perfect monitoring in our experiment.
Conjecture: Imperfect monitoring gives rise to information uncertainty and thus fails
to reduce strategic uncertainty sufficiently. The absence of information uncertainty
under perfect monitoring implies that monitoring can reduce strategic uncertainty
substantially.
By information uncertainty, we refer to uncertainty about the correct
interpretation of any information available. To understand why imperfect monitoring
fails to sufficiently reduce strategic uncertainty (i.e., uncertainty about what choices
others will make at the end of the period), consider the possible interpretations of a

12
neighbor’s choice. A high level of effort by a neighbor can be interpreted in two
ways. On the one hand, it may be interpreted as evidence that ‘distant neighbors’ are
also choosing high effort levels. On the other hand, it may be interpreted more
pessimistically, as a signal to a distant neighbor exerting low effort to increase his
effort. By contrast, there can be little (if any) uncertainty about the correct
interpretation of the available information under perfect monitoring. Of course,
participants may still be concerned that other group members are concerned about last
minute ‘trembles’. Thus, perfect monitoring does not eliminate strategic uncertainty
fully, but it reduces it substantially.
It is possible that, under imperfect monitoring, the interpretation of the
information contained in a neighbor’s choice will depend on past outcomes. If a
group managed to successfully coordinate at the payoff-dominant equilibrium in
previous periods, then a high effort by a neighbor may be more likely to be
interpreted as a sign that distant neighbors are also choosing high levels of effort. In
contrast, if a group failed repeatedly to coordinate successfully in the past (like the
group in the example at the start of this section), then a neighbor’s high level of effort
may be interpreted as a signal to others to increase effort and not as a signal that
others are choosing high levels of effort. Further, it is possible that the revelation at
the end of the period that some distant group members chose low effort levels will
reinforce beliefs that neighbors’ high effort levels were mere signals.
All this implies that escaping coordination failure can be very difficult under
imperfect monitoring: past failed attempts at coordination are likely to make
individuals more pessimistic, that is, less likely to respond to a group member’s high
level of effort with high effort and more likely to respond to any indication that others
are not exerting high effort with a reduction of their own effort. This in turn makes it
more likely that future outcomes will involve low levels of effort. By contrast, under
perfect monitoring, the absence of information uncertainty may allow groups to
overcome previous failed attempts at coordination.
In order to provide some support for our conjecture, Figure 5 presents the
evolution of average effort within periods in each treatment. The figure reveals two
interesting facts. First, in periods 1-5, average effort increases in the first 15 seconds
in both the Community and Neighbors treatment. It then remains stable until
approximately 10 seconds before the end of the period when a sharp decline in effort
occurs. To determine whether this decline is significant, we compare average effort

13
10 seconds prior to the end of the period to end-of-period effort. We find that there is
a significant decrease in both Community and Neighbors (Wilcoxon, two-tailed, p-
value = 0.005 in both treatments), but not in Baseline (p-value = 0.247). In fact, the
average effort 10 seconds before the end of a period is higher than the end-of-period
effort in all groups in both the Community and the Neighbors. The result is that end-
of-period effort is at a similar level in Community and Baseline treatments, while it is
slightly lower in Neighbors. This can also be seen in Figure 2 (Panel B).
The second interesting fact can be seen in Panel B of Figure 5 which presents the
evolution of average effort in periods 6-10. The figure suggests that the sudden drop
in effort prior to the end of the period persists in the second half of the experiment in
the Neighbors treatment, but not in the Community treatment. The reduction in effort
in the last 10 seconds of a period is significant in Neighbors (Wilcoxon, two-tailed, p-
value = 0.008), but neither in Community nor in Baseline (p-values = 0.324 and
0.603, respectively). The average effort 10 seconds before the end of a period is
higher than the end-of-period effort in 8 out of 10 groups in the Neighbors treatment.
Result 3 summarizes.
Result 3: In the first half of the experiment, effort decreases significantly a few
seconds prior to the end of a period under both perfect and imperfect monitoring.
This pattern persists in the second half of the experiment under imperfect but not
under perfect monitoring.
Result 3 is in line with our conjecture. It appears that groups have difficulty
overcoming coordination failure under imperfect monitoring whereas this is not the
case under perfect monitoring. As indicated by the example at the start of this section,
a reduction in the effort of a group member triggers quick reductions by other
members in the Neighbors treatment. The cascading response to the negative
information is akin to a run on a bank or panic selling of a stock. Such panics do not
endure in the Community treatment due to the absence of information uncertainty.
This allows individuals to establish if a reduction in effort is an isolated tremble (and
thus likely to be temporary) or part of a general trend.
5. Conclusion
This paper presented the results from an experiment investigating whether real-
time monitoring can improve coordination in the minimum-effort game. The results

14
show that the form of monitoring is critical. While perfect monitoring leads to
significant Pareto improvements relative to a control treatment without real-time
monitoring, imperfect monitoring does not. When monitoring is imperfect (that is,
when individuals can only observe the choices of a subset of their group members),
50% of the groups converged to the equilibrium with the lowest effort similar to the
rate observed in the control treatment with no monitoring. This is surprising given that
individuals are placed in a circular network that allows the flow of information across
the network. In contrast, almost all groups managed to coordinate at the payoff-
dominant equilibrium under perfect monitoring.
The data suggests that the inability of groups to overcome coordination failure
under imperfect monitoring can be attributed to information uncertainty, that is,
uncertainty regarding the correct interpretation of a neighbor’s choice. A high effort
level may signal that a distant neighbor is also exerting a high effort level, but it could
also be a signal for distant neighbors to increase their effort. Information uncertainty
implies that there is still considerable uncertainty regarding how other group members
will make their decisions.
The result of information uncertainty is that under imperfect monitoring groups
frequently experienced a ‘panic’ a few seconds before the end of a period. The result
was a sudden reduction in effort from the highest to the lowest level. Some of the
groups managed to overcome these panics, but most did not. By contrast, the absence
of information uncertainty with perfect monitoring implies that monitoring mitigates
strategic uncertainty and enabled groups to eventually coordinate at the payoff-
dominant equilibrium.
Strategic uncertainty is a common feature in many organizations, particularly in
those where performance depends critically on the performance of the weakest link.
Camerer (2003) gives the example of an airplane that is not ready for departure until
baggage loading, security inspection, and cabin cleaning have been completed. One
can also think of numerous other examples from an assembly line production process
to supply chains. Our results imply that information uncertainty may hinder
coordination and thus imperfect monitoring may be insufficient to improve
performance relative to ex-post monitoring.
Our results are similar to those in Chaudhuri, Schotter and Sopher (2009) who
investigate the use of (free-form) advice as a coordinating device in the minimum-
effort game. The game is played by non-overlapping generations of players who, after

15
they play the game, pass on advice to their successors who take their place in the
game. The results show that coordination is most likely to result when the advice is
made public and distributed in a manner that makes it common knowledge. Our
results are also reminiscent of the bullwhip effect in experiments in supply-chain
management (e.g., Croson and Donohue, 2006). In these experiments, individuals are
placed in a linear network and must coordinate their actions in order to maximize their
earnings. Information about downstream players reduces, but does not eliminate, the
bullwhip effect which is a form of coordination failure.
The experimental evidence presented in this paper suggests a range of
interesting extensions. First, future studies could explore whether imperfect real-time
monitoring can improve coordination and efficiency in network structures different
from the one explored here. Second, it would also be interesting to explore whether
imperfect monitoring continues to fail to improve outcomes when individuals can
commit to their level of effort (i.e. when effort is not cheap talk). Third, future studies
could examine whether imperfect monitoring fails to improve coordination and bring
forth Pareto improvements in coordination games where outcomes are not determined
by the weakest link. Finally, it will be interesting to study the impact of imperfect
monitoring in different games such as the public-good game.
Acknowledgements
The authors would like to thank Lata Gangadharan, Charles Noussair, seminar
participants at the University of Melbourne and two anonymous referees for valuable
comments. We would also like to thank the Information Technology Research
Institute at the University of Arkansas and the Economic Science Institute at
Chapman University for support.
References
Anderson, S., Goeree, J. and Holt C. (2001). Minimum-Effort Coordination
Games: Stochastic Potential and Logit Equilibrium. Games and Economic
Behavior, 34, 177-199.
Bangun, L., Chaudhuri, A., Prak, P., and Zhou, C. (2006). Common and Almost
Common Knowledge of Credible Assignments in a Coordination Game.
Economics Bulletin, 3, 1–10.

16
Berninghaus, S. and Ehrhart, K.-M. (2001). Coordination and Information: Recent
Experimental Evidence. Economics Letters, 73, 345-351.
Blume, A. and Ortmann, A. (2007). The Effects of Costless Pre-Play Communication:
Experimental Evidence from Games with Pareto-Ranked Equilibria. Journal of
Economic Theory, 132, 274-290.
Brandts, J. and Cooper, D. (2006). Observability and Overcoming Coordination
Failure in Organizations. Experimental Economics, 9, 407-423.
Camerer, C. (2003). Behavioral Game Theory: Experiments in Strategic Interaction.
Princeton: Princeton University Press.
Chaudhuri, A. Schotter, A., and Sopher, B. (2009). Talking Ourselves to Efficiency:
Coordination in Inter-Generational Minimum Effort Games with Private,
Almost Common and Common Knowledge of Advice. The Economic Journal,
119, 91–122.
Cooper, R., De Jong, D., Forsythe, R., and Ross, T. (1992). Communication in
Coordination Games. Quarterly Journal of Economics, 107, 739-771.
Croson, R., and Donohue, K. (2006). Behavioral Causes of the Bullwhip Effect and
the Observed Value of Inventory Information. Management Science 52(3), 323-
336.
Devetag, G. (2005). Precedent transfer in coordination games: An experiment.
Economics Letters, 89, 227–232.
Devetag, G. and Ortmann, A. (2007). When and Why? A Critical Survey On
Coordination Failure in the Laboratory. Experimental Economics, 10, 331–344.
Dorsey, R. (1992). The Voluntary Contributions Mechanism with Real Time
Revisions. Public Choice, 73, 261-282.
Duffy, J., and Feltovich, N. (2002). Do Actions Speak Louder than Words?
Observation vs. Cheap Talk as Coordination Devices. Games and Economic
Behavior, 39, 1–27.
Duffy, J., & Feltovich, N. (2006).Words, Deeds and Lies: Strategic Behavior in
Games with Multiple Signals. Review of Economic Studies, 73, 669–688.

17
Duffy, J., Ochs, J., and Vesterlund, L. (2007). Giving Little by Little: Dynamic
Voluntary Contribution Games. Journal of Public Economics, 91, 1708–1730.
Gangadharan, L. and Nikiforakis, N. (2009). Does the Size of the Action Set Matter
for Cooperation? Economics Letters, 104, 115-117.
Goeree, J. and Holt C. (2005). An Experimental Study of Costly Coordination. Games
and Economic Behavior, 51, 349-364.
Goren, H., Kurzban, R., and Rapoport, A. (2003). Social Loafing vs. Social
Enhancement: Public Good Provisioning in Real Time with Irrevocable
Commitments. Organizational Behavior and Human Decision Processes, 90,
277–290.
Goren, H., Rapoport, A.., and Kurzban, R. (2004). Commitment in a Real Time Step
Level Public Goods Game with Asymmetrical Players and Continuous
Contributions. The Journal of Behavioral Decision Making, 17, 17–37.
Hirschman, A. O. (1958). The Strategy of Economic Development, New Haven, CT:
Yale University Press.
Ichniowski, C., Shaw, K.,and Prennushi, G. (1997). The Effects of Human Resource
Management Practices on Productivity. American Economic Review, 87, 291-
313.
Knez, M. and Simester, D. (2001). Firm-Wide Incentives and Mututal Monitoring at
Continetal Airlines. Journal of Labor Economics, 19, 743-772.
Kremer, M. (1993). The O-ring Theory of Economic Development, Quarterly Journal
of Economics, 108(3), 551–75.
Kurzban, R., McCabe, K., Smith, V., and Wilson, B. J. (2001). Incremental
Commitment and Reciprocity in a Real-Time Public Goods Game. Personality
and Social Psychology Bulletin, 27, 1662-1673.
Kurzban, R., Rigdon, M., and Wilson, B.J. (2008). Incremental Approaches in
Establishing Trust, Experimental Economics, 11, 370-389.
Milgrom, P. and Roberts, J. (1992). Economics, Organizations and Management.
Prentice Hall.
Murphy, K., Shleifer, A. and Vishny, R. (1989). Industrialization and the Big Push,

18
Journal of Political Economy, 97,1003–26.
Myrdal G. (1957). Economic Theory and Underdeveloped Regions London
Duckworth
Rosenstein-Rodan, Paul (1943). Problems of Industrialization of Eastern and South-
eastern Europe, Economic Journal, 53, 202-211.
Schmidt, D., Shupp, R., Walker, J., and Ostrom, E. (2003). Playing Safe in
Coordination Games: the Role of Risk Dominance, Payoff Dominance, Social
History, and Reputation. Games and Economic Behavior, 42, 281-299.
Van Huyck, J. B., Battalio, R. C., and Beil, R. O. (1990). Tacit Coordination Games,
Strategic Uncertainty, and Coordination Failure. The American Economic
Review, 80, 234–248.
Van Huyck, J., Gillette, A., and Battalio, R. (1992). Credible Assignments in
Coordination Games. Games and Economic Behavior, 4, 606-626.

19
Table 1 - Payoff Table for the Minimum-Effort Game
Minimum Effort Chosen by Any Group Member 7 6 5 4 3 2 1
Effort Chosen by Individual
7 $1.65 $1.40 $1.15 $0.90 $0.65 $0.40 $0.15 6 - $1.50 $1.25 $1.00 $0.75 $0.50 $0.25 5 - - $1.35 $1.10 $0.85 $0.60 $0.35 4 - - - $1.20 $0.95 $0.70 $0.45 3 - - - - $1.05 $0.80 $0.55 2 - - - - - $0.90 $0.65 1 - - - - - - $0.75
Table 2 - Experimental Design
Treatment Name
Real-Time Monitoring
Ex-Post Monitoring
Number of Groups
Subjects per Group
Community Perfect Perfect 10 6
Neighbors Imperfect Perfect 10 6
Baseline None Perfect 10 6 Real-time monitoring means that subjects can observe the concurrent choices of others; Ex-post monitoring means that subjects can observe the actions of others at the end of a period; Perfect monitoring means that subjects can observe the actions of all other group members; Imperfect monitoring means that subjects can observe the actions of their immediate neighbors in a circle network.
20
Figure 1 - Screen shot of decision stage (Neighbors treatment)
Figure 2 - Comparison of Effort in Each Treatment Across Periods
Panel A - Minimum Effort Panel B - Total Effort
6
12
18
24
30
36
42
1 2 3 4 5 6 7 8 9 10
Period
1
2
3
4
5
6
7
1 2 3 4 5 6 7 8 9 10
Period
Community
Neighbors
Baseline

21
1 2 3 4 5 6 7 8 9 10
Group10Group 9Group 8Group 7Group 6Group 5Group 4Group3Group 2Group 1
Period
1 2 3 4 5 6 7 8 9 10
Group10Group 9Group 8Group 7Group 6Group 5Group 4Group 3Group 2Group 1
Period
1 2 3 4 5 6 7 8 9 10
Group10Group 9Group 8Group 7Group 6Group 5Group 4Group 3Group 2Group 1
Period
Figure 3 - Minimum Effort by Group
Panel A – Baseline Panel B – Neighbors Panel C – Community
Each row indicates the behavior of a group. The height of each row indicates the minimum effort of the group at the end of the period. Minimum effort ranges from low (1) to high (7). For example, the minimum effort at the end of the first period in Group 1 in the Baseline treatment is 1; thereafter, it increased steadily until it reached the highest possible value in period 4 never to decrease until the end of the experiment.

22
Figure 4 - Real-Time Effort by Subject for Group 2 in Neighbors Treatment
Each row indicates the behavior of a single individual (A-F). The height of each row indicates the level of effort from low (1) to high (7). Vertical lines indicate the start of a period. For example, Subject A chose an effort of 6 in period 1 and started period 2 by choosing a level of 7 for about 20 seconds. Subject C choose an effort of 1 in period 1. Each individual could see the behavior of the person ‘above’ him and ‘below’ him. The subject at the bottom of the figure could see the person on the top of the figure and vice versa.
Subject
Period 1 2 3 4 5 6 7 8 9 10
F
E
D
C
B
A
1 2 3 4 5 6 7 8 9 101 2 3 4 5 6 7 8 9 10time
effort

23
Figure 5 - The Evolution of Average Effort Within Periods Across Treatments Panel A: Periods 1-5
Panel B: Periods 6-10
The vertical dashed line indicates the start of the last 10 second within a period. Community* presents the average effort per second for all groups in the Community treatment except groups 9 and 10. These groups were outliers (see, e.g., Wasted Profit in periods 6-10 in Table A1) and the evidence suggests that this was due to two subjects (one in each group) that did not understand the incentives. All groups are used for the statistical analysis in the paper.
1
2
3
4
5
6
7
1 2 3 4 5 6 7 8 9 10 11 12 13 14 15 16 17 18 19 20 21 22 23 24 25 26 27 28 29 30 31 32 33 34 35 36 37 38 39 40 41 42 43 44 45 46 47 48 49 50 51 52 53 54 55 56 57 58 59 60
Average effort
Second
Community*CommunityNeighborsBaseline
1
2
3
4
5
6
7
1 2 3 4 5 6 7 8 9 10 11 12 13 14 15 16 17 18 19 20 21 22 23 24 25 26 27 28 29 30 31 32 33 34 35 36 37 38 39 40 41 42 43 44 45 46 47 48 49 50 51 52 53 54 55 56 57 58 59 60
Average effprt
Second
Community*CommunityNeighborsBaseline

24
Appendix
Table A1 - Group Averages
Minimum Effort Total Effort Wasted Effort Average ProfitTreatment Group Periods Periods Periods Periods
1-5 6-10 1-5 6-10 1-5 6-10 1-5 6-10 Baseline 1 3.8 6.4 28.4 39.8 5.6 1.4 1.1 1.5 Baseline 2 1.0 1.0 12.2 12.0 6.2 6.0 0.6 0.7 Baseline 3 4.2 6.0 37.2 40.2 12.0 4.2 1.0 1.4 Baseline 4 2.2 1.2 24.4 18.4 11.2 11.2 0.7 0.6 Baseline 5 4.0 6.2 32.0 41.0 8.0 3.8 1.1 1.5 Baseline 6 1.0 1.0 15.6 6.6 9.6 0.6 0.6 0.7 Baseline 7 3.0 2.8 32.8 22.8 14.8 6.0 0.8 0.9 Baseline 8 1.2 1.0 21.4 16.0 14.2 10.0 0.5 0.6 Baseline 9 1.0 1.0 13.2 15.2 7.2 9.2 0.6 0.6 Baseline 10 1.6 6.4 27.8 40.0 18.2 1.6 0.5 1.5
mean 2.3 3.3 24.5 25.2 10.7 5.4 0.8 1.0 Neighbors 1 5.0 7.0 35.0 42.0 5.0 0.0 1.3 1.7 Neighbors 2 1.2 1.2 16.4 15.8 9.2 8.6 0.6 0.6 Neighbors 3 1.0 1.0 9.8 6.6 3.8 0.6 0.7 0.7 Neighbors 4 1.0 3.8 15.6 33.2 9.6 10.4 0.6 1.0 Neighbors 5 3.2 7.0 23.2 42.0 4.0 0.0 1.0 1.7 Neighbors 6 3.8 4.2 29.6 32.0 6.8 6.8 1.1 1.1 Neighbors 7 1.0 1.0 10.2 7.0 4.2 1.0 0.7 0.7 Neighbors 8 3.0 5.8 23.6 34.8 5.6 0.0 1.0 1.5 Neighbors 9 3.0 2.2 25.6 18.4 7.6 5.2 0.9 0.8 Neighbors 10 2.2 6.4 19.4 39.0 6.2 0.6 0.8 1.6
mean 2.4 4.0 20.8 27.1 6.2 3.3 0.9 1.1 Community 1 3.4 7.0 20.4 42.0 0.0 0.0 1.1 1.7 Community 2 6.8 6.8 41.8 41.2 1.0 0.4 1.6 1.6 Community 3 1.6 6.4 18.2 38.4 8.6 0.0 0.7 1.6 Community 4 6.4 7.0 39.2 42.0 0.8 0.0 1.5 1.7 Community 5 3.4 7.0 26.6 42.0 6.2 0.0 1.0 1.7 Community 6 3.6 7.0 25.6 42.0 4.0 0.0 1.1 1.7 Community 7 1.0 6.4 10.6 38.4 4.6 0.0 0.7 1.6 Community 8 5.6 7.0 33.8 42.0 0.2 0.0 1.4 1.7 Community 9 1.0 1.0 13.2 13.2 7.2 7.2 0.6 0.6 Community 10 1.2 1.6 16.6 16.2 9.4 6.6 0.6 0.7
mean 3.4 5.7 24.6 35.7 4.2 1.4 1.0 1.4

Economic Science Institute Working Papers
2010
10-13 Deck, C. and Gu, J. Price Increasing Competition? Experimental Evidence.
10-12 Kovenock, D., Roberson, B.,and Sheremeta, R. The Attack and Defense of Weakest-Link Networks.
10-11 Wilson, B., Jaworski, T., Schurter, K. and Smyth, A. An Experimental Economic History of Whalers’ Rules of Capture.
10-10 DeScioli, P. and Wilson, B. Mine and Thine: The Territorial Foundations of Human Property.
10-09 Cason, T., Masters, W. and Sheremeta, R. Entry into Winner-Take-All and Proportional-Prize Contests: An Experimental Study.
10-08 Savikhin, A. and Sheremeta, R. Simultaneous Decision-Making in Competitive and Cooperative Environments.
10-07 Chowdhury, S. and Sheremeta, R. A generalized Tullock contest. 10-06 Chowdhury, S. and Sheremeta, R. The Equivalence of Contests. 10-05 Shields, T. Do Analysts Tell the Truth? Do Shareholders Listen? An Experimental Study of Analysts' Forecasts and Shareholder Reaction. 10-04 Lin, S. and Rassenti, S. Are Under- and Over-reaction the Same Matter? A Price Inertia based Account. 10-03 Lin, S. Gradual Information Diffusion and Asset Price Momentum. 10-02 Gjerstad, S. and Smith, V. Household expenditure cycles and economic cycles, 1920 – 2010. 10-01 Dickhaut, J., Lin, S., Porter, D. and Smith, V. Durability, Re-trading and Market Performance.
2009
09-11 Hazlett, T., Porter, D., Smith, V. Radio Spectrum and the Disruptive Clarity OF Ronald Coase. 09-10 Sheremeta, R. Expenditures and Information Disclosure in Two-Stage Political Contests. 09-09 Sheremeta, R. and Zhang, J. Can Groups Solve the Problem of Over-Bidding in Contests? 09-08 Sheremeta, R. and Zhang, J. Multi-Level Trust Game with "Insider" Communication. 09-07 Price, C. and Sheremeta, R. Endowment Effects in Contests. 09-06 Cason, T., Savikhin, A. and Sheremeta, R. Cooperation Spillovers in Coordination Games.

09-05 Sheremeta, R. Contest Design: An Experimental Investigation. 09-04 Sheremeta, R. Experimental Comparison of Multi-Stage and One-Stage Contests. 09-03 Smith, A., Skarbek, D., and Wilson, B. Anarchy, Groups, and Conflict: An Experiment on the Emergence of Protective Associations.
09-02 Jaworski, T. and Wilson, B. Go West Young Man: Self-selection and Endogenous Property Rights.
09-01 Gjerstad, S. Housing Market Price Tier Movements in an Expansion and Collapse.
2008
08-10 Dickhaut, J., Houser, D., Aimone, J., Tila, D. and Johnson, C. High Stakes Behavior with Low Payoffs: Inducing Preferences with Holt-Laury Gambles.
08-09 Stecher, J., Shields, T. and Dickhaut, J. Generating Ambiguity in the Laboratory.
08-08 Stecher, J., Lunawat, R., Pronin, K. and Dickhaut, J. Decision Making and Trade without Probabilities.
08-07 Dickhaut, J., Lungu, O., Smith, V., Xin, B. and Rustichini, A. A Neuronal Mechanism of Choice.
08-06 Anctil, R., Dickhaut, J., Johnson, K., and Kanodia, C. Does Information Transparency Decrease Coordination Failure?
08-05 Tila, D. and Porter, D. Group Prediction in Information Markets With and Without Trading Information and Price Manipulation Incentives.
08-04 Caginalp, G., Hao, L., Porter, D. and Smith, V. Asset Market Reactions to News: An Experimental Study.
08-03 Thomas, C. and Wilson, B. Horizontal Product Differentiation in Auctions and Multilateral Negotiations.
08-02 Oprea, R., Wilson, B. and Zillante, A. War of Attrition: Evidence from a Laboratory Experiment on Market Exit.
08-01 Oprea, R., Porter, D., Hibbert, C., Hanson, R. and Tila, D. Can Manipulators Mislead Prediction Market Observers?