Perceptor: A Model for Product Positioning Glen L. Urban ...ebusiness.mit.edu/urban/papers/perceptor...
16
Perceptor: A Model for Product Positioning Glen L. Urban Management Science, Vol. 21, No. 8, Application Series. (Apr., 1975), pp. 858-871. Stable URL: http://links.jstor.org/sici?sici=0025-1909%28197504%2921%3A8%3C858%3APAMFPP%3E2.0.CO%3B2-V Management Science is currently published by INFORMS. Your use of the JSTOR archive indicates your acceptance of JSTOR's Terms and Conditions of Use, available at http://www.jstor.org/about/terms.html. JSTOR's Terms and Conditions of Use provides, in part, that unless you have obtained prior permission, you may not download an entire issue of a journal or multiple copies of articles, and you may use content in the JSTOR archive only for your personal, non-commercial use. Please contact the publisher regarding any further use of this work. Publisher contact information may be obtained at http://www.jstor.org/journals/informs.html. Each copy of any part of a JSTOR transmission must contain the same copyright notice that appears on the screen or printed page of such transmission. The JSTOR Archive is a trusted digital repository providing for long-term preservation and access to leading academic journals and scholarly literature from around the world. The Archive is supported by libraries, scholarly societies, publishers, and foundations. It is an initiative of JSTOR, a not-for-profit organization with a mission to help the scholarly community take advantage of advances in technology. For more information regarding JSTOR, please contact [email protected]. http://www.jstor.org Sun Oct 21 16:26:13 2007
Transcript of Perceptor: A Model for Product Positioning Glen L. Urban ...ebusiness.mit.edu/urban/papers/perceptor...

Perceptor: A Model for Product Positioning
Glen L. Urban
Management Science, Vol. 21, No. 8, Application Series. (Apr., 1975), pp. 858-871.
Stable URL:
http://links.jstor.org/sici?sici=0025-1909%28197504%2921%3A8%3C858%3APAMFPP%3E2.0.CO%3B2-V
Management Science is currently published by INFORMS.
Your use of the JSTOR archive indicates your acceptance of JSTOR's Terms and Conditions of Use, available athttp://www.jstor.org/about/terms.html. JSTOR's Terms and Conditions of Use provides, in part, that unless you have obtainedprior permission, you may not download an entire issue of a journal or multiple copies of articles, and you may use content inthe JSTOR archive only for your personal, non-commercial use.
Please contact the publisher regarding any further use of this work. Publisher contact information may be obtained athttp://www.jstor.org/journals/informs.html.
Each copy of any part of a JSTOR transmission must contain the same copyright notice that appears on the screen or printedpage of such transmission.
The JSTOR Archive is a trusted digital repository providing for long-term preservation and access to leading academicjournals and scholarly literature from around the world. The Archive is supported by libraries, scholarly societies, publishers,and foundations. It is an initiative of JSTOR, a not-for-profit organization with a mission to help the scholarly community takeadvantage of advances in technology. For more information regarding JSTOR, please contact [email protected].
http://www.jstor.orgSun Oct 21 16:26:13 2007

M A N A G E M E N T SCIENCE Vol. 21, No. 8 , April, 1976
Printed in U.S.A.
PERCEPTOR: A MODEL FOR PRODUCT POSITIONING*t
GLEN L. URBAN
Massachusetts Institute of Technology
A model and measurement methodology is proposed to aid managers in designing new frequently purchased consumer products. The model is structured as a trial and repeat process that produces an estimate of long-run share for a new brand. Physical and psychological product attributes are linked to the trial and repeat probabilities through multidimensional ssaling procedures. Perceptual maps of existing brands with ideal brand positionings are derived. The product design determines the new brand's position in the perceptual space, and the distance from the new brand to the ideal brand specifies its probability of purchase.
Measurement and estimation procedures are discussed. Predictive and structural tests of the model are reported, and a process for managerial implementation is presented. The outputs of the model are an understanding of the perception, preference, and purchase process, a framework and procedure for measurement, a structure to use in interpreting experimental results, and a tool for estimating the marketing share for alternate new brand designs.
Introduction
Developing new frequently purchased consumer products may be viewed as a process of: (1) creating and designing new product concepts, (2) screening new brands, (3) test marketing, and (4) national introduction. htany models have been built and used in the screening and testing stage, but few exist which aid in design. Yet this is the important point at which the product comes into existence as a physical and psychological entity.
In a typical firm, the design process usually is initiated by an idea originating from introspection on the market or consumers, R & D, product or packaging technology, or competitor's new products. Other triggers to innovation occur when a product class is identified that looks attractive because it is growing rapidly, has not been subjected to innovation-a "sleepy" category, or because a competitor has achieved success in the product class. After initiation of the design process, rough concept descrip- tions are presented to consumers for their reaction. Usually likability, interest, uniqueness, intent to try, and responses to open-ended verbal questions are obtained. At this time the strengths, weak- nesses, and levels of satisfaction more specifically identify openings for new products and potentially differentiating features. Typically, consumer group discussions sessions are conducted to understand some of the behavioral aspects surrounding the product's consumption and consumers' reactions to concepts. From this information a best concept and physical product emerges. This product is usually given to consumers to determine how the product compares to existing brands after in-home usage. The output of this sequential process is a physical new product and what is termed as a designation of the "product positioning". The concept then undergoes formal screening and test marketing before introduction.
The brand creation and design process is a rather unstructured problem, and existing procedures seem to provide ample opportunity for improvement. This paper outlines an attempt to bring addi- tional structure and quantitative analysis to bear on the creation and design process by the use of a mathematical model and measurement methodology. This work utilizes recent developments in scaling of psychological data in a model structured as a trial and repeat purchase process. Product positioning is linked to the process parameters through multidimensional scaling procedures. The
*Processed by Professor Donald G. Morrison, Departmental Editor for Marketing; received December 1973, revised June 1974. This paper was with the author 2 months for revision.
t Important Research assistance was provided by: Gautam Advani, Yvan Allaire, Gerry Katz, Walt Lankau, Pierre Latour, and Luis Mantilla. Valuable advice on model structure, data collection, and analysis was supplied by Jacques Blanchard. Essential editorial support was provided by John Little and A1 Silk.
858
Copyright @ 1976, T h e Institute o f Management Sciencee

PERCEPTOR: FOR PRODUCT POSITIONINGA MODEL 859
outputs of the model are an estimate of the market share for alternate new brand positions and an understanding of the perception, preference, and purchase process underlying the product positioning decision. The goal of the model is to provide a framework for measurement and a tool to aid managers in the design, evaluation and refinement of new frequently purchased consumer products.
Model Structure Overall Flow
The model is structured around the generation of an estimated long-run market share for the new product. This structure is chosen because long-run share provides a good basis for evaluating the potential of a concept, a method of selecting between alternate concepts, and a criterion for use in refining concepts. Formally, the long-run market share of the new brand is defined as the product of the ultimate trial fraction and the equilibrium share of purchases of the new brand among those who have ever used the brand.
(1) m = ts, m = long-run market share,
t = fraction of the target group who ever try the new brand, 0 2 t 5 1.0,
s = share of purchases of new brand among those who have ever tried the brand, 0 5 s 5 1.0.
This is similar to the equation proposed by Parfitt and Collins to predict new product performance based on test market consumer panel data.' They reported a high level of accuracy in predictive tests of 25 brands. At the concept stage of development con- sumer purchase panel data are not feasible to collect, but surrogate measures for trial can be measured in a group which has been made aware of the concept and repeat probabilities can be obtained after the product has been used by a sample of con-sumers. These concept and usage test measures are used to derive the long-run trial (t) and market share of those who have tried (s). The ultimate trial is defined as:
(2) t = qwv,
q = ultimate probability of trial given awareness and availability,
w = long-run aided awareness of new brand,
v = long-run percent of all commodity availability of new brand (i.e. percent of stores carrying brand weighted by sales volume of store).
The propensity to try given awareness and availability (q) is measured by the ob- served trial fraction in a group made aware of the new concept.
The market share of those who have used the brand is modeled as the equilibrium of a two-state Markov process:
(3) 8 = p21/(1 + p21 - p11)
where for those who have tried the new brand:
Pij= Probability of purchase of brand j at next purchase opportunity when brand i was purchased last, 0 5 Pij5 1.0,
i or j = 1 refers to new brand, i or j = 2 refers to all other brands.
J. H. Parfitt and B. J. K. Collins, "The Use of Consumer Panels for Brand-Share Prediction," Journal of Marketing Research (May 1968), pp. 131-146.

860 GLEN L. URBAN
This Markov formulation assumes that the frequency of purchase of the new brand is the same as existing brands. This assumption can be relaxed somewhat by multi- plying the share (s) by an index to reflect relative usage rates of brands. If heter-ogeneity exists across consumers rather than brands, consumers could be grouped into classes on the basis of their usage rates (heavy, medium, and light) and separate transition matrices estimated for each group. In this situation the overall share would be the average of each class weighted by class size and usage rate. Equation (3) also assumes the consumer will find the product a t the next purchase opportunity. This is reasonable, since the consumer has already purchased the product once when it was by definition available. Although the Markov model assumptions may be a bit restrictive, a more elaborate diffusion model with additional states to represent detailed purchase histories and levels of usage is not proposed, since it is difficult realistically to measure higher order repeat rates and frequency of purchase at the concept stage of product development. In cases where they could be measured, a simple version of SPRINTER could be used to estimate long-run share.2
Next the linkages of product positioning to the trial and repeat probabilities are defined by considering joint space (perception and preference) maps and their relation- ship to probability of trial and repeat.
Trial Model
Perception and Preference. First, notation to describe joint space perceptual maps is defined. Let
xb, = coordinates of brand b on dimension y for the perceptual map of those who have not tried our brand, but who are aware of the concept (b = 1, 2, . . . B, where B = new brand;^ = 1 , 2 , . . .Y) .
I, = coordinates of average ideal point of dimension y for map of those who have not tried our brand but are aware of the concept.
The coordinates of each brand could be derived by either nonmetric scaling of simi- larity data or factor or discriminant analysis of brand rating data. For maps developed by factor analysis, the following relationship will result:
fua = factor score coefficient for dimension y and attribute scale a (a = 1,2, . . . A ) ,
rba = standardized average rating of brand b on scale a.
This is a useful relationship, since a new brand position can be specified by changing the original scale ratings for a brand rather than by specifying the position on the aggregated dimensions directly. Ideal point coordinates (I)can be obtained via Carroll and Chang's PREFMAP or from the factor analysis of ratings of an "ideal" brand on product rating scale^.^
Glen L. Urban, "Sprinter Mod 111: A Model for the Analysis of New Frequently Purchased Consumer Products, "Operations Research, Vol. 18 (September-October 1970), pp. 805-853.
J. D. Carroll, "Individual Differences and Multidimensional Scaling," in R. N. Shepard, A. K. Romney, and S. Nerlove (eds.), Multidimensional Scaling: Theory and Application in the Behavioral Sciences. (New York, Academic Press, 1972), pp. 105-175. Recently an alternate procedure called LINMAP has been proposed by Srinivasan and Shocker: V. Srinivasan and Allan Shocker, "Linear Programming Techniques for Multidimensional Analysis of Preferences," Psychometrika, Vol. 38 (September 1973), pp. 337-370.

861 PERCEPTOR: A MODEL FOR PRODUCT POSITIONING
Heterogeneity of perception and preference can be considered in the model by sub- dividing the total group into homogeneous subgroups and treating each separately. Several methods of defining homogeneous groups will be described in the estimation section of this paper. Each subgroup can be indexed by a subscript. Heterogeneity of perception can be considered by assigning a subscript to x and I to represent percep- tually homogeneous groups. Similarly, a subscript could be added to the ideal points (I) to reflect the average ideal points of clusters of people with homogeneous preference structures and a final subscript could be added to the ideal points to refer to different types of product usage. Ideal points may vary for the same products depending on the use. For example, preferences may be different for wine served when guests are present versus wine served when no guests are present, even though the perceptions of brands may be similar in both situations.
Probability of Purchase. The probability of trial is postulated to be a function of the squared distance between the ideal point and the new brand. This implies that as a brand is positioned closer to the ideal point, its probability of choice increases non- linearly. The squared distance function is the simplest of many nonlinear functions and is appropriate over the range of existing data:
q = probability of trial of new brand given awareness and availability. q is constrained to the range 0 5 q 6 1.0,
cro ,a1 = coefficients to be determined empirically,
d B 2 = squared distance from ideal point to the new brand on map for those who are aware but have not yet used our brand.
In the general case, the "distances" on the map for those people who are aware of the new concept but have not yet tried our product are defined as:
(6) = h,(x& -xf=l x;, = rotated coordinates of brand b on dimension x (z = 1,2 , . . . 2),where:
(651) x;, Cr=l= xbyTuz, T,, = cosine rotational transform of dimension y to x (obtained from
PREFMAP) , xb, = coordinates of brand b on dimension y on map for people aware of new
concept.
I ' , = rotated coordinates of ideal point on dimension x where:
(6b) I f , = IyTyr
I , = coordinates of ideal point on ,dimension y on map for people aware of new concept.
h, = importance weights for dimension z (obtained from PREFMAP, note h , may be negative).
Equation (6) is the distance equation of PREFMAP phase I. In PREFMAP phase 11, no idiosyncratic rotation is done and in phase I11 axes are equally weighted, so in this case the distance equation is simplified to the Euclidean form.

862 GLEN L. URBAN
The output of the trial model is the ultimate trial probability given awareness and availability. When multiplied by the estimated long-run awareness and availability, it provides the estimated long-run fraction of the target group who will try (see (2)).
Probability of Repeat. The probability of a repeat purchase after usage of the new brand is determined analogously to the trial probability by the position of the new brand relative to the ideal point on a perceptual map, but the coordinates and ideal points are derived from data obtained from people who have used the new brand. The repeat purchase probability is
(7) Pll = Go + ~1Jx2,
pll = probability of repeat purchase if new brand was purchased last. p11 is constrained to the range 0 5 p11 5 1.0,
&O ,61 = coefficients empirically determined,
Jx2= distance squared from ideal point to new brand after use (for definition see (6) with coordinates of brand on perceptual map of those who have used the brand).
The probability of repeat purchase if the new product is not chosen (~21) is empirically determined.
Sources of New Brand Share
After substituting the trial and repeat probabilities in (2) and (3)) an estimate of the share of the new brand is obtained by (1). Managers would like to know which brands are yielding share to the new brand. I t is assumed that share will come from the brands that are perceptually most similar to the new brand (i.e. nearest to it on the map) and from the brands that are most widely evoked. A brand is defined as evoked by a consumer if it has been used, if it would be considered a t the next purchase, or if it is rejected as a purchase alternative. These brands are called the evoked set. The new product share is obtained from brands proportional to their appearance in consumer evoked sets and inversely proportional to their distance from the new brand.
(8) kb = m ( (eblD2,x)/ CZ: (eblD2,B)1, kb = loss in market share of existing brand b,
m = market share of new brand,
eb = fraction of people who have brand b in their evoked set,
D2,, = distance squared from brand b to new brand B in users map.
This completes the model description. The next sections will describe the measurement methodology and estimation procedures.
Measurement
The first measurement task is to conduct an exploratory survey. The size and com- position of consumers' evoked sets must be determined. Table 1gives the average size of t'he evoked set', total number of brands evoked, and the number of brands necessary to account for 80yo of the sales in six product classes. These are survey results based on interviewing approximately 100 people in each product class. In the first case the

863 PERCEPTOR: A MODEL FOR PRODUCT POSITIONING
TABLE 1
Evoked Set Size and Composition
Number of Brands
Median Evoked Total Number Necessary to
-4ccount for 80% Product Set Size of Brands Evoked of Market
-- -
Canadian Beer 7 Aerosal Deodorant 3 Skin Care Product 5 Over the Counter Medicinal Product 3 Pain Relief Product 3 Antacid 3 Shampoo 4
evoked set is of reasonable size and the composition is similar when examining the major share of the market (80%). Therefore a standard questionnaire was developed using anchor point similarity judgments, paired comparison preference evaluations, and brand ratings on a set of scales for eight specified brands. In the other five cases shown in Table 1, the evoked set sizes are small and the composition varies. In these cases paired comparison similarity and preference judgments and brand ratings were collected only for the evoked brands. The evoked set size and composition are impor- tant considerations in determining the method of measurement.
Next, consumer semantics are identified through personal interviews in which con- sumers are asked to contrast the two most similar and two most different brands in each triad of evoked brands or the analysis of group session transcripts. The final step in the exploratory procedure is to pretest the similarity measurement method and obtain bipolar brand rankings on the scales generated by the semantic procedures.
Next, a base survey of target group members is conducted to obtain their: (1) evoked set, (2) similarity judgments, (3) ratings of existing brands on the semantic scales, (4) preference evaluations, and ( 5 ) their brand choice. The brand choice is obtained by giving the respondent a sum of money (say two dollars) and asking him to select the brand he would like to buy.
A concept awareness survey is conducted on a group of people who are made aware of an initial new concept by a picture of the product and a concept statement or a rough ad copy execution. The data specified in the base survey are collected for this group for the new and existing brands.
If the brand idea looks reasonable after the concept survey, a group of people is given the physical product to use for a period of time and the items of the base survey are measured again. For those who do not choose the new product after usage, a five- point intent to repeat scale is utilized to provide an estimate of their probability of purchase ( ~ 2 ~ ) .
Estimation procedures to convert the survey data into estimates of perceptual map coordinates (x), ideal points (I),and probability of purchase parameters (a0, cull
&o, GI)will be described in this section.
4 See the long form of this paper for a detailed empirical example of these procedures. The un-abridged version is available from the TIhlS Business Office, 146 West~ninster St. Providence, RI 02903, at the cost of reproduction.

864 GLEN L. URBAN
TABLE 2 Overall Factor Analysis Dimensions
1 2 3
Cumulative Variance 0.34 0.54 0.57 Eigen values 5.80 3.40 0.534
Before perceptual analysis is begun to determine the stimulus configuration (x), it is necessary to consider heterogeneity of perception by (1) clustering individuals based on their weights from an INDSCAL analysis of nonmetric data, (2) clustering factor scores derived from rating data, or (3) by a Q-type factor analysis.6 If a small number of homogeneous groups explains a large proportion of the variance, each group is treated separately and denoted by a subscript index value.
Perceptual maps within each group can be obtained by nonmetric scaling of simi- larity judgments or factor analysis of brand ratings. Many adequate nonmetric scaling programs exist. However, these programs require a reasonably large stimulus set (eight or more is desired). Factor analysis of a two-way matrix of the brand ratings of individuals by semantic scales is an especially useful way to generate underlying dimensionality (factor loadings) and stimulus co-ordinates (average factor scores) in cases where evoked set sizes are small and composition varies. In the matrix, each row represents ratings for a particular individual and for a particular brand. Only brands evoked by each respondent are included. Since the matrix will be of reasonable size even when evoked sets are small (the number of rows is the number of respondents times the average number of brands evoked and the number of columns is the number of scales), good maps can be obtained if it is assumed that the underlying dimen- sionality is not a function of the specific brands evoked.
This procedure was used in a study of Canadian beers in which students were asked to rate eight beers on seventeen scale^.^ Table 2 shows the cumulative total explained variance and the associated eigen values obtained from a common factor analysis of the ratings. These values indicated that two dimensions were sufficient to represent the data and the explained variance levels were adequate for common factor analysis (0.54 of the overall variance was 0.89 of the common variance).
Examination of the varimax rotated factor loadings indicated dimension one had social connotations of popular, young, modern, and swinging and that dimension two was taste oriented and associated with strong, sharp, and heavy taste. Brands were represented on the map by their average factor scores. The brands were perceived as very different in the taste/social space. For example, "Dow" was strong and old fashioned, "Labatt" had an intermediate taste and was modern and young, while I I Molson" was average in sociability and very strong in taste.
In this study, perceptions were relatively homogeneous. The factor scores of each individual and each brand were clustered with the Howard-Harris program and five clusters accounted for only 30% of the total variation. This did not provide evidence
See J. D. Carroll and J. J. Chang, "Analysis of Individual Difference in Multidimensional Scaling Via an N-Way Generalization of 'Eckart-Young' Decomposition," Psychomet~ika,Vol. 35 (September 1970), pp. 283-319 and L. R. Tucker and S. Messick, "An Individual Differences Model for Multi- dimensional Scaling," Psychometrika, Vol. 28 (1963), pp. 333-367.
The data were collected by Ivan Allaire at the University of Ottawa. See the long form of this paper for description of data collection procedures.

865 PERCEPTOR: A MODEL FOR PRODUCT POSITIONING
TABLE 3 T O R S C A Goodness of Fit for Similarity Data
Approximate probabilityof occurring from
random data Stress (i.e. significance)
Direct Similarity 3 dimensions 0.049 2 dimensions 0.123 1dimension 0.339
Derived Similarity 3 dimensions 0.007 2 dimensions 0.060 1dimension 0.320
that respondents could be divided usefully into a small number of groups with homoge- neous perception.
In addition to generating maps by factor analysis, nonmetric procedures should be utilized. The results should be compared to see if they agree in dimensionality and form. The nonmetric scaling could produce more dimensions if some scales were omitted in the rating procedure or if nonverbal perceptual dimensions existed. In this case, the similarity results would be accepted or new scales would be created to measure the new dimensions. After reconciling the dimensionality, the stimulus configurations should be compared by a correlation of interpoint distances after rotation for maximum congruence. If they are not similar, the best fitting solution would be appropriate.
In the beer case, anchor point similarity judgments were collected so maps could be generated by both the metric and nonmetric approaches. TORSCA-9 was used to process the average similarity data, and Table 3 gives Kruslial's "stress" measure of goodness of fit and the estimated probability that such a stress value or less could have been generated from random data.7 The significance of fits was not very good. None of the solutions was significant a t the 10% level, but the best level of significance was for two dimensions. To provide a basis of comparison, a similarity measure was derived from the factor ratings by summing, across all scales, the difference between the ratings for each pair of brands. TORSCA results based on the derived measures were much better. The stimulus configurations from the direct and derived similarity of measures were not similar. Even after rotation to achieve a best fit, only a correlation of 0.28 existed between the interpoint distances. In this case, brand ratings provided a better representation of perception than similarity judgments. In both similarity analyses, two dimensions were indicated as most statistically significant. This agreed with the factor analysis result and indicated that probably no major scales were omitted from the brand ratings.
Given an average perceptual map and individual preference judgments, PREFMAP can be used to derive an ideal point such that a function of the squared distance from this point to each brand best recovers the preference data. PREFMAP estimates an ideal point for each individual under: (1) idiosyncratic rotation and differential weightings (phase I ) , (2) no idiosyncratic rotation but with idiosyncratic differential
'David Khlar, "A Monte Carlo Investigation of the Statistical Significance of Krusdal's Non- Metric Scaling Procedure," Psychometrika, Vol. 34 (September 1969), pp. 319-330.

866 GLEN L. URBAN
TABLE 4 Overall PREFMAP Goodness of Fit
Correlation of Average of Individual Predicted and Correlations of
Observed Average Observed and Phase Preference Predicted Preference
( n = 8 brands) ( n = 45 individuals)
weighting (phase 11) or (3) no idiosyncratic rotation or differential weighting (phase 111). A fourth option is to estimate a vector of increasing preference rather than an ideal point.
In the beer study, constant sum preference data were collected. All four phases of PREFMAP implied that sociability was more important than taste in determining preference. The vector preference model indicated that sociability was five times more important than taste. An "ideal" brand would be perceived as young, modern, and swinging and have an only slightly strong taste. In all phases the average preference recovery was good, but the average individual recovery fell from explaining 76% of the variance in phase one to 43% in phase four.
Empirically in four other analyses, correlations of 0.8 to 0.98 have been found between the original preference data and squared distances. Since PREFMAP can derive the coordinates of ideal points a t the individual level, the individual ideal coordinates can be aggregated into homogeneous groups by clustering the individuals on the basis of the distances between the brands and the individual ideal points. An alternate procedure would be to cluster the original preference measures if the prefer- ence data were metric. Another method of obtaining an individual ideal brand is by having consumers rate their perception of an ideal brand. These ideal ratings will result in an idealized brand in the factor analysis generated maps. In the beer study, the average rated ideal point was consistent with the PREFMAP results.
Given the aggregate estimates of brand coordinates and ideal points for a market, the next task is to estimate the parameters of the function linking trial and repeat to the distances from the ideal point to a brand (a0 , rul , G O , & , see ( 5 ) and ( 7 ) ) .
In estimating the parameters, care must be taken to realize that the joint space maps reflect a market description assuming all brands are evoked. This is because in cases where the evoked set varies in composition (see Table 1) only perceptual and prefer- ence judgments are obtained from individuals for their evoked set. The joint space maps based on these data therefore represent the average market perception under full evoked conditions. The parameters linking distance to probability of choice are obtained by a regression of the percent of people who chose the brand at the end of the survey divided by the percent who evoked the brand versus the standardized distance from the ideal point to the brand. Dividing the percent who chose the brand by the percent who evoke the brand provides an estimate of propensity to choose the brand if all people evoked it. Distances are standardized across brands so that regressions can be made across different homogeneous perception or preference groups and degrees of freedom can be gained. Table 5 presents the fits in four new product cases. The fits are acceptable and all the coefficients are significant at the five percent level.

867 PERCEPTOR: POSITIONINGA MODEL FOR PRODUCT
TABLE 5 Distance Function Fits
Beer 0.87 12.5 -13.3 6.9 6 Skin Care Product 0.68 21.0 -16.9 6.25 11 Over the Counter Medicinal 0.94 36.3 -15.8 9.63 5 Pain Relief Product 0.84 28.7 -16.1 5.71 6
model Testing
Data for eight new product concepts were collected and used for prediction of trial and repeat rates. The ratings for each new concept on semantic scales were obtained from separate samples of people made aware of a concept. For concepts A to E the sample size was 30 and for concepts F, G, and H the sample size was 100 per concept. The concept ratings plus the factor score coefficients obtained from a factor analysis of ratings from a base survey of only the existing brands were used to specify the new concept positions on the base map (see (4) ) . The ideal point and distance function parameters obtained from analysis of the base survey were used to predict the new brand trial fractions. The observed trial was the fraction of people in each sample selecting the new concept after having been made aware. Table 6 presents the results. The average of absolute deviation is 0.07 and none of the differences are significantly different a t the 10 percent level except for concept H where the range of existing brand data was greatly exceeded. The coefficient of rank order correlation is 0.77.
A test of prediction of repeat rates was conducted for five personal care concepts based on ratings of the brands after use. These ratings were used to define the brand positions on the base map. Since the brands tested were radically new in physical properties, usage shifted the ideal point position. The prediction was made based on factor score coefficients and distance function parameters from the base survey, but
TABLE 6
Prediction of New Concept Trial and Repeat
Predicted Trial (q) Observed Trial
Concept A 0.26 0.27 Concept B 0.37 0.36 Concept C 0.30 0.35 Concept D 0.45 0.35 Concept E 0.26 0.31 Concept F 0.38 0.33 Concept G 0.39 0.43 Concept H 1.00 0.72
Predicted Repeat (PII) Observed Repeat
Concept A 0.41 Concept B 0.47 Concept C 0.45 Concept D 0.74 Concept E 0.65

- - ----
868 GLEN L. URBAN
TABLE 7 Reasonableness of Macro Structure
Long-Run Repeat Nonrepeat Predicted Actual New Product Trial (t) Probability (pii) Probability (pz~) Share (m) Share
Skin Care Product 0.12 0.75 0.20 5.3% 5.9% Toilet Soap 0.35 0.13 0.13 4.6% 5.0% Over Counter 0.32 0.6 0 .2 10.6% 10.0%
Medicinal New Hand Lotion 0.68 0.55 0.38 29.0% 27.0% Shampoo 0.22 0.46 0.12 S.O%* 7.0% Specialty Cake Mix 0.20 0 .5 0 .2 l . l % * 1.3%
* Adjusted for frequency of purchase of new product relative to existing brands.
with the new ideal point location. Table 6 presents the results. The average of the absolute deviations is 0.067 and none of the differences are significant at the 10 percent level. The ranli order correlation coefficient is 0.9.
The above tests support the perception, preference, and choice structures. Next, the overall trial/repeat model is considered. Parfitt and Collins' work was cited as support for the macro structure of the model. I t indicated that a good estimate of long-run share can be obtained by multiplying cumulative trial times the share for those who have used a new product. The model proposed here modified this structure by integrating a Markov model to estimate share for those who have tried. As a surrogate test of the reasonableness of this macro structure, several products that have been test marketed or introduced nationally were processed by (1) and (3) to obtain a pre- dicted share and compared to the actual test market shares in Table 7. The average deviation is 0.7 percentage share points and the macro structure appears to be adequate.
Table 8 shows the translation of initial intent given awareness and aided brand awareness into an estimate of cumulative trial (see (2)) for five new products where appropriate test market data were available. The agreement between estimated and observed cumulative trial values after adjustment for trial generated by sampling is reasonable when it is recognized that the observed values are survey generated and subject to sampling ~ a r i a n c e . ~
TABLE 8 Cumulatiue Trial Structure
Estimated Estimated Trial by Trial with Observed
Intent (q) Awareness (w)Distribution(u) Awareness ( t ) Sampling (t') Trial
Skin Care Product 0.12 0.45 0.8 4.3% 4.3% 4.2% Cereal 0.54 0.50 0.7 18.9% 18.9% 17.0% Shampoo 0.37 0.60 0.98 21.8% 21.8% 23.0% Cake Mix 0.28 0.65 0.80 14.5% 18.8% 18.0% Toilet Soap 0.33 0.75 0.95 23.5% 33.0% 35.0%
8 The trial by sampling ( t " ) was estimated by t" = n u , n = fraction of target group sampled and u = fraction who use sample.
Total trial was tt = t + t t l - tt", t' = total trial, t = trial generatedby awareness (2), t" = trial generated by sampling. This formulation assumes awareness and sampling to be independent. This is probably reasonable, since sampling is usually random in the target group.
869 PERCEPTOR:A RIODEL FOR PRODUCT POSITIONING
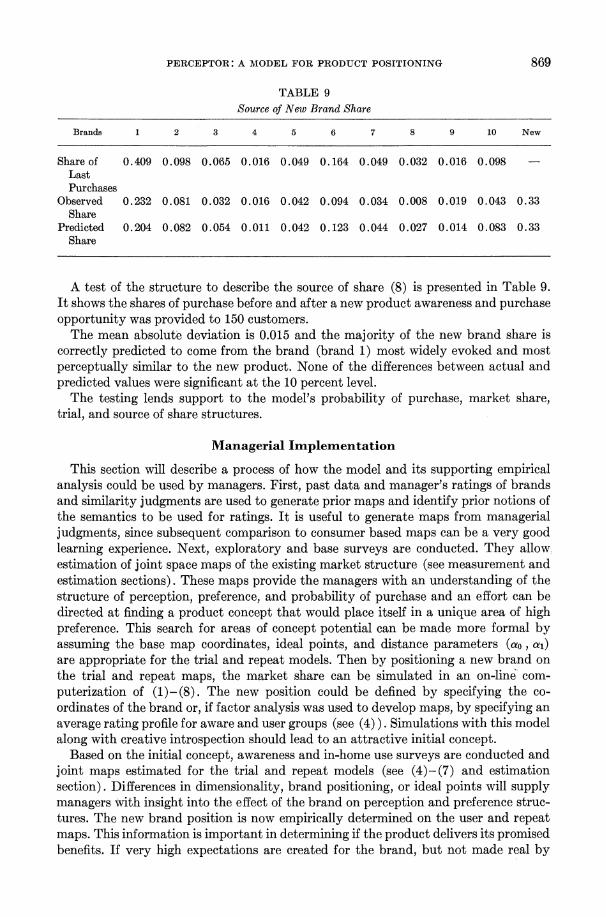
TABLE 9 Source of New Brand Share
Brands 1 2 3 4 5 6 7 8 9 10 New
Shareof 0.409 0.098 0.065 0.016 0.049 0.164 0.049 0.032 0.016 0.098 -Last Purchases
Observed 0.232 0.081 0.032 0.016 0.042 0.094 0.034 0.008 0.019 0.043 0.33 Share
Predicted 0.204 0.082 0.054 0.011 0.042 0.123 0.044 0.027 0.014 0.083 0.33 Share
A test of the structure to describe the source of share (8) is presented in Table 9. I t shows the shares of purchase before and after a new product awareness and purchase opportunity was provided to 150 customers.
The mean absolute deviation is 0.015 and the majority of the new brand share is correctly predicted to come from the brand (brand 1) most widely evoked and most perceptually similar to the new product. None of the differences between actual and predicted values were significant at the 10 percent level.
The testing lends support to the model's probability of purchase, market share, trial, and source of share structures.
Managerial Implementation
This section will describe a process of how the model and its supporting empirical analysis could be used by managers. First, past data and manager's ratings of brands and similarity judgments are used to generate prior maps and identify prior notions of the semantics to be used for ratings. I t is useful to generate maps from managerial judgments, since subsequent comparison to consumer based maps can be a very good learning experience. Next, exploratory and base surveys are conducted. They allow estimation of joint space maps of the existing market structure (see measurement and estimation sections). These maps provide the managers with an understanding of the structure of perception, preference, and probability of purchase and an effort can be directed at finding a product concept that would place itself in a unique area of high preference. This search for areas of concept potential can be made more formal by assuming the base map coordinates, ideal points, and distance parameters (a0, c u ~ ) are appropriate for the trial and repeat models. Then by positioning a new brand on the trial and repeat maps, the market share can be simulated in an on-line com- puterization of (1)-(8). The new position could be defined by specifying the co- ordinates of the brand or, if factor analysis was used to develop maps, by specifying an average rating profile for aware and user groups (see (4) ). Simulations with this model along with creative introspection should lead to an attractive initial concept.
Based on the initial concept, awareness and in-home use surveys are conducted and joint maps estimated for the trial and repeat models (see (4)-(7) and estimation section). Differences in dimensionality, brand positioning, or ideal points will supply managers with insight into the effect of the brand on perception and preference struc- tures. The new brand position is now empirically determined on the user and repeat maps. This information is important in determining if the product delivers its promised benefits. If very high expectations are created for the brand, but not made real by

870 GLEN L. URBAN
usage, the product may be rated lower than if achievable expectations were fostered by the concept ~ ta t emen t .~
With the empirically specified trial and repeat model, improved product positioning can be simulated by the PERCEPTOR computer model. For example, in a real case of a personal care product, the reference concept was perceived as good on performance and application dimensions based on awareness, but was perceived as only average on performance after use. In fact, after use, the product with the concept description was significantly less preferred than the product with no concept claims (i.e., "blind test"). The advertising claims of performance were not fulfilled by the product and this appeared to produce an adverse effect. This initial concept generated trial and repeat probabilities that implied a five percent market share. Two alternate positions were simulated. The first represented a strategy of aligning the product claims and per- formance and six percent share resulted. The second strategy was to improve the product physically so it would perform better and align the advertising to the actual performance. This strategy implied an 8 percent market share.1° These simulations led to design changes in the product advertising and additional R & D effort to improve the perceived product performance.
This brief description is an example of concept refinement procedures using PERCEPTOR. I t should be emphasized that the model is a complement and not a substitute for the creative ability of the manager. Although the model may indicate good positions, the man must create the physical product and advertising execution that will position the product at the desired location. For example, in a case of a medici- nal product where the model has been applied, an opportunity was found along a new dimension of safety. However, it took a creative breakthrough in product formulation by R & D and in advertising execution by the agency before a new concept could be found to fit the designated opportunity. Further testing of the concept with the model structure led to additional refinements and an effective product positioning of the brand in a three-dimensional space.
After the product position is determined, it would be appropriate to conduct test market or simulated market tests before introduction. Assuming the product has been successfully launched, PERCEPTOR could be used to consider repositioning or redesigning of the product after it has reached maturity.
Final Comments
Application in four new product situations has indieated the use of PERCEPTOR provides managers with a better understanding of the perception, preference and purchase structure of their markets, specifies measurement needs, serves as a structure to interpret experimental results, and aids managers in channeling their creative effort to develop successful new product designs.
From a technical point of view the model seems to represent adequately aggregate responses to new product concepts within consumer segments. Several aspects of the process can be cited as being important to the model's performance. First, measures are taken only for brands that consumers evoke as relevant to their choice decision. Second, since the evoked set seems to be small in many actual cases, the mapping
Rolph E. Anderson, "Consumer Dissatisfaction: The Effect of Disconfirmed Expectancy on Perceived Product Performance," Journal of Xurket ing Research, Vol. X (February 1973), pp. 38-44.
loMonte Carlo analysis of the model indicates that the standard deviation of the share prediction of the model for a typical new product is 0.025 for a sample of 100 and 0.016 for a sample of 300. See long form for details.

871 PERCEPTOR:A RIODEL FOR PRODUCT POSITIONING
procedures proposed in this paper are critical to deriving useful maps. Third, the model includes linkages to choice behavior which allow tests of internal validity. The base survey data can be used to predict choice in the concept waive (see Table 6). This internal validity check along with the convergent measurement and estimation pro- cedures is important in establishing empirical adequacy for the model.
A number of model evolutions are being considered for future work. First, the Markov model (3) could be extended to a full matrix of all the major brands in the market rather than just the two-state ((us" and "them" model. This full matrix model would allow product positioning of a new brand to affect the nonrepeat (pzl ) as well as repeat ( p l l ) probabilities. A second evolution will be towards building a full individual choice model where each individual is modeled through perception, preference, and choice process. Then these individual processes would be aggregated to the level of the model described in this paper. This could allow more accurate predictions without losing the managerial acceptance.
A final direction for future work is the application of the model structure to durable goods and other industries. This probably would entail a substantially different flow, but the underlying notion of linking perceptual maps to choice probabilities may be useful. Work is now underway in the design of health maintenance organizations.

You have printed the following article:
Perceptor: A Model for Product PositioningGlen L. UrbanManagement Science, Vol. 21, No. 8, Application Series. (Apr., 1975), pp. 858-871.Stable URL:
http://links.jstor.org/sici?sici=0025-1909%28197504%2921%3A8%3C858%3APAMFPP%3E2.0.CO%3B2-V
This article references the following linked citations. If you are trying to access articles from anoff-campus location, you may be required to first logon via your library web site to access JSTOR. Pleasevisit your library's website or contact a librarian to learn about options for remote access to JSTOR.
[Footnotes]
1 Use of Consumer Panels for Brand-Share PredictionJ. H. Parfitt; B. J. K. CollinsJournal of Marketing Research, Vol. 5, No. 2. (May, 1968), pp. 131-145.Stable URL:
http://links.jstor.org/sici?sici=0022-2437%28196805%295%3A2%3C131%3AUOCPFB%3E2.0.CO%3B2-K
2 Sprinter Mod III: A Model for the Analysis of New Frequently Purchased ConsumerProductsGlen L. UrbanOperations Research, Vol. 18, No. 5. (Sep. - Oct., 1970), pp. 805-854.Stable URL:
http://links.jstor.org/sici?sici=0030-364X%28197009%2F10%2918%3A5%3C805%3ASMIAMF%3E2.0.CO%3B2-P
9 Consumer Dissatisfaction: The Effect of Disconfirmed Expectancy on Perceived ProductPerformanceRolph E. AndersonJournal of Marketing Research, Vol. 10, No. 1. (Feb., 1973), pp. 38-44.Stable URL:
http://links.jstor.org/sici?sici=0022-2437%28197302%2910%3A1%3C38%3ACDTEOD%3E2.0.CO%3B2-X
http://www.jstor.org
LINKED CITATIONS- Page 1 of 1 -
NOTE: The reference numbering from the original has been maintained in this citation list.