Perception to Risky Choice
22
Perceived Risk Attitudes: Relating Risk Perception to Risky Choice Elke U. Weber * Richard A. Milliman Department of Psychology,Townshend Hall, The Ohio State University, Columbus, Ohio 43210 McKinsey & Company, 133 Peachtree Street,N.E., Atlanta, Georgia 30303 T his paper provides empirical evidence that distinguishes between alternative conceptuali- zations of the risky decision making process. Two studies investigate whether cross- situational differences in choice behavior should be interpreted in the expected utility framework as differences in risk attitude (as measured by risk-averse vs. risk-seeking utility functions) or as differences in the perception of the relative riskiness of choice alternatives as permitted by risk-return interpretations of utility functions, leaving open the possibility of stable cross- situational risk preference as a personality trait. To this end, we propose a way of assessing a person's inherent risk preference that factors out individual and situational differences in risk perception. We document that a definition of risk aversion and risk seeking as the preference for options perceived to be more risky or less risky, respectively, provides the cross-situational stability to a person's risk preference that has eluded more traditional definitions. In Experiment 1, commuters changed their preferences for trains with risky arrival times when the alternatives involved gains in commuting time rather than losses. However, changes in preference coincided with changes in the perception of the riskiness of the choice alternatives, leaving the perceived risk attitudes of a majority of commuters unchanged. Experiment 2, a stockmarket investment task, investigated changes in risk perception, information acquisition, and stock selection as a function of outcome feedback. Investors' stock selections and their perception of the risk of the same stocks were different in a series of decisions in which they lost money than in a series in which they made money. As in Experiment 1, differences in choice and in risk perception were systematically related, such that the majority of investors had the same preference for perceived risk in both series of decisions. Our results provide empirical support for the usefulness of recent risk-return conceptualizations of risky choice (Bell 1995, Jia and Dyer 1994, M. Weber and Sarin 1993). (Risk;Risk Perception; Risk Attitudes;Risky Choice) 1. Introduction The ability to classify individuals on the basis of stable personality traits that have predictable managerial im- plications is important in personnel selection and place- ment as well as training. One such trait is risk prefer- ence, defined on a continuum from risk avoiding to risk seeking. Managerial folklore has it that risk taking is associated with personal and corporate success, an as- sumption that has received some empirical support (MacCrimmon and Wehrung 1986, 1990). Two prob- lems have marred the notion of risk preference as a per- sonality trait. First, different methods of measuring risk preference have been shown to result in different clas- sifications (Slovic 1964; MacCrimmon and Wehrung 1990). Second, even with the same assessment method, individuals have not shown themselved as consistently 0025-1909/97/4302/0123$05.00 Copyright ? 1997, Institute for Operations Research and the Management Sciences MANAGEMENT SCIENCE/Vol. 43, No. 2, February 1997 123
Transcript of Perception to Risky Choice
Perceived Risk Attitudes: Relating Risk
Perception to Risky Choice
Elke U. Weber * Richard A. Milliman Department of Psychology, Townshend Hall, The Ohio State University, Columbus, Ohio 43210
McKinsey & Company, 133 Peachtree Street, N.E., Atlanta, Georgia 30303
T his paper provides empirical evidence that distinguishes between alternative conceptuali- zations of the risky decision making process. Two studies investigate whether cross-
situational differences in choice behavior should be interpreted in the expected utility framework as differences in risk attitude (as measured by risk-averse vs. risk-seeking utility functions) or as differences in the perception of the relative riskiness of choice alternatives as permitted by risk-return interpretations of utility functions, leaving open the possibility of stable cross- situational risk preference as a personality trait. To this end, we propose a way of assessing a person's inherent risk preference that factors out individual and situational differences in risk perception. We document that a definition of risk aversion and risk seeking as the preference for options perceived to be more risky or less risky, respectively, provides the cross-situational stability to a person's risk preference that has eluded more traditional definitions. In Experiment 1, commuters changed their preferences for trains with risky arrival times when the alternatives involved gains in commuting time rather than losses. However, changes in preference coincided with changes in the perception of the riskiness of the choice alternatives, leaving the perceived risk attitudes of a majority of commuters unchanged. Experiment 2, a stockmarket investment task, investigated changes in risk perception, information acquisition, and stock selection as a function of outcome feedback. Investors' stock selections and their perception of the risk of the same stocks were different in a series of decisions in which they lost money than in a series in which they made money. As in Experiment 1, differences in choice and in risk perception were systematically related, such that the majority of investors had the same preference for perceived risk in both series of decisions. Our results provide empirical support for the usefulness of recent risk-return conceptualizations of risky choice (Bell 1995, Jia and Dyer 1994, M. Weber and Sarin 1993). (Risk; Risk Perception; Risk Attitudes; Risky Choice)
1. Introduction The ability to classify individuals on the basis of stable personality traits that have predictable managerial im- plications is important in personnel selection and place- ment as well as training. One such trait is risk prefer- ence, defined on a continuum from risk avoiding to risk seeking. Managerial folklore has it that risk taking is associated with personal and corporate success, an as-
sumption that has received some empirical support (MacCrimmon and Wehrung 1986, 1990). Two prob- lems have marred the notion of risk preference as a per- sonality trait. First, different methods of measuring risk preference have been shown to result in different clas- sifications (Slovic 1964; MacCrimmon and Wehrung 1990). Second, even with the same assessment method, individuals have not shown themselved as consistently
0025-1909/97/4302/0123$05.00 Copyright ? 1997, Institute for Operations Research and the Management Sciences MANAGEMENT SCIENCE/Vol. 43, No. 2, February 1997 123
This content downloaded from 128.59.222.12 on Thu, 04 Jun 2015 14:39:18 UTCAll use subject to JSTOR Terms and Conditions

WEBER AND MILLIMAN Relating Risk Perception to Risky/ Choice
risk seeking or risk avoiding across different domains and situations, both in laboratory studies and in man- agerial contexts (MacCrimmon and Wehrung 1986, 1990; Payne, Laughhunn and Crum 1980; Schoemaker 1990). Schoemaker (1993) argued that risk preference as a stable individual-difference construct, i.e., as a vari- able that does not change across different stimulus do- mains or contexts, may not be detectable when looking at people's choices, because it is masked by a number of situational factors, for example, portfolio considera- tions or intertemporal effects. In this paper we argue that the fact that situational variables may affect peo- ple's choices under risk does not necessarily mean that stable individual differences in risk preference cannot be measured.
In ?2, we describe the conceptualization and role of risk preference under two prominent frameworks for decision making under risk. In the expected utility (EU) framework, risk preference is operationalized as risk at- titudes that are descriptive labels for the shape of the utility function presumed to underlie a person's choices. Choice of a sure amount of money over a lottery with equal expected value would classify a person as risk- averse, but the quantification of risk and risk attitudes play at most a minor role in the EU framework. In con- trast, risk and risk preference are central to the other major theoretical framework for decision making under risk, namely the risk-return (also referred to as risk- value) framework, prevalently encountered in the the- ory of finance. Some theorists consider risk-return tradeoff models "more intuitively satisfying . . . than expected utility" (Bell 1995, p. 3). Sarin and M. Weber (1993, p. 148) describe the "intuitive appeal of risk- value models" as the fact that they require that "choice should depend on the riskiness of the gamble and its value." In the risk-return framework, (i) expected re- turn is usually assumed to be the measure of value, (ii) riskiness is measured differently by different models, (iii) greater value and lower risk are assumed to be more desirable, and (iv) an investor's preference for (or attitude towards) risk is assumed to determine his or her risk-value tradeoff.
To the extent that both EU and risk-return models provide rational conceptualizations of decision making under risk, they ought to be compatible with each other. Several researchers have worked out the correspon- dence between specific models in the two frameworks.
Early risk-return models equated risk with variance, a formalization that is compatible with a quadratic utility function (Levy and Markowitz 1979). Recent work has shown that a broad range of utility functions have a risk-return interpretation, with different utility func- tions implying different measures of risk (Bell 1995, Jia and Dyer 1995, Sarin and M. Weber 1993). One way of determining whether risk-return models are indeed in- tuitively more attractive formalizations of the choice process, i.e., whether they come closer to the way people think about risky decisions, would be to see whether people's perception of the riskiness of choice alterna- tives corresponds to the risk measure inherent in the utility function that describes their judgments. It is an empirical question whether investors' introspection into their perception of risk would be accurate enough to be fit to the specific functional forms of the various risk measures suggested in the literature. However, one might expect the following, more qualitative, prediction to hold if the risk-return decomposition of utility func- tions indeed comes closer to describing the choice pro- cess. If situational determinants affect choice behavior such that choice is described by qualitatively different utility functions, there should also be some detectable effect on the perceived riskiness of the choice alterna- tives in the two situations. In this paper we describe two empirical tests of this proposition.
In ?3, we review the evidence that people's percep- tions of the riskiness of choice alternatives are not al- ways captured by conventional risk indices and can dif- fer significantly from individual to individual. Further- more, the perceived riskiness of a choice alternative seems to depend on a person's reference point, which can be manipulated in a variety of ways that include outcome framing (Schurr 1987) and the outcome history of preceding decisions (Bottom 1990). In conjunction with risk-return conceptualizations that allow for dif- ferences in the measure and, by extension and impli- cation, in the perception of risk, such results suggest that differences in risky choice should not automatically be interpreted as the result of changes in people's pref- erence for risk, but may also, at least partially, be the result of changes in their perception of the risks.
Distinguishing between changes in risk perception and changes in risk preference is important for our un- derstanding of the underlying processes that may drive suboptimal choice behavior. Hausch, Ziemba and
124 MANAGEMENT SCIENCE/Vol. 43, No. 2, February 1997
This content downloaded from 128.59.222.12 on Thu, 04 Jun 2015 14:39:18 UTCAll use subject to JSTOR Terms and Conditions
WEBER AND MILLIMAN Relating Risk Perception to Risky Choice
Rubinstein (1981), for example, demonstrated market inefficiencies in racetrack betting by providing a strat- egy for place and show bets that produced substantial profits when tested on data from two racetracks. Spec- ulating about reasons for the observed choice pattern, i.e., increased preference of gamblers for longshots after repeated losses, they provided a utility-function expla- nation (convex functions with increasing absolute risk aversion), and a more psychological explanation about the ego satisfaction of being one of a small number of people who correctly predicted a winner which cannot be had by betting on favorites. These explanations, how- ever, beg the question of why gamblers' risk attitudes or ego-satisfaction should change over the course of the racing day.' A risk-return decomposition of the chang- ing utility functions allows for an alternative interpre- tation, namely that the perception of what constitutes a risky option may change as a function of outcome feed- back. According to this interpretation, betting behavior changes not because of changes in risk preference, but because of changes in the perception of what constitutes a risky horse. For purposes of decision aiding or reme- diation of suboptimal choice behavior it is crucial to know which of these mechanisms determines observed changes in choice. If changes in risk perception are the driving force, then effective remediation should target cognitive processes, with information aimed at more re- alistic risk perception. If changes in risk preference are the driving force, then intervention needs to target peo- ple's emotional responses. Cooper, Woo and Dunkel- berg (1988) provide further evidence for the necessity of differentiating between differences in risk perception and risk attitude. They found that the factor that differ- entiated entrepreneurs from other managers were not a greater preference for risks but instead an overly opti- mistic perception of the risks involved. For an outside observer who perceives risks more realistically, it may appear that entrepreneurs have a propensity to engage in risky ventures. However, when differences in risk perception are factored out, entrepreneurs have dem-
1 There are explanations for changes in aggregate choice patterns that have nothing to do with changes in the choice behavior of individual gamblers, but postulate changes in the composition of the aggregate. To eliminate the possibility of such arguments, we observed behavior at the individual subject level in the studies reported in this paper, and manipulations were done on a with-in subject basis.
onstrated a preference for tasks in which the risks are only moderate (Brockhaus 1982).
The possibility that situational differences in risky choice may be due to differences in the perception of risk brings us back to our first topic of discussion, namely risk preference as a stable personality trait. Sit- kin and Pablo (1992) distinguish between risk propen- sity (defined as the observed likelihood of a person tak- ing or avoiding risk, where risk is defined in some ob- jective way) and risk preference (defined as the character trait of being attracted or repelled by risk) and argue that people's inherent risk preference in combi- nation with situational factors determines their risk pro- pensity, i.e., their observable level of risk seeking or avoiding, revealed for example by the shape of the un- derlying utility function. In ?2 we build on this distinc- tion and hypothesize that situational variables such as outcome framing or prior outcome history will affect people's risk perception but not their inherent risk pref- erence. If so, then it is possible to infer people's inherent risk preference from their choices by factoring out their perception of the relative riskiness of the choice alter- natives. We test in two studies whether this measure of perceived risk attitude, assumed to be a proxy for in- herent risk preference, does indeed show greater cross- situational consistency than conventional measures of risk attitude.
To this end, we selected two situational manipula- tions known to result in qualitative differences in choice behavior. Section 4 presents the results of an experi- mental study of commuter preferences for trains with risky arrival times, designed to take advantage of Kahneman and Tversky's (1979) reflection effect, i.e., the tendency of choices to appear risk-averse in the gain domain and risk-seeking in the loss domain. As ex- pected, respondents picked different alternatives when choosing trains from pairs of alternatives that both in- volved gains than when choosing trains from pairs of alternatives that both involve losses. However, in ad- dition to changes in choice, we also observed changes in the perception of the alternatives' relative riskiness. As a result, inherent risk preference operationalized as perceived risk attitudes, where risk seeking/avoidance was defined as a person's preference for alternatives per- ceived as more/ less risky, was the same in the loss as in the gain domain for the majority of commuters, even though choices reflected.
MANAGEMENT SCIENCE/Vol. 43, No. 2, February 1997 125
This content downloaded from 128.59.222.12 on Thu, 04 Jun 2015 14:39:18 UTCAll use subject to JSTOR Terms and Conditions

WEBER AND MILLIMAN Relating Risk Perception to Risky Choice
The other manipulation documented to result in dif- ferences in risky choice is previous outcome history. Section 5 reviews the literature on the effects of task success and failure on subsequent performance. Section 6 describes Experiment 2, a computer-based stockmar- ket investment task, that examined the effects of task success vs. failure on information acquisition, risk per- ception, and investment choices over a series of deci- sions, making it possible to track gradual changes in choice and attribute them to either changes in risk per- ception or changes in inherent risk preference.
Section 7 summarizes the theoretical insights as well as practical implications for the dynamics of risky de- cision making that emerge from the two experiments. Consistent with psychological implications of risk- return decompositions of utility functions, variables that affect the utility function describing choice also seem to affect the implicit measure and conscious per- ception of the riskiness of choice alternatives. Allowing perceived risk to differ as a function of the situation makes it possible for people's inherent risk preferences to be constant, even though choices and utility functions change.
2. Definitions of Risk Preference 2.1. Traditional Risk Attitudes In the expected utility framework, risk preference is op- erationalized as risk attitudes which are derived from people's choices. Risk attitudes describe the shape of the utility function derived from a series of such choices. The Arrow (1971)-Pratt (1964) measure of risk attitude, for example, is defined as -u"(x)/u'(x), where u' and u" denote the first and second derivative of the utility function u, respectively. A concave utility function is evidence for risk aversion (because individuals with such utility will accept certainty equivalents below the expected value of a lottery), whereas a convex utility function is evidence for risk seeking. "Risk attitude" is a descriptive but redundant label for the shape of a util- ity function. Changes in risky choice are modeled as changes in the utility function hypothesized to underlie the choices.2 Operationalized as the shape of utility
2Some risky choice phenomena have been modeled by nonlinear prob- ability weighting functions instead of (or in addition to) nonlinear
functions in the EU framework, risk preference has shown little with-in subject consistency across domains and situations (MacCrimmon and Wehrung 1986, Schoemaker 1990). Kahneman and Tversky (1979) ex- tended expected utility theory by allowing for the eval- uation of outcomes as gains or losses relative to some reference point, but still defined risk attitudes by the shape of their value function. Prospect theory risk atti- tudes also have been shown to reflect from risk aversion in the gain domain to risk seeking in the loss domain.
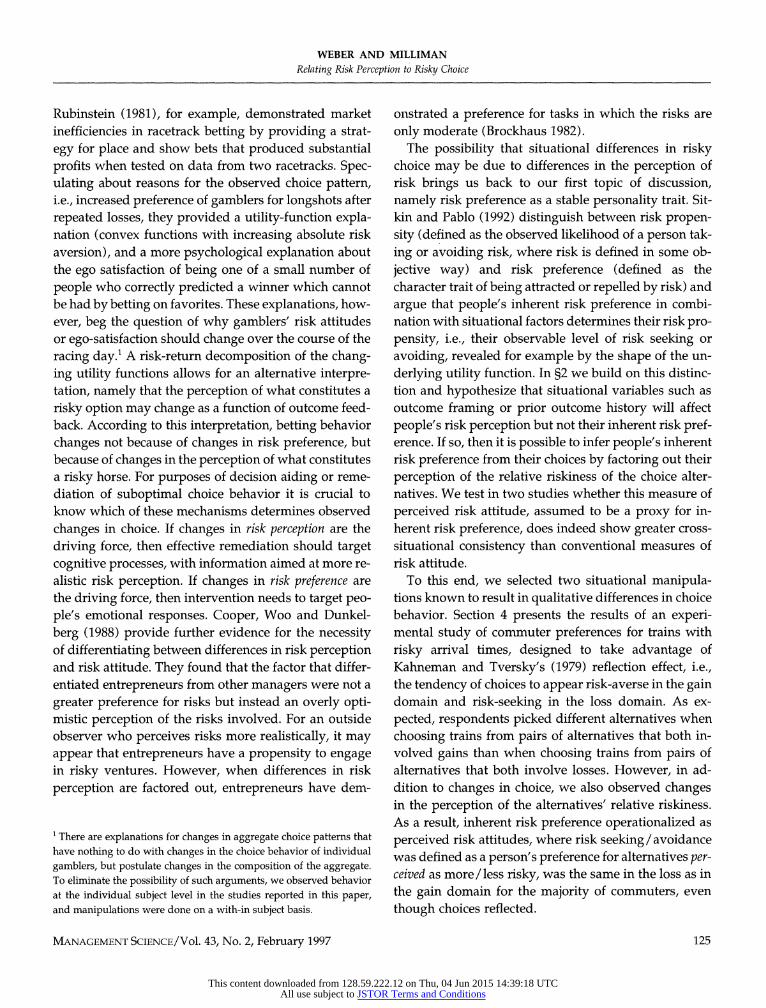
2.2. Relative Risk Attitudes Dyer and Sarin (1982) suggested a different definition of risk preference and a different procedure for assess- ing it. Their introduction of the concept of relative risk attitude was an attempt to separate marginal value for outcomes from attitudes towards uncertainty, two fac- tors that are confounded in the expected utility frame- work. As illustrated in Figure 1, the concave ("risk- averse") utility function shown in the bottom panels can result from the combination of decreasing marginal value for money, where marginal value is assessed in a riskless context (top left panel), and a linear attitude towards uncertainty, i.e., no difference between utility assessed in a risky context and marginal value assessed in a riskless context (middle left panel). The same con- cave ("risk-averse") utility function can also result from the combination of constant marginal value for money (top right panel), and a negative attitude towards un- certainty (middle right panel). Dyer and Sarin (1982) hypothesized that differences in risk preference in the expected-utility sense observed in different domains may actually be the result of differences in marginal value in those domains. This allows for the possibility that an individual's relative risk attitude, i.e., his or her preference for risk or uncertainty per se, may remain unchanged and thus may be a candidate for a stable personality trait. The assessment of a person's relative
utility functions, as in the currently popular class of rank-dependent utility models (Luce and Fishburn 1991, Tversky and Kahneman 1992). Similar to EU risk attitudes being only descriptive labels of the shape of the underlying utility functions, the labels given to different rank-dependent probability weighting functions (e.g., optimism or pessimism) are only descriptive labels for the shape of the probability weighting function derived from choices, rather than independently assessed psychological states or traits.
126 MANAGEMENT SCIENCE/Vol. 43, No. 2, February 1997
This content downloaded from 128.59.222.12 on Thu, 04 Jun 2015 14:39:18 UTCAll use subject to JSTOR Terms and Conditions
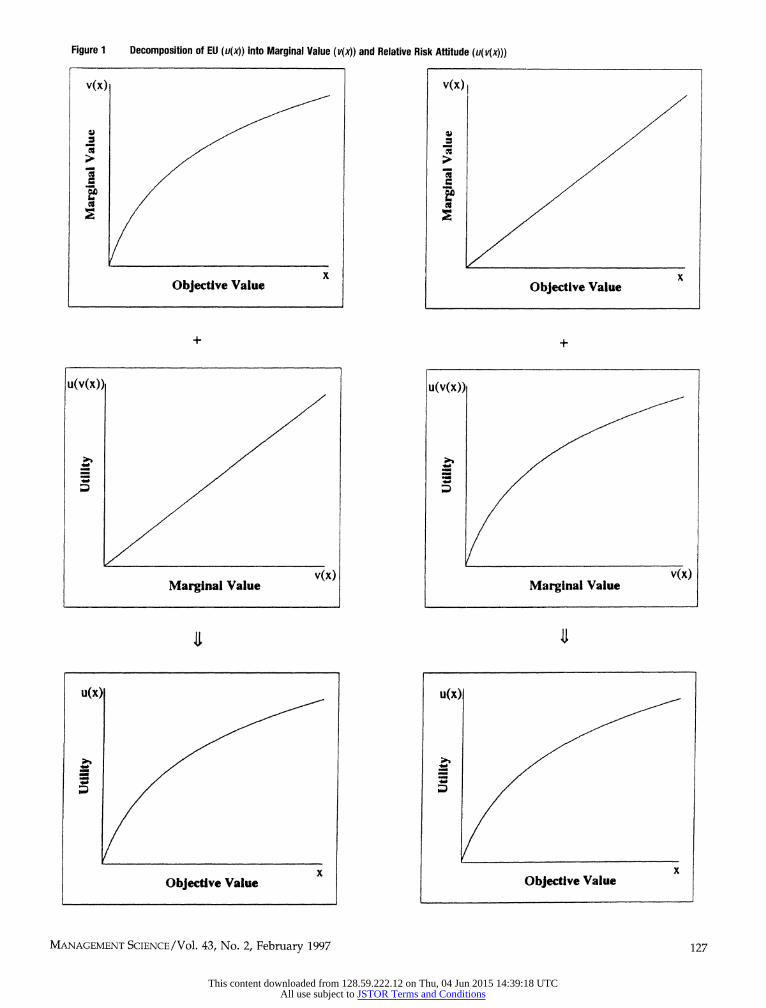
Figure 1 Decomposition of EU (u(x)) into Marginal Value (v(x)) and Relative Risk Attitude (u(v(x)))
v(x) V(X)I
x x Objective Value Objective Value
+ +
U(V(x)) U(v(x))
v(x) v(x) Marginal Value Marginal Value
u(x) u(x)
x x Objective Value Objective Value
M4ANAGEMENT SCIENCE/Vol. 43, NO. 2, February 1997 127
This content downloaded from 128.59.222.12 on Thu, 04 Jun 2015 14:39:18 UTCAll use subject to JSTOR Terms and Conditions
WEBER AND MILLIMAN Relating Risk Perception to Risky Choice
risk attitude is still indirect, i.e., is derived from the as- sessment of a utility function u and a riskless marginal value function v. After partialling out any nonlinearity in the utility function that is the result of nonlinear mar- ginal value for increases in outcomes (i.e., the result of a nonlinear v(x)), relative risk attitude is defined as -u"(v(x))/u'(v(x)), and contains the remaining nonlin- earity that reflects a person's preference for risk per se.
Keller (1985) compared people's Arrow-Pratt mea- sure of risk attitude (inferred from their choices in var- ious decision domains) to their relative risk attitude (in- ferred from choices and marginal value functions). She found that the two agreed in only a small number of cases, which supports the usefulness of disentangling attitude towards uncertainty from nonlinear marginal value. While relative risk aversion was the majority at- titude, i.e., most people preferred certainty after factor- ing out nonlinearities in their riskless marginal value functions, it was far from universal. When comparing the relative risk attitudes of individuals across different decision domains, people did not show any more cross- domain consistency in relative risk attitudes than for the Arrow-Pratt measure. Thus, relative risk attitudes did not provide a measure of risk preference that was any more stable across situations than conventional risk at- titudes.
2.3. Perceived Risk Attitudes Looking at the relationship between risk perception and choice provides yet another way of measuring an indi- vidual's risk preference. The definition of risk prefer- ence in this section involves the question whether, ceteris paribus,3 a decision maker has a tendency to be attracted or repelled by alternatives that he or she per- ceives as more risky over alternatives perceived as less risky. Weber and Bottom (1989) proposed this defini- tion, labeling it "perceived risk attitudes" because it re- lates risk perception to choice behavior, and operation- alized it by the following assessment procedure. Given a set of monetary lotteries with equal expected value (in their case, 28 pairs of monetary lotteries), individuals who consistently chose the lottery in a given pair that they judged to be riskier (less risky) were labelled "risk
3In Weber and Bottom (1989) and Experiment 1 below, the main factor controlled to be the same is the expected return of alternatives.
seeking" ("risk averse"). Consistency can be defined in different ways. Weber and Bottom (1989) did it statis- tically, by means of a sign test. People's perceived risk attitudes for a set of positive-outcome lotteries were compared to their perceived risk attitude for the corre- sponding negative outcome set (i.e., lotteries where each positive outcome had been changed to a negative outcome of the same absolute value). Even though choices reflected for most subjects in the direction pre- dicted by prospect theory (Kahneman and Tversky 1979), perceived risk attitudes were quite stable across the two domains. 76% of all subjects were either per- ceived risk averse or risk neutral for both sets of lotter- ies, where risk aversion refers to the consistent choice of lotteries judged to be less risky. Only one person with averse perceived risk attitudes for the positive-outcome lotteries displayed perceived risk seeking for the negative-outcome lotteries.
The three operationalizations of risk preference de- scribed in this section are compared in Experiment 1 (?4), with the result that perceived risk preference showed significantly greater cross-situational stability than either risk preference defined in the EU sense or relative risk preference. The purpose of the comparison is not to argue that any of the definitions is inherently superior to the others. To the extent that the three def- initions do not lead to the same classification of people with respect to risk preference, it seems advisable, how- ever, to give them different labels. It is perfectly legiti- mate, for example, to have a descriptive label for the convexity or concavity of a utility function that de- scribes choice, as long as not more is read into the label. To use the terms "risk seeking" and "risk avoiding" as labels may, however, invite the misunderstanding that some causal connection between risk attitude and choice is implied and/or that the choice behavior is in- fluenced by some stable personality trait.
3. Individual Differences and Situational Changes in Risk Perception
The main definition of risk in the Oxford English Dictionary describes it as "a chance of injury or loss." This definition leaves open the relative contribution of the two risk factors implicit in it, namely the magnitude of potential losses and their chances of occurring. The
128 MANAGEMENT SCIENCE/Vol. 43, No. 2, February 1997
This content downloaded from 128.59.222.12 on Thu, 04 Jun 2015 14:39:18 UTCAll use subject to JSTOR Terms and Conditions
WEBER AND MILLIMAN Relating Risk Perception to Risky Choice
variance of the distribution of possible outcomes is one way of combining these two components, but one that has frequently been found to have only marginal influ- ence on people's choices or risk judgments (Slovic 1967). As discussed below, the relative emphasis people put on probability vs. magnitude of outcomes when judging risk can vary as a function of demographic characteristics associated with wealth levels. In addi- tion, reference levels affect risk perception, for example disaster levels of loss exposure that would lead to bank- ruptcy, and there is evidence of aversion on part of some managers against projects that might result in any loss at all (Swalm 1966). A component of risk com- pletely ignored by the dictionary definition that emerges in definitions of risk provided by members of the general public (Slovic 1987) as well as top-level ex- ecutives (March and Shapira 1987) is the controllability of the loss exposure. Finally, college students as well as manager also seem to incorporate a sense of balance between possible losses and gains into their judgments of the riskiness of options (Weber and Bottom 1989; MacCrimmon and Wehrung 1986, p. 18).
Motivated by the potential ambiguity of the concept of risk, there is a large literature on descriptive models of perceived risk (see Weber 1988, and Sarin and M. Weber 1993, for reviews). This literature questions the assumption that risk is an immutable attribute of a de- cision alternative that is perceived the same way by dif- ferent decision makers. Weber, Anderson and Birn- baum (1992), for example, plotted people's risk judg- ments for a set of monetary lotteries against their corresponding attractiveness judgments and classified respondents into two groups, those for whom risk and attractiveness judgments were linearly related (the greater the risk, the smaller the attractiveness) and those for whom no functional relationship existed between risk and attractiveness judgments. Analyses of variance revealed that people in these two groups differed in their perceptions of the riskiness but not of the attrac- tiveness of the choice alternatives. In particular, people in the two groups differed in the degree to which their risk judgments were affected by the probability of neg- ative outcomes. In a study that looked exclusively at risk judgments, Weber (1988) found individual differences also in the effect of the magnitude of positive and neg- ative outcomes on the perceived risk of money lotteries, with individual difference being a function of respon-
dents' age and occupation (i.e., college students vs. high school teachers). Consistent with the notion that occu- pation or socio-economic status may determine risk per- ception, Barron (1976) found good agreement between the risk rankings of a set of lotteries among a homoge- neous set of faculty members of a business school.
If different people can perceive risk differently in the same situation, then it may also be possible for a given individual to perceive the risk of the same alternative differently at different times or in different contexts. Studies of risky decisions over time or under different circumstances have typically only examined changes in choice behavior, with McGlothlin's (1956) analysis of the frequency of long-shot bets in parimutuel horse bet- ting over the course of the racing day as a typical ex- ample. To the extent that time of day at the racetrack is positively correlated with magnitude of losses, Mc- Glothlin's results show that the frequency of betting on long-shots increases with previous losses. Prospect the- ory can model such behavior as insufficient adjustment of the reference point to the current asset position (i.e., as a "sticky reference point" problem) that results in an increasingly prominent sunk cost effect (Thaler 1980). To explain observed increases in long-shot betting as a sticky reference point problem which lead to the use of different parts of the prospect theory value function to make the same decision at different points in time, at- tributes the phenomenon to a change in risk preference in the EU sense. A person betting on a long-shot at the end of the racing day would be fully aware of the "risk- iness" of the horse but seek it out to recover his or her losses. Our alternative explanation hypothesizes that bettors' perception of the riskiness of different choice alternatives may change dynamically with the experi- ence of failure and resulting losses. Such a change in risk perception could be driven by changes in aspiration level. Thus, a person's risk preference may remain the same over the course of the racing day (e.g., risk averse), but the perception of what constitutes a risky horse will change.
Experiment 1 in ?4 provides a conceptual replication of Weber and Bottom (1989) in a different content do- main (commuter trains with risky arrival times rather than monetary lotteries). It was designed to extend the assessment of perceived risk attitudes to choice sets in- volving two risky prospects and to examine the agree- ment among the three definitions of risk preference
MANAGEMENT SCIENCE/Vol. 43, No. 2, February 1997 129
This content downloaded from 128.59.222.12 on Thu, 04 Jun 2015 14:39:18 UTCAll use subject to JSTOR Terms and Conditions

WEBER AND MILLIMAN Relating Risk Perception to Risky Choice
Table 1 Classification of Commuters by EU and Relative Risk Attitudes
(a) Gain Domain: Arrival Times Faster Than or Equal to the Status Quo
Relative Risk Aftitude EU Risk Aftitude Averse Seeking Neutral Mixed Averse 10 2 1 0 113 Seeking 11 5 6 3 125 Neutral 2 1 1 0 1 4 Mixed 1 5 1 5 112
24 13 9 8
Same Classification > 21/54 = 39%
(b) Loss Domain: Arrival Times Slower Than or Equal to the Status Quo
Relative Risk Attitude EU Risk Attitude Averse Seeking Neutral Mixed Averse 13 0 5 1 119 Seeking 6 7 1 0 114 Neutral 1 6 6 0 113 Mixed 2 1 2 3 8
22 14 14 4
Same Classification > 29/54 = 54%
Note. Boldfaced frequencies are commuters for whom both measures of risk attitude led to the same classification.
described in ?2: (i) EU risk attitudes that describe the shape of commuters' single-attribute utility function for time savings and losses, (ii) relative risk attitudes that describe their attitudes towards uncertainty, and (iii) perceived risk attitudes that describe their preference for trains perceived to be more or less risky. For each definition of risk preference, we examined its consis- tency across loss vs. gain decisions. For maximum sta- tistical power and experimental control, all comparisons were within-subject.
4. Experiment 1: Risk Attitudes in Commuting Preference
Fifty-four members of the University of Chicago com- munity participated in a study advertized as Consumer Research about Commuting Preferences. Participants were required to have personal experience with com- muting to the university by train. A questionnaire was administered in personal interviews, taking on average
an hour to complete. Participants were paid for their participation at an hourly rate of $6 to encourage careful answers. Commuting time was chosen as the stimulus dimension for its realism, i.e., participants who had first-hand experience with it could be found. Further- more, it was chosen as a domain in which one might find people with both risk-seeking as well as risk-averse preferences, providing for more interesting and gener- alizable results. Finally, it made our results comparable to those of Keller (1985) who used commuting time as one of her scenarios when comparing expected-utility and relative risk attitudes.
4.1. Procedure Part I of the questionnaire assessed each person's risk- less marginal value function for longer or shorter com- muting times. Respondents were told to assume that they currently had a 60 minute commute for which they were paying $3. They were then asked how much they would be willing to pay for a train ride that was either 5, 10, 15, 20, 30, or 40 minutes faster or slower than their current commute, keeping in mind the current price of $3 for the 60 minute ride.
Part II of the questionnaire assessed each person's utility function for commuting times in both the gain domain (faster trains) and the loss domain (slower trains), using the lottery-equivalence method for its elimination of potentially distorting effects of certainty (McCord and Neufville 1986). Respondents provided the probability q that would make them indifferent be- tween a train connection with an arrival time that was 40 minutes faster (slower) than the status quo of 60 minutes, and a train connection that arrived either 5, 10, 15, 20, or 30 minutes faster (slower) with probability 0.80. The probabilistic nature of arrival time of trains was explained as the chance of making different transfer connections.
Part III of the questionnaire assessed perceived risk attitudes. Respondents made pairwise comparisons with respect to preference and, at a later point, with respect to risk for 12 pairs of trains in both the gain domain, where all arrival times were faster than or equal to their current commuting time of 60 minutes, and the loss domain (identical in absolute value to the gain options, but where all arrival times were slower than or equal to their current commuting time). The probabilistic nature of arrival time of trains was again
130 MANAGEMENT SCIENCE/Vol. 43, No. 2, February 1997
This content downloaded from 128.59.222.12 on Thu, 04 Jun 2015 14:39:18 UTCAll use subject to JSTOR Terms and Conditions
WEBER AND MILLIMAN Relating Risk Perception to Risky Choice
explained as the chance of making different transfer connections when changing trains downtown. Prefer- ence judgments were elicited by presenting two train connections with risky arrival times (e.g., Option A which offered a .3 chance of getting them to their des- tination 40 minutes faster than the status quo and a .7 chance of no change vs. Option B which offered a .5 chance of getting them to their destination 15 minutes faster than the status quo and a .5 chance of getting them there 10 minutes faster. Respondents were asked which option they preferred. Indifference judgments were also allowed. At a different point in time (with the order of tasks counterbalanced), respondents were shown the same pairs of train options in a different random order and were asked which option in each pair they consid- ered riskier. Risk was left undefined, and the response "both options equally risky" was also allowed. The choice pairs consisted of trains with equal expected value but different variances in arrival time. Possible arrival times ranged from 50 to 40 minutes faster (or slower) than the status quo, i.e., were within the same range of arrival times for which utility and riskless value functions were assessed in Parts I and II. Proba- bility levels ranged from 0.10 to 0.95 and were all mul- tiples of 0.05. The expected values of the arrival time of trains ranged from 4 to 27.5 minutes faster (slower) than the status quo of 60 minutes.
4.2. Results Following the logic and procedures detailed in Dyer and Sarin (1982) and Keller (1985), we derived individ- uals' riskless marginal value functions v(x) for increases or decreases in commuting time from their responses to Part I, and utility functions u(x) for increases or de- creases in commuting time from their responses to Part II of the questionnaire. Keller (1985) fitted particular parametric functions to the responses of her respon- dents. We were primarily interested in the qualitative shape of people's utility u(x) and relative-risk-attitude functions u(v(x)) in order to classify them as risk averse or risk seeking in either the EU sense or the relative- risk-attitude sense. Thus we simply plotted each indi- vidual's responses to the questions of Part II against the corresponding objective increases or decreases in com- muting time (x) and classified the resulting utility func- tion u(x) visually as either approximately linear, con- cave, convex, or mixed (i.e., varying in concavity and
convexity over its range).' Those shapes allowed us to classify individuals as either risk neutral, risk averse, risk seeking, or varying in risk attitude in the EU sense. The observed frequencies of these classifications are shown in the marginal row totals of Table 1. We simi- larly plotted people's responses to the questions of Part II against their marginal value for increases or decreases in commuting, i.e., against their v(x) as assessed in Part I of the questionnaire. The shape of the resulting func- tion u(v(x)) was visually classified into the same cate- gories as described for u(x). The observed frequencies of the different relative-risk-attitude classifications are shown in the marginal column totals of Table 1. Our results were quite similar to those of Keller (1985) for savings in commuting time.5 The majority of people were classified as risk seeking for gains and risk averse for losses, when risk attitudes were defined as labels of the shape of their utility function for gains and losses in commuting time. For relative risk attitudes, on the other hand, the majority of commuters was classified as risk averse for both time gains and time losses.
The cross-classification of EU risk attitudes and rela- tive risk attitudes in Table 1 shows that the two were the same for some people, i.e., for 39% of respondents in the gain domain and for 54% in the loss domain. For these people, the shape of their utility function was the result of their attitude towards uncertainty rather than the result of nonlinear marginal values for increases or decreases in commuting time, as in the right panels of Figure 1. For the remaining individuals, however, the two measures of risk attitude led to different classifi- cations, indicating that the shape of their utility function was determined at least partly by nonlinear marginal values for increases or decreases in commuting time and only partly by their attitudes towards uncertainty. For example, individuals with a convex utility function u(x) and a concave relative risk function u(v(x)) in the domain of gains, had a convex marginal value function v(x) for gains in commuting time.
Relative risk attitudes were also more consistent across the gain and loss domain than EU risk attitudes
4These classifications were done by two independent raters, who ar- rived at the same judgments 97% of the time. Discrepancies were re- solved by discussion between the raters.
5 Keller did not consider losses.
MANAGEMENT SCIENCE/Vol. 43, No. 2, February 1997 131
This content downloaded from 128.59.222.12 on Thu, 04 Jun 2015 14:39:18 UTCAll use subject to JSTOR Terms and Conditions
WEBER AND MILLIMAN Relating Risk Perception to Risky Choice
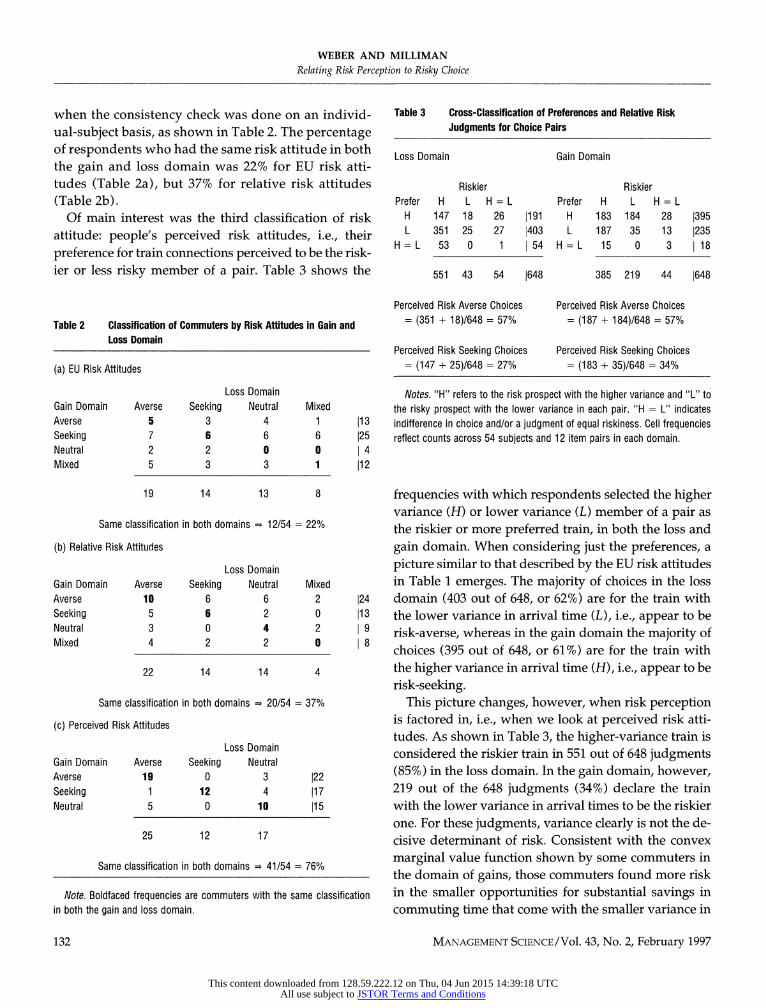
when the consistency check was done on an individ- ual-subject basis, as shown in Table 2. The percentage of respondents who had the same risk attitude in both the gain and loss domain was 22% for EU risk atti- tudes (Table 2a), but 37% for relative risk attitudes (Table 2b).
Of main interest was the third classification of risk attitude: people's perceived risk attitudes, i.e., their preference for train connections perceived to be the risk- ier or less risky member of a pair. Table 3 shows the
Table 2 Classification of Commuters by Risk Attitudes in Gain and Loss Domain
(a) EU Risk Attitudes
Loss Domain Gain Domain Averse Seeking Neutral Mixed Averse 5 3 4 1 113 Seeking 7 6 6 6 125 Neutral 2 2 0 0 1 4 Mixed 5 3 3 1 112
19 14 13 8
Same classification in both domains > 12/54 = 22%
(b) Relative Risk Attitudes
Loss Domain Gain Domain Averse Seeking Neutral Mixed Averse 10 6 6 2 124 Seeking 5 6 2 0 113 Neutral 3 0 4 2 9 Mixed 4 2 2 0 8
22 14 14 4
Same classification in both domains > 20/54 = 37%
(c) Perceived Risk Attitudes
Loss Domain Gain Domain Averse Seeking Neutral Averse 19 0 3 122 Seeking 1 12 4 117 Neutral 5 0 10 115
25 12 17
Same classification in both domains > 41/54 = 76%
Note. Boldfaced frequencies are commuters with the same classification in both the gain and loss domain.
Table 3 Cross-Classification of Preferences and Relative Risk Judgments for Choice Pairs
Loss Domain Gain Domain
Riskier Riskier Prefer H L H = L Prefer H L H = L
H 147 18 26 1191 H 183 184 28 1395 L 351 25 27 403 L 187 35 13 1235
H = L 53 0 1 1 54 H = L 15 0 3 1 18
551 43 54 1648 385 219 44 1648
Perceived Risk Averse Choices Perceived Risk Averse Choices = (351 + 18)/648 = 57% = (187 + 184)/648 = 57%
Perceived Risk Seeking Choices Perceived Risk Seeking Choices = (147 + 25)/648 = 27% = (183 + 35)/648 = 34%
Notes. "H" refers to the risk prospect with the higher variance and "L" to the risky prospect with the lower variance in each pair. "H = L" indicates indifference in choice and/or a judgment of equal riskiness. Cell frequencies reflect counts across 54 subjects and 12 item pairs in each domain.
frequencies with which respondents selected the higher variance (H) or lower variance (L) member of a pair as the riskier or more preferred train, in both the loss and gain domain. When considering just the preferences, a picture similar to that described by the EU risk attitudes in Table 1 emerges. The majority of choices in the loss domain (403 out of 648, or 62%) are for the train with the lower variance in arrival time (L), i.e., appear to be risk-averse, whereas in the gain domain the majority of choices (395 out of 648, or 61%) are for the train with the higher variance in arrival time (H), i.e., appear to be risk-seeking.
This picture changes, however, when risk perception is factored in, i.e., when we look at perceived risk atti- tudes. As shown in Table 3, the higher-variance train is considered the riskier train in 551 out of 648 judgments (85%) in the loss domain. In the gain domain, however, 219 out of the 648 judgments (34%) declare the train with the lower variance in arrival times to be the riskier one. For these judgments, variance clearly is not the de- cisive determinant of risk. Consistent with the convex marginal value function shown by some commuters in the domain of gains, those commuters found more risk in the smaller opportunities for substantial savings in commuting time that come with the smaller variance in
132 MANAGEMENT SCIENCE/Vol. 43, No. 2, February 1997
This content downloaded from 128.59.222.12 on Thu, 04 Jun 2015 14:39:18 UTCAll use subject to JSTOR Terms and Conditions

WEBER AND MILLIMAN Relating Risk Perception to Risky Choice
arrival time of the L-trains than in the greater unpre- dictability that comes with higher variance in arrival time of the H-trains. In other words, when all arrival times were faster than the current status quo (i.e., when there was no apparent downside), high variance did not appear to be a concern for all commuters. Instead, as- piration levels set by the potentially large savings in arrival time possible with the H-trains appeared to af- fect perceptions of the riskiness of trains for these com- muters. On the other hand, in the loss domain where unpredictability in increases in commuting time had more serious downside potential (e.g., being late for work or class), the greater unpredictability that comes with greater variance was of overwhelming concern to all commuters.
Regardless of one's opinion about the "rationality" of the implicit definition of risk given by some commuters for trains in the gain domain, changes in their definition of what constitutes a "riskier" train as one goes from losses in arrival time to gains need to be factored in when risk preference in the two domains is assessed and compared. We defined perceived risk-averse choices as those in which the member of a choice pair that was judged less risky was preferred, and perceived risk- seeking choices as those in which the member of a pair that was judged more risky was preferred. Thus de- fined, the majority of choices (57%) were risk averse in both domains. For losses in commuting time, risk- averse choices consisted almost exclusively of prefer- ence for the low-variance train which was perceived to be less risky. For gains in commuting time however, the pattern was more complex. The distribution of "riskier" judgments was more even between higher-variance and lower-variance trains, while majority preference shifted to the higher-variance train.
4.3. Discussion In summary, for choices in the loss domain, i.e., between train connections with arrival times slower than or equal to status quo, the majority preference was for the lower-variance option. This is contrary to the predic- tions of Kahneman and Tversky's (1979) prospect the- ory value function for financial losses but agrees with the results of Leclerc, Schmitt and Dube (1994) who also found that people made risk-averse decisions about time in the domain of losses. In that study, respondents justified their risk-averse choices by emphasizing the
benefits of being able to plan ahead when time is more predictable. Predictability of losses may be more im- portant in the time domain than in the financial domain, a result that raises the question of the generalizability of prospect theory's value function to dimensions other than money. In the gain domain where arrival times were all faster than or equal to status quo, the majority preference was for the connection that offered the greater potential in time saving and thus, in our design, also the greater variance. Commuters seemed to be dis- playing something analogous to Thaler and Johnson's (1990) "house-money" effect. Instead of gambling with previously won (i.e., "house") money, these commuters were gambling with newly won (1"house") time, leading them to prefer the higher-variance train for its upside potential. Keller (1985) who looked at commuting time choices in the gain domain obtained results similar to ours, as did Wehrung (1989) for alternatives involving pure gains in hypothetical business decisions involving risky financial outcomes made by experienced execu- tives in the oil and gas industry.
More important than the choice pattern itself for pur- poses of this paper was the fact that people's risk per- ception changed together with their choices. As a result, most people probably would not have perceived them- selves as any more risk seeking in the gain domain than in the loss domain. Instead, their definition of what con- stituted a "risky" train changed from losses to gains. Whereas a variance definition of risk seemed to describe judgments fairly well in the loss domain (85% of judg- ments indicated the higher-variance train as riskier),6 34% of judgments in the gain domain designated the lower-variance train as riskier. Lower variance, by def- inition, restricts the upside as well as the downside of choice alternatives. When the downside is not very painful, which is likely to be true in the gain domain, the upside of the high-variance trains may set an aspi- ration level for arrival times that the low-variance trains cannot match. A "risky" train in the gain domain, at least for some commuters, thus was one that did not offer that opportunity at substantial savings in com- muting time offered by the high-variance trains. The great majority (i.e., 184 out of 219 or 83%) of those risk
6 Other definitions of risk coincide with variance, e.g., the probability of unacceptably long commuting times covaries with variance.
MANAGEMENT SCIENCE/Vol. 43, No. 2, February 1997 133
This content downloaded from 128.59.222.12 on Thu, 04 Jun 2015 14:39:18 UTCAll use subject to JSTOR Terms and Conditions

WEBER AND MILLIMAN Relating Risk Perception to Risky Choice
judgments that designated the lower-variance train as more risky in the gain domain were accompanied by a preference for the higher-variance train, i.e., were risk averse by our perceived definition of risk attitudes. These commuters chose the train that they considered to be the smaller risk. However, if we had looked at only their choices (i.e., of the higher-variance train), these individuals would have been classified as risk seeking in the EU sense.
The pattern of results described in Table 3 continued to hold when the data were analyzed at the individual subject level. Table 2 provides a cross-classification of the perceived risk attitudes commuters showed in the gain and in the loss domain. Perceived risk preference was determined by classifying people by the results of a sign test conducted on the 12 item pairs in each do- main. People were labeled risk-averse (risk-seeking) only if they chose the option that they judged to be less (more) risky in 10 or more out of the 12 pairs, for a p- value of less than .05. Individuals with all intermediate choice patterns were labeled risk neutral.7 Table 2c shows that the percentage of individuals whose per- ceived risk preference was the same in both the loss and gain domain was 76%, compared to only 22% for risk preference defined in the EU sense and 37% for relative risk preference. In other words, risk preference when operationalized as perceived risk attitudes was two or three times as likely to be stable across the loss and the gain domain than when operationalized as EU risk at- titude or as relative risk attitude.
As shown in Table 1, EU risk attitude assessment and relative risk attitude assessment resulted in the same classification of risk attitude for only 39% of commuters in the gain domain and for 54% in the loss domain. The percentage of people for whom there was a three-way agreement in their EU, relative, and perceived classifi- cation of risk attitude was even smaller: 23% in the gain domain and 38% in the loss domain. Clearly, perceived
7 This classification scheme is conservative in assigning the labels risk- seeking and risk averse, but liberal in assigning people to the risk- neutral category. People in that category may either truly be risk- neutral or mildly risk-averse or risk-seeking. When respondents were classified less conservatively as risk-averse (risk-seeking) when they chose the option that they judged to be less (more) risky in more than 6 of 12 pairs, consistency across the gain and loss domain went up from 76% to 87%.
risk attitudes measure something different from both relative risk attitudes and EU risk attitudes. The fact that both the relative risk attitude measure and the per- ceived risk attitude measure lead to a different classifi- cation than the EU measure suggests that too many fac- tors are confounded in choice. The intention of Dyer and Sarin's (1982) relative risk attitude measure was to fac- tor nonlinearity in marginal value for the outcomes of risky choice alternatives out of people's choice.
The definition of perceived risk attitude put forth in this paper attempts to factor a different variable out of choice, namely risk perception. If risk perception varies across different situations or different domains, then it is theoretically possible that risk preference, defined as the tendency to select risky choice alternatives per- ceived to be more risky or less risky, could be a stable personality trait that does not vary across these situa- tions or domains.
The studies reviewed in ?3 and Experiment 1 dem- onstrated that perception of the riskiness of choice al- ternatives can differ between individuals and/or be- tween situations. However, most of these studies have either used simplified stimuli (mostly monetary gam- bles) or have examined static problems where people's risk perceptions are measured only in the context of sin- gle decisions. Even in those studies where people were asked to make judgments about the risk of multiple plays (e.g., Joag, Mowen and Gentry 1990), they did not receive feedback as to the outcome of previous deci- sions. And yet, as discussed in ?5, prior outcome history is another situational variable documented to lead to changes in choice behavior. Experiment 2 in ?6 inves- tigates whether such changes in choice in a dynamic decision environment that involves repeated decisions and continuous outcome feedback should be attributed to changes in risk perception, changes in risk preference, or both.
5. Effects of Task Success and Task Failure
Numerous studies have shown that decisions with risky or uncertain outcomes are affected by the outcomes of previous decisions. An important distinction to be made when examining the effect of outcome history on risky decisions is whether task performance is perceived to be determined by chance or by skill. Managers in
134 MANAGEMENT SCIENCE/Vol. 43, No. 2, February 1997
This content downloaded from 128.59.222.12 on Thu, 04 Jun 2015 14:39:18 UTCAll use subject to JSTOR Terms and Conditions

WEBER AND MILLIMAN Relating Risk Perception to Risky Choice
studies by MacCrimmon and Wehrung (1986) and Shapira (1986, summarized in March and Shapira 1987) made strong distinctions between "gambling" (i.e., de- cisions for which outcomes are determined by chance) and "risk taking" (i.e., decisions for which skill and in- formation are assumed to reduce uncertainty and influ- ence outcomes). While the outcomes of most real-world tasks are determined by a combination of chance and skill factors, most studies of the effects of outcome his- tory on risky decisions have tended to look at tasks in which outcomes were largely and obviously deter- mined by chance (e.g., a random device in a gameshow (Gertner 1993)).
Since people's reactions to prior task success and failure can be expected to differ in situations where the outcomes are perceived to be due to skill rather than chance, it is important to examine the effect of prior outcome history on risky decision tasks for which outcomes are determined by skill or by a mix- ture of skill and chance. Some studies of such tasks exist, for example, of stock market investment deci- sions (Andreassen 1990, M. Weber and Camerer 1992) or of racetrack betting (McGlothlin 1956). However, these studies have looked exclusively at the effects of prior task success or failure on choices, without also measuring risk perception or risk preference in any way other than that derived from the shape of the inferred utility functions. To fill these gaps in the lit- erature, we used a task (financial investment deci- sions) in Experiment 2 that experienced participants could be expected to see as partially skill-based. The study manipulated outcome history and measured the effects of investment success vs. failure not just on subsequent investment choices but also on the per- ceived riskiness of different investment alternatives as well as on the relationship between choice and risk perception, i.e., on perceived risk attitudes.
Task success or failure may affect subsequent deci- sions at different points of the decision process. One possible mediator of changes in choice are people's emotional reaction to success or failure. Maital, Filer and Simon (1986) provided both anecdotal and experi- mental evidence for the role of emotional reactions in financial markets. Since mood has been found to prime congruent thoughts or information (Bower 1981), one stage in which success- or failure-induced mood changes may affect choice is during information acqui-
sition. Use of different (mood-congruent) types of stock information, for example, may very well lead to differ- ent assessments of the riskiness of different stocks and thus to different investment choices.
6. Experiment 2: Repeated Financial Investment Decisions
To examine changes in risky choice, risk perception, and risk preference as the function of prior task success or failure, a decision environment is required that allows for repeated decision making and has a set of choice alternatives that is sufficiently large to manipulate ob- jective risk characteristics. Choice alternatives should be described on several dimensions that can be requested at wish, to make the task realistic and interesting as well as providing for a way to test our hypotheses about changes in information acquisition and processing style as a function of outcome feedback. Finally, the out- comes of the decisions need to be manipulable to result in a "success" or "failure" series without giving the im- pression that they are rigged.
The decision environment selected as satisfying these requirements was a personal-computer based financial investment task. Participants were told that they were piloting a new stockmarket simulation program and filled out an evaluation questionnaire about the simu- lation software at the end of the experiment. The cover story asked them to come to two investment sessions on different days, so that they would have enough ex- perience with the simulation to evaluate it. At the be- ginning of each session, investors were provided with an endowment of funds. For each of several investment periods within a session, their task was to choose be- tween six investment alternatives. Standard financial performance information about each stock could be ob- tained on request, one dimension at a time. When in- vestors indicated that they had sufficient information about all alternatives that they wished to consider, they were asked to invest all or some of their current assets (endowment plus previous wins minus previous losses) into one stock alternative. The computer program kept track of their information acquisition (i.e., the type and sequence of their information selections) and their final investment selections. Participants received information about the performance of their selected stock and the other (nonselected) stocks at the end of the current
MANAGEMENT SCIENCE/Vol. 43, No. 2, February 1997 135
This content downloaded from 128.59.222.12 on Thu, 04 Jun 2015 14:39:18 UTCAll use subject to JSTOR Terms and Conditions
WEBER AND MILLIMAN Relating Risk Perception to Risky Choice
investment period, before making another investment decision for the next investment period. In the "suc- cess" session, feedback over the set of ten investment periods was largely positive for the selected stock and negative for nonselected stocks; feedback over the set of ten investment periods during the "failure" session was the opposite. Investors took part in both sessions of the simulation so that the effect of success and failure could be assessed within-subjects, with the order of sessions counterbalanced.
The study addressed the following primary questions described in greater detail below: (1) Are stock choices different as the result of investment success vs. invest- ment failure? (2) Does the risk perception of stocks change as the result of investment success vs. invest- ment failure? (3) Are changes in choice related to changes in risk perception, so that perceived risk pref- erence is stable for a given investor, even though both perception and choice are changing?
(1) As mentioned earlier, we selected the prior out- come history manipulation for its documented effects on choice. Differences in choice between the two ses- sions were necessary to test our hypotheses about the root of such changes in either risk perception and/or risk preference. Some difference between the stock se- lection in the two sessions could be expected as the re- sult of objective differences in recent stock performance that were the unavoidable by-product of our success vs. failure manipulation. In addition however, there is a sizable literature on the overreaction of investors in fi- nancial markets (e.g., DeBondt and Thaler 1990, M. Weber and Camerer 1992) which predicted that we should see even larger differences in stock choices than were objectively justifiable.
(2) As also discussed above, one of the main hypoth- eses of this paper is that situational variables affect risk perception rather than inherent risk preference. In Ex- periment 1, risk perception was found to be different for risky prospects with positive outcomes than for the equivalent risky prospects with negative outcomes. In this experiment, we hypothesized that the manipulation of prior outcome history, another situational variable, would also affect risk perception.
(3) Based on the results of Experiment 1 and Weber & Bottom (1989), we hypothesized that the perceived risk attitude of a given investor would be the same in the two sessions, i.e., that risk preference as a stable per-
sonality trait would not be affected by prior outcome history.
6.1. Method
Participants. Participation in the study was solicited by advertisements posted around the Graduate School of Business at the University of Chicago, asking for peo- ple interested in and experienced with the stock market and money management. Twenty-two of the 24 respon- dents were MBA students with concentrations in fi- nance and / or economics. The two remaining subjects were doctoral students in economics. Take-home pay was partly fixed, and partly contingent on performance. Participants took about an hour to go through each of the two investment sessions; take-home pay ranged from $12 to $17 for the two sessions.
Procedure and Task Instructions. In each session, participants received an initial endowment of $100,000. They were free to request financial information about six stock investment alternatives, could invest all, part, or none of their endowment into one of those alterna- tives, and received stock performance feedback. This cy- cle repeated for ten investment periods. Any part of their endowment not invested into a stock in any given period stayed in a 5% per annum money-market ac- count. We restricted investors to selecting only one stock in each period, so that we could compare their choice to their risk perceptions and thus assess their per- ceived risk attitudes. By restricting choice to one stock, we could see whether a given investor had a tendency to select a stock that he or she considered either more or less risky than other stocks. Allowing investors to diversify their portfolio would have obscured the rela- tionship between their risk perceptions and their choices.
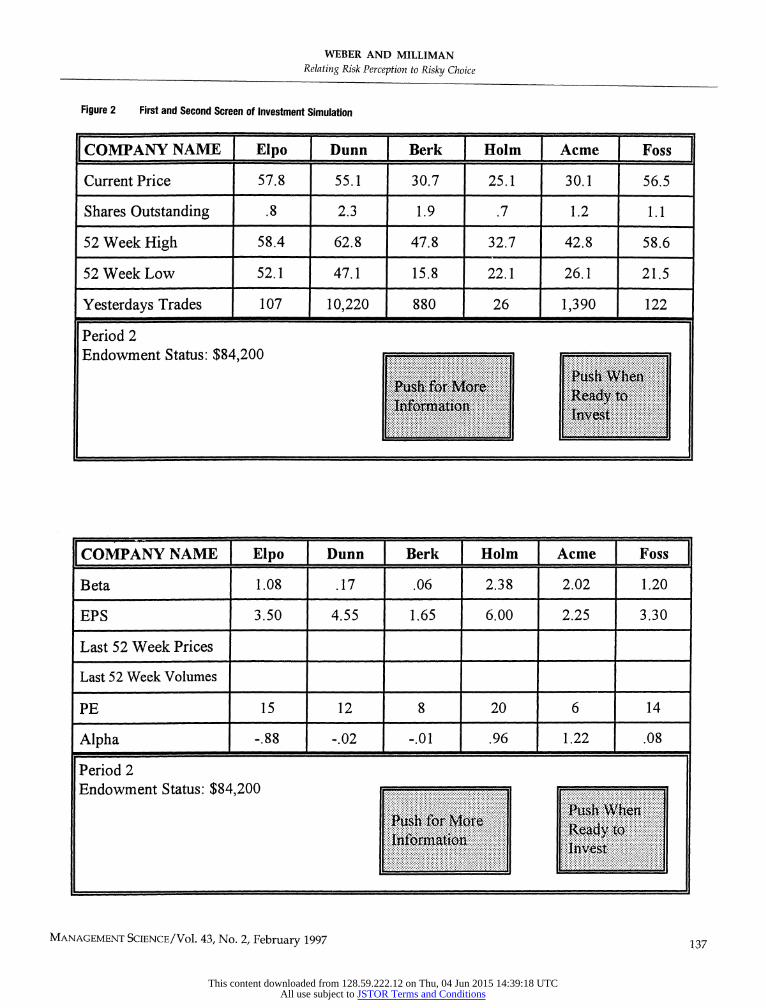
The first screen seen by investors is shown in the top half of Figure 2. Investors saw the displayed column and row headings with an otherwise blank matrix. The column headings are the names of six fictitious com- panies. The row headings are names of financial indi- cators commonly considered when analyzing the at- tractiveness of a corporation's stock. Since there were more information dimensions than could be displayed on a single screen, participants could switch to a second information screen, shown in the bottom half of Figure 2. The information dimensions and the values on those
136 MANAGEMENT SCIENCE/Vol. 43, No. 2, February 1997
This content downloaded from 128.59.222.12 on Thu, 04 Jun 2015 14:39:18 UTCAll use subject to JSTOR Terms and Conditions
WEBER AND MILLIMAN Relating Risk Perception to Risky Choice
Figure 2 First and Second Screen of Investment Simulation
COMPANY NAMEE Elpo Dunn Berk J IIolm Acme Foss
Current Price 57.8 55.1 30.7 25.1 30.1 56.5
Shares Outstanding .8 2.3 1.9 .7 1.2 1.1
52 WeekHigh 58.4 62.8 47.8 32.7 42.8 58.6
52 Week Low 52.1 47.1 15.8 22.1 26.1 21.5
Yesterdays Trades 107 10,220 880 26 1,390 122
Period 2 Endowment Status: $84,200
. . ,~~~~~~~~~~~~~~~~~. .. ....... ...
- l , ....~ ~ ~ ~ ~~~~~~~~~~~~~ .....
Sh f ... ......Wh .
COMPANY INAMME [Elpo Dunn___Berk Hoim JAcme Foss
Beta 1.08 .17 .06 2.38 2.02 1.20
EPS 3.50 4.55 1.65 6.00 2.25 3.30
Last 52 Week Prices
Last 52 Week Volumes
PE 15 12 8 20 6 14
Alpha | -.88 -.02 -.01 .96 1 1.22 1 .08
Period 2 Endowment Status: $84,200
............................................................ ...................................................... ................................. ................................. . ..................... M .
. . , ., M . . w .... .............. ... . ........ ..... ...... MANAGEMENTu ...C/ O ....
MANAGEMENT SCIENCE/Vol. 43, No. 2, February 1997 137~~~~~~~~~~~~~~~~~~~~~~~~~~~~~~~~~~~~..... ....
This content downloaded from 128.59.222.12 on Thu, 04 Jun 2015 14:39:18 UTCAll use subject to JSTOR Terms and Conditions

WEBER AND MILLIMAN Relating Risk Perception to Risky Choice
dimensions for the six companies are displayed in Fig- ure 2.
Participants were told to access as much or as little data as they desired. They were encouraged to acquire information and generally proceed as they would in a real investment situation. The lower left corner of the screen permanently displayed the investment period number and the current value of the endowment. A ses- sion consisted of ten periods, even though investors were told that the length was probabilistically deter- mined, varying between 8 and 15 periods. Participants were instructed that each investment period repre- sented a four week interval, and that stock returns would be computed accordingly by the simulation al- gorithm.
Investors were asked to judge the riskiness of each stock at the end of the first, third, sixth, and last period of each session. Judgments were to be made on a nu- merical rating scale that ranged from 0 ("not at all risky") to 100 ("extremely risky").
Investment Alternatives. The information provided about the six companies was modelled on information about typical corporations. Thus there were companies that resembled large blue chip corporations with low beta values and high earnings per share (e.g., Dunn), as well as companies that resembled small new ventures with high beta, low trades, and high price-to-earnings ratio (e.g., Holm).
The values that investors saw for a given stock changed only minimally from period to period for ten of the eleven performance dimensions. Stock price was the only dimension that changed significantly from one period to the next: price changes were manipulated to result in task success in one of the sessions that investors participated in, and task failure in the other session.8 To make the level of task success and failure comparable across investors, prices changed on a percentage basis for the stock that was selected, regardless of the identity of the company that was chosen. The percentage price changes for the selected stocks in a given time period ranged from -1 % to 8% during the success session and from +1% to -8% during the failure session.
8 In a pilot study, we used companies with different combinations of characteristics in the success and failure sessions, with results that were similar in all important aspects to the ones reported below.
6.2. Results
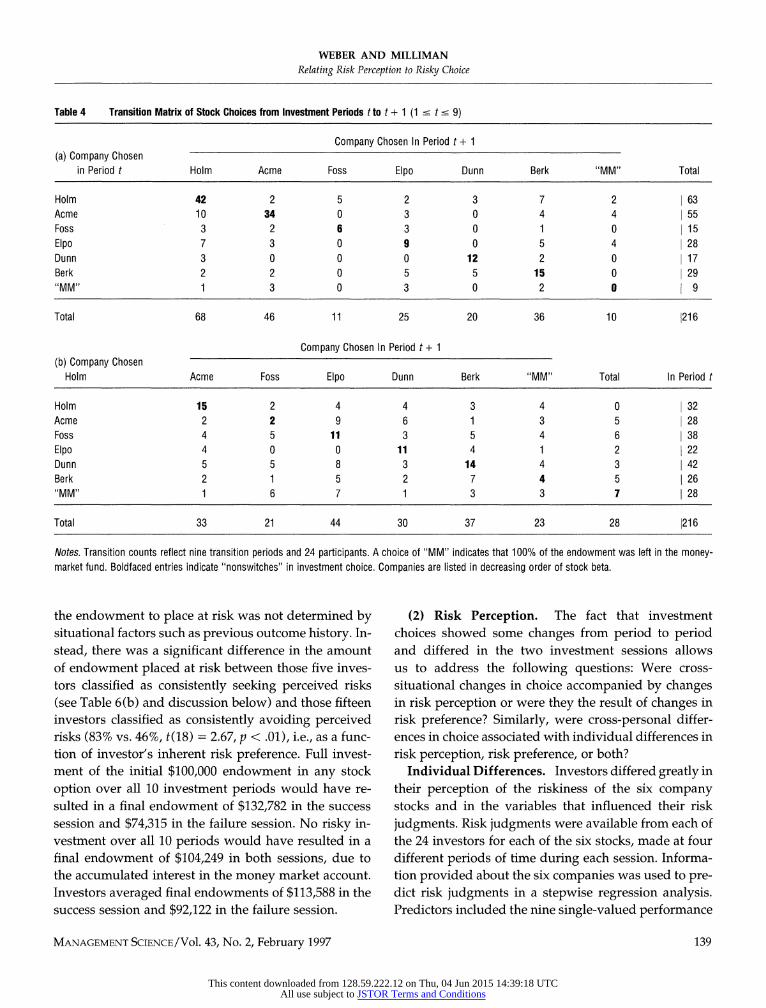
(1) Stock Choices. Investors' stock choices fre- quently changed from period to period, and choices dif- fered as a function of prior outcome history. Table 4 shows the transition matrix for stock choices in consec- utive time periods during the success and the failure session, respectively. Boldfaced entries show the num- ber of times the same investment option was chosen in periods t and t + 1 across the nine between-period tran- sitions and 24 investors. Adding the boldfaced entries shows that, during the success session, investors stayed with the same investment option for 118 of 216 transi- tions (i.e., 55% of the time), but during the failure ses- sion did so for only 64 of 216 transitions (i.e., 30% of the time). In other words, there was significantly more turn- over in stock in the failure session (z = 7.43, p < 0.0001, by binomial test). This was also true at the individual- subject level. Investors did not differ significantly with respect to turnover rates; all showed greater turnover for the failure session.
Even though investors differed in their stock choices, it is instructive to look at the group preference order for the six companies that can be derived from the marginal frequencies of choices across periods and investors. Ta- ble 4 shows the companies ordered by decreasing val- ues of their stock beta. The group preference order for companies in the success session, shown in the top por- tion of the table, followed this order closely. The two most preferred stocks, Holm and Acme, both have high values of beta. The preference order for the same com- panies in the failure session, shown in the bottom por- tion of Table 4, was quite different. In comparison to the success session, preference in the failure sessions was more uniformly distributed. The two stocks most pre- ferred in the failure session, Foss and Dunn, were the least preferred stocks in the success session, and both have relatively low beta values and average perfor- mance records.
There were' large individual differences in the per- centage of their endowment that investors placed into a risky stock instead of leaving it in the riskless money market. The percentage placed at risk ranged from 0% to 100% across investors (with a mean of 55%), but was not significantly different in the success vs. failure ses- sion, nor over the ten investment periods within each session. Thus it seems that the decision of how much of
138 MANAGEMENT SCIENCE/Vol. 43, No. 2, February 1997
This content downloaded from 128.59.222.12 on Thu, 04 Jun 2015 14:39:18 UTCAll use subject to JSTOR Terms and Conditions
WEBER AND MILLIMAN Relating Risk Perception to Risky Choice
Table 4 Transition Matrix of Stock Choices from Investment Periods t to t + 1 (1 s t s 9)
Company Chosen In Period t + 1 (a) Company Chosen
in Period t Holm Acme Foss Elpo Dunn Berk "MM" Total
Holm 42 2 5 2 3 7 2 63 Acme 10 34 0 3 0 4 4 55 Foss 3 2 6 3 0 1 0 15 Elpo 7 3 0 9 0 5 4 28 Dunn 3 0 0 0 12 2 0 17 Berk 2 2 0 5 5 15 0 29 "MM" 1 3 0 3 0 2 0 9
Total 68 46 11 25 20 36 10 1216
Company Chosen In Period t + 1 (b) Company Chosen
Holm Acme Foss Elpo Dunn Berk "MM" Total In Period t
Holm 15 2 4 4 3 4 0 32 Acme 2 2 9 6 1 3 5 28 Foss 4 5 11 3 5 4 6 38 Elpo 4 0 0 11 4 1 2 22 Dunn 5 5 8 3 14 4 3 42 Berk 2 1 5 2 7 4 5 26 "MM" 1 6 7 1 3 3 7 28
Total 33 21 44 30 37 23 28 216
Notes. Transition counts reflect nine transition periods and 24 participants. A choice of "MM" indicates that 100% of the endowment was left in the money- market fund. Boldfaced entries indicate "nonswitches" in investment choice. Companies are listed in decreasing order of stock beta.
the endowment to place at risk was not determined by situational factors such as previous outcome history. In- stead, there was a significant difference in the amount of endowment placed at risk between those five inves- tors classified as consistently seeking perceived risks (see Table 6(b) and discussion below) and those fifteen investors classified as consistently avoiding perceived risks (83% vs. 46%, t(18) = 2.67, p < .01), i.e., as a func- tion of investor's inherent risk preference. Full invest- ment of the initial $100,000 endowment in any stock option over all 10 investment periods would have re- sulted in a final endowment of $132,782 in the success session and $74,315 in the failure session. No risky in- vestment over all 10 periods would have resulted in a final endowment of $104,249 in both sessions, due to the accumulated interest in the money market account. Investors averaged final endowments of $113,588 in the success session and $92,122 in the failure session.
(2) Risk Perception. The fact that investment choices showed some changes from period to period and differed in the two investment sessions allows us to address the following questions: Were cross- situational changes in choice accompanied by changes in risk perception or were they the result of changes in risk preference? Similarly, were cross-personal differ- ences in choice associated with individual differences in risk perception, risk preference, or both?
Individual Differences. Investors differed greatly in their perception of the riskiness of the six company stocks and in the variables that influenced their risk judgments. Risk judgments were available from each of the 24 investors for each of the six stocks, made at four different periods of time during each session. Informa- tion provided about the six companies was used to pre- dict risk judgments in a stepwise regression analysis. Predictors included the nine single-valued performance
MANAGEMENT SCIENCE/Vol. 43, No. 2, February 1997 139
This content downloaded from 128.59.222.12 on Thu, 04 Jun 2015 14:39:18 UTCAll use subject to JSTOR Terms and Conditions

WEBER AND MILLIMAN Relating Risk Perception to Risky Choice
indicators shown in Figure 2, as well as the mean, stan- dard deviation, and range of prices and trade volumes that could be computed from the list of the last 52 weeks' prices and volumes.9 Since risk judgments were made at different investment periods in each session, the stock information operant during the period preced- ing the risk judgment was used to set the value of the predictor variables.
When the risk judgments of all 24 investors were combined in a single regression analysis, the best set of predictor variables accounted for only 18% of the over- all variance in the success session, and for only 13% of the variance in the failure session. In this group analy- sis, Beta and Range-of-Prices'0 were significant predic- tors of risk perception in the success session; Beta, P/ E-ratio, and Mean-of-Prices were significant predictors in the failure session. There were, however, large indi- vidual differences in the variables that determined in- vestors' perceptions of the risks of different stocks, con- firming the results reviewed in ?3 that risk perception is highly individualistic. When analyzed separately for each investor, the predictability of risk judgments went up dramatically. In individual-subject regressions of risk judgments, the best set of predictor variables ac- counted on average for 82% of the variance in the suc- cess and for 76% of the variance in the failure session,"1 with different predictor variables driving the risk per- ceptions of different investors. The correlation between people's subjective risk ratings and stock Beta, for ex- ample, ranged from 0.99 for one investor to -0.25 for another, with a median correlation of .48. Even though a larger number of objective variables determined the risk judgments for the failure session (on average 3.7 per investor) than for the success session (on average 2.8 per investor), they had less predictive power.
Effect of Outcome Feedback. Perceptions of the in- vestment risk of the six companies differed not only be-
' Inspection of investors' written notes showed that they tended to distill the list of price (and volume) information from the last 52 weeks down to some measure of average price (volume) and some measure of variability. Thus we added mean price (volume) as well as the range and standard deviation of price (volume) to the list of potential pre- dictor variables.
Range performed better than standard deviation.
Reported values of R2 are adjusted for the number of predictor vari- ables.
tween investors but also between sessions (i.e., as a function of outcome feedback), and within each session over investment periods. Table 5 shows the intercorre- lations between the risk judgments, across companies and investors, measured at the four different time pe- riods during each session. Risk judgments had the high- est correlation for adjacent judgment periods, and be- came less related the further apart the judgment peri- ods. Table 5 shows that risk judgments changed over investment periods, and that they changed more during the failure than the success session. To determine whether risk judgments changed above and beyond any changes attributable to changes in stock information across investment periods, we added judgment period as a (dummy-coded) variable to the best-fitting individual- investor regressions of risk judgments on objective in- formation predictors described in the last section. For ten of the 24 investors, judgment period significantly predicted investors' risk judgments in the success and / or the failure session above and beyond the effects of any changes in the objective stock information.
Insight Into Risk Judgments. At the end of each session, investors answered the questions: "What fac- tors did you consider when judging the perceived risk- iness of the investment alternatives?" and "Did your judgments change over time? If so, why?". Investors
Table 5 Correlations Between Risk Judgments for Six Companies at Different Judgment Periods
(a) Success Session
Risk Judgment In
Risk Judgment In Period 4 Period 7 Period 10
Period 1 0.52 0.51 0.33 Period 4 0.50 0.16 Period 7 0.44
(b) Failure Session
Risk Judgment In Period 4 Period 7 Period 10
Period 1 0.53 0.03 0.02 Period 4 0.36 0.33 Period 7 0.74
Notes. N = 144 per correlation, i.e., across 24 investors and six compa- nies. Critical values are r = 0.197 for p < 0.05 and r = 0.257 for p < 0.01.
140 MANAGEMENT SCIENCE/Vol. 43, No. 2, February 1997
This content downloaded from 128.59.222.12 on Thu, 04 Jun 2015 14:39:18 UTCAll use subject to JSTOR Terms and Conditions
WEBER AND MILLIMAN Relating Risk Perception to Risky Choice
showed reasonable insight into their risk perceptions. The variables that they listed as having influenced their risk judgments during the session generally showed a partial (and for some, sizable) overlap with the vari- ables identified as predictors by the regression analysis. The most common variables mentioned as influences (i.e., stock beta, the range in price over the last 52 weeks, P/E ratio, and some measure of trading volume) were also the most common predictor variables in the indi- vidual regression models. Many of the investors whose risk judgment regressions showed significant judgment period effects above and beyond the effect of changes in the stock information across periods, mentioned in their self-reports that their risk perception changed over time. They frequently explained such changes as the re- sult of updating of the provided information with their own observations of price trends, and as the result of their reaction to losses.
(3) Perceived Risk Attitudes. The perceived risk at- titudes of each investor in each of the two sessions were assessed by a poirnt-biserial correlation between his or her risk judgments for the six companies collected at the four different judgment periods in the session and his or her choices in the period immediately following the risk judgments. Risk judgments took values from 0 to 100 (0 = no risk at all; 100 = extremely risky); choices were dummy-coded (1 = chosen; 0 = not chosen). A positive correlation thus indicates perceived risk seek- ing, i.e., the tendency to choose companies perceived to be riskier. A negative correlation correspondingly in- dicates perceived risk aversion. Classification of indi- viduals into perceived risk-seekers or risk-avoiders was done either conservatively, using statistical significance of the correlations at the 0.05 level (r = +.344) as a clas- sification criterion (Scheme 1), or more leniently (Scheme 2). By Scheme 1, only investors with significant negative correlations (which ranged from -0.38 to -0.63) were classified as perceived risk-averse, and only investors with significant positive correlations (which ranged from 0.37 to 0.57) as perceived risk- seeking. Individuals with correlations between -0.344 and +0.344 were classified as risk neutral. By the more lenient second classification scheme, all investors with a positive (negative) correlation were classified as per- ceived risk-seeking (risk-averse).
Table 6 shows the relationship between investors' perceived risk attitudes in the success and the failure
session for both classification schemes. Even though choices as well as risk perceptions differed substantially in the two sessions, risk preference inferred by compar- ing choice to risk perception remained unchanged across the two sessions for 19 or 20 of the 24 investors, depending on the classification scheme. As shown in Table 6(b), fifteen investors were perceived risk averse in both sessions, i.e., tended to choose stocks they rated low in risk, whereas five investors were perceived risk seeking in both sessions, i.e., tended to choose stocks they rated high in risk. Thus 83% of participants showed the same perceived risk attitude in both sessions, even though their choices and risk perceptions varied sub- stantially in response to the different outcome feed- back in the two sessions. Just as in Experiment 1, the definition of perceived risk attitude seems to restore some cross-situational stability to the construct of risk preference.
6.3. Discussion The answer to the first two questions addressed by Ex- periment 2 was clearly affirmative. Both stock choices and investors' risk perception of stocks changed as the result of outcome feedback (i.e., investment success vs. failure). Even though we attempted to keep stock infor- mation the same as much as possible in the two condi- tions, the different outcome feedback that investors re- ceived in the two sessions made the information about the six companies different in salient ways. Thus some changes in risk perception and choice clearly were war- ranted. On the other hand, the amount of turnover in stock choices and the magnitude of changes in risk per- ception as the result of changes in performance during a single investment period (equivalent to four weeks) despite other performance information based on much longer observation periods probably can be considered to be an overreaction. Task failure resulted in signifi- cantly more stock turnover than task success. Investors' stock selections were consistent with the following sim- ple decision rule: If it works, stay; if it doesn't work, switch.
At any rate, the question of whether changes in risk perception and/or choice were normatively justified was not the main focus of our investigation. Instead, we were primarily interested in the third question, namely whether changes in choice and risk perception were re- lated to each other such that investors may have had
MANAGEMENT SCIENCE/Vol. 43, No. 2, February 1997 141
This content downloaded from 128.59.222.12 on Thu, 04 Jun 2015 14:39:18 UTCAll use subject to JSTOR Terms and Conditions
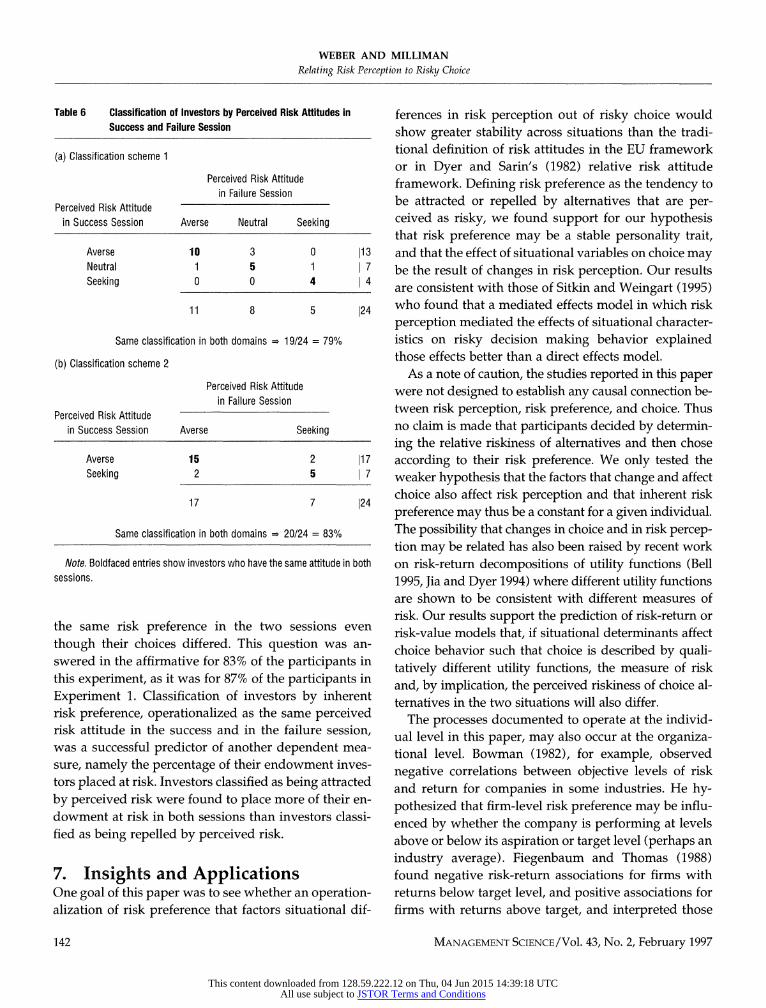
WEBER AND MILLIMAN Relating Risk Perception to Risky Choice
Table 6 Classification of Investors by Perceived Risk Attitudes in Success and Failure Session
(a) Classification scheme 1
Perceived Risk Attitude in Failure Session
Perceived Risk Attitude in Success Session Averse Neutral Seeking
Averse 10 3 0 113 Neutral 1 5 1 7 Seeking 0 0 4 4
11 8 5 124
Same classification in both domains > 19/24 = 79%
(b) Classification scheme 2
Perceived Risk Attitude in Failure Session
Perceived Risk Attitude in Success Session Averse Seeking
Averse 15 2 117 Seeking 2 5 1 7
17 7 124
Same classification in both domains > 20/24 = 83%
Note. Boldfaced entries show investors who have the same attitude in both sessions.
the same risk preference in the two sessions even though their choices differed. This question was an- swered in the affirmative for 83% of the participants in this experiment, as it was for 87% of the participants in Experiment 1. Classification of investors by inherent risk preference, operationalized as the same perceived risk attitude in the success and in the failure session, was a successful predictor of another dependent mea- sure, namely the percentage of their endowment inves- tors placed at risk. Investors classified as being attracted by perceived risk were found to place more of their en- dowment at risk in both sessions than investors classi- fied as being repelled by perceived risk.
7. Insights and Applications One goal of this paper was to see whether an operation- alization of risk preference that factors situational dif-
ferences in risk perception out of risky choice would show greater stability across situations than the tradi- tional definition of risk attitudes in the EU framework or in Dyer and Sarin's (1982) relative risk attitude framework. Defining risk preference as the tendency to be attracted or repelled by alternatives that are per- ceived as risky, we found support for our hypothesis that risk preference may be a stable personality trait, and that the effect of situational variables on choice may be the result of changes in risk perception. Our results are consistent with those of Sitkin and Weingart (1995) who found that a mediated effects model in which risk perception mediated the effects of situational character- istics on risky decision making behavior explained those effects better than a direct effects model.
As a note of caution, the studies reported in this paper were not designed to establish any causal connection be- tween risk perception, risk preference, and choice. Thus no claim is made that participants decided by determin- ing the relative riskiness of alternatives and then chose according to their risk preference. We only tested the weaker hypothesis that the factors that change and affect choice also affect risk perception and that inherent risk preference may thus be a constant for a given individual. The possibility that changes in choice and in risk percep- tion may be related has also been raised by recent work on risk-return decompositions of utility functions (Bell 1995, Jia and Dyer 1994) where different utility functions are shown to be consistent with different measures of risk. Our results support the prediction of risk-return or risk-value models that, if situational determinants affect choice behavior such that choice is described by quali- tatively different utility functions, the measure of risk and, by implication, the perceived riskiness of choice al- ternatives in the two situations will also differ.
The processes documented to operate at the individ- ual level in this paper, may also occur at the organiza- tional level. Bowman (1982), for example, observed negative correlations between objective levels of risk and return for companies in some industries. He hy- pothesized that firm-level risk preference may be influ- enced by whether the company is performing at levels above or below its aspiration or target level (perhaps an industry average). Fiegenbaum and Thomas (1988) found negative risk-return associations for firms with returns below target level, and positive associations for firms with returns above target, and interpreted those
142 MANAGEMENT SCIENCE/Vol. 43, No. 2, February 1997
This content downloaded from 128.59.222.12 on Thu, 04 Jun 2015 14:39:18 UTCAll use subject to JSTOR Terms and Conditions
WEBER AND MILLIMAN Relating Risk Perception to Risky Choice
results as risk-seeking by troubled firms. The results of Experiment 2 suggest a possible alternative interpreta- tion of such data in terms of organizational changes in risk perception as firms get into trouble.
As discussed earlier, this paper makes no claim about the "superiority" of any measure of risk preference. Our results suggest, however, that the three definitions of risk attitude measure different constructs. Risk attitudes in the EU framework simply describe choice patterns. Dyer and Sarin's (1982) relative risk attitudes, on the other hand, measure people's attitude towards outcomes that occur with uncertainty rather than for sure and thus could be called uncertainty attitudes. Perceived risk attitudes, fi- nally, measure people's tendency to be attracted or re- pelled by alternatives that are perceived to be risky.
The increase in cross-situational stability in risk prefer- ence when measured by perceived risk attitude comes at the price of having to know how a given individuals in a particular situation perceives the riskiness of choice alter- natives. Thus the factors that change risk perception as well as risky choice need to be further investigated. Vari- ous authors have investigated changes in choice behavior as the result of changes in aspiration levels (e.g., Lopes 1987; March 1988). March and Shapira (1992) provide an elegant set of random walk models that describe people's risk attitudes in the EU sense as adaptive to situational factors that influence attention to different reference points. As we showed in this paper, similar processes seem to affect people's perception of the riskiness of choice alternatives. Yet, reference point and aspiration level ef- fects seem to be hard to predict ex-ante. Thaler and John- son (1990) and our Experiment 1 found risk-seeking in the EU sense as the result of playing with "house-money" or "house-time," whereas Gertner (1993) found little evi- dence of any effect of prior winnings on contestants' will- ingness to take risks in his analysis of actual gambling decisions on a television game show. Adjustments in ref- erence point seem to be somewhat unpredictable. If com- muters in Experiment 1 had started to experience the time savings realized by the trains in the gain domain, their reference point might have shifted from their current status quo to a new shorter reference point, and their risk perception as well as choice between trains might have changed accordingly.
For purposes of decision aiding or remediation of suboptimal choice behavior it is crucial to know which of these explanations lies at the basis of choice. If risk
perceptions are the driving force, then remedial steps should involve informational, more cognitive interven- tions, aimed at a more realistic risk perception. If risk attitudes are the driving force, then intervention needs to target people's emotional responses. Our results and those of Cooper et al. (1988) and Sitkin and Weingart (1995) suggest that it may be most effective to change risky choice behavior by working on people's percep- tion of the riskiness of different choice alternatives. In this context, our observation that investors had rela- tively good insight into the determinants of their risk judgments is an encouraging sign. Conscious awareness of its determinants makes risk perception more ame- nable to cognitive intervention. A variety of procedures exist that allow companies to formulate a corporate util- ity function on a relevant outcome dimension, with the goal of coordinating the risky decisions of individual managers with the more general risk policies of the or- ganization (e.g., Spetzler 1968). It is not difficult to en- vision extensions of these procedures that would do the same for a common corporate risk perception."2
12 This research was supported by National Science Foundation grant SES-8910211 and by the James S. Kemper Foundation Faculty Research Fund at the Graduate School of Business, University of Chicago. We thank Linda Hynan, Veronique D'Estaintot, and Soyoung Kwon for their assistance with data collection, Sema Barlas for her assistance with data analysis, and Greg Fischer, Barbara Mellers, Tom Wallsten, Martin Weber, and three anonymous reviewers for helpful sugges- tions and comments on the manuscript.
References Andreassen, P. B., "Judgmental Extrapolation and Market Overreac-
tion: On the Use and Disuse of Information," J. Behavioral Decision Making, 3 (1990), 153-174.
Arrow, K. J., Essays in the Theory of Risk Bearing, Markham, Chicago, IL, 1971.
Barron, F. H., "Polynomial Psychophysics of Risk for Selected Business Faculty," Acta Psychologica, 40 (1976), 127-137.
Bell, D. E., "Risk, Return, and Utility," Management Sci., 41 (1995), 23- 30.
Bottom, W. K., "Adaptive Reference Points in Integrative Bargaining," in K. Borcherding, 0. I. Larichev, and D. M. Messick (Eds.), Con- temporary Issues in Decision Making, Elsevier Science Publishers, Netherlands, 1990.
Bower, G. H., "Mood and Memory," American Psychologist, 36 (1981), 129-148.
Bowman, E. H., "Risk Taking by Troubled Firms," Sloan Management Rev., 1982, 33-42.
Brockhaus, R. H., "The Psychology of the Entrepreneur," in C. A. Kent, D. L. Sexton, and K. G. Vesper (Eds.), The Encyclopedia of Entre- preneurship, Prentice Hall, Englewood Cliffs, NJ, 1982.
MANAGEMENT SCIENCE/Vol. 43, No. 2, February 1997 143
This content downloaded from 128.59.222.12 on Thu, 04 Jun 2015 14:39:18 UTCAll use subject to JSTOR Terms and Conditions

WEBER AND MILLIMAN Relating Risk Perception to Risky Choice
Cooper, A. C., C. Y. Woo, and W. C. Dunkelberg, "Entrepreneurs' Per- ceived Chances for Success," J. Business Venturing, 3 (1988), 97-108.
DeBondt, W. F. M. and R. H. Thaler, "Stock Market Volatility: Do Security Analysts Overreact?" AEA Papers and Proceedings, 80 (1990), 52-57.
Dyer, J. S. and R. K. Sarin, "Relative Risk Aversion," Management Sci., 28 (1982), 8.
Gertner, R., "Game Shows and Economic Behavior: Risk-taking on "Card Sharks," Quarterly J. Economics, 1993, 507-521.
Hanson, S. O., "Dimensions of Risk," Risk Analysis, 9 (1989), 107-112. Hausch, D. B., W. T. Ziemba, and M. Rubinstein, "Efficiency of the Market
for Racetrack Betting," Management Sci., 27 (1981), 1435-1452. Henderson, J. C. and P. C. Nutt, "The Influence of Decision Style on
Decision Making Behavior," Management Sci., 26 (1980), 371-386. Jia, J. and J. S. Dyer, "A Standard Measure of Risk and Risk-value
Models," Working Paper, University of Texas at Austin, 1994. Joag, S. G., J. C. Mowen, and J. W. Gentry, "Risk Perception in a Sim-
ulated Industrial Purchasing Task: The Effects of Single vs. Mul- tiple Play," J. Behavioral Decision Making, 3 (1990), 91-108.
Kahneman, D. and A. Tversky, "Prospect Theory: An Analysis of De- cisions Under Risk," Econometrica, 47 (1979), 263-291.
Keller, L. R., "An Empirical Investigation of Relative Risk Aversion," IEEE Trans. Systems, Man, and Cybernetics, SMC-15 (1985), 475-482.
Leclerc, F., B. H. Schmitt, and L. Dube, "Waiting Time and Decision Mak- ing: Is Time Like Money?" J. Consumer Res., 22 (1995), 110-119.
Levy, H. and H. Markowitz, "Approximating Expected Utility by a Function of Mean and Variance," American Economic Rev., 69 (1979), 308-317.
Lopes, L. L., "Between Hope and Fear: The Psychology of Risk," Ad- vances in Experimental Social Psychology, 20 (1987), 255-295.
Luce, R. D. and P. C. Fishburn, "Rank- and Sign-dependent Linear Utility Models for Finite First-order Gambles," J. Risk and Uncer- tainty, 4 (1991), 29-59.
MacCrimmon, K. R. and D. A. Wehrung, Taking Risks: The Management of Uncertainty, Free Press, New York, 1986. and , "Characteristics of Risk Taking Executives," Manage-
ment Sci., 36 (1990), 422-435. Maital, S., R. Filer, and J. Simon, "What Do People Bring to the Stock
Market (Besides Money)? The Economic Psychology of Stock Market Behavior," in B. Gilad and S. Kaish (Eds.), Handbook of Behavioral Economics: Behavioral Macroeconomics, Vol. B, JAI Press, Greenwich, CT, 1986, 273-307.
March, J. G., "Variable Risk Preferences and Adaptive Aspirations," J. Economic Behavior and Organization, 9 (1988), 5-24. and Z. Shapira, "Managerial Perspectives on Risk and Risk Tak- ing," Management Sci., 33 (1987), 1404-1418. and , "Variable Risk Preferences and the Focus of Attention," Psychological Review, 99 (1992), 172-183.
McCord, M. R. and R. de Neufville, "Lottery Equivalents: Reduction of the Certainty Effect Problem in Utility Assessment," Manage- ment Sci., 32 (1986), 56-60.
McGlothlin, W. H., "Stability of Choices Among Uncertain Alterna- tives," American J. Psychology, 69 (1956), 604-615.
Payne, J. W., D. J. Laughhann, and R. L. Crum, "Translations of Gam- bles and Aspiration Effects in Risky Choice Behavior," Manage- ment Sci., 26 (1980), 1039-1060.
Pratt, J. W., "Risk Aversion in the Small and in the Large," Economet- rica, 32 (1964), 122-136.
Sarin, R. K. and M. Weber, "Risk-value Models." European J. Oper. Res., 70 (1993), 135-149.
Schoemaker, P. J. H., "Are Risk-preferences Related Across Payoff Do- mains and Response Modes?" Management Sci., 36 (1990), 1451- 1463.
, "Determinants of Risk-taking: Behavioral and Economic Views,"
J. Risk and Uncertainty, 6 (1993), 49-73. Schurr, P. H., "Effects of Gain and Loss Decision Frame on Risky
Purchase Negotiations," J. Applied Psychology, 72 (1987), 351-358.
Shapira, Z., "Risk in Managerial Decision Making," Working Paper, Hebrew University, 1986.
Sitkin, S. B. and A. L. Pablo, "Reconceptualizing the Determinants of Risk Behavior," Acad. Management Rev., 17 (1992), 9-38. and L. R. Weingart, "Determinants of Risky Decision Making
Behavior: A Test of the Mediating Role of Risk Perceptions and Risk Propensity," Acad. Management J., 38 (1995), 1573-1592.
Slovic, P., "Assessment of Risk Taking Behavior," Psychological Bulle- tin, 61 (1964), 330-333.
- , "The Relative Influence of Probabilities and Payoffs upon Per- ceived Risk of a Gamble," Psychonomic Sci., 9 (1967), 223-224. , "Perception of Risk," Science, 236 (1987), 280-285.
Spetzler, C. S., "The Development of a Corporate Risk Policy for Cap- ital Investment Decisions," IEEE Trans. Systems Science and Cyber- netics, SCC-4 (1968), 279-300.
Swalm, R. O., "Utility Theory: Insights into Risk Taking," Harvard Business Review, 44 (1966), 123-136.
Thaler, R. H., "Towards a Positive Theory of Consumer Choice," J. Economic Behavior and Organization, 1 (1980), 39-60. and E. J. Johnson, "Gambling with the House Money and Trying to Break Even: The Effects of Prior Outcomes on Risky Choice," Management Sci., 36 (1990), 643-660.
Tversky, A. and D. Kahneman, "Advances in Prospect Theory: Cu- mulative Representation of Uncertainty," J. Risk and Uncertainty, 5 (1992), 297-323.
Weber, E. U., "A Descriptive Measure of Risk," Acta Psychologica, 69 (1988), 185-203. , C. Anderson, and M. H. Birnbaum, "A Theory of Perceived Risk and Attractiveness," Organizational Behavior and Human Decision Processes, 52 (1992), 492-523. and W. K. Bottom, "Axiomatic Measures of Perceived Risk: Some Tests and Extensions," J. Behavioral Decision Making, 2 (1989), 113-131. and , "An Empirical Evaluation of the Transitivity, Mono-
tonicity, Accounting, and Conjoint Axioms for Perceived Risk," Organizational Behavior and Human Decision Processes, 45 (1990), 253-276.
Weber, M. and C. Camerer, "The Disposition Effect in Securities Trad- ing: An Experimental Analysis," Working Paper, 1992.
Accepted by Gregory W. Fischer; received March 10, 1994. This paper has been with the authors 9 months for 1 revision.
144 MANAGEMENT SCIENCE/VOl. 43, No. 2, February 1997
This content downloaded from 128.59.222.12 on Thu, 04 Jun 2015 14:39:18 UTCAll use subject to JSTOR Terms and Conditions