Perception of changes in the cost of living
11
313 PERCEPTIOti OF CHANGES IN THE COST OF LIVING Received Xl+ 1 I. 1984. ~~crpted July 30. lYX4 .A rcccnt scrics of cxpcrinicnts undcrtakcn by W agcnaar and his co- \sxxkcrs hax dtx~onstratcd that exponential growth i5 systematically mispcrccivd (Wagcnx~r and Sagaria 1975: W agcnaar and Timmcrs 197X. 1970: W agcnaar 1982). In these cxpcrinicnts. suhjccts wcrc prc- sc~itctl Lvith short series of cxponcntially increasing numhcrs. gcncxatcd from the gcncral equation j’ = UC>“’ + C, II = I, 2.. . . They wart’ in- formd that the scrics rcprcsentcd observations of some real-life proctxs and dxd to cstimatc the next numhcr in the scrics. The results of the expcrinicnt.\ diowccl ;l consistent iln~erestimation of the number, rcla- tivc to that cxptxtcd from nunicricnl knowleclgc of ai txponcntial stxcs. This unciercstimation. according to Wngcnaar, has been char- xtcriscd by. and is the conscqucncc of, uncl~rc.\timation of the expo- I) I674x70/XJ,‘S? 00 1 IYXJ. 1:lw.w Sc~cncc Puhll4kzr\ B.V (Norrh-I I~~ll,m~l)
-
Upload
simon-kemp -
Category
Documents
-
view
213 -
download
1
Transcript of Perception of changes in the cost of living

313
PERCEPTIOti OF CHANGES IN THE COST OF LIVING
Received Xl+ 1 I. 1984. ~~crpted July 30. lYX4
.A rcccnt scrics of cxpcrinicnts undcrtakcn by Wagcnaar and his co-
\sxxkcrs hax dtx~onstratcd that exponential growth i5 systematically
mispcrccivd (Wagcnx~r and Sagaria 1975: Wagcnaar and Timmcrs
197X. 1970: Wagcnaar 1982). In these cxpcrinicnts. suhjccts wcrc prc-
sc~itctl Lvith short series of cxponcntially increasing numhcrs. gcncxatcd
from the gcncral equation j’ = UC>“’ + C, II = I, 2.. . . They wart’ in-
formd that the scrics rcprcsentcd observations of some real-life proctxs
and dxd to cstimatc the next numhcr in the scrics. The results of the
expcrinicnt.\ diowccl ;l consistent iln~erestimation of the number, rcla-
tivc to that cxptxtcd from nunicricnl knowleclgc of ai txponcntial
stxcs. This unciercstimation. according to Wngcnaar, has been char-
xtcriscd by. and is the conscqucncc of, uncl~rc.\timation of the expo-
I) I674x70/XJ,‘S? 00 1 IYXJ. 1:lw.w Sc~cncc Puhll4kzr\ B.V (Norrh-I I~~ll,m~l)
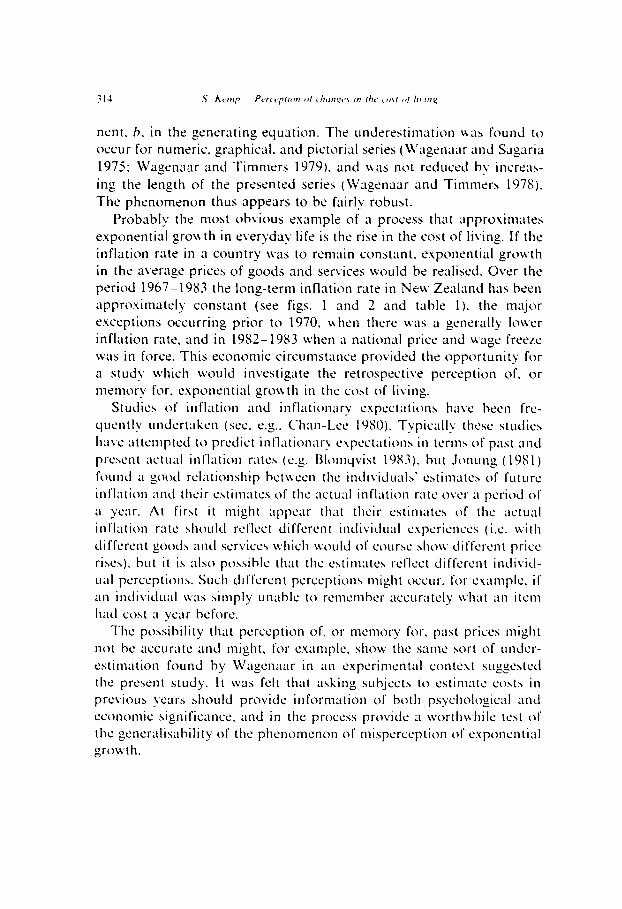
nent. h. in the generating equation. The underestim~tinn ~%a found to occur for numeric. graphical. and pictorial series (U’agenaar and Sqaria 1975: Wagen;jtar and Timmers 1979). and \\as not reduced by increa- ing the length of the presented series (Wagenaar and Timmers 1978). The phenomenon thus appears to be fairly robust.
Probably the mat obvious example of a process that approximates exponential gro\s th in everyday life is the rise in the cost of living. If the
inflation rate in a country kens to remain constant. exponential gwvth in the average prices of goods and seri,ices uould be realised. Over the period 1967-1933 the long-term inflation rate in New Zealand has been approximately constant (see figs. 1 and 2 and table 1). the major exceptions occurring prior to 1970. \\hen there IV;IS a generally Imvcr
inflation rate. and in 1982-1983 when a national price and wage freeze ~~3s in force. This economic circumstance provided the opportunity for
n studv which ww~ld investigate the retrospective perception of. or
nieniory for. cxponaitial gro\vth in the cost 0f living.
Studica of inflation and inflationary espcctations ha\12 hwn fre-
qucntly undcrt;iken (see. e.g.. Chnn-Lee 19SO). Typically these studica
have atteniptcd to prctlict inflatiomiry c\pcctations in tcrnis of past and
prcxcnt actual inflation rata (e.g. I3lomqvist 19S3). but .Icmitng (1951)
found ;i gc)od relationship hct\vccn the indi\~idii:rla’ t‘stimatcx of future
inflation and their chtimatcs c>f the actual inflation rate over ;i pcricd 01
;i year. At firat it might appear that their estiniatc5 of the actual inflation rate should rcflcct diffcrcnt individual cspcricnccs (i.c. Lvith
diffcrcnt good5 and scrvica kvhich \vcwld of court 5hou Jiffc‘rcnt price
rich). but it is also poasiblc that the atinlata rcflcct diffcrcnt intlivitl-
vial pcrccption5. Such dlffcrcnt pcrccption5 might occur. for cuamplc, il
an individual \v;~s simply un;tblc to rcmcmbcr accurately l\,hat an item
h:ltl cost ;I year bcforc.
The possibility that pcrccption of. or mcnwry for. past prices might
not bc accurate and might, for example. show the sanw sort of unclcr-
estimation found by Wagtmaar in an experimental contt’xt suggcstccl
the present study. It was felt that asking subjects to estimate costs in
previous years shouIcl provide information of both psychological and
ccononiic significance. and in the process provide a \vorth\\,hilc test of
the gcneralisability of the phenomenon of misperception of exponential
growth.

315
Alethod
122 subjects were interviwed in their wvn homes in the third quarter of
1983. Subjects Lvert: obtained by random sampling methods in three
urban electorates in the Christchurch area that \vere believed to provide
a reasonable range of age and class groupings. Subjects were chosen
subject to the requirement of bein, 0 over thirty wars of age at the time _ _ of the interview and ha\ing continuously resided in New Zealand
(excluding short trips abroad) for sixteen years or more.
The personal information collected suggests that the sample was
fairly representative of the Christchurch population aged over 30. The
sample contained 53 males and 69 females varving in age from 30 to
over 80. 96 of the 127 subjects were married. Information on the
rtxpondents‘ incomes, occuputions, education and political party sup-
ported show no marked deviation from NW Zealand norms, and the
differences kvhich appcnr (e.g. 19% of the sample rcceivcd their highest
cducationnl qualification at primary school; 43 x of the sampk vntlxi
for t tic major oppk tion party, 36Y for the governing party) arc
consistait with the age group and xc;I sampled.
All suhjccts bvcrc intcrvkvcd cx-ally from an intcrvicw sclied~~lc.
Sub_jccts iicrc not pcrmittcd to view the quchtionnairc while king
intcrvic\vcd; rc.4ponscb wwc rccordcd by the intcrvictvcr at the time.
Intcrviws. all of which wcrc: conducted by the s;~nic intcrviavcr.
typically I;i~tccl thirty minutes.
Ail inkrvicws followed ;I wt format \.chich was cltltwiiined by the
structurt’ of the schedule. The major part of the schcdulc consisted ol
questions dcsignctd to asses.\ the subject’s pcrccption of inflation and
the rising cost of living. Thcsc questions \vcrc of four types:
(I) Suppose you ivish to buy something that cost.4 $1000 today. How
rn~~cli cl0 ycu think it ww_~lcl hve cost . . . year(b) ago. that is in
19...
(7) As for 1. but the amount was $10.
(3) Imagine that this is . . . year(s) ago. that is, in 19.. . Imagine you

bought something for $100 then. How much do you think. you
would pay for the same thing toduv?
(4) What do you think the aterage annual rate of inflation has been
over the past . . . year(s)?
Eight variations of each question type were asked with responses to
time periods of one. t\vo, four. six. eight. ten. thirteen, and sixteen >ears
requested. (Longer time periods were not used because New Zealand
had a different currency prior to 1967.) All variants of each question
type were asked in one block in randomised orders that were different
for each question type and subject.
In the interests of brevity the four different question types are
referred to below as $1000 questions. $10 questions. $100 questions and
inflation rate questions. The first three types of questions are also
referred to as costs questions.
Before any of the inflation perception questions were asked subjects
were instructed to give their ‘general view of costs and prices’ and not
to try to remember \vhat they paid for specific things. They were told
that the study was not a test of their accuracy but rather they were to
rn:tke ‘rough. quick estimates’. Requests for personal information (e.g.
age, marital status, household income) were interspcrscd between ques-
(ions of tliffcrcnt types. so as to try to mininiisc the influence of the
previous block of questions. Before hcginning each block subjects Lvert’
reminded of lhc instructions.
In addition to the perso~~al information and the four types of
inflation pcrccption questions. subjects wet-c further asked t\vo qucs-
Lion5 relating to inflation. The first a&cd subject:, to rate the impact of
inflation and rising prices on them personally on a seven-point scale
ranging from ’ very unfavourablc’ to ’ very favourahlc’. The second (and
the la.4t question) asked ‘If ~‘e say the annual rate of inflation is 108
what do you interpret this as meaning?’ I<~spo~xes were scored from 1 _ reasonably accurate answer - to 3 - irrelevant or incorrect ans\\‘er.
Figs. 1 and 2 show the median answers to the $1000, $10. and SlOO
questions as a function of year. Owing to occasional missing and ‘don’t
kno\v’ rcsponscs, points are not generally based on the same number of

respondents: the number of missing cxes hourver ih small and ranges from a minimum of zero to a maximum of 17. The figures also show the actual increase in costs based on movements in the New Zealand

Cnnmmer Price Index (all group.41 in that periad and rcfcrrai 1~3 the
Septenitxr 19S3 quarter (Snurct:: Ktw Zealand hl~~nth~) Abstract of
Statistic). It is dear from the figures that there is ;I general undc’rexti-
rnation of the extent to u hich coats have risen o\w the period. one
which increases as the time period lengthens.
Fig. 3 shws the same median data as figs. 1 and 2 plotted on a
lngprd scale apainat the (also lagptxi) real chmipex in cmts. The figure
also shwvs t\vo of the lines of hot fit. that relating to $10 quot~ons
ha\ing been nmittsci since it ia \w-> similar to the $1000 clueticmh line.
Lines of bat fit were calculated mitti Ieast squart’s methods using nine
point5 for txch question type. Cc~rrelation wefficicnta (r ) and line
slopes (II) fnr the three sets of data art’: SlOOO questinns. I’ = 0.9s.
II = 0.59: $10 questionk r = 0.98. II = 0.60; SlOO quc5tinn5. I’ = 0.9s.
II = 0.46. Theac results sugpt that the data arc reaaonahly ~cell dc-
scribed b! ;I po\\cr Iaw of the form:
Perceived Coat = :I ( Actual Coat)“.
100 200 500 1000 Real Costs (from NZCPI)($)

u hose exponent. II. is provided by the line slopes on log-axes and .-l is a
constant. It should be remarked that the form of analysis carried out
here is that commonly used in magnitude estimation experiments in
perceptual and social psychology suggested by Stevens (1957. 1975).
In order to examine the effects of demographic and attitudinal
variables on the perception of inflation and to examine the relationship
between the question types. power law exponents kvere calculated for
each subject and costs question type. Correlations het\veen the expo-
nents obtained for each question type kvere: btavettn the $1000 and $10
questions (based on 100 subjects \\ith valid responses on all of the
questions) r = 0.71; brtaeen the $1000 and $100 questions (based on 98
subjects). r = 0.40: betwwn the $100 and ($10 questions (based on 105
subjects). r = 0.44. These results confirm on the individual level \vhat is
apparent from the median data: responses to the $1000 and $10
questions Lvert: very similar, kvhile responses to the $100 questions.
Lvhich are essentially the inverse of the other questions. were some\vhat
different.
In order to obtain one summary measure for each of the 97 subjects
Lvith no missing data on any of these questions, the thrw expo~~ents for
that individual were averaged. The significance of effects exerted by the
demographic and attitudinal variables on this avrragc exponent was
then assrsscd for each of these tariablcs. The results of iln;llysis of
variance shokvcd ii0 significant ( p = 0.05) effects of the rtapondent’s
SCX. age. ~l~ctori~tc. marital status. cducation:~l kvel attained. or ;tbilitl
to ascribe meaning to ;i 10% :lIlnllill rate of inflatic~n. Party voted for in
the previous clcction had ;i significant effect ( F(2. 86) = 3.537, IJ c 0.05).
tvith .\upportcrs of the ni;ljor opposition party having ;i higher average
cuponcnt (0.67) than supporters of the governing party (0.55) or niinc>r
opposition party (0.46). No significant corrcI;Itions u’crc c>btainccl bc-
town the avcragc cxponc‘nt and houwhold inconic. respondent’s ;ISS~‘S+
mcnt of the pcrsonal impact of inflation on them, or sociocconc,niic
ii&x (Ellcy and Irving 1976). None of the non-.\ignific;rnt results
rxamincd \vas suggestive (1’ < 0.10). Thus ovcr;~ll it appears that indi-
viduals’ perception of price rises art’ conipar~~tivcly tiii~~ffccttxl b)
attitudinal ilnd demographic variables.
T:lhlc 1 summ;lrises the rcsponws to the inflation rate questions.
While the $1000, $10 and $100 questions all clicitcd unclcrcstiniates of
the real extent to \vhich prices have risen in the period. median
estimates of the inflation raw at-t’ fairly accurate. tending if anything to

Ma.h~ axf upper .tnJ lower quatde estrmatr$ of the acragr dnnwl mfI.~twn rate snd ,~tu.d
a~erdgt! ~nnudi mfldtwn raks for perwd\ ending September IYX?. The number of SU~JCCI~
respondmp vahdl~ IO the questmn for that period IS gl\en under ‘n’. Acrud InflJtwn rdtr flgurrb
are baaed on the offlcd ftgurrb (N.Z. hionthly Abstract of Stattstlch).
Estlmatrs
Lowr quart& Me&al Upper quxttlr
n Actud
1 55 80 12.0 8X 5.3
2 10.0 12.0 16.5 86 11.0
4 100 140 170 86 13.45
6 10.5 14.0 17.3 84 13.35
x 10.0 140 17.0 79 1396
10 100 13.5 17 5 7x 13.79
13 100 14.0 1’) 5 80 12.65 16 9.0 12.5 25.0 7x 11.21
The major rault, that tlierc was systcm~tic ilncl~rcstimaticln of the
actual rise in costs ovt’r the ptzriods surveyed, shows lhal fhc unckr-
estimation of rxponentinl grttwth found by W~lg~Ii~~~lr gencrdises hc-
yard the laboratory. Further. the irniicrestint~rtion ha5 gcnmtiiscd from

a task in which subjects extrapolated a short series of numbers to a tush
in which subjects wrrt: askrd to mak estimatrb based on uhat the)
could remember or reconstruct of past costs.
According to Wagenaar. misperception of exponential gro\vth can bt:
charactrrised by an underrstimatt: of the exponent. h. in the equation
J* = ueh-’ + C responsible for gttnerclting tht: series. If Wagenaar’s account
is correct for tht: results of this investigation then a power ia\v rtllation-
ship of the form: Pwxived Cost = A (Actual Cost)” should hold
assuming that costs have actually increased in an e?cponrntial fashion
[l]. As the results shown in fig. 3 show an approximately linear trend.
thus indicating a po\ver law relationship to hold. Wagenaar’s account of
tht: underttstimation is correspondingly upheld. A problem in interpret-
ing this result too rigorously arises because: tht: actual inflation rate for
tht: period ~YIS not constant and hence tht: actunl bchuviour of prices
over time did not strictly follow an txponaitial stxies. It is thus possihlc
that the small deviations from linwrity stun in fig. 3 are thr consc-
quencc of this actual price Miaviour rather than the perception of it. It
is noteworthy. in this rcspcct. that the estrcnic Icft-hand point in fig. 3
for thr: $1000 and $10 questions (right hand for the $100 questions)
Lvhich is furthcst from the lint of hcst fit is bxcd on the time period
\vhich includes 1967-70, ;I period of substantiallv lower inflation.
A further parallcl \vith the results of Wagcnnar’~ c?cperinlents Jcscrvcs
nicntion. 7‘hc results prcswtcci lwrc shv that L1IiClL’rL’~tiIii;itio[i of the
rise in costs ~;IS greater when subjects \vcrc nskcd to respond bq
cstiniating incrcmxl prices (as for the $100 questions) than Lvhcn
subjects u’crc ashcti to respond by c~timatin g dccrcxcd pricch (as for
$10 and $1000 questions). IIicsc diffcrcnt hinds of rcsponsc corre.4poncl
to incrcxsing and dccrcasing cxponcnti;~l xrich Ivliicli follonal the mfnc
pattern.

Thus o\srall the results of this In\estigatian are similar to those
obtained by b’agenax. and appear to have arisen becaue of the
exponential nuture of cost increases. An implication of these results.
which has not been explored here. is that both rupectations regarding
price changes and the perception of, or memory for. actual price
changes are constructed, probably in the same way. Certainly expecta-
tions regarding price changes are also subject to the general process of
underestimation (Keren 1983).
Figs. 1 and 2 show that substantial individual differences exist in the
extent to tvhich changes in costs are underestimated. but. as ~~1s
described above. the individual differences are not strongly related to
the demographic and attitudinal variables measured here. Such ;I result
may suggest that the cause of the individual differences may be of ;1
cognitive rather than an economic or nttitudinal nature.
The subjects in this study revealed ~1 fairly low Iwel of understanding
of inflation. Only half the subjects provided estimates for all the
inflation rate and all the costs qutxtions. and thoxc that did apparently
did not rclatc their rt’sponscs on one type of question kvith those on the
other. Thcsc findinga arc capable of mow than WC intcrprctation: one
could argue. for txamplc. that h~io~vltxlgc of the inflation rate is gained
through the media, lvhilcl co.\ts of actual goods end scrvices arc rclattxl
to cvcryclay c?cpcricnce. Altcrnativcly one could argue that rcmcmbcring
cobts ova ;I period of ycarh ih the more artificial task.
Not yet considcrcd is the question of prcciscly \vhat cognitive
procosxs Lvcrc uwd by the suh~ccts 10 cxtimatc past costs. I’robahiy the
simplest possibility hcrc i5 that suhjcct5 in effect “rcmcmbcr” only an
uncl~rc~ti~iiatc~l cxpc~icnt, h, L\ hich i5 then uwtl to construct the c\ti-
matc.4 of past co.\t5. A,. ll,linst thi3. howxvcr. might lx argual the fact Illat
subjects’ c5tirnate5 of inflation rate arc not only on avcragc accurate but
aI50 do not corrclatc ivith cxpnncnts obt:tincd from the cost.4 clucstion5.
‘I‘hi~s. if SLI~JCC~~ did niahc: i15c of an iln~l~r~.4ti~i~;it~~l cxponcnt. h. they
did ho indcpcndcntlv of their 0timatc of the inflation rate. Of courx.
such indcpcndcnce is quite poshiblc. hoawcr unp~lrsimonious. Ancjthcr
possibility i5 that wbjwt5 L’ktimatccl the past costs from compcwitcs 01
item5 Lvhow past price5 Lvcrc. on avcragc. ovcrc~tim~~tcd. Such over-
cxtimation might occur through confusion of pa.41 \vith prcxcnt or. at
any rate, more recent prices. On the other hand. it i\ not easy 10 xc
~vhy, in this c;ix. lhc: rcsult5 obtained ~houIcl 50 cloaly rcwmblc thaw
obtained from pcrccptual cxpcrimcnt>.

It is clear that an amaver lo the question of precisely how subjects estimate past costs. and thus why the! overestimate them. must a[ rhis stage be speculative. It should be noted, ho\vever. that the apparentI> related phenomenon of misperception of exponential growth is also not completely explained. It is possible that both phenomena are examples of the compression commonly found in perceptual scaling and char- acterised by exponents of less than one in po~ver law functions relating perceived to actual stimuli (Wagenaar 1982: Stevens 1975).
One last issue should be mentioned. The results of this investigation suggest that a general perceptual phenomenon - misperception of exponential growth - affects estimates of the cost of living. Some recent research sugges& lha1 ;I 1ask in visual perception - estimating the sizes of notes and coins - may be influenced by inflation (Lea 1981: Furnham 1983). Findings of this kind indicate ;I complex relationship between traditional psychotogicnt and economic variabtcs.
Rcfcrenccs