
PERCEPTION IN VISUALIZATIONmajumder/vispercep/samreen.pdf · Construction of activation map based...
54
PERCEPTION IN VISUALIZATION Samreen Anjum | CS 213: Visual Perception | 3 rd June 2013
Transcript of PERCEPTION IN VISUALIZATIONmajumder/vispercep/samreen.pdf · Construction of activation map based...
PERCEPTION IN VISUALIZATION
Samreen Anjum | CS 213: Visual Perception | 3rd June 2013
Perception in Visualization
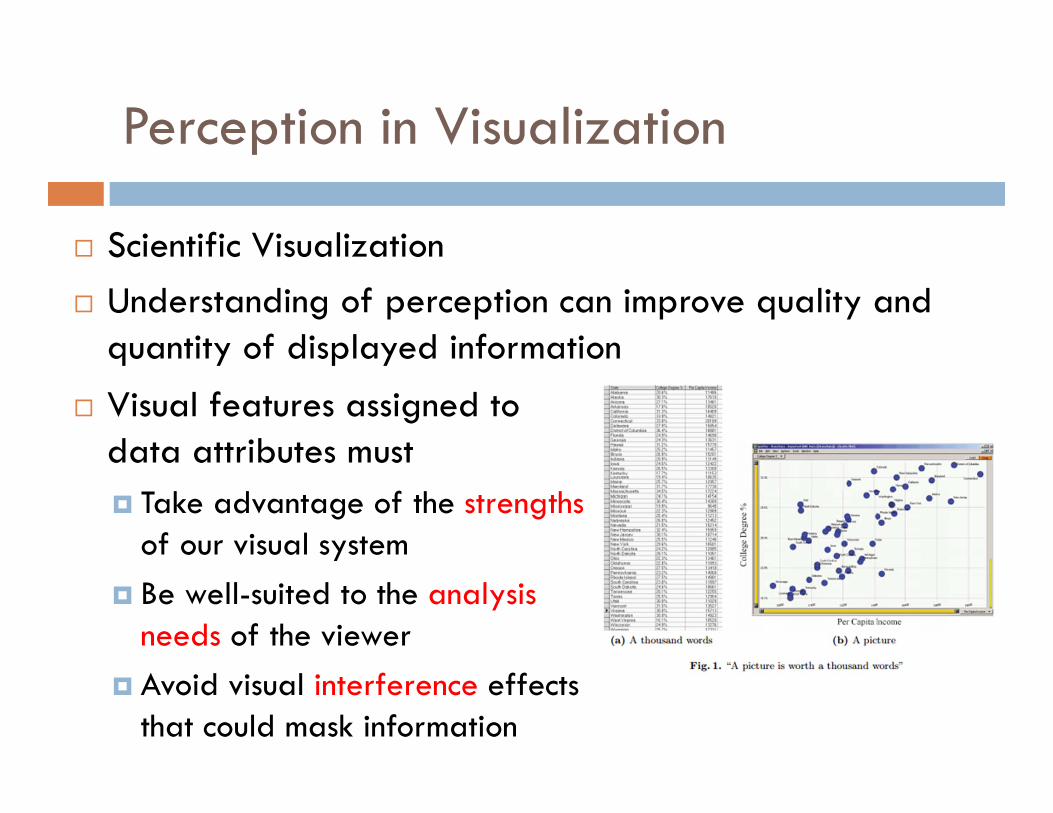
Scientific Visualization Understanding of perception can improve quality and
quantity of displayed information
Visual features assigned to data attributes must Take advantage of the strengths
of our visual system Be well-suited to the analysis
needs of the viewer Avoid visual interference effects
that could mask information
Overview
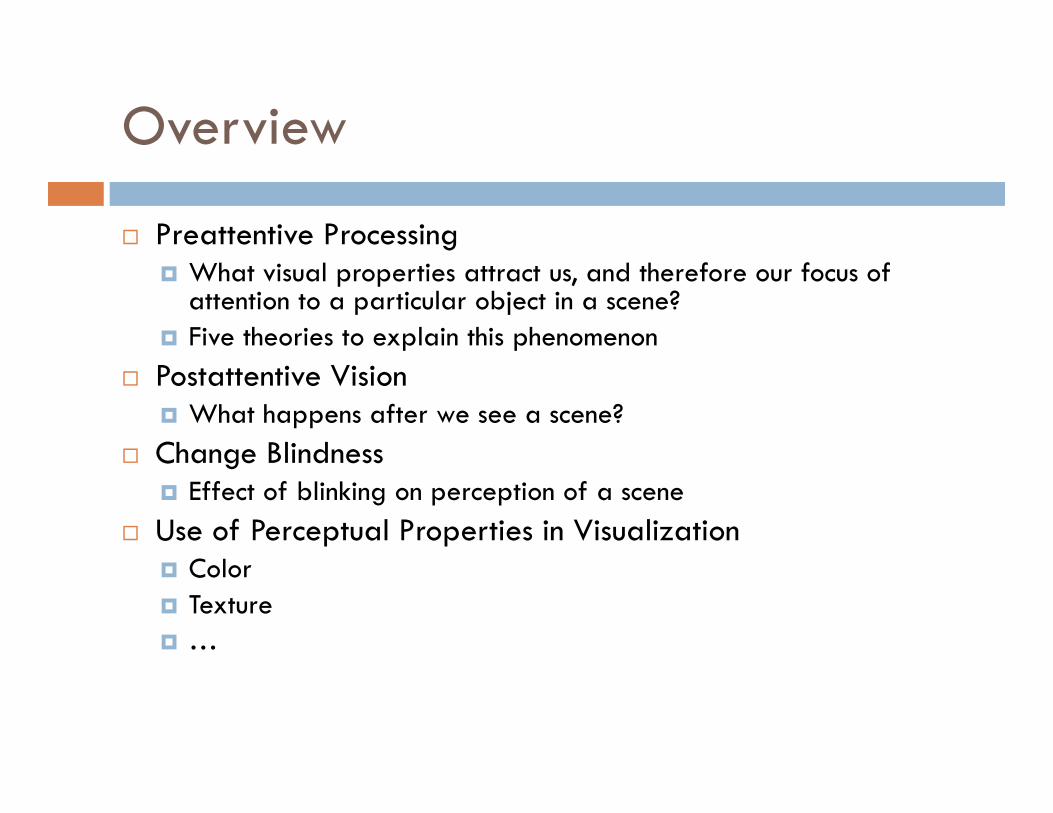
Preattentive Processing What visual properties attract us, and therefore our focus of
attention to a particular object in a scene? Five theories to explain this phenomenon
Postattentive Vision What happens after we see a scene?
Change Blindness Effect of blinking on perception of a scene
Use of Perceptual Properties in Visualization Color Texture …
Preattentive Processing
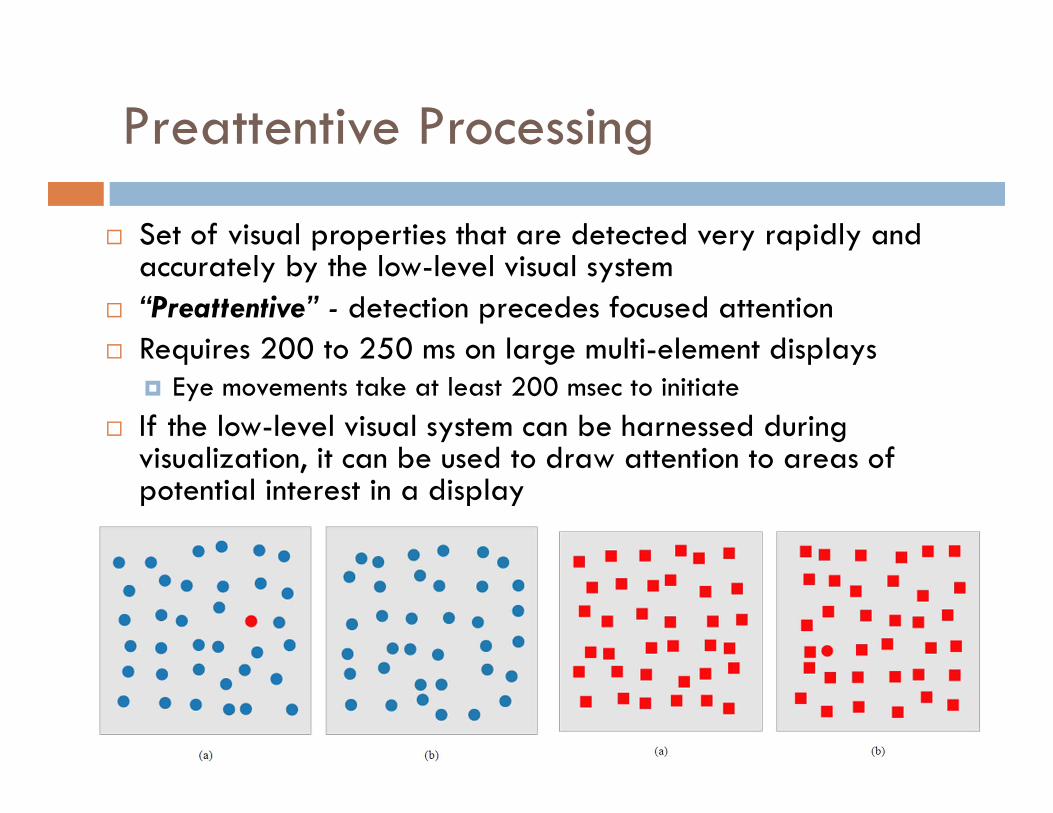
Set of visual properties that are detected very rapidly and accurately by the low-level visual system
“Preattentive” - detection precedes focused attention Requires 200 to 250 ms on large multi-element displays
Eye movements take at least 200 msec to initiate If the low-level visual system can be harnessed during
visualization, it can be used to draw attention to areas of potential interest in a display
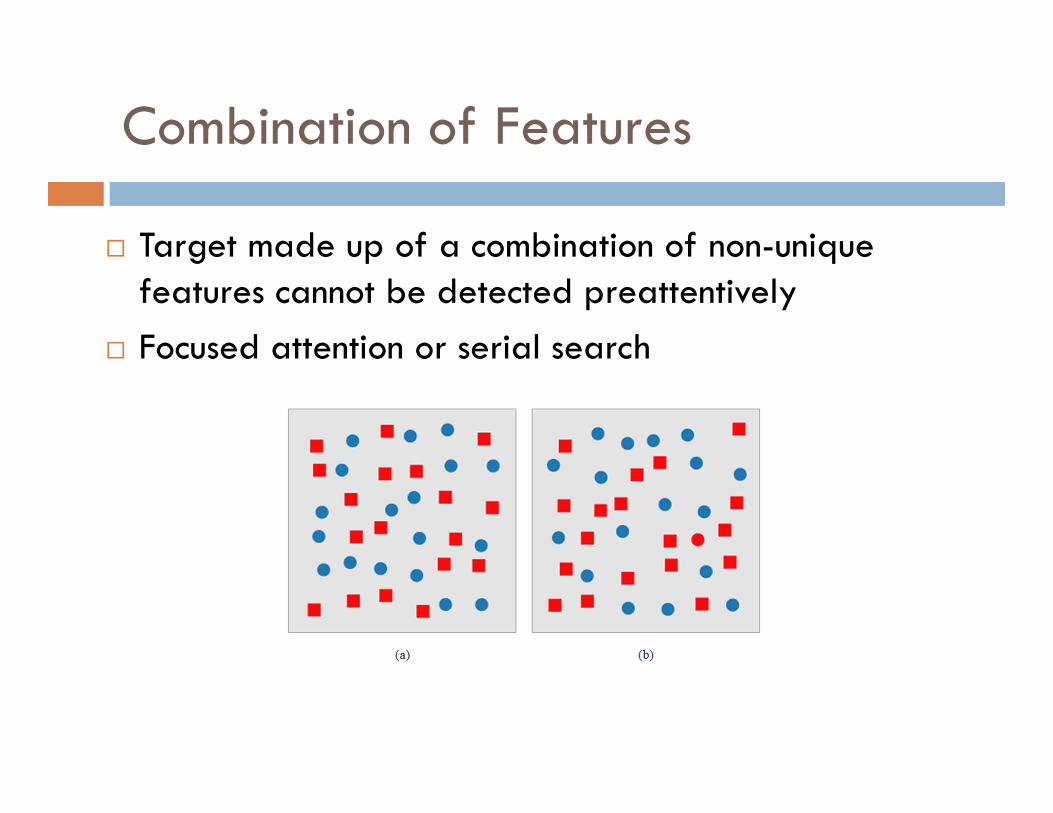
Combination of Features
Target made up of a combination of non-unique features cannot be detected preattentively
Focused attention or serial search
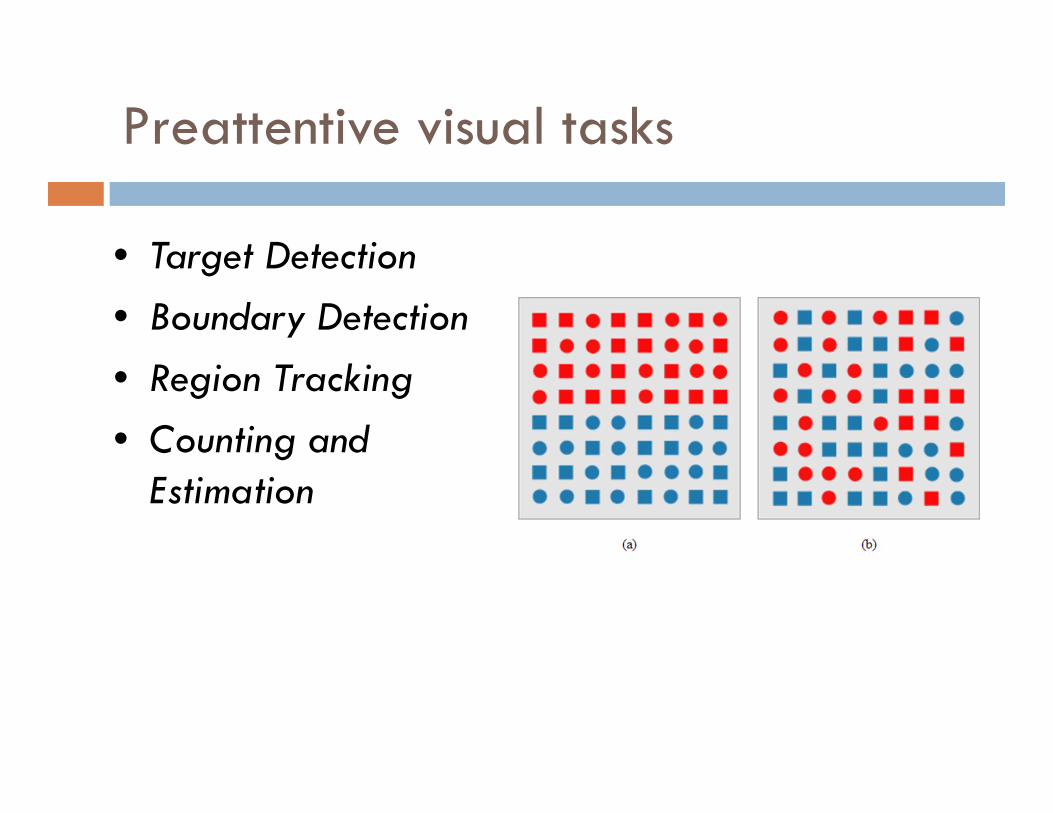
Preattentive visual tasks
• Target Detection• Boundary Detection• Region Tracking• Counting and
Estimation
Five Theories
Feature Integration Theory Texton Theory Similarity Theory Guided Theory Boolean Theory
Feature Integration Theory - I
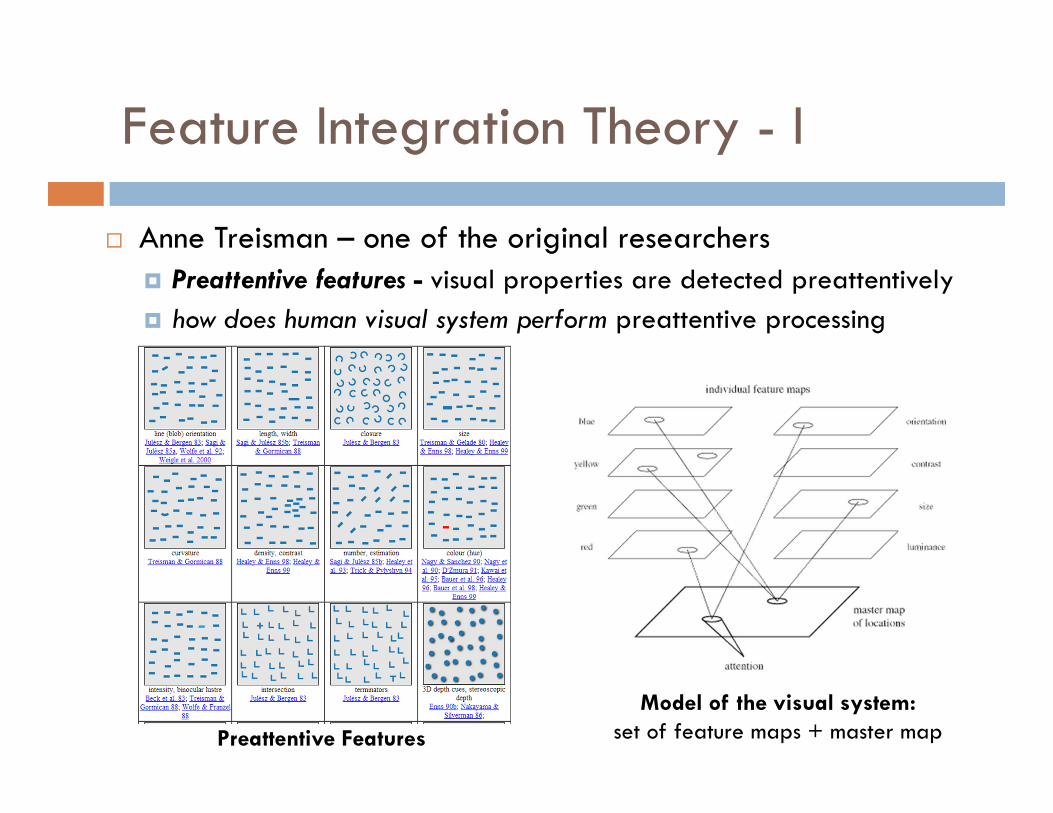
Anne Treisman – one of the original researchers Preattentive features - visual properties are detected preattentively how does human visual system perform preattentive processing
Model of the visual system:set of feature maps + master mapPreattentive Features
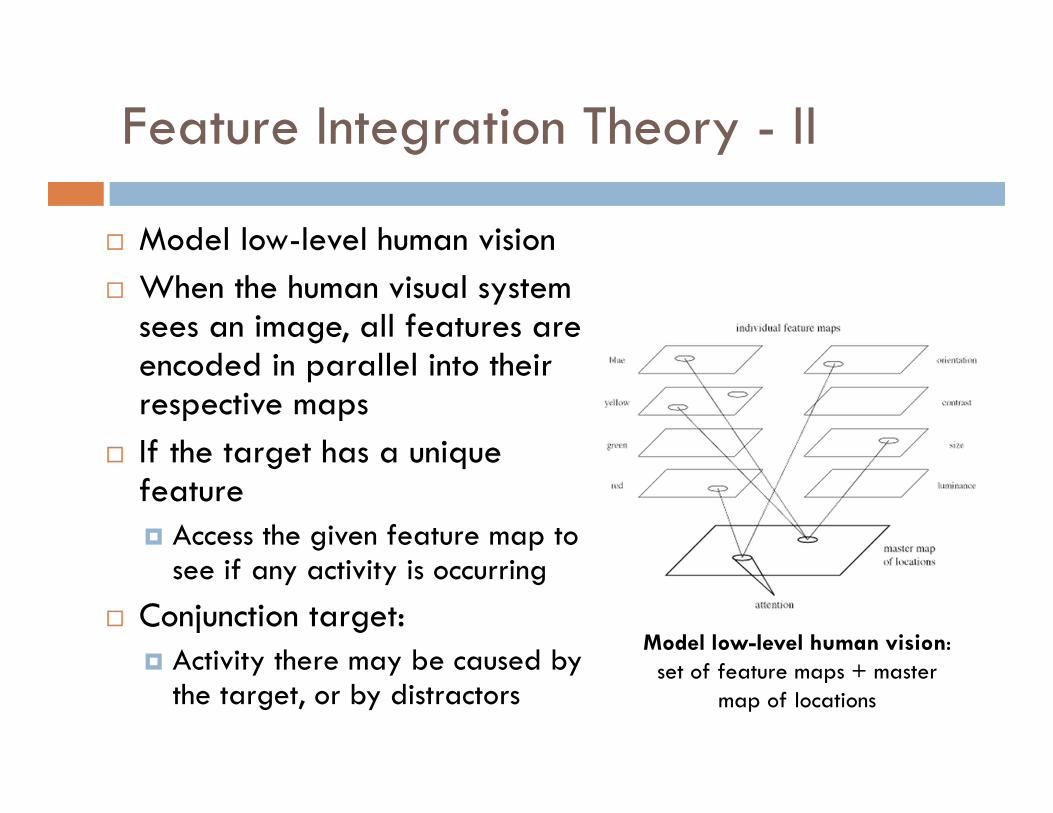
Feature Integration Theory - II
Model low-level human vision When the human visual system
sees an image, all features are encoded in parallel into their respective maps
If the target has a unique feature Access the given feature map to
see if any activity is occurring Conjunction target:
Activity there may be caused by the target, or by distractors
Model low-level human vision:set of feature maps + master
map of locations
Feature Integration Theory - Expansion
The amount of differentiation between the target and the distractors for a given feature will affect search time
Explain certain cases where conjunction search is preattentive a significant target–nontarget feature difference would
allow individual feature maps to ignore nontargetinformation contained in the master map
Texton Theory
Bela Julész initial investigations focused on statistical analysis of texture patterns
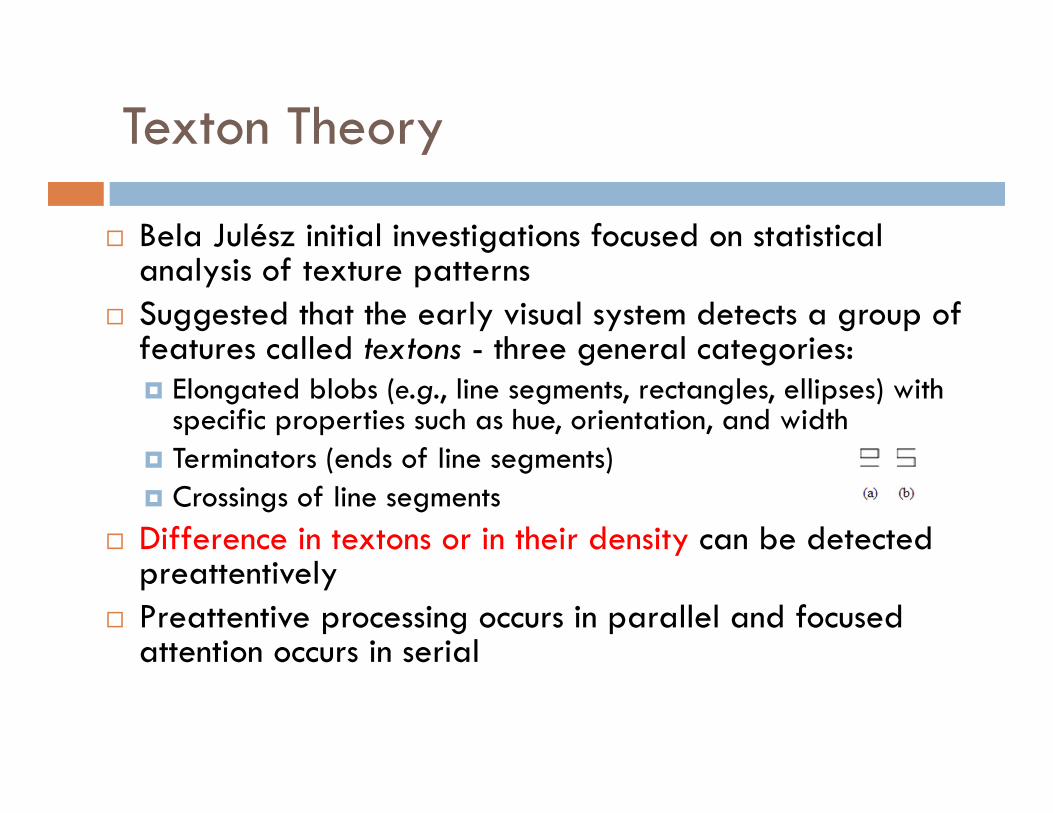
Suggested that the early visual system detects a group of features called textons - three general categories: Elongated blobs (e.g., line segments, rectangles, ellipses) with
specific properties such as hue, orientation, and width Terminators (ends of line segments) Crossings of line segments
Difference in textons or in their density can be detected preattentively
Preattentive processing occurs in parallel and focused attention occurs in serial
Texton Theory - II
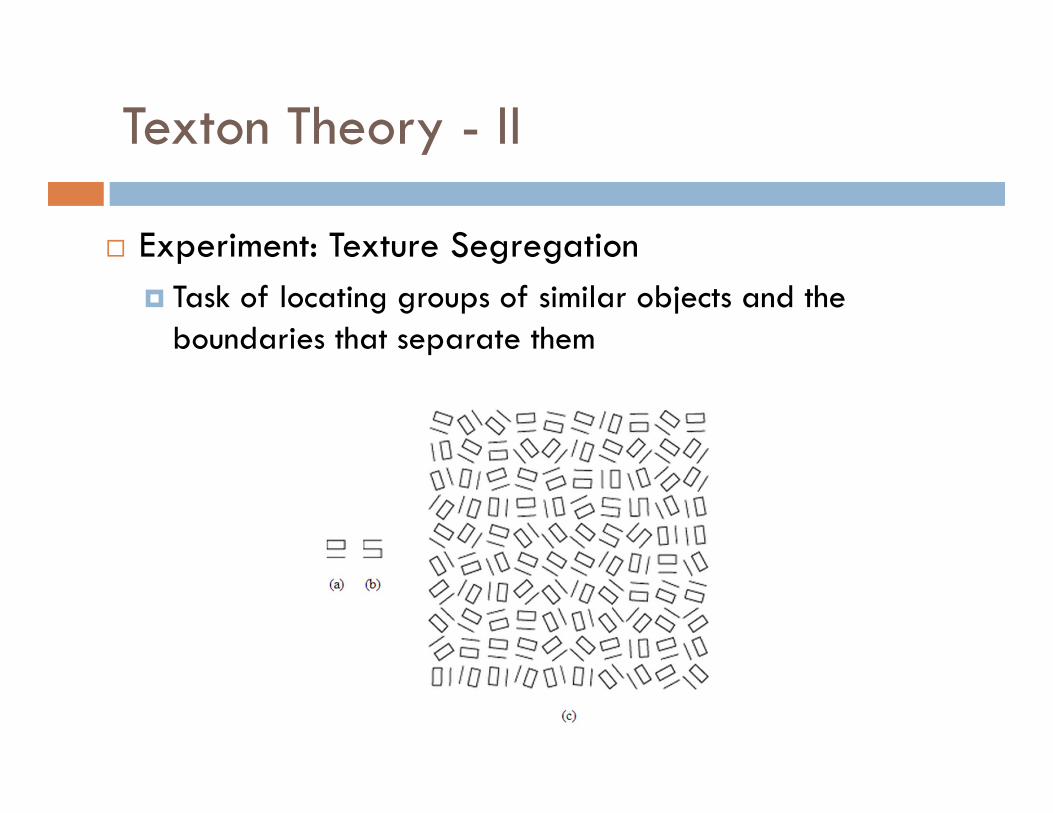
Experiment: Texture Segregation Task of locating groups of similar objects and the
boundaries that separate them
Similarity Theory
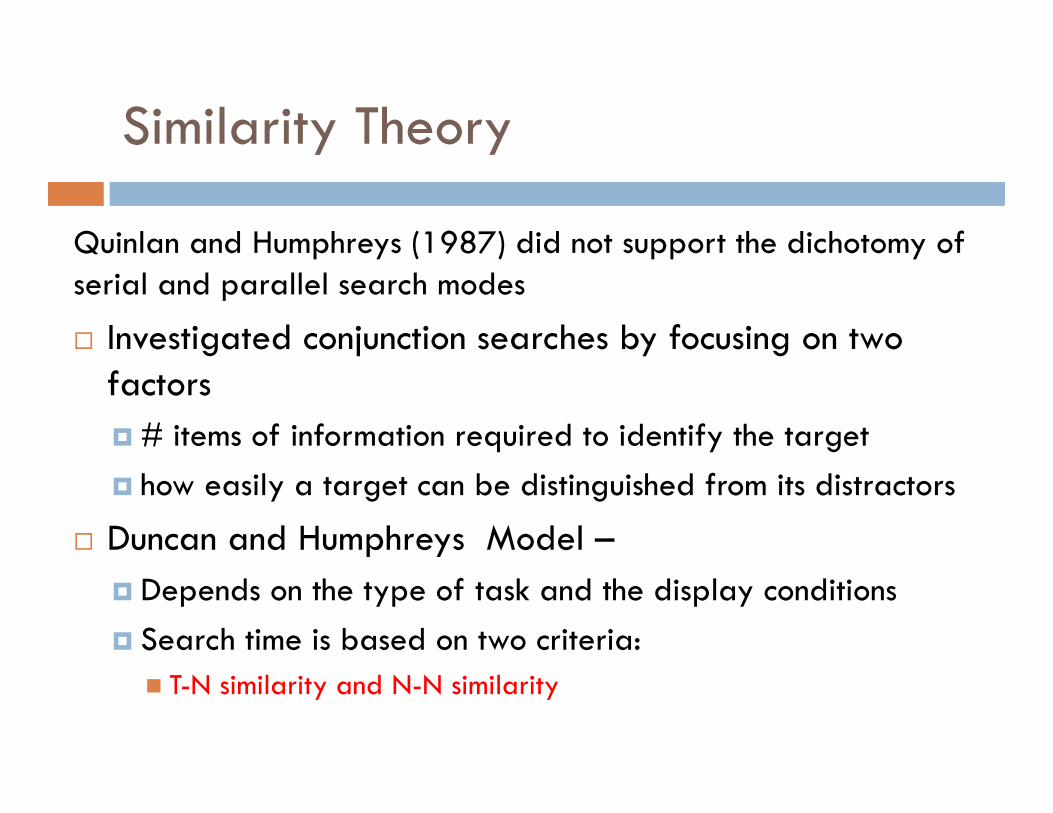
Quinlan and Humphreys (1987) did not support the dichotomy of serial and parallel search modes
Investigated conjunction searches by focusing on two factors # items of information required to identify the target how easily a target can be distinguished from its distractors
Duncan and Humphreys Model – Depends on the type of task and the display conditions Search time is based on two criteria: T-N similarity and N-N similarity
Similarity Theory - II
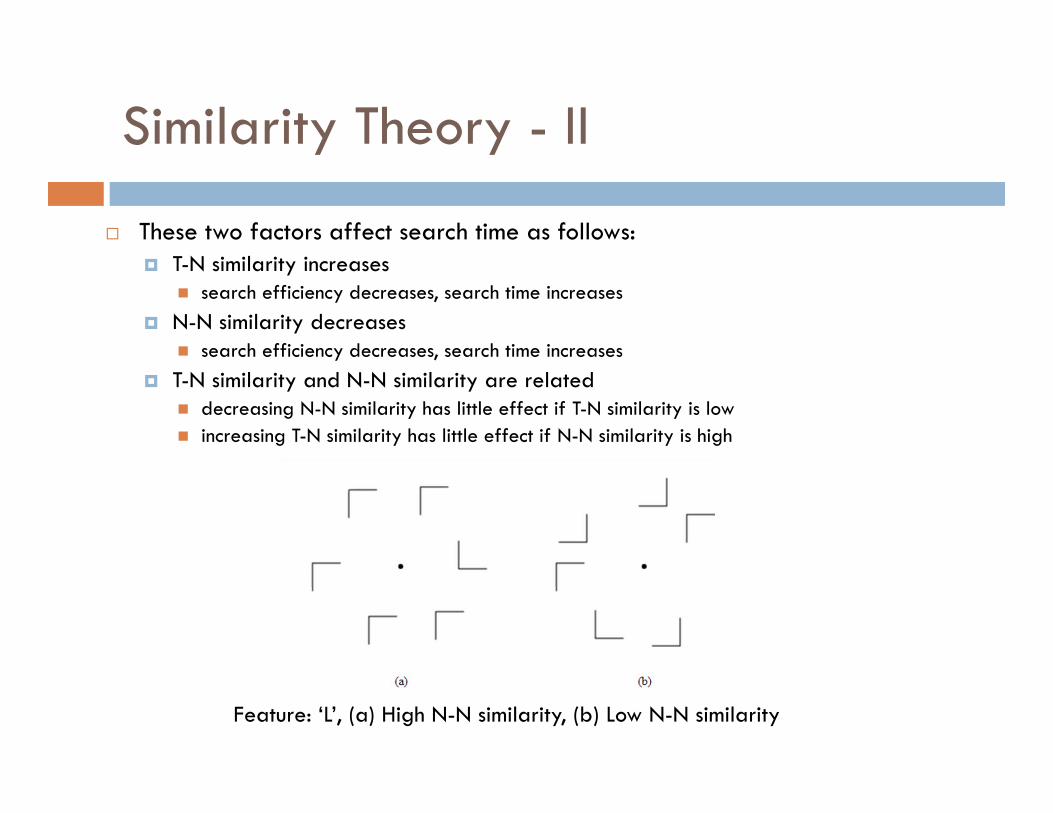
These two factors affect search time as follows: T-N similarity increases
search efficiency decreases, search time increases N-N similarity decreases
search efficiency decreases, search time increases T-N similarity and N-N similarity are related
decreasing N-N similarity has little effect if T-N similarity is low increasing T-N similarity has little effect if N-N similarity is high
Feature: ‘L’, (a) High N-N similarity, (b) Low N-N similarity
Guided Theory
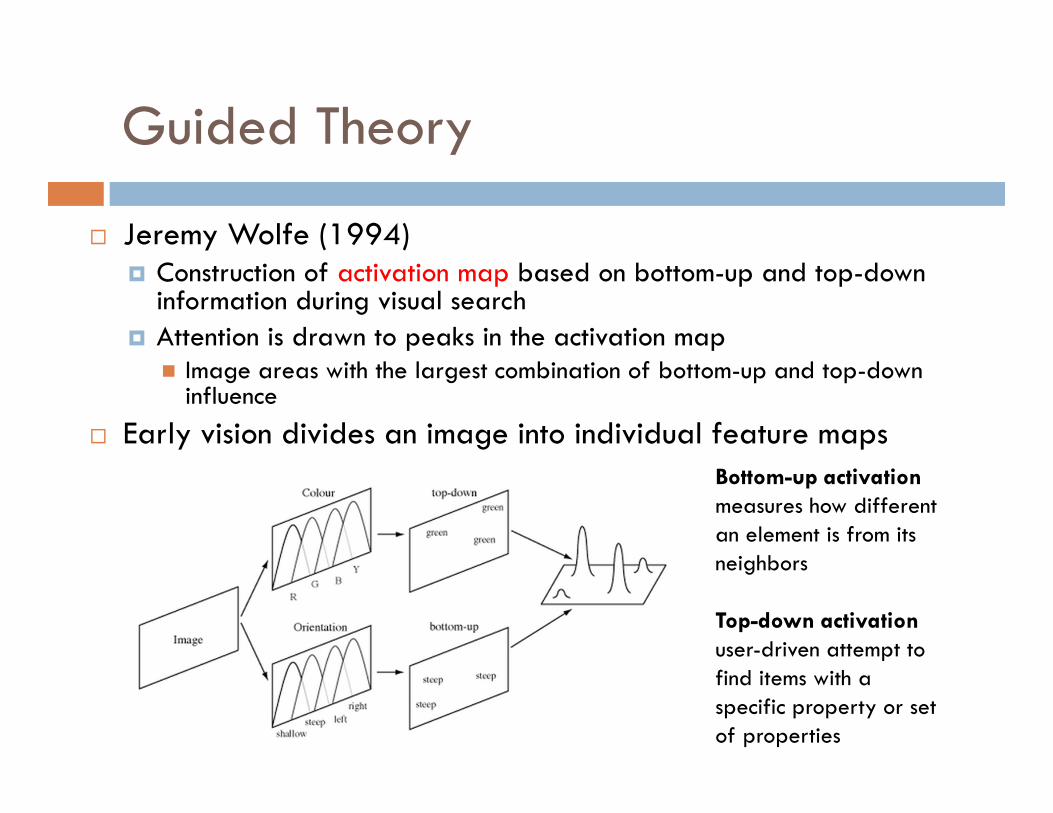
Jeremy Wolfe (1994) Construction of activation map based on bottom-up and top-down
information during visual search Attention is drawn to peaks in the activation map Image areas with the largest combination of bottom-up and top-down
influence Early vision divides an image into individual feature maps
Bottom-up activation measures how different an element is from its neighbors
Top-down activationuser-driven attempt to find items with a specific property or set of properties
Boolean Theory
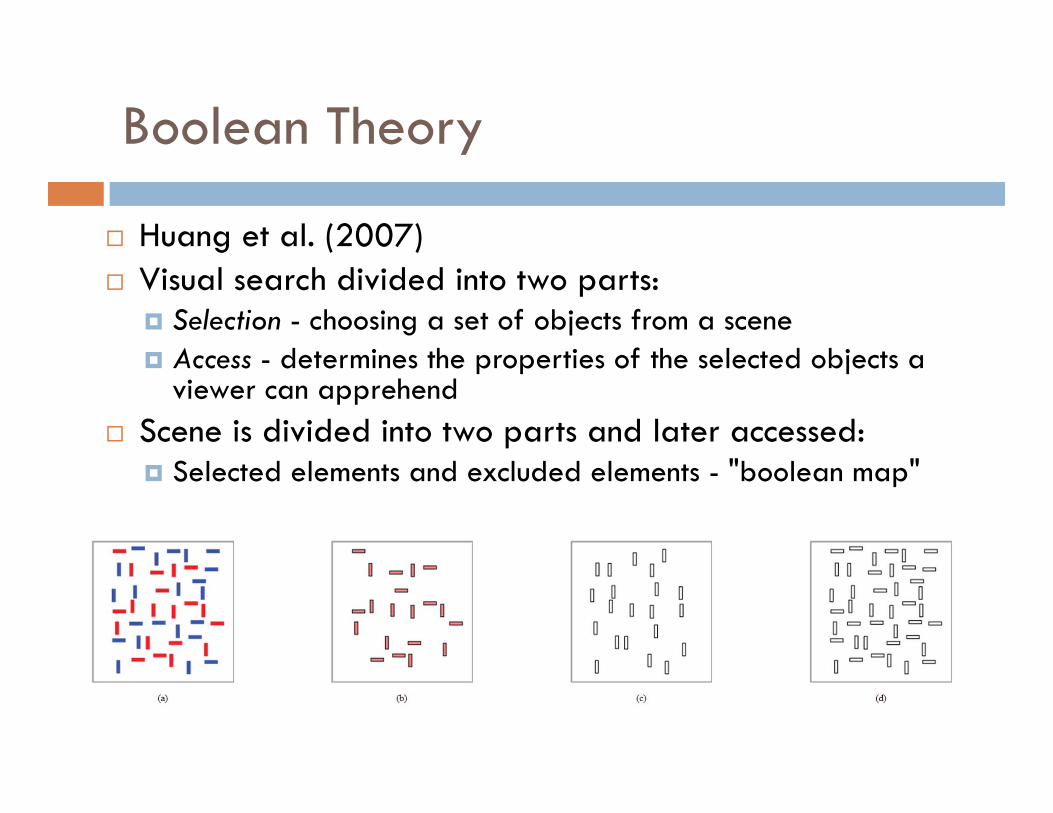
Huang et al. (2007) Visual search divided into two parts:
Selection - choosing a set of objects from a scene Access - determines the properties of the selected objects a
viewer can apprehend Scene is divided into two parts and later accessed:
Selected elements and excluded elements - "boolean map"
Boolean Map Theory - II
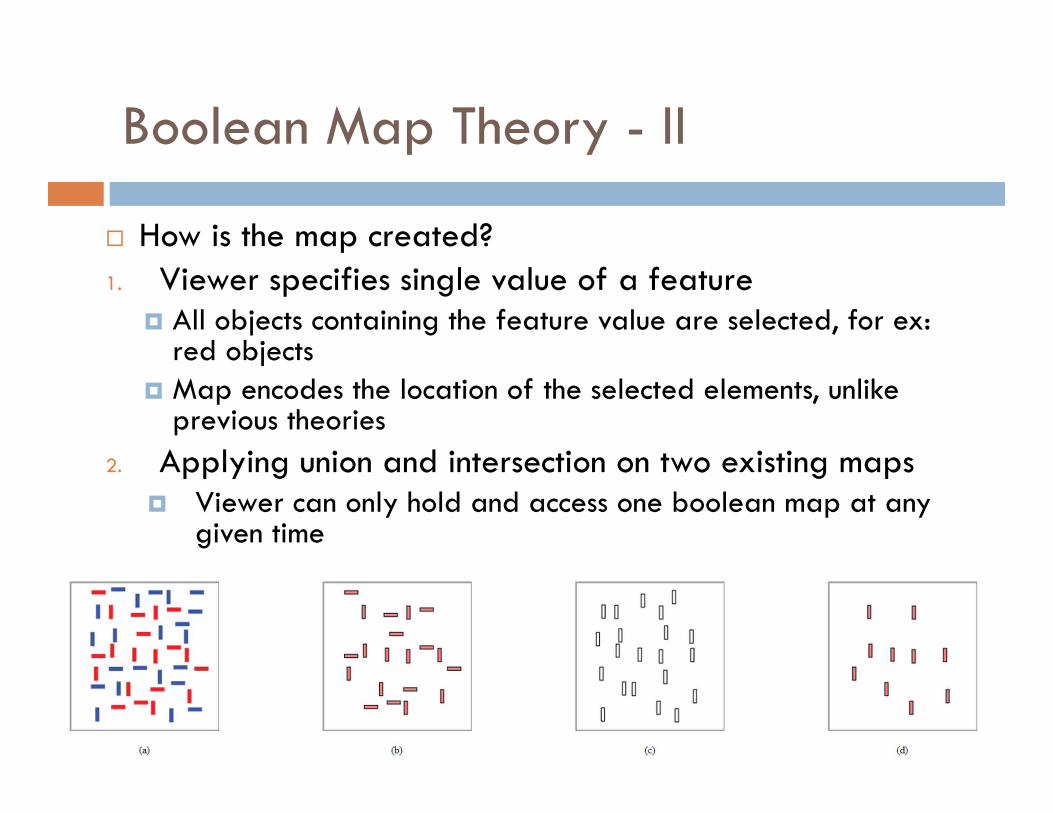
How is the map created?1. Viewer specifies single value of a feature
All objects containing the feature value are selected, for ex: red objects
Map encodes the location of the selected elements, unlike previous theories
2. Applying union and intersection on two existing maps Viewer can only hold and access one boolean map at any
given time
Boolean Theory - III
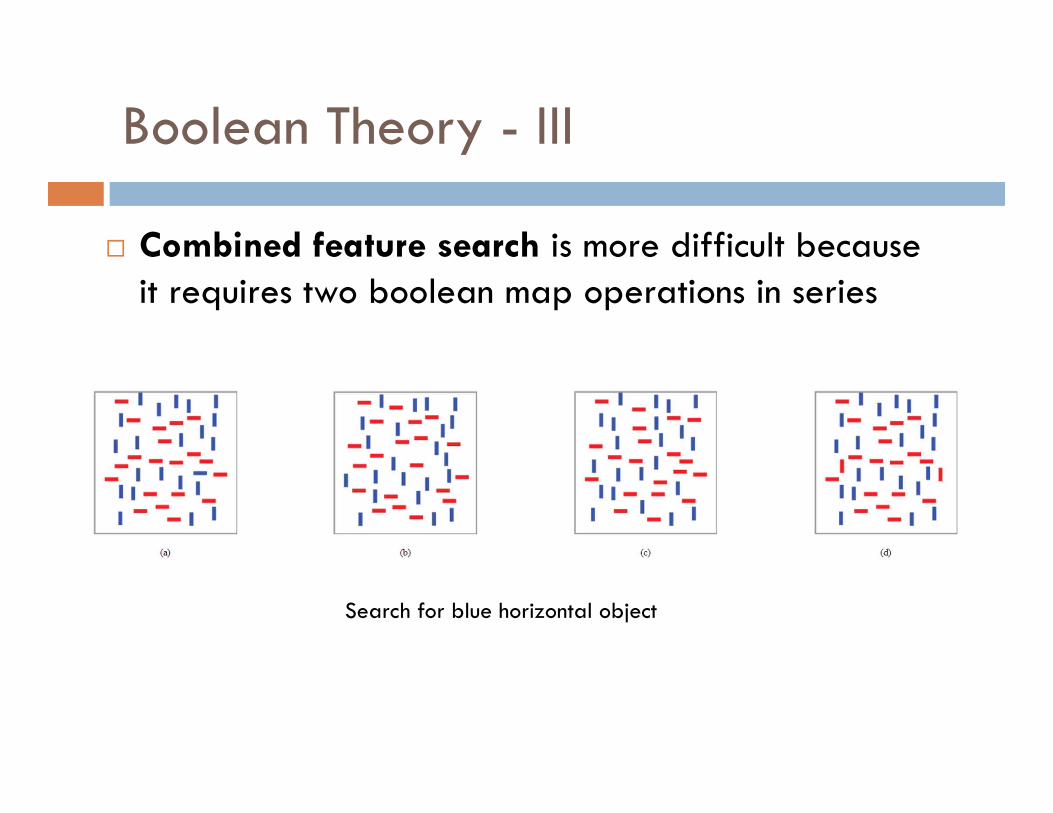
Combined feature search is more difficult because it requires two boolean map operations in series
Search for blue horizontal object
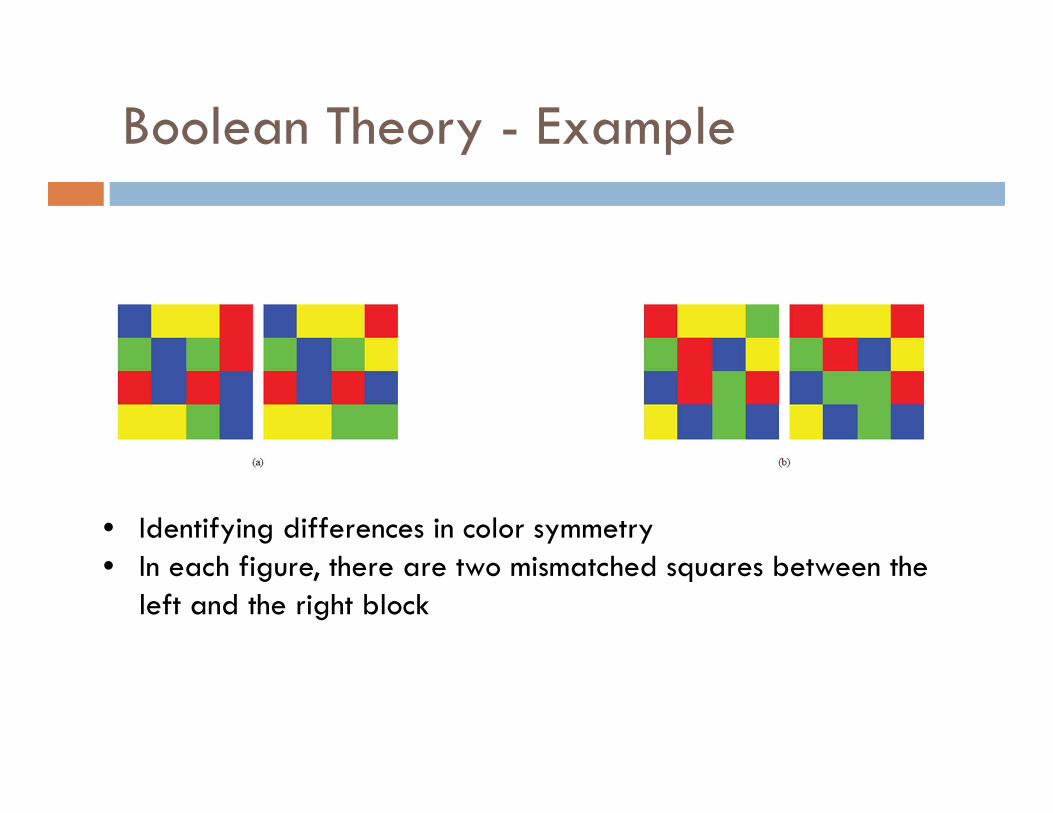
Boolean Theory - Example
• Identifying differences in color symmetry • In each figure, there are two mismatched squares between the
left and the right block
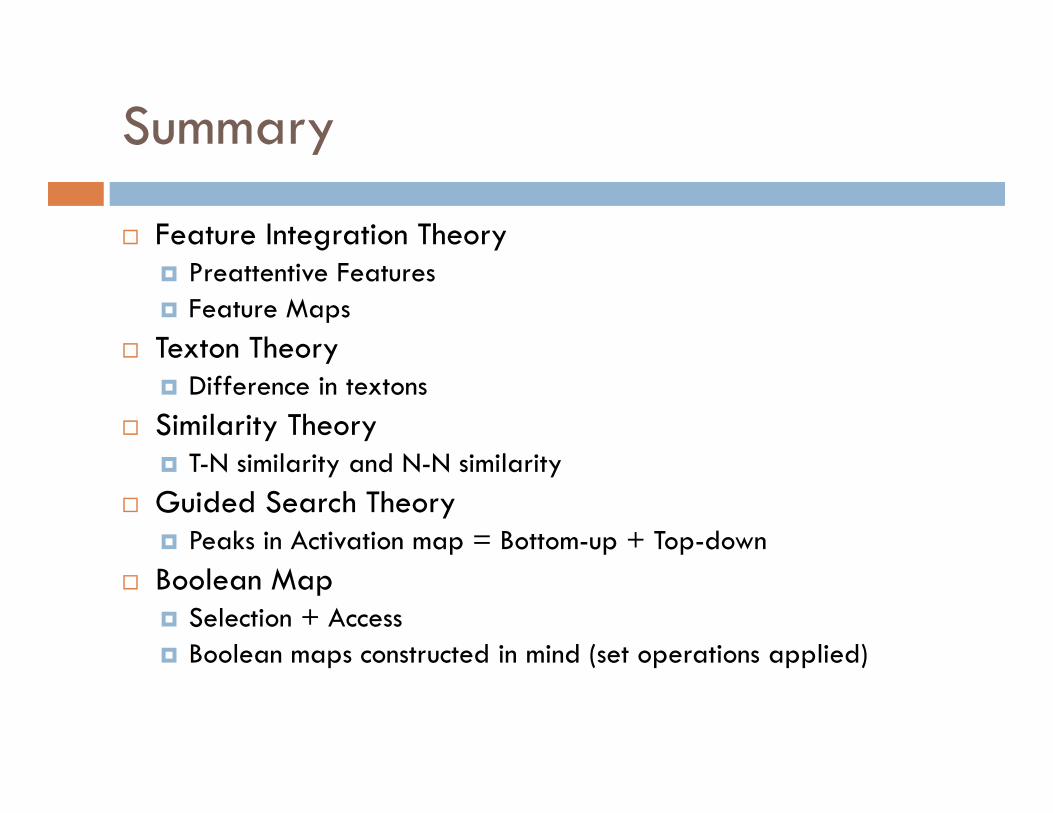
Summary
Feature Integration Theory Preattentive Features Feature Maps
Texton Theory Difference in textons
Similarity Theory T-N similarity and N-N similarity
Guided Search Theory Peaks in Activation map = Bottom-up + Top-down
Boolean Map Selection + Access Boolean maps constructed in mind (set operations applied)
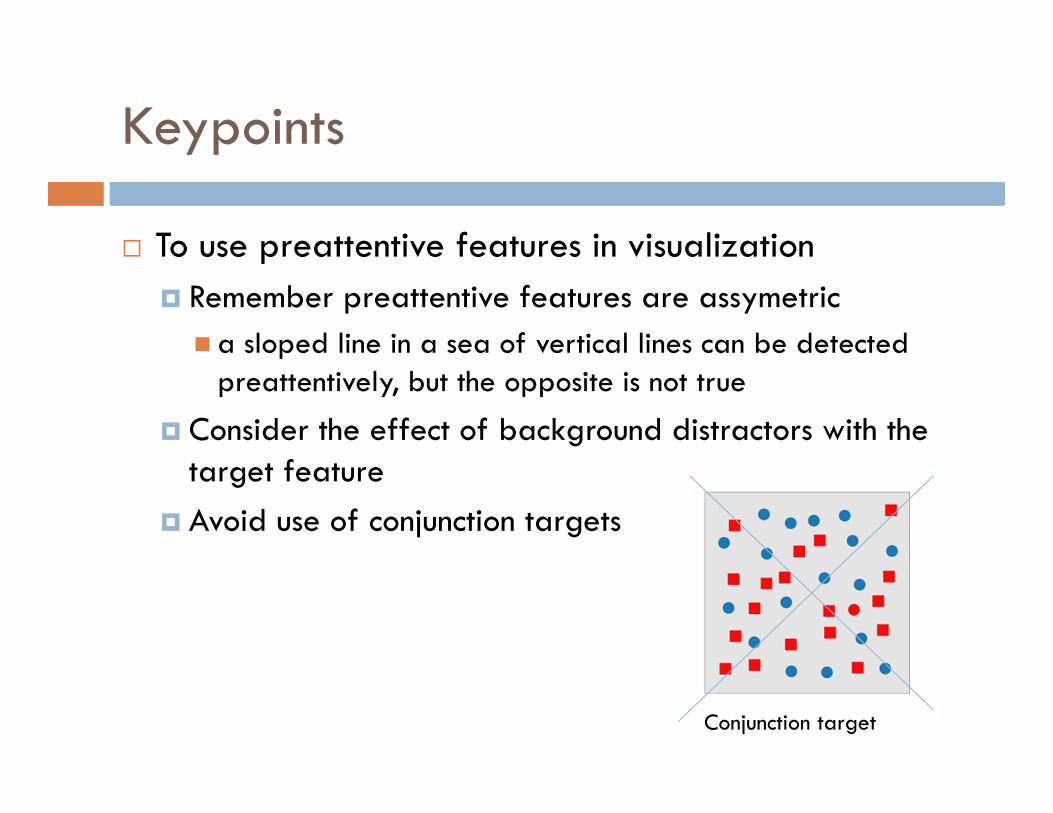
Keypoints
To use preattentive features in visualization Remember preattentive features are assymetric a sloped line in a sea of vertical lines can be detected
preattentively, but the opposite is not true
Consider the effect of background distractors with the target feature
Avoid use of conjunction targets
Conjunction target
Postattentive Vision
"What happens to the visual representation of an object when we stop attending to it and look at something else?”
Jeremy Wolfe (2000) Do we develop a rich visual representation as we look
at more and more of a scene? No Attention to different objects allows us to learn what is in a
scene, but does not “store” the scene
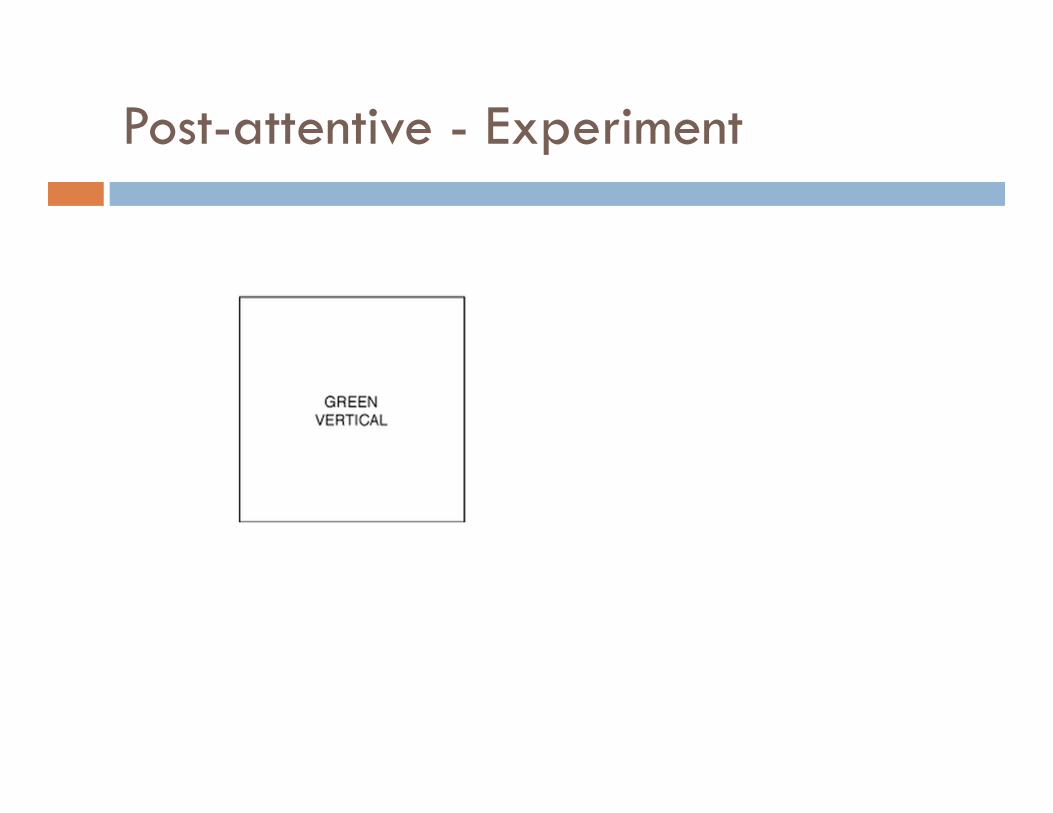
Post-attentive - Experiment
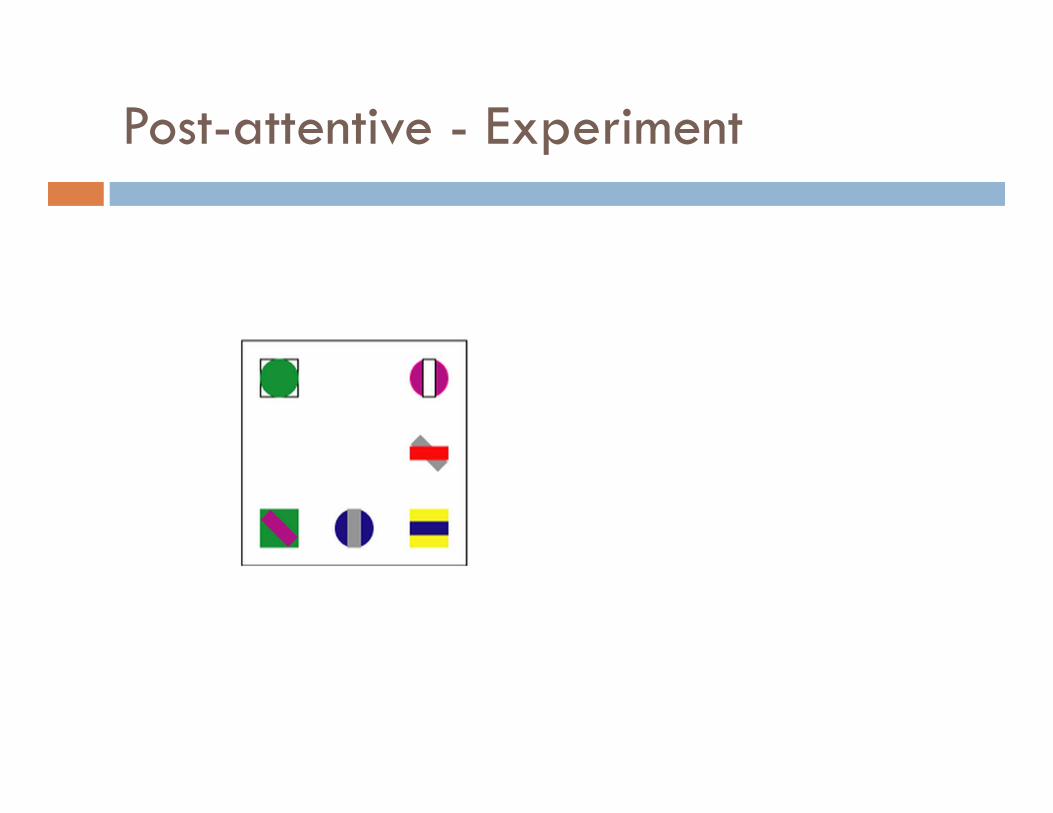
Post-attentive - Experiment
Postattentive Processing
Significant impact for visualization design Generally, visualization displays are novel, and
their contents cannot be committed to long-term memory Studying a display may offer no assistance in searching
for specific data values
Hence, preattentive methods would be critical in allowing viewers to rapidly and accurate explore their data
Recent Thoughts
Ways are explored to apply rules of perception to produce images that are visually salient
Goal of human vision is not to create a replica or image of the seen world in our mind
No general purpose - What we "see" in a new scene depends on our goals and expectations
Change Blindness
An interruption in the view renders us "blind" to significant changes that occur in the scene during the interruption
Example: http://www.csc.ncsu.edu/faculty/healey/PP/movies/Dinner.gif
Why does it happen? [Dan Simons] Overwriting, First Impression, Nothing is Stored
Impact on visualization Attract attention only to the details that are significant in the
subsequent images
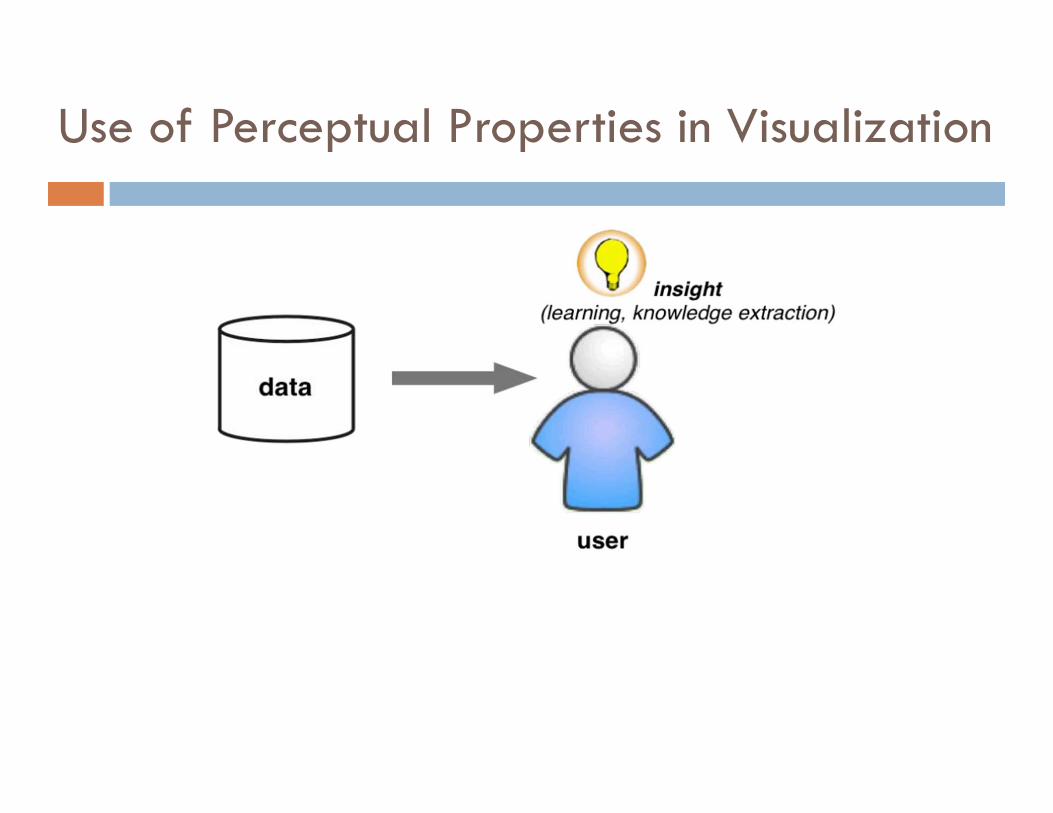
Use of Perceptual Properties in Visualization
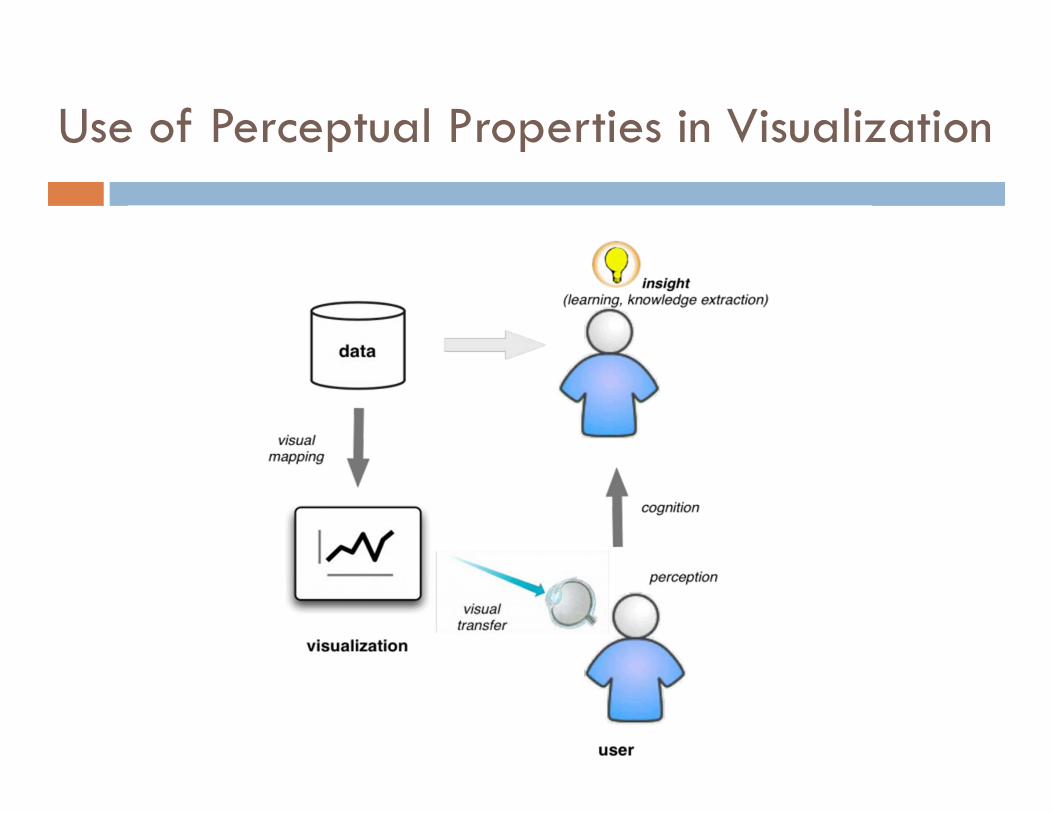
Use of Perceptual Properties in Visualization
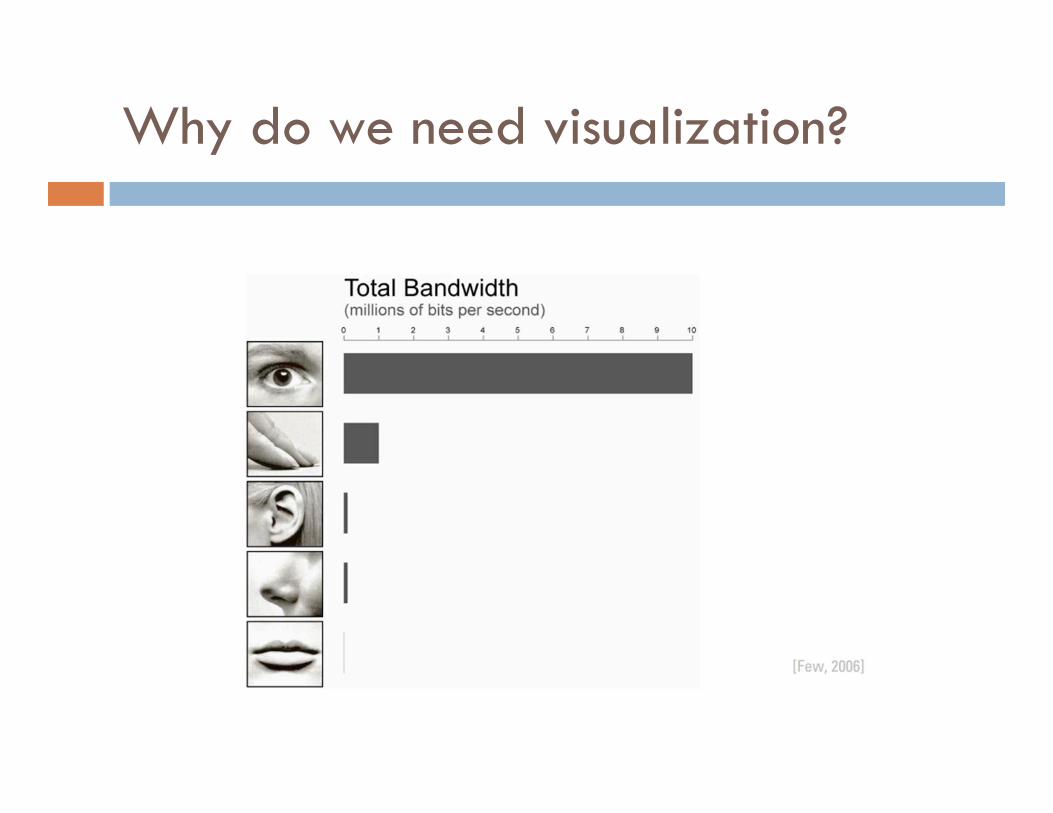
Why do we need visualization?
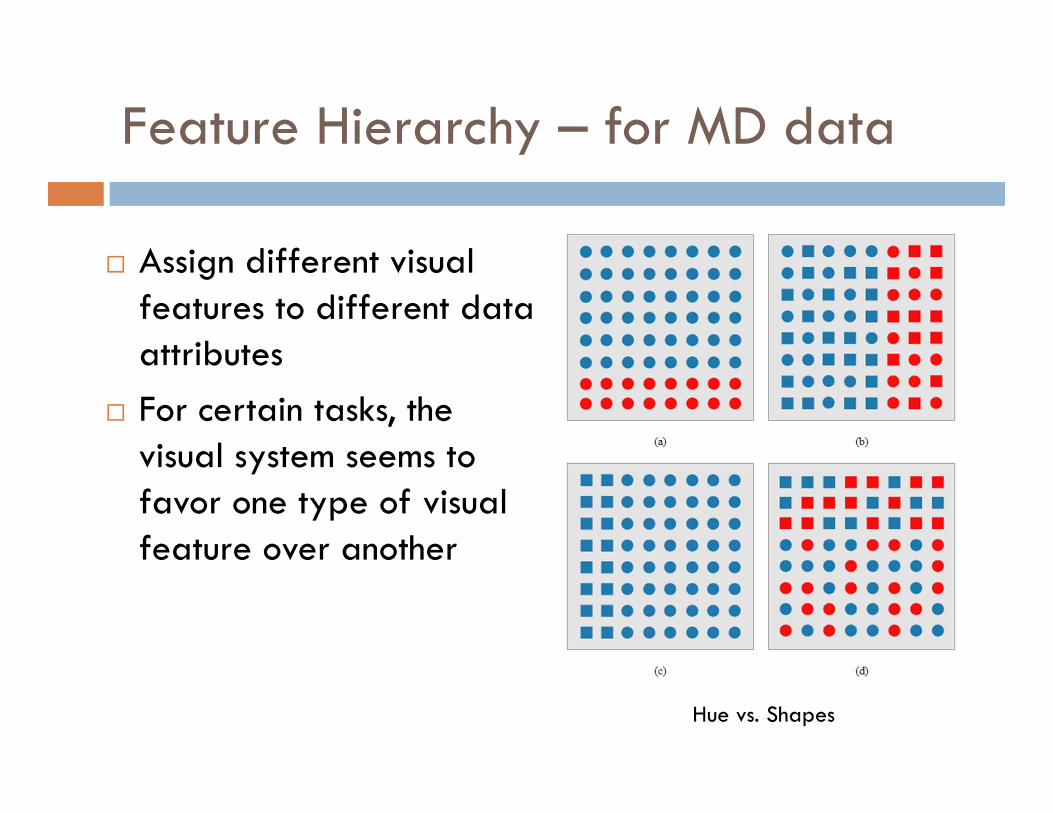
Feature Hierarchy – for MD data
Assign different visual features to different data attributes
For certain tasks, the visual system seems to favor one type of visual feature over another
Hue vs. Shapes
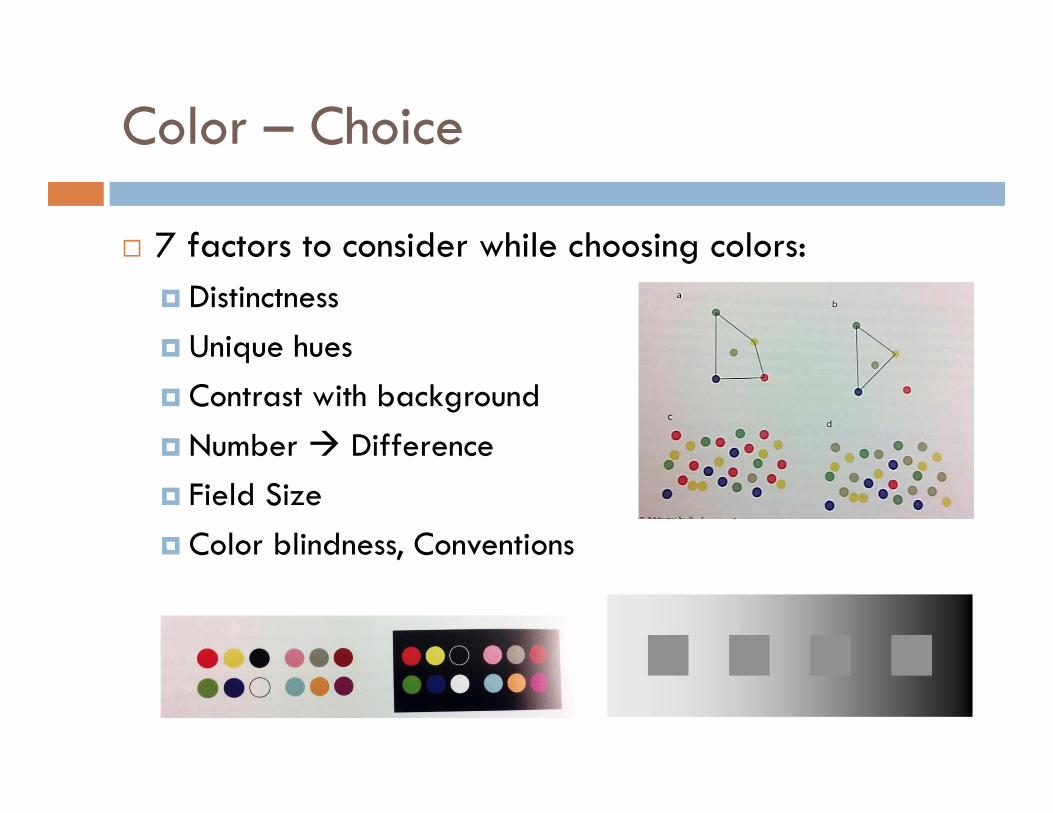
Color – Choice
7 factors to consider while choosing colors: Distinctness Unique hues Contrast with background Number Difference Field Size Color blindness, Conventions
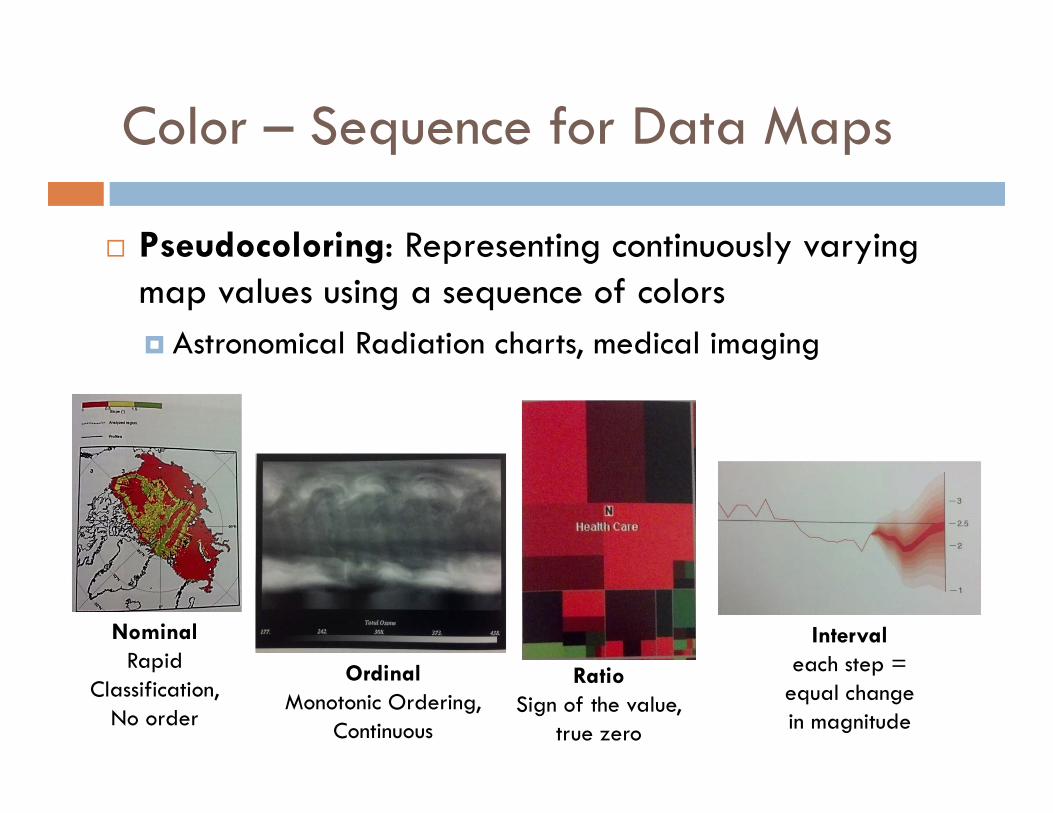
Color – Sequence for Data Maps
Pseudocoloring: Representing continuously varying map values using a sequence of colors Astronomical Radiation charts, medical imaging
NominalRapid
Classification, No order
Intervaleach step =
equal change in magnitude
RatioSign of the value,
true zero
OrdinalMonotonic Ordering,
Continuous
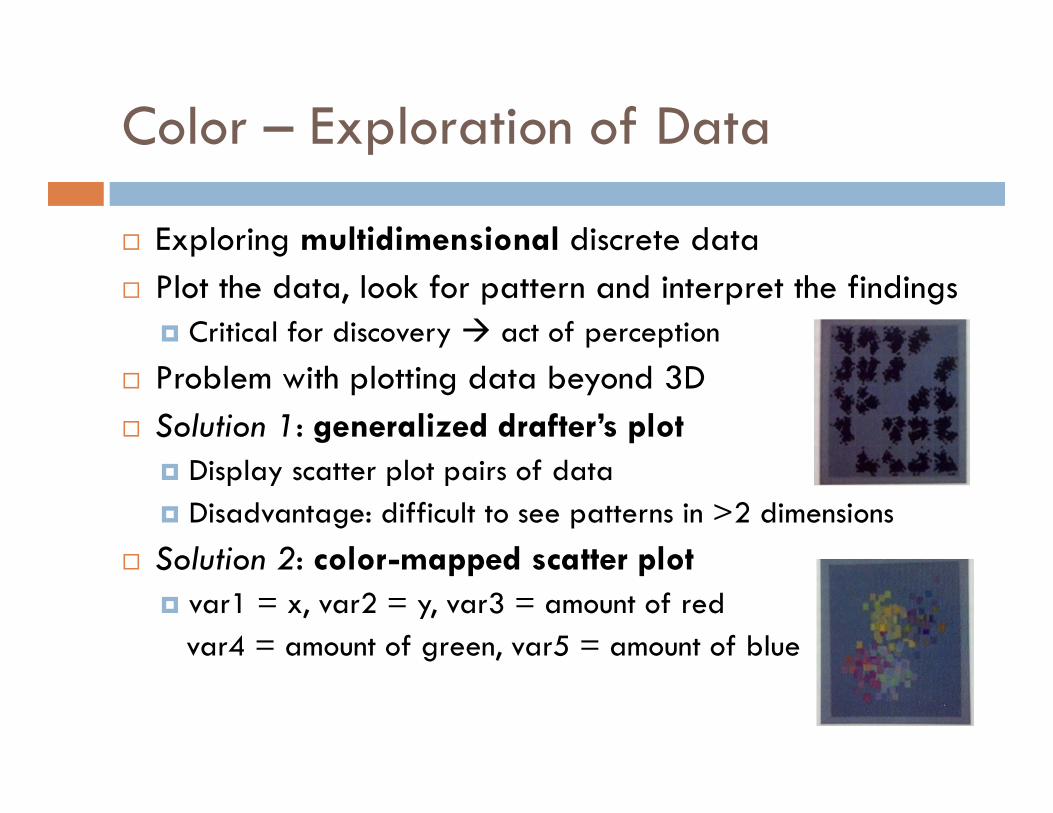
Color – Exploration of Data
Exploring multidimensional discrete data Plot the data, look for pattern and interpret the findings
Critical for discovery act of perception Problem with plotting data beyond 3D Solution 1: generalized drafter’s plot
Display scatter plot pairs of data Disadvantage: difficult to see patterns in >2 dimensions
Solution 2: color-mapped scatter plot var1 = x, var2 = y, var3 = amount of red
var4 = amount of green, var5 = amount of blue
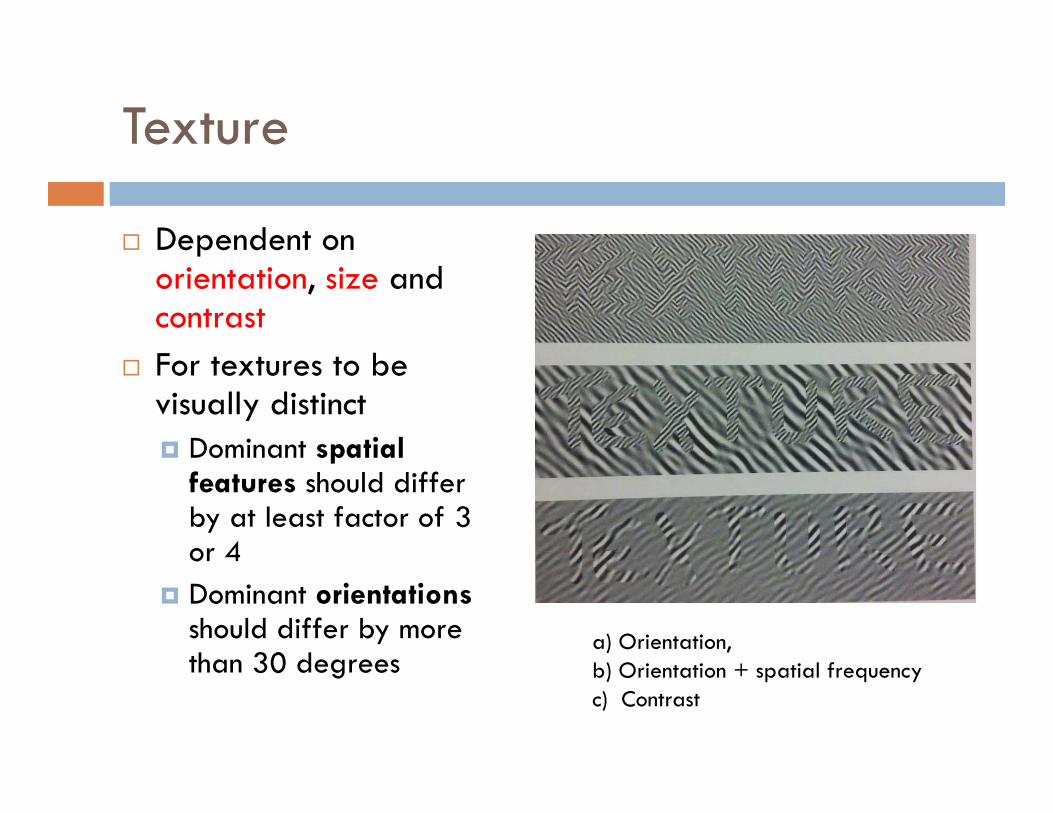
Texture
Dependent on orientation, size and contrast
For textures to be visually distinct Dominant spatial
features should differ by at least factor of 3 or 4
Dominant orientationsshould differ by more than 30 degrees
a) Orientation, b) Orientation + spatial frequencyc) Contrast
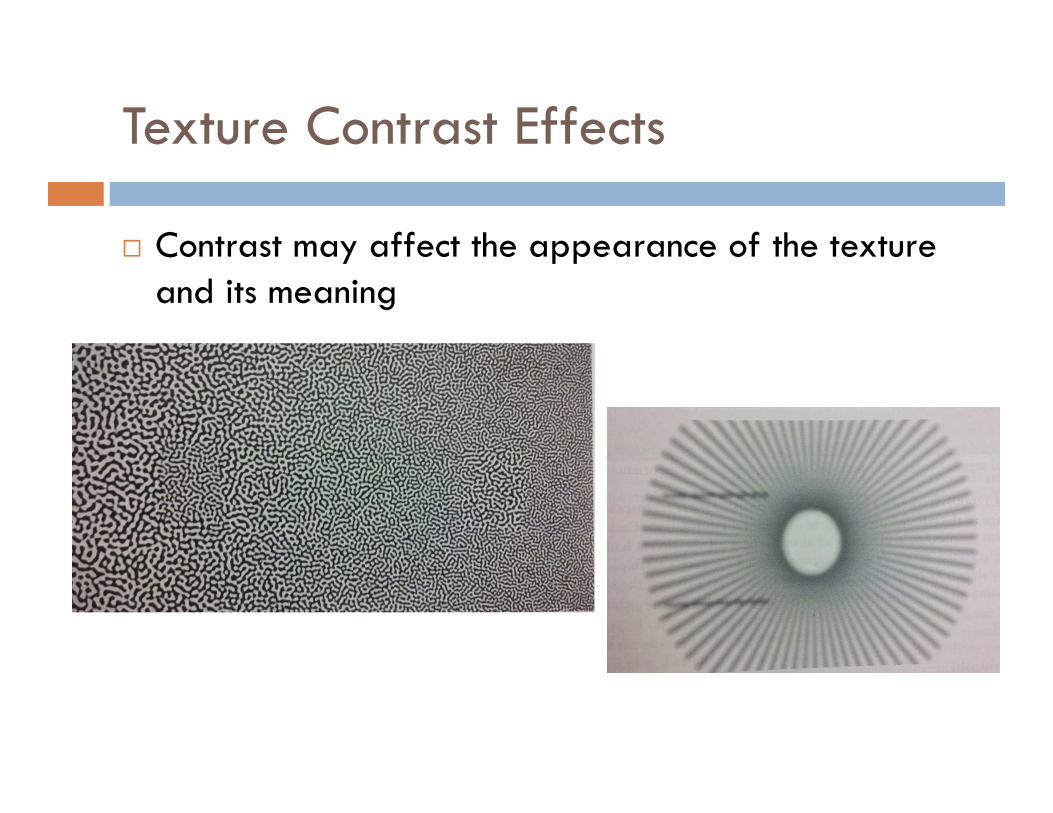
Texture Contrast Effects
Contrast may affect the appearance of the texture and its meaning
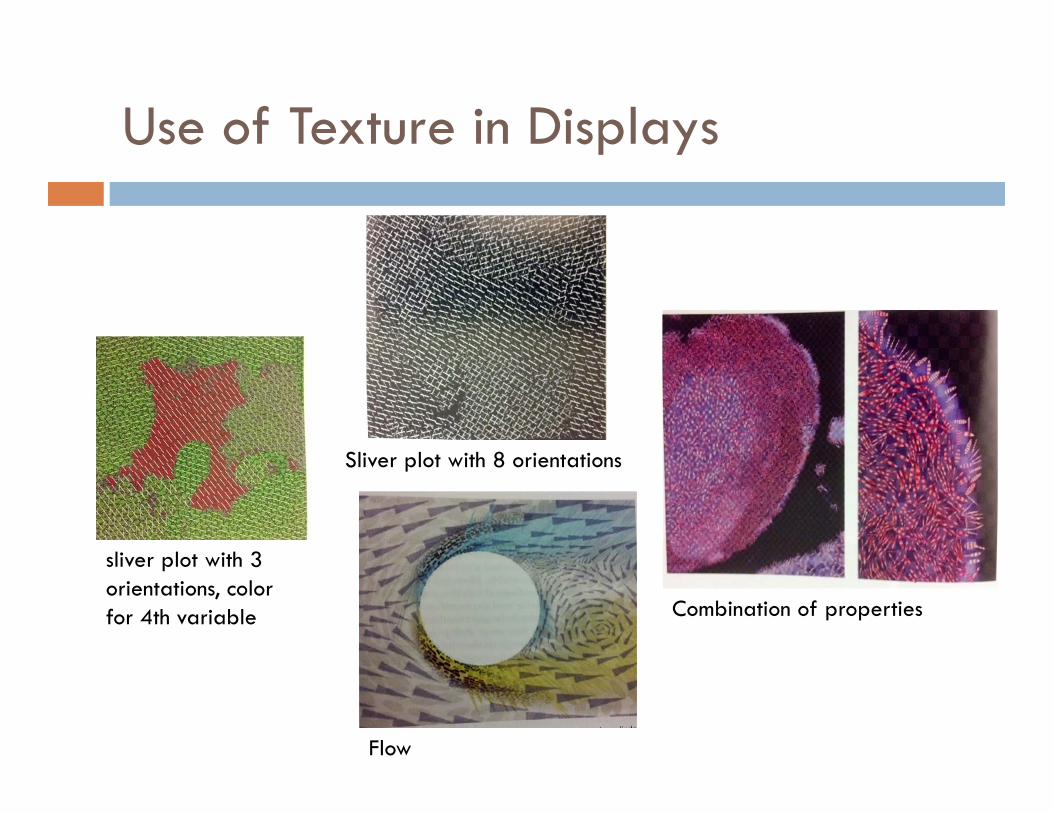
Use of Texture in Displays
sliver plot with 3 orientations, color for 4th variable
Flow
Combination of properties
Sliver plot with 8 orientations
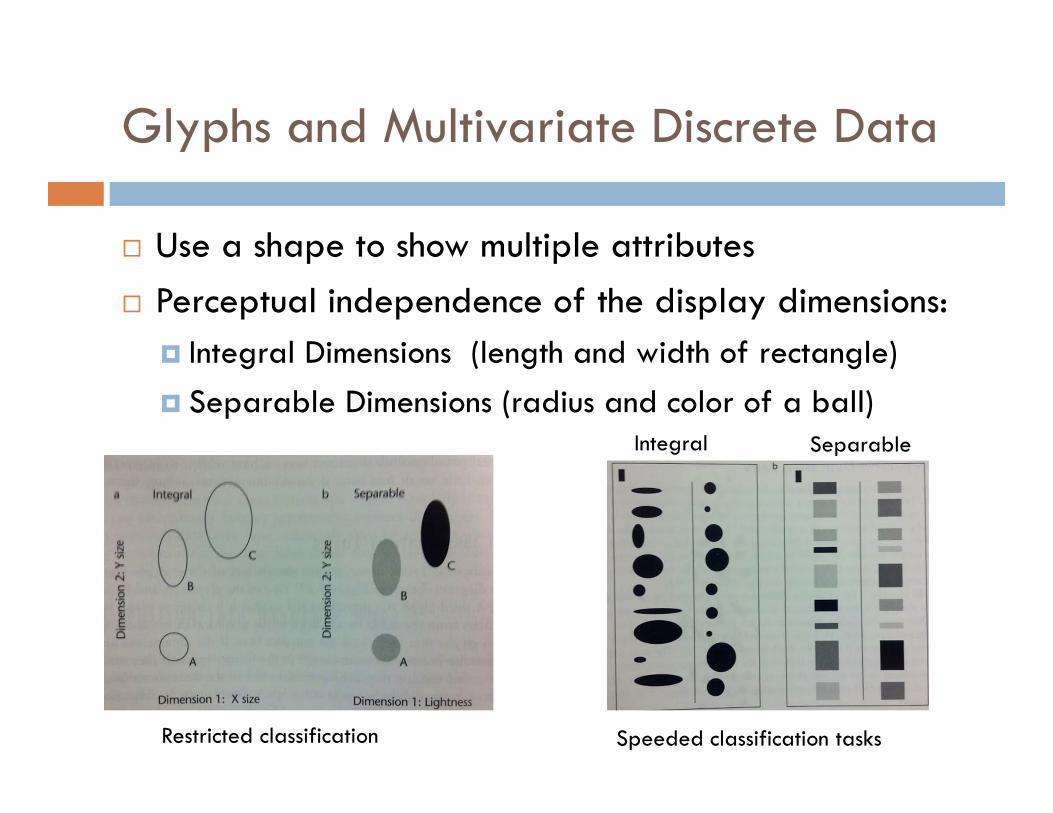
Glyphs and Multivariate Discrete Data
Use a shape to show multiple attributes Perceptual independence of the display dimensions:
Integral Dimensions (length and width of rectangle) Separable Dimensions (radius and color of a ball)
Restricted classification Speeded classification tasks
Integral Separable
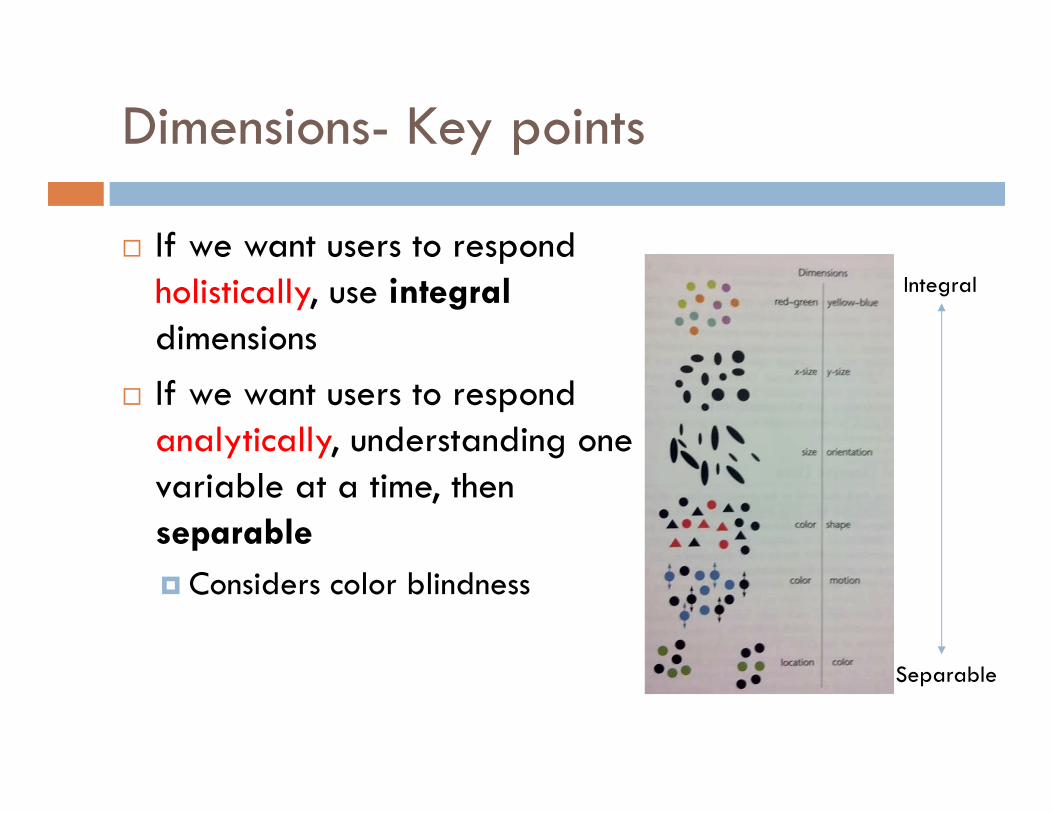
Dimensions- Key points
If we want users to respond holistically, use integraldimensions
If we want users to respond analytically, understanding one variable at a time, then separable Considers color blindness
Integral
Separable
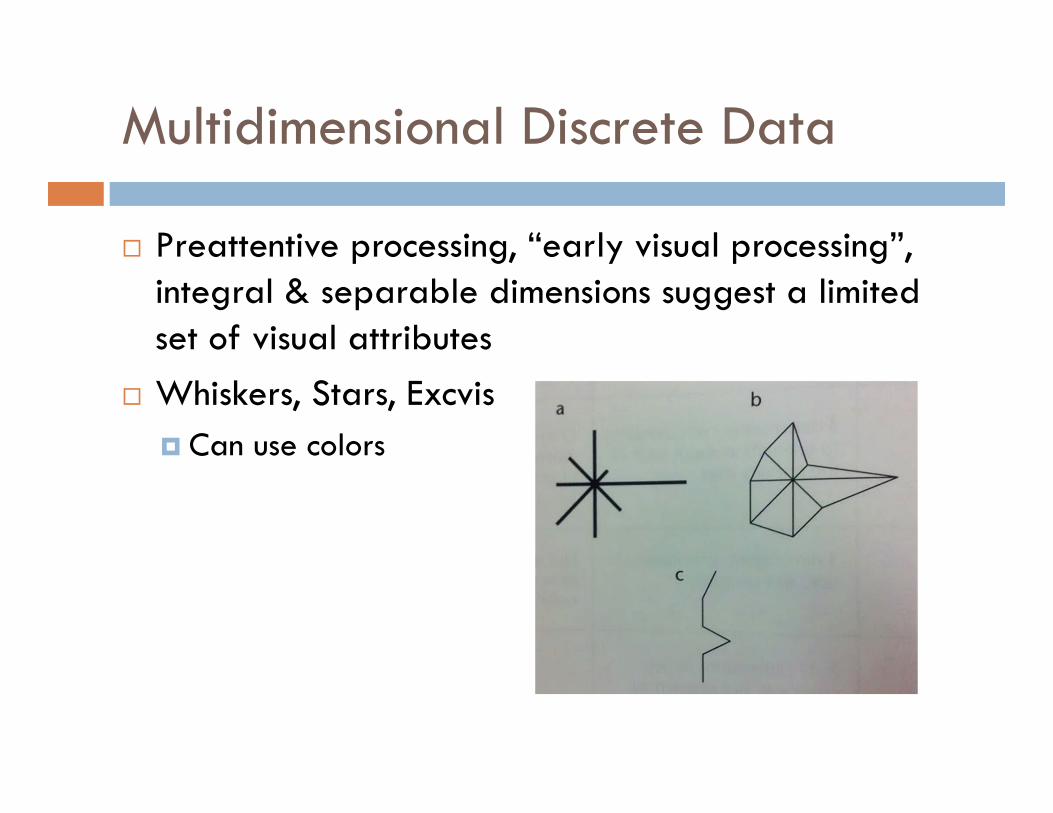
Multidimensional Discrete Data
Preattentive processing, “early visual processing”, integral & separable dimensions suggest a limited set of visual attributes
Whiskers, Stars, Excvis Can use colors
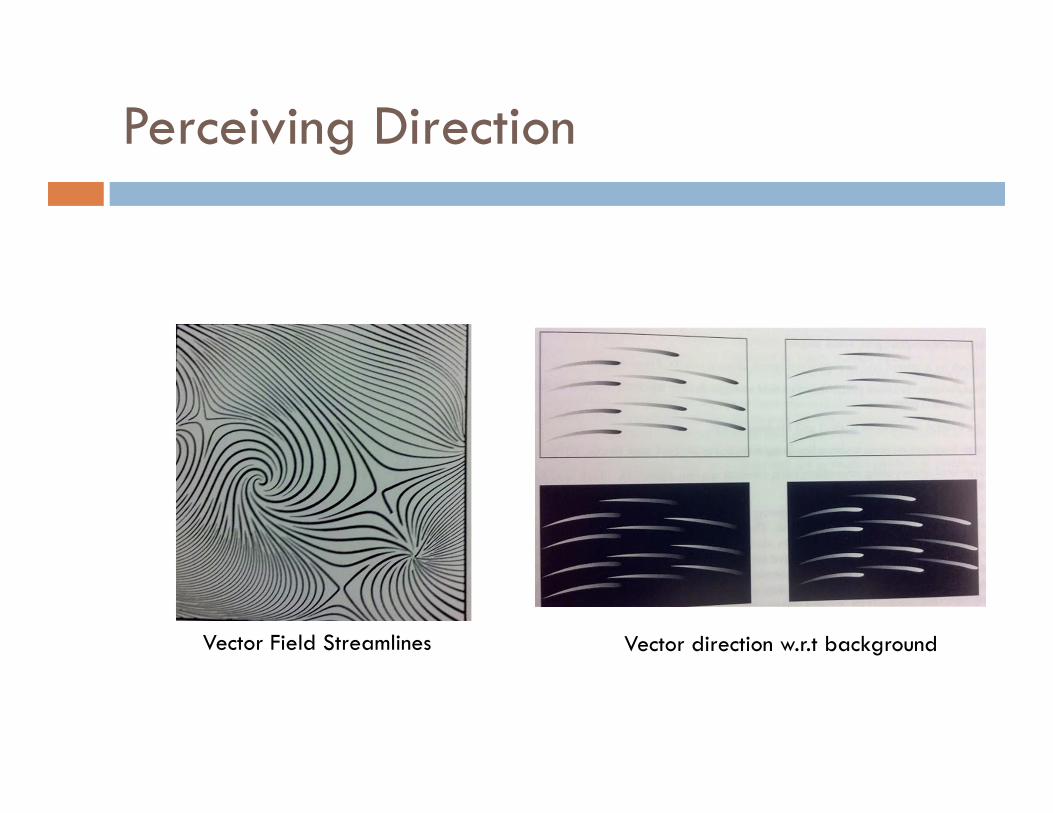
Perceiving Direction
Vector Field Streamlines Vector direction w.r.t background
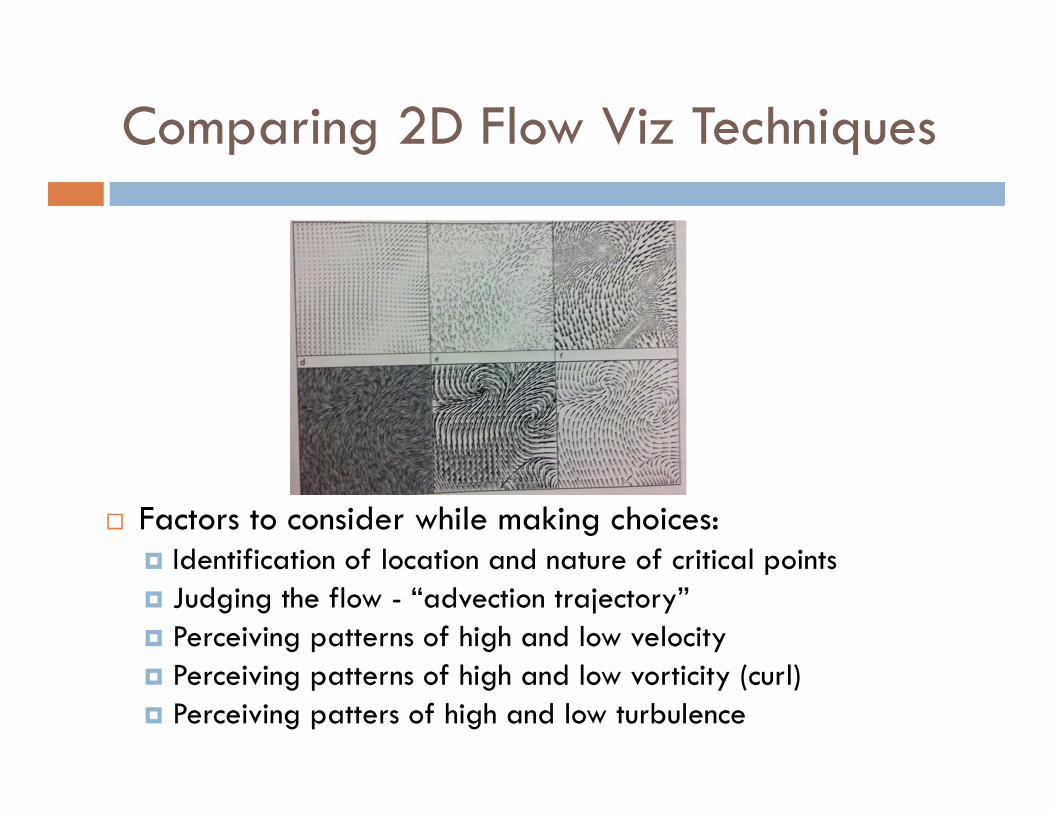
Comparing 2D Flow Viz Techniques
Factors to consider while making choices: Identification of location and nature of critical points Judging the flow - “advection trajectory” Perceiving patterns of high and low velocity Perceiving patterns of high and low vorticity (curl) Perceiving patters of high and low turbulence
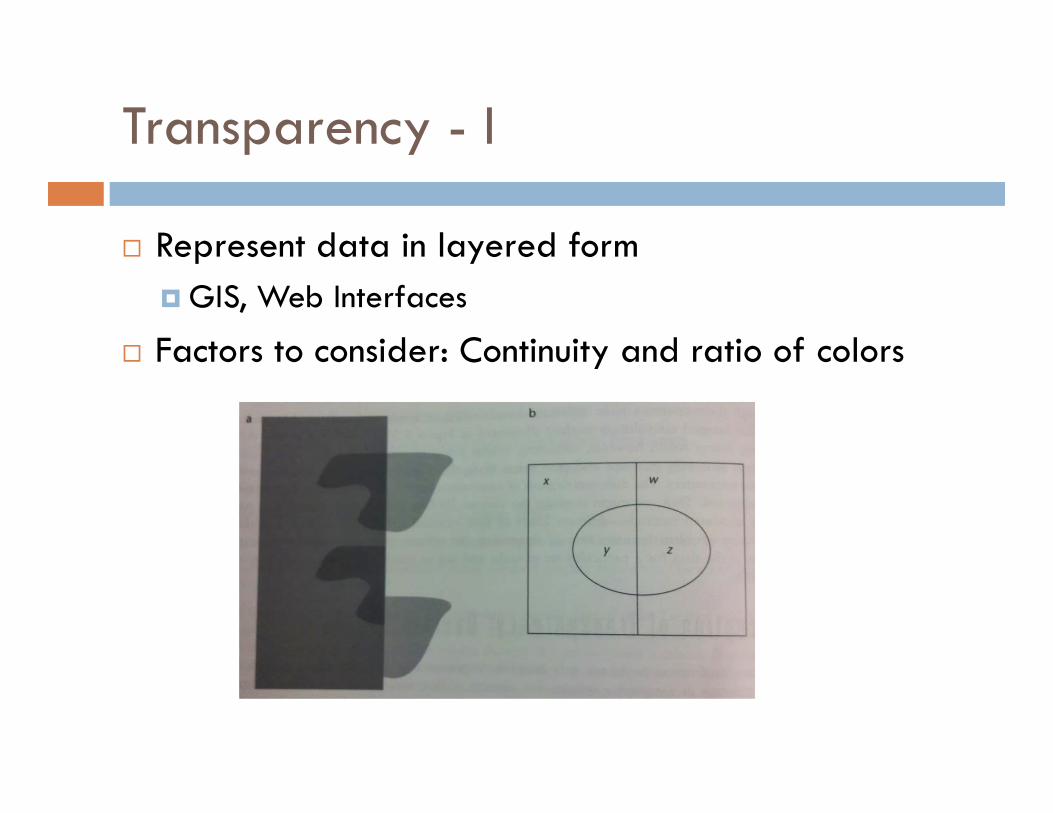
Transparency - I
Represent data in layered form GIS, Web Interfaces
Factors to consider: Continuity and ratio of colors
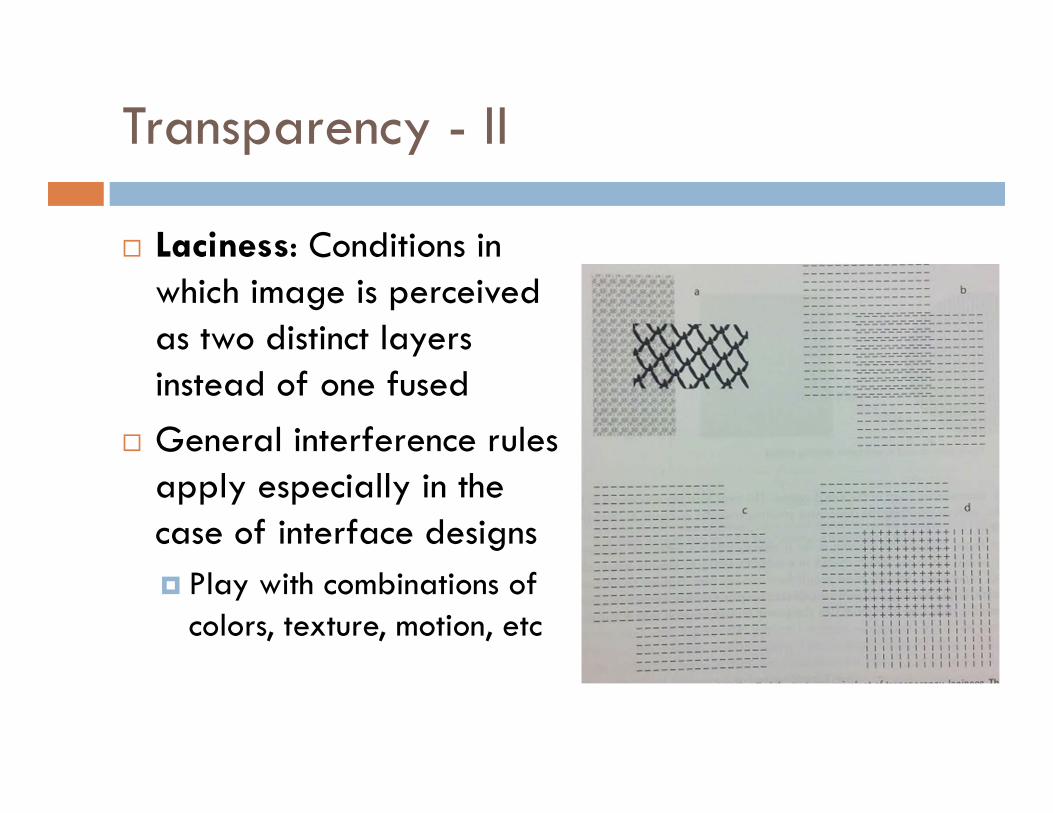
Transparency - II
Laciness: Conditions in which image is perceived as two distinct layers instead of one fused
General interference rules apply especially in the case of interface designs Play with combinations of
colors, texture, motion, etc
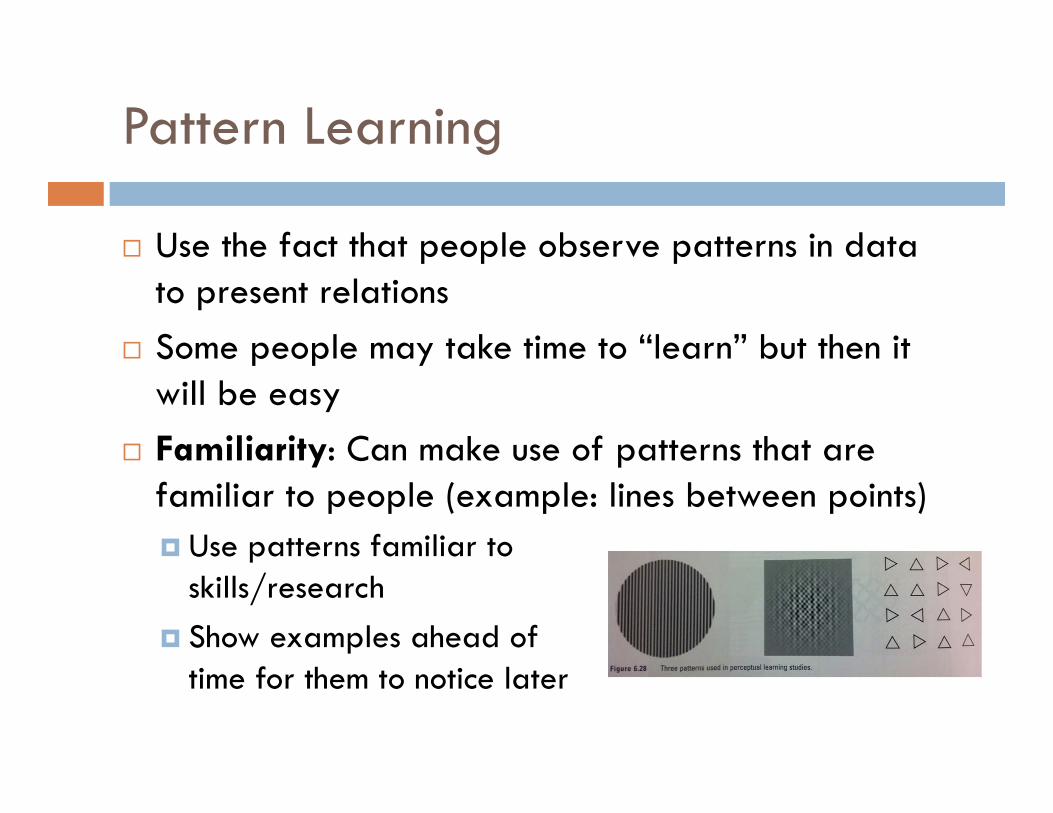
Pattern Learning
Use the fact that people observe patterns in data to present relations
Some people may take time to “learn” but then it will be easy
Familiarity: Can make use of patterns that are familiar to people (example: lines between points) Use patterns familiar to
skills/research Show examples ahead of
time for them to notice later
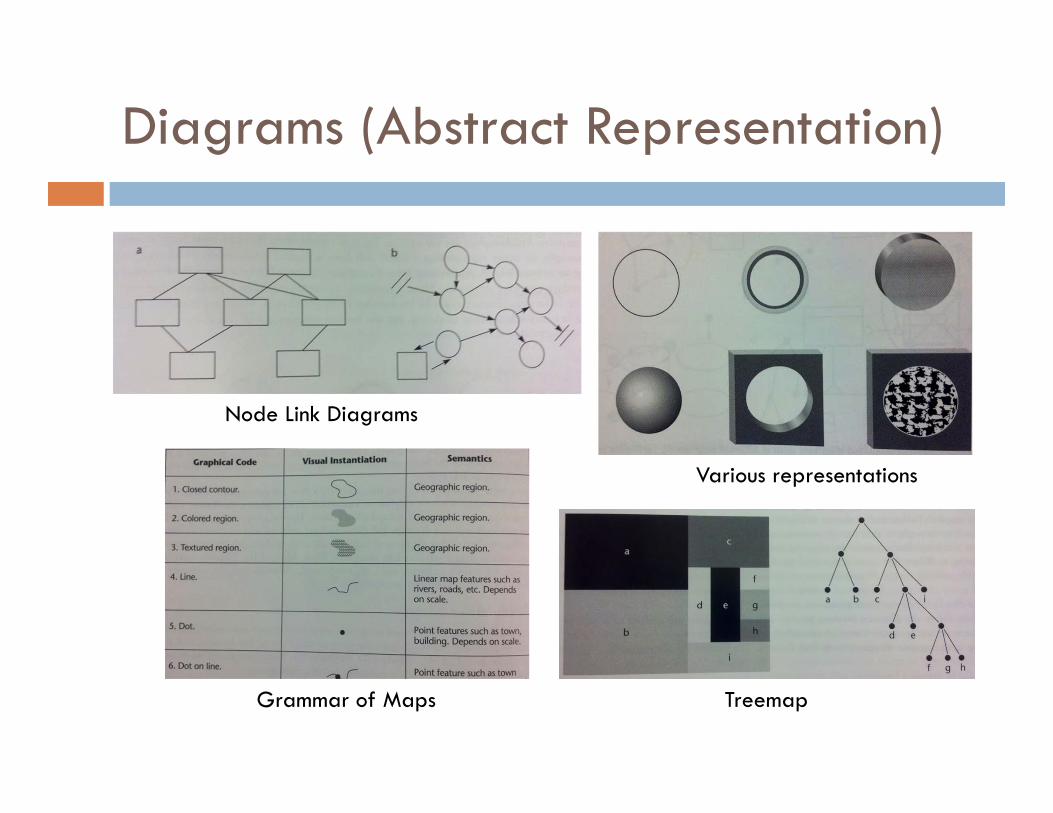
Diagrams (Abstract Representation)
TreemapGrammar of Maps
Node Link Diagrams
Various representations
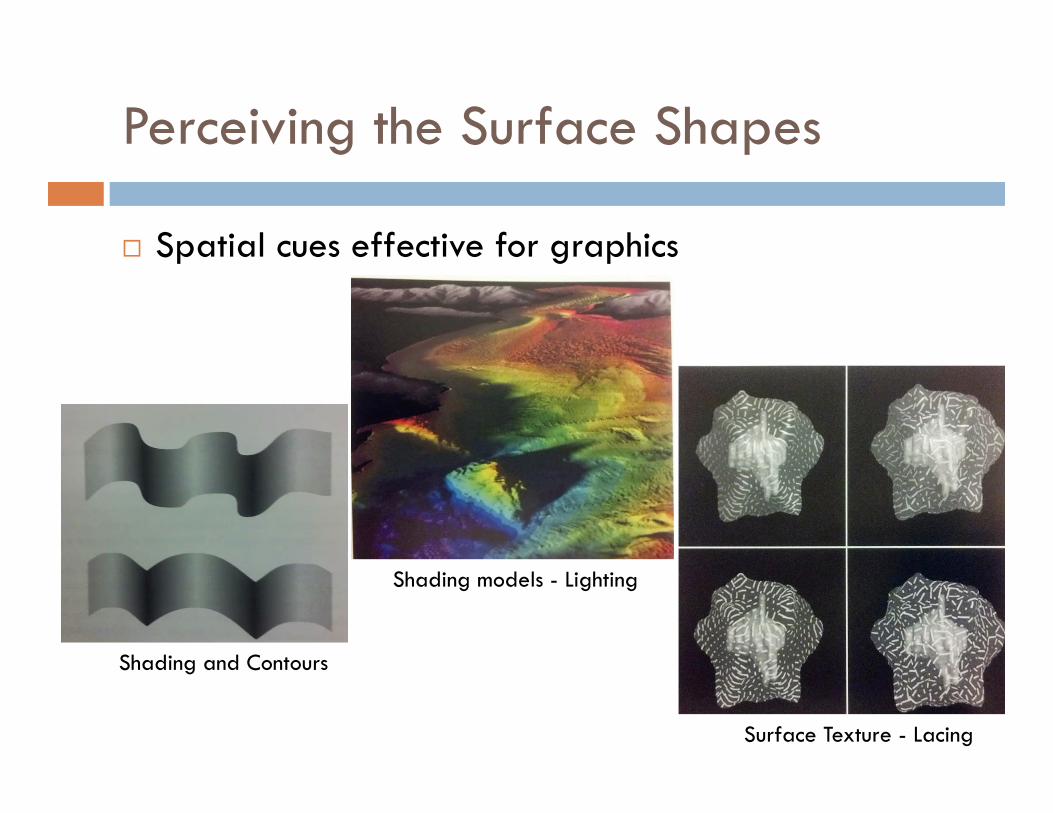
Perceiving the Surface Shapes
Spatial cues effective for graphics
Surface Texture - Lacing
Shading and Contours
Shading models - Lighting
Perceiving the Surface Shapes
General guidelines: Simple lighting model should be normally used Inter-reflection must be avoided Specular reflection is useful to reveal fine details Cast shadows can be used ONLY if they don’t interfere
with other information Surfaces must be textured, but low contrast to avoid
interference with shading information
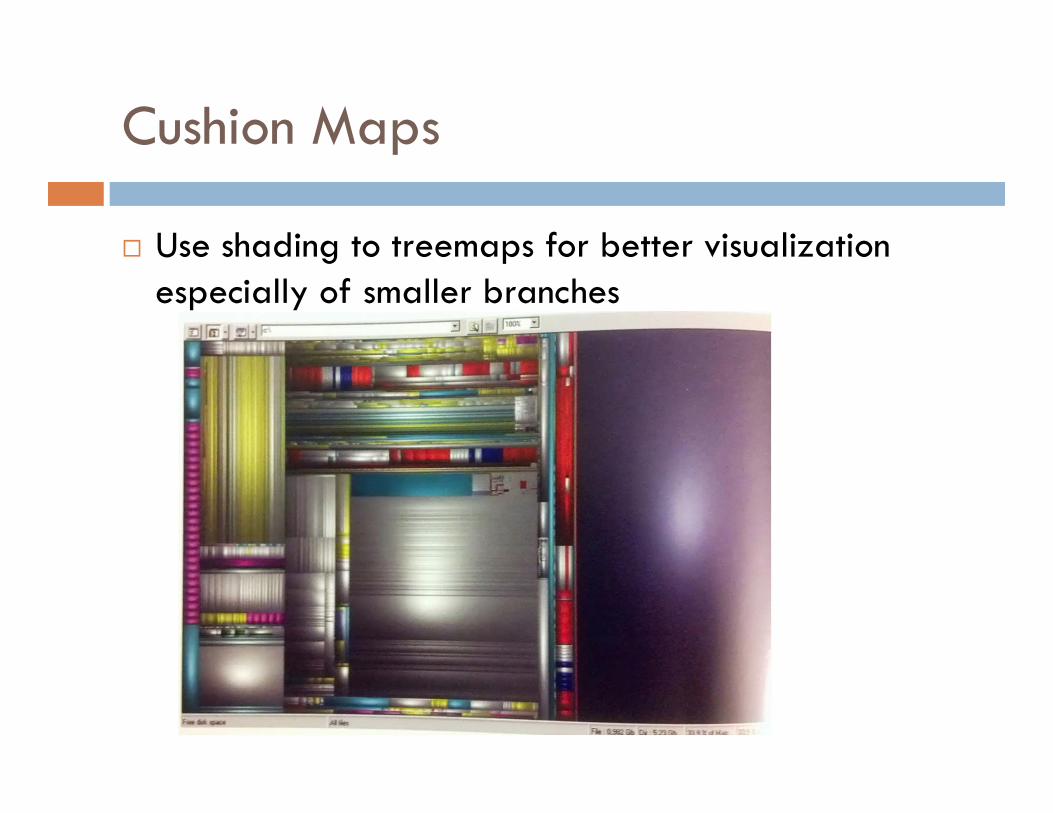
Cushion Maps
Use shading to treemaps for better visualization especially of smaller branches
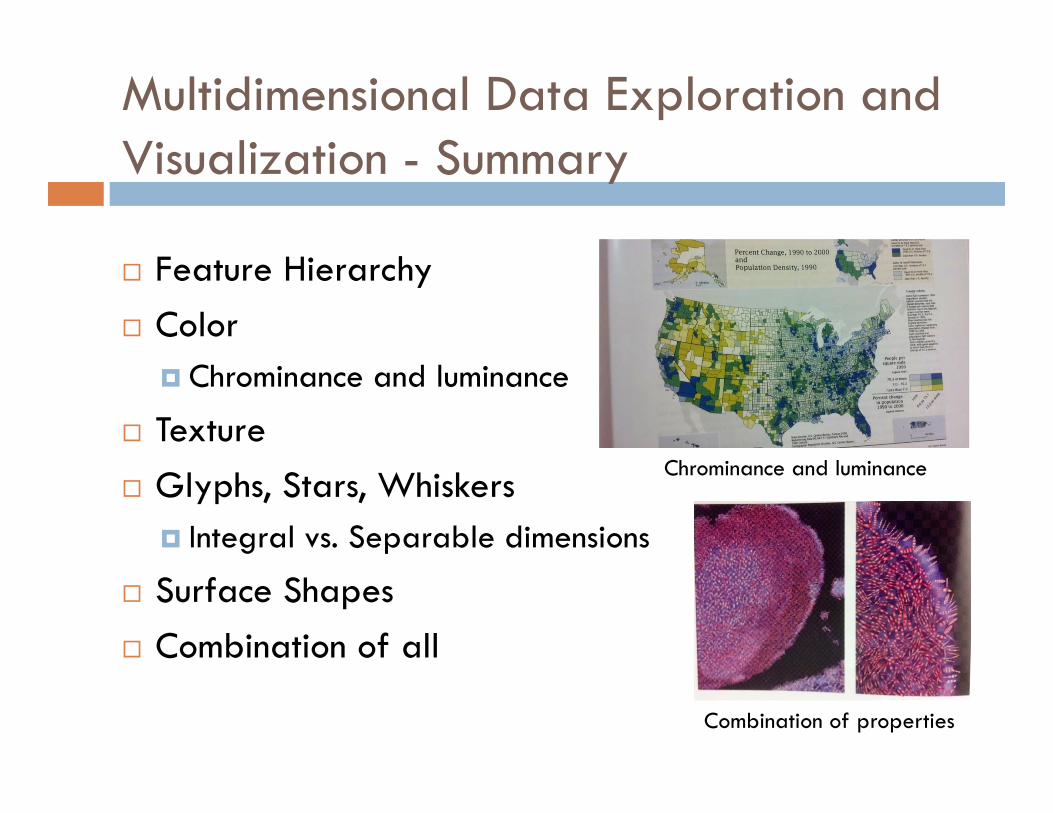
Multidimensional Data Exploration and Visualization - Summary
Feature Hierarchy Color
Chrominance and luminance
Texture Glyphs, Stars, Whiskers
Integral vs. Separable dimensions
Surface Shapes Combination of all
Combination of properties
Chrominance and luminance
Images vs. Words
Relationship between visual information and verbal/textual information, for example: labels
Images: Relationships Better remembered, but not in the case of abstract or new
information Details and appearances
Words/ spoken: Abstract concepts – freedom, etc. Procedural information Program logic Conditions in information
Images, Words, and Gestures
“Dual coding” is better Active learning in both visual and verbal cognitive subsystems
is the most effective Diexis
Use of gesture to connect spoken words to a visual reference Results in fewer misunderstandings Rules of thumb: If spoken words are to be connected to visualization, then the
image must be highlighted just before the speech If written text is to be connected o visualization, links should be
made at the end of each relevant sentence of phrase
Techniques are being applied in the design of programming languages (example: ToonTalk)
Conclusion
Preattentive Processing What attracts our attention?
Postattentive Vision Change Blindness Perceptual properties of
Color Texture/Glyphs Motion/2D Flow data Transparency Pattern Learning Diagrams Surface shapes of Objects/Cushion Maps Images, words and gestures
Different ways of displaying Multivariate Data
References
http://www.csc.ncsu.edu/faculty/healey/PP/index.html
http://www.ifs.tuwien.ac.at/~silvia/wien/vu-infovis/PDF-Files/02_perception-visualization_1up.pdf
http://ifs.tuwien.ac.at/~silvia/wien/vu-infovis/articles/fekete_2008_value-of-infovis.pdf
Ware, C., “Information in Visualization”. Second Edition, 2004.