Perception and buying behaviour of modern consumers towards personal care products
72
1 Research Report On “PERCEPTION AND BUYING BEHAVIOUR OF MODERN CONSUMERS TOWARDS PERSONAL CARE PRODUCTS” Submitted for the permission of pursuing research project report MBA-043 Under the Guidance of: Mr. Vinay Kumar (Lecturer) Submitted By: Swamit Gupta (MBA IV Semester) Roll no 0805470089 SESSION 2009-10 DEPARTMENT OF MANAGEMENT Babu Banarasi Das National Institute of Technology & Management Lucknow (U.P.)
-
Upload
swamit-gupta -
Category
Lifestyle
-
view
63.409 -
download
1
Transcript of Perception and buying behaviour of modern consumers towards personal care products

1
Research Report On
“PERCEPTION AND BUYING BEHAVIOUR OF MODERN CONSUMERS TOWARDS PERSONAL CARE PRODUCTS”
Submitted for the permission of pursuing research project report MBA-043
Under the Guidance of:
Mr. Vinay Kumar
(Lecturer)
Submitted By:
Swamit Gupta
(MBA IV Semester)
Roll no 0805470089
SESSION 2009-10
DEPARTMENT OF MANAGEMENT
Babu Banarasi Das
National Institute of Technology & Management
Lucknow (U.P.)

2
CANDIDATE’S DECLARATION
I SWAMIT GUPTA, student of MBA at BABU BANARSI DAS NATIONAL INSTITUTE
OF TECNOLOGY AND MANAGEMENT LUCKNOW, 2008-10 batch, hereby declare
that the Project Report titled ―PERCEPTION AND BUYING BEHAVIOUR OF MODERN
CONSUMERS TOWARDS PERSONAL CARE PRODUCTS‖ is the outcome of my own
work and the same has not been submitted by any Institute for the award of any degree
or any Professional diploma.
Date:
SWAMIT GUPTA
MBA IV SEM
ROLL.NO.0805470089
3
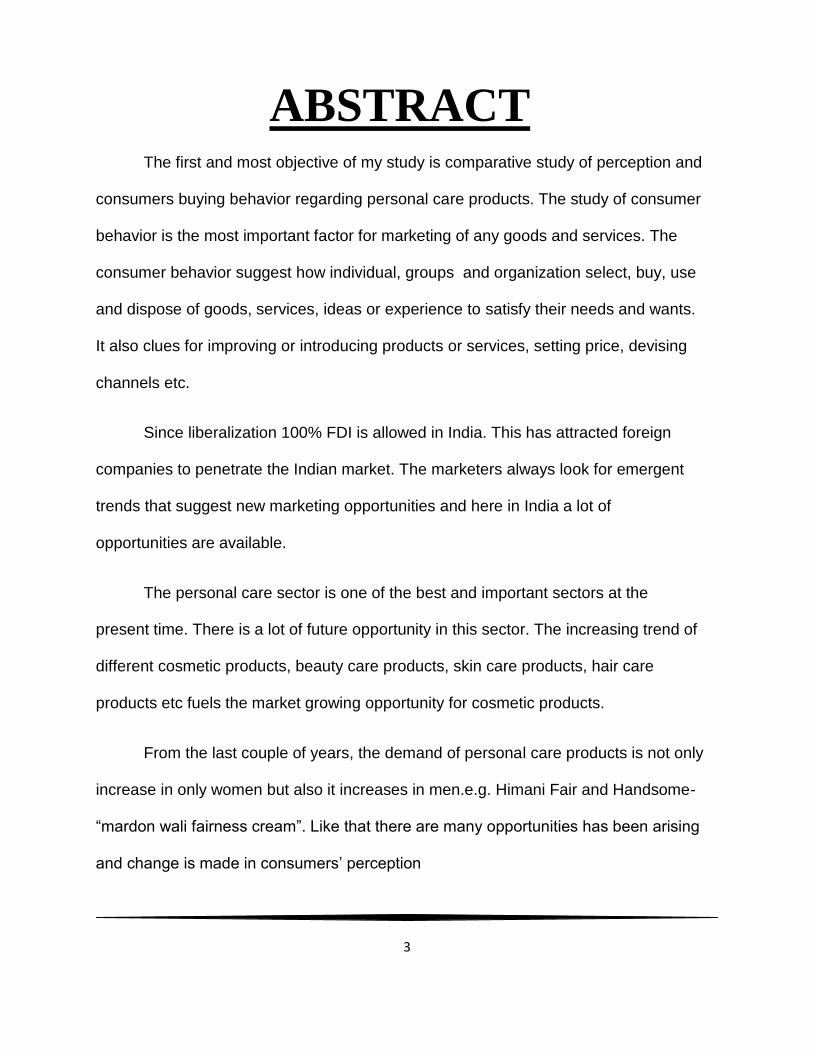
ABSTRACT The first and most objective of my study is comparative study of perception and
consumers buying behavior regarding personal care products. The study of consumer
behavior is the most important factor for marketing of any goods and services. The
consumer behavior suggest how individual, groups and organization select, buy, use
and dispose of goods, services, ideas or experience to satisfy their needs and wants.
It also clues for improving or introducing products or services, setting price, devising
channels etc. Since liberalization 100% FDI is allowed in India. This has attracted foreign
companies to penetrate the Indian market. The marketers always look for emergent
trends that suggest new marketing opportunities and here in India a lot of
opportunities are available.
The personal care sector is one of the best and important sectors at the
present time. There is a lot of future opportunity in this sector. The increasing trend of
different cosmetic products, beauty care products, skin care products, hair care
products etc fuels the market growing opportunity for cosmetic products.
From the last couple of years, the demand of personal care products is not only
increase in only women but also it increases in men.e.g. Himani Fair and Handsome-
“mardon wali fairness cream”. Like that there are many opportunities has been arising
and change is made in consumers’ perception

4
ACKNOWLEDGEMGNT
Success of my project depends upon two factors Internal and External factor
includes sincere efforts, dedication to the work and good potential whereas internal
factors includes cooperation and supports of potential customers who patiently hears
about the schemes and plans of products and then gives response.
Good guidance and cooperation from others are such external factors, which
affects the percentage of success. Though in completing this project I tried my level
best but it could not be possible without proper guidance of my profs.
I wants to give my thanks to Mr. Adnan Khan for his valuable guidance and
suggestions, which I sincerely value and appreciate.
5
Index
a) Acknowledgement
b) Preface
c) Executive summary
d) contents
1. Introduction
2. Back Ground of the Study
3. History of cosmetic products in india
4. Scope of Study
5. Need of Study
6. Objective of the study
7. Research Methodology
8. Problems & Limitations
9. Finding, Analysis & Interpretations
10. Suggestion
11. Conclusion
12. Questionnaire
13. Bibliography

6
INTRODUCTION

7
INTRODUCTION TO THE TOPIC
Generally, personal care products are these products which a consumer uses
for his personal purpose. It includes different types of cosmetic and skin care products
like talc, cold cream, fairness cream, toothpaste, toothbrush, perfume, deodorant, hair
oil, shampoo, soap, and all type of baby care and beauty care products. These are the
core FMCG products. Any person need for these products every day.
Personal care products are a part of FMCG industry. In some words we can say
that personal care products are the backbone of FMCG industry. As per the time passes
away, the demand of personal care products are also increasing day per day and future
of these products are also very bright and profitable.
There was a time when consumers not spend too much amount on the personal
care products. But in those days, they are not only eager for spending more money on
the cosmetic products, but at the same time they are looking for a good and prestigious
brand for the particular product. Modern media and advertisement plays an important
role in the increasing of demand of personal care goods. People of metro cities are too
much brand conscious but if we look at the people of semi urban and rural areas, they
are also looking for a good brand for the particular product.
Himani Fair and Handsome Mardon Wali Fairness Cream, Thanda Thanda Cool
Cool Navratna talc, International Lux etc. are the some of the front drive of
advertisement in the way of the success of personal care products.

8
BACKGROUND OF
THE STUDY

9
Background of the Study
The Indian cosmetic Industry has witnessed rapid growth over the last couple of
decades. In that time the range of cosmetic and beauty products in India has widened
tremendously. Beauty products manufacturers in India mostly cater to the great demand
for cosmetics and toiletries that fall into the low or medium-price categories as the
greatest demand in India has always been for these economically priced products.
However, in recent years in the cosmetics market India competitors have begun
to manufacture products to cater to an International need. For instance, herbal
cosmetics from India have a great demand in the overseas market and many cosmetic
products that are manufactured in India today are supplied to international suppliers of
branded cosmetics products like The Body Shop for example. New facts that have been
unveiled by a series of cosmetics business market analysis India reveal that many
International companies are now outsourcing cosmetics to India and that the industry of
cosmetic products India is growing at an average rate of almost twenty percent
annually. This increase is attributed to two main factors. The first being the increase for
the demand in Indian cost-effective products and the second being the increased
purchasing power of the average Indian.
There are also many reasons for the increased demand for cosmetic

10
products in particular. With the introduction of satellite television and a wide array of
television channels as well as the Internet, the average Indian consumer is constantly
bombarded with advertisements and information on new cosmetic products which often
translates into the desire to purchase them. A boom in the Indian fashion industry has
also been linked to the increased awareness of Indian people about their appearances
and consequently contributed to an increase in the demand for cosmetic products.
However, even with the massive surge in the popularity of cosmetic products,
statistics have shown that the average Indian consumer spends much less on cosmetic
products than consumers from every other part of the world. This means that the Indian
cosmetic industry has an even greater potential for growth than it is presently
experiencing.
In the entire range of products that fall within the territory of the Indian
cosmetic and toiletries market, the most popular items are color cosmetics, of which nail
varnish, lipsticks and lip glosses account for the most sales. In this area, popular local
brand names include Lakme and Revlon. Skin-care cosmetics have experienced a
slower growth and products such as anti-wrinkle creams, cleansers and toners, for
instance are not as popular as facial creams, moisturizers and fairness creams in this
genre. Companies like Ponds and Fair and Lovely rule the roost in this segment.
Few cultures valued beauty and cosmetic products in ancient times as the Egyptians
did. The history of ancient cosmetics can also be traced back to the culture of ancient

11
Greece and make-up was also popular in the Roman Empire. There is sufficient
evidence to suggest that people from all these three cultures used hair dyes for
instance. These people used herbal concoctions with components like henna, sage and
chamomile to darken their hair. It was only in the renaissance period that blond hair
became fashionable.
Although cosmetic products have undergone many changes in modern times, the basic
concept of using cosmetics to enhance the features of good health has not changed.
For instance, blush-on is used to conceal pale present a picture of rosy cheeks as
opposed to pale skin and nail polish can be used to conceal brittle or dry nails. The
history of makeup cosmetics however is tarnished by the ill-effects that were often
experienced after applying many ancient make-up products. This was because many
such products were created using dangerous components and also because cleansing
lotions are not anywhere to be found in the early history of cosmetics
12
History of cosmetic products in India:-
The history of the cosmetics industry includes very dark chapters in European
and Western countries from about six centuries back. Mixtures and pastes were then
used to whiten the face, a practice which remained popular till over four hundred years
later. The early mixtures that were used in Europe for this purpose were so potent that
they often led to paralysis, strokes or death. In that era, another method that was
employed to make the skin appear fairer was to bleed oneself using leeches.
Up to the late nineteenth century, women in Western countries may have
secretly worn make-up made from mixtures of household products, as make-up was
then deemed the domain of film stars. Cosmetics were only openly put up for sale in the
early part of the twentieth century for the first time. Tanned or darker skin tones became
popular only as late as the early twentieth century. It was in this era that tanning the skin
became a popular fad.
The history of cosmetics in the 1930s and 1940s shows how the fashion or
trend with respect to lipstick colors was changed annually, getting darker and closer to
red every passing year.

13
Cosmetic products were once the sole domain of film personalities and stage
actors. The use of cosmetics in those eras was restricted to the purpose of creating a
dramatic effect.
However, with the passage of time, women started using cosmetics to highlight
their facial features as well. In India beetroot was used to redden the cheeks, while in
Western countries, certain chemicals were used to darken the hair. Finally, because of
the world-wide demand for make-up for the average person, cosmetics finally became
available for sale to the common man. Some common cosmetics include lipsticks,
blush-on or rouge as it is sometimes known, eyeliners, mascaras, foundations and eye
shadows.
Lipsticks are made using color pigments, oils, waxes and often fragrances as
well. Different cosmetic companies also add various other substances to create other
effects with lipstick. The oldest use of lipstick can be traced back to almost five
thousand years ago, when women of the Mesopotamian culture and of the Indus valley
civilization are believed to have crushed semi- precious stones and mixed them into a
paste to apply to the lips for added color. Through the centuries, lipstick remained
popular with women of different cultures and while some ancient lipstick-manufacturing
techniques employed the use of potent and toxic chemicals, others used vegetable or
animal extracts. Today, a wide range of lipsticks are available in the cosmetic market to

14
cater to the various needs of the consumer. There are organic and natural lipsticks as
well as lip-gloss and lip pencils which come in a wide variety of colors to suit a huge
spectrum of skin tones. Worldwide, lipsticks are the most popular cosmetic in the
cosmetic market today.
Perfume is another popular cosmetic product. It is a fragrant mixture made using
various oils and aromatic compounds. Usually every perfume manufacturer keeps the
exact combination of ingredients a secret, especially in the case of perfumes that are
manufactured by large brand names. Rouge or blush-on is a cosmetic which is used to
redden the cheeks. In ancient times, women resorted to pinching their cheeks, or using
the extracts of mulberries, beetroot or other such extracts to color their cheeks and
acquire a healthy look. Typically women use this product to highlight cheekbones but
newer make-up techniques involve using rouge to add color to the apple of one's
cheeks. Rouge is available as a pressed powder or as a cream-based paste.
Eye liner is used to emphasize the shape of the eyes. Today there are many
kinds of eyeliners like liquid eyeliners, or kohl and kajal, all of which can be used to
create different effects and looks. Smoky eyes and the gothic look are in vogue
nowadays and these looks can be created using kohl over and under the eye with
metallic gold or silver eye shadow.
15
SCOPE OF THE
STUDY

16
Scope of the Study
The Indian cosmetic Industry has witnessed rapid growth in the last couple of
years, growing at a CAGR of around 7.5% between 2006 and 2008. With improving
purchasing power and increasing fashion consciousness, the industry is expected to
maintain the growth momentum (with marginal slowdown due to economic slowdown)
during our forecast period (2009-2012). It is projected to grow at a CAGR of around 7%
during the forecast period, says 'Indian Cosmetic Sector Analysis (2009-2012)”.
1. Increase in the Demand of Beauty products. --- From
the last few years, the demand of beauty products in India has been increased in
a good speed. Not only women but men are also very conscious towards their
face and other personal care. Many companies are engaged in producing the
products according to them. So, the market is seeking to be very bright.
2. A Large Rural Urban Penetration – The penetration ratio in
rural market is very challenging and prospective. So, there is a good scope in
these areas.

17
3. Opportunity in Semi-Urban Market—There is a good
opportunity of cosmetic products in the semi urban market. The people are
looking towards a good brand name and quality within them.
4. An Untapped Rural Market— There is an untapped market is
available for cosmetic products in the rural area in India. It is an awesome
opportunity for these companies.

18
Need of the Study
The study is done for getting a deep knowledge and idea about Indian
cosmetic//personal care sector. The need or objective of the study is to know the how
much consumers give preferences to the brand of cosmetic goods whether the
customers are satisfied with the cosmetic products of the company and how far
the company is able to satisfy the customer in terms of quality and cost factors
since in today’s modern era customers are the focus for any company, any
organization that without satisfying them no company can survive in this global
competitive age. Non satisfaction of the potential customers can lead them to switch
over to another one. Now the policy every company or organization is to provide
satisfaction as there exists a lot of competition for them. Hence it becomes necessary to
conduct a comprehensive research in terms of customer satisfaction so that it is able to
know how far it stands before others. This also helps to judge whether if there is any lag
in the policy and could take immediate action to rectify it.
The need of this project also arose because an extensive survey can help the
company whether the work done by the company in the area of new products is
able to satisfy the customers or not. The major focus of the research conducted
therefore is to discover the factors that people are aware about the upcoming
new products and the attribute of the product which attracted them for a trial. The
study was restricted to only around 50-60 percent of our target audience, because the
respondents included in the study are people who are regular user of cosmetic goods

19
OBJECTIVE
20
RESEARCH OBJECTIVE
To know about consumer’s perception and buying behavior about cosmetic
goods when they purchased it.
SUB OBJECTIVE
To determine the actual demand of consumers.
To know about the performance of popular brands of different companies in
market.

21
MAJOR COMPANIES OF
PERSONAL CARE SECTOR

22
MAJOR COSMETIC COMPANIES (WORLD WIDE)
Company:
1. L’Oréal
2. Procter & Gamble
3. Unilever
4. Estée Lauder
5. Shiseido
6. Avon
7. Beiersdorf
8. Johnson & Johnson
9. Alberto-Culver
10. Henkel
11. Kao
12. Limited
13. LVMH
14. Colgate-Palmolive
15. Kanebo
16. Coty

23
17. Yves Rocher
18. Mary Kay
19. Kosé
20. Alticor

24
MAJOR INDIAN COSMETIC COMPANIES:-
In India, there is a complete range of cosmetic companies.it includes regional
companies, national and MNCs. Hindustan Unilever leads the companies which is
followed by Godrej consumer care, Procter & Gamble, Emami, Dabur and Calvin Care.
A broad list of these companies has been given below:-
1. HUL
2. GODREJ CONSUMER CARE.
3. EMAMI
4. ITC.
5. DABUR.
6. PROCTER & GAMBLE.
7. CALVIN CARE.
8. HANKEL INDIA LTD.
9. MARICO.
10. RECKITT BENCKISER (INDIA) LTD.

25
11. COLGATE PALMOLIVE PVT. LTD.
12. CHOLYIL PVT.LTD.
13. J.K.HELEN COUTIES LTD.
14. J L MORISON INDIA LTD.
15. MODI RAVLON LTD.

26
1. HUL (Hindustan Unilever Ltd.)
CEO:- Nitin Pranjape.
Hindustan Unilever Ltd. Has takes first position in the cosmetic products selling in
India. Every one out of two peoples uses the products of HUL. There is a wide range of
variety of products of HUL in India.
Product Range (Cosmetic):-
Lux, Lifeboy, Hamam,Liril, Breeze, Dove, Pears, Rexona Fair&Lovely, Ponds,
Vasaline, Avience , Sunsilk,Clinic ,Axe, Ayush ,Lakme Surfexel,Rin,Sunlight, Wheel,
Closeup,,Pepsodent

27
2. GODREJ CONSUMER PRODUCTS LTD.
CEO:- Adi Godrej .
Godrej Consumer Care is one of the biggest companies in the field of FMCG
business. Every one out of three Indians uses the product of Godrej. It also has a wide
verity of cosmetic products.
Product Range (Cosmetic):-
Cinthol, Fair glow, Evita, No. 1, Vigil, Shikakai, Colour soft, Nupur(mehandi),
No.1, Powder hair die, Renew (hair colour), Cinthol (shampoo,deo,talc, Saving gel),
Ezee
28
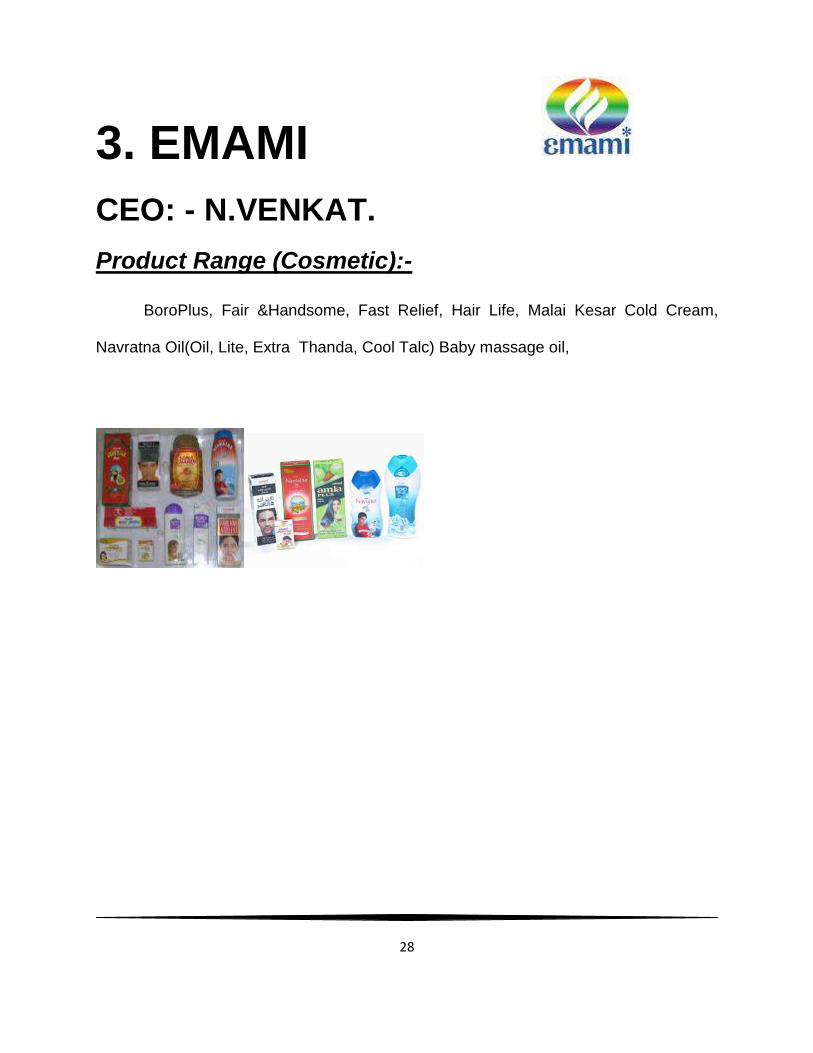
3. EMAMI
CEO: - N.VENKAT.
Product Range (Cosmetic):-
BoroPlus, Fair &Handsome, Fast Relief, Hair Life, Malai Kesar Cold Cream,
Navratna Oil(Oil, Lite, Extra Thanda, Cool Talc) Baby massage oil,

29
4. ITC
CEO: - Y.C.Deveswer
Product Range (Cosmetic):-
Essenja De Wills, Inizio, Femme, Fi ma(5varities), Vivel,Superia

30
5,DABUR :-
CEO:- Sunil Duggal.
Product Range (Cosmetic):-
Amla hair oil., Amla light oil, vatika, anmol sarson Amla,Gulabary,Crème, lotion,

31
6. P&G
CEO:-A.J.LAFELY
Product Range (Cosmetic):-
Pantene,Head & Shoulders, Gillette, Safeguard, Zest, Old Spi Olay, Aussie(shampoo),

32
7. Marico
CEO: - Saugat Gupta
Product Range (Cosmetic):-
Parachute, Medikar, Hair & Care, Santi Amla, Nihar Cemelia, Kaya Lite, Kaya Skin
Care, Aromati

33
8. CAVIN KARE CEO: - C.Ranganathan
Product Range (Cosmetic):-
Chick, Nyle, Indica, meera badam shampoo, Karthika, Fairever, Spinz(talk&deo.),nyle
coldcream

34
OTHER
COMPANIES:-
There are some other companies engaged in the business of cosmetic
products. Including them, some are the multinational companies like- L’oreal, RECKITT
BENCKISER (INDIA) LTD etc. and as well as some local giants which are perform
much better job in the cosmetic sector like-Hankel, Nirma, etc.
COMPETITION AMONG MAJOR COMPANIES:-
There is a huge competition among the companies working with the personal
care segment of FMCG industry. HUL is leading the market in many segments from last
couple of decade. But right now it is facing a good competition from the other existing
companies like P&G, Marico, Godrej Consumer Care Ltd., Dabur etc. A full data of
these companies and there market share is given in the following above table.

35
TABLE 1:- MARKET SHARE OF DIFFERENT FMCG COMPANIES IN THESE
SECTORS.
COMPANIES SHAMPOO
(%)
SOAP
(%)
DETERGENT
(%)
SKINCARE
(%)
TOOTHPASTE
(%)
HUL 44.7 47.5 36.8 47.2 28
P&G 24.3 - 14.2 6.4 -
DABUR 6.1 - - 5.0 10
ITC 6.0 10.2 9.0 6.0 -
GCPL 5.5 13.3 - 2.1 -
EMAMI
- - - 15.4 -
CAVIN KARE 5.2 5 - 12.5 -
MARICO 3.9 4.7 - 9.9 -
COLGATE - 6 - - 50.1
OTHERS 4.3 8.2 45 11.9

36
PIE CHART SHOWING DIFFERENT COMPANIES
PERFORMANCE IN DIFFERENT SECTORS:-

37
The country’s largest maker of home and personal care products, Hindustan
Unilever Ltd (HUL), has lost market share by value over the five quarters ended 31
March2009, the erosion cutting across key categories such as soaps, shampoos,
toothpastes and skin creams, even as the broader market expanded significantly
HUL lost considerable market share in soaps, detergents and shampoos that
contribute three-quarters of its sales, securities house DSP Merrill Lynch Ltd said in a
recent report, citing data from market research firm ACNielsen.
Market share for soaps, detergents and shampoos declined to 47.5%, 36.8%,
and 44.7% in the three months ended March, from 53.4%, 38.9% and 46.3%,
respectively, in the January-March quarter of 2008. In some categories such as tea and
coffee, HUL expanded its market share marginally. In tea, for instance, its share rose to
23%, from 22.6%.
In soaps, the company’s market share dropped in each of the five quarters even
as the overall soap market, according to ACNielsen, grew 18% in the year to Rs7,967
crore. HUL’s soap portfolio includes popular brands such as Dove, Lux, Hamam and
Breeze.
“Discount brands such as Godrej No.1 and Santoor have been gaining share
from HUL’s Breeze and Lux,” said India Info line’s Nagwekar.
Godrej No.1 is a product of Godrej Consumer Products Ltd (GCPL) and Santoor
is made by Wipro Consumer Care and Lighting, a unit of Wipro Ltd.

38
HUL’s market share in the laundry segment grew to around 37.8% in the quarter
ended June from 35.5% in the same period last year, according the market research
firm ACNielsen.
However, this time, the increase was not at the expense of price war with its
multinational rival Procter & Gamble Co. P&G also gained 0.5 percentage points, up to
a 7.6% share. Nirma Ltd, the Ahmedabad-based manufacturer, however, saw its market
share dip by 1.7% percentage points to 13.5%. Wheel, a value brand that, according to
Vats contributes around 50% of HUL’s laundry segment revenues, increased its market
share by 2 percentage points in the same period, with a total share of about
18%.“Laundry has been an attractive segment in the past and is likely to keep growing
in the near future. The recent price war between companies led to erosion in their
profitability but now, the industry is stabilizing,” says Umesh Sharma, an analyst at
Macquarie Securities here.
According to Vats, the laundry business is witnessing a surge in demand from
cities and HUL is focusing on Tier I and II cities to tap that demand.

39
LITERATURE REVIEW
LITERATURE RIVEW
Indian cosmetic industry is one of the profitable and stable sector. There is a
bright and golden opportunity in this sector. Many of the scholars, research agencies
has done their research on this sector and given their own different views and
suggestions.
The global outlook series on Personal Care Products provides a collection of
statistical anecdotes, market briefs, and concise summaries of research findings. The
report offers exclusive preludes, and primers on the global Cosmetics and Toiletries
markets such as Skin Care Products, Hair Care, Oral Hygiene, Shaving Products, Bath
& Shower Products, Facial Care, Lip Care, Feminine Hygiene Products, Deodorants,
Fragrances & Perfumes, and Baby Toiletries. The report also includes a compilation of
recent mergers, acquisitions and strategic corporate developments. Major regional
markets discussed include United States, Japan, Europe, France, Germany, Italy, UK,
Spain, Asia, China, India, South Korea, Brazil, and Mexico, among others. The report
also includes an indexed, easy-to-refer, fact-finder directory listing the addresses, and
contact details of 997 companies worldwide.

40
The specific product segments analyzed are Stick & Solid Deodorants, Spray
Deodorants, Roll-On Deodorants, and Other Deodorants (Creams, Gels and Wipes).
The report provides separate comprehensive analytics for the US, Canada, Japan,
Europe, Asia-Pacific, Middle East, Latin America, and Rest of World. Annual forecasts
are provided for each region and product segment for the period of 2001 through 2015.
A ten-year historic analysis is also provided for these markets with annual market
analytics. The report profiles 186 companies including many key and niche players
worldwide such as Beiersdorf AG, Church & Dwight Co., Inc., Colgate-Palmolive
Company, Henkel KGaA, Kao Corp., Lion Corporation., Procter & Gamble Company,
Sara Lee Corporation, and The Unilever Group.
The specific product segments analyzed are Traditional Lip Care Products,
Medicated and Therapeutic Lip Care Products, and Sun Care (Lip Care) Products. The
report provides separate comprehensive analytics for the US, Canada, Japan, Europe,
Asia-Pacific, Middle East, and Latin America. Annual forecasts are provided for each
region for the period of 2001 through 2015. A ten-year historic analysis is also provided
for these markets with annual market analytics. The report profiles 127 companies
including many key and niche players worldwide such as Beiersdorf AG, Blistex Inc.,
Carma Laboratories, Chattem Inc., GlaxoSmithKline PLC, Johnson & Johnson,
Laboratoire Dermophil Indien, L’Oreal SA, Rohto Pharmaceuticals Co., Ltd.,
Mentholatum Company, Inc., The Body Shop International Plc, Unilever NV, Vichy
Laboratories, and Wyeth Corporation. Market data and analytics are derived from
primary and secondary research.
41
The major product segments analyzed are Face Care Products (Facial
Moisturizers,Facial Cleansers, & Others), Body & Hand Care, and Depilatories (Hand &
Body Lotions/Creams, & Others), and, Sun Care Products.The report provides
separate comprehensive analytics for the US, Canada, Japan, Europe, Asia-Pacific,
Latin America, and Rest of World. Annual forecasts are provided for each region and
product segment for the period of 2001 through 2015. A ten-year historic analysis is
also provided for these markets with annual market analytics. The report profiles 697
companies including many key and niche players worldwide such as Amway Corp.,
Avon Products, Inc., Beiersdorf AG, Chattem, Inc., Clarins, Estee Lauder, Inc., Johnson
& Johnson, AMBI Skincare, Neutrogena Corp, Kao Corporation, Kao Brands Company,
Kracie Holdings Ltd., L’Oréal S.A, Nu Skin Enterprises, Inc., Oriflame Cosmetics AB,
Playtex Products Inc., Procter & Gamble, Revlon, Inc., Sara Lee Corporation, Schering-
Plough Corp., Shiseido Co. Ltd., and Unilever N V. Market data and analytics are
derived from primary and secondary research.

42
RESEARCH METHODOLOGY

43
RESEARCH METHODOLOGY :-
METHOD OF DATA COLLECTION
a) Primary Data
b) Secondary
My research aims to gather primary data for understanding Consumer behavior through
questionnaire.
DATA SOURCE
Primary data is the first hand data, which are selected a fresh and thus happen to be
original in character. Primary Data was crucial to know various customers and past consumer
views. The research is descriptive type of research survey includes research instrument like
questionnaire which can be structured and unstructured.
`
Secondary data are those which has been collected by some one else and which
already have been passed through statistical process. Secondary data has been taken from
internet, newspaper, magazines and companies web sites.
SAMPLE DESIGEN AND TYPE
Simple random sampling.
UNIVERSE
Lucknow.
SAMPLE SIZE
Sample for questionnaire is 150 persons.

44
SAMPLE UNIT
Sampling unit is individual customers.
STATISTICAL TOOLS
Bar charts, Pie charts.

45
SAMPLE
While deciding about the sample of research, it is required from the researcher’s point
to pay attention to these under mentioned points:
a) Sample Units: A decision has to be taken concerning a sampling unit
before selecting a sample, sampling unit may be a geographical one such as state,
district, village Etc. so in this research sampling unit is individual consumer in lko.
b) Source list: It is also called sampling frame from which sample is to be
drawn, it caters name of all the items of a universe (in case of finite universe
only).Researcher has to prepare it
c) Sampling size: This refers to the no. of items to be selected from the
universe to constitute a sample. This is a major problem before the researcher. The size
of sample should neither be excessively large not too small, it should be optimum. This
size of population must be kept in view for this also limits the sample size .Sample size
in this research is 150 customers.
d) Sampling procedure: Finally the researcher must decide the type of
sample he must be .That is he must decide about the technique to be used in selecting
items for the sample .In fact this technique or procedure stands for the sample design

46
itself. In this we used the random sampling on the basis of first survey results, which is
from 150 respondents.
INSTRUMENTS USED
We collected primary data through sample survey or census surveys from the selected
elements in malls and super markets. So for this purpose we have used the most
popular tool of primary data collection through direct communication with respondents.
The tools we used are questionnaires.
METHOD OF DATA COLLECTION
Actually data is of two kinds so researchers should keep in mind both types of data.
a) Primary Data: Primary data are those, which are collected afresh and for the
first time and this happen to be original in character.
b) Secondary Data: Secondary data are those data which have already been
collected by someone else and which have already been used as per required.

47
There are basically two sources to collect secondary data
a) Internally: Provided by the company/organization
b) Externally: Various publication of central, state and local Government.
• Books, magazines, newspapers
• Internet
After only keeping in mind one can think about what type of data has to be collected
during research as our research is concerned we have to gather primary data for
Customer behavior
QUESTIONNAIRE
This method is more popular .The questionnaire is sent to the person concerned
to answer the questions formatted and return the same soon.
A Questionnaire consists of a number of questions printed or typed in definite
order on a form or set of forms. The Questionnaire is sent to the respondents. In order
to achieve the research objective it is necessary to collect accurate and relevant data,
secondary data are already published data collected for purposed other than the
specific research needs at hand.

48
Primary data that are collected specifically for the research situation at hand,
were collected by surveys ,using respondents surveys is one of the ways of collecting
primary data namely observations, experiments and surveys .

49
DATA ANALYSIS

50
DATA ANALYSIS :-
There is a number of data analysis has been done on the basis of questionnaire
and different basis. Theses basis of questionnaire has been made on different
preference and buying habit of consumers. The data analysis is given as follows:-

51
TABLE 1:- EXPENDITURE ON COSMETICS
expenditure No of consumers
0-500 30
500-1500 50
1500-2500 60
Above 2500 10
20%
33%
40%
7%
0-500 500-1500 1500-2500 above 2500
no of consumers
no of consumers
.

52
Interpretation:-
The above data shows the expenses percentage of consumers on cosmetic
products. According to this table, 20% of consumers below 500 Rs. on cosmetic items,
33%peoples spend Rs.500-1500 on cosmetics.40 % consumers spend Rs.1500-2500
on cosmetics. At last remaining 7% consumers spend more than Rs.2500 on cosmetics.

53
TABLE 2:- VALUE TO THE DIFFERENT PURCHASING FACTORS
1 2 3 4 5
1. Price
2. Packaging
3. Ingredients
4. Location of retail store
5. Promoters’ service
6. Function
Interpretation :-
The above table shows the measurement of different quality factor of a product on the
basis of a lickert scale. As the result, there is a good priority has been given to the
price of the product. An excellent priority is given to the ingredients and function.
Consumer also looking for a very good durability of a product. There is a very average
priority is given to the look of a product for purchase criteria.
TABLE 3- TRUSTWORTHINESS OF BRANDS

54
Factors No. of consumers
Product origin 30
Awards received 50
Laboratory reports 50
Editorial recommendation 20
0
10
20
30
40
50
60
no of consumers
Interpretation: - The above data shows that the 33% of consumers trust on brands on
the basis of awards received by the brands & laboratory reports. Only 20% of
consumers want to know product origin.

55
TABLE 4:- SOURCES OF BRAND AWARENESS.
SOURCES NO. Of CONSUMERS
Internet 20
Seminar 10
Newspaper 60
Samples 25
Leaflets 10
Words of mouth 25
2010
60
25
10
25
Internet Seminar Newspaper Samples Leaflets Words ofmouth
Chart Title
Column2

56
Interpretation:-
The above table shows the different sources from where consumers are able to
know about cosmetic products. 50% of the consumers are getting aware with the
products from advertising in T.V or some other medium. 28% of the consumers are
get aware about the product by their friends.23% of consumers are able to know
about the products through some other sources like free sampling, mass media,
brand promotion etc.

57
TABLE 5:- areas interest the consumer most
Area No. of consumers
Discount 60
Latest product 50
Product reviews 10
beauty 30
60
50
10
30
0
10
20
30
40
50
60
70
Discount Latest product Product reviews beauty
Column1
Column1
Interpretation: - The above data shows the customer interest.40% of customer look
for discount and 33% of consumers take interest towards the availability of latest
product in the market and 20% are beauty conscious.

58
TABLE 3: BRAND CONCIOUSNESS OF PEOPLE
BRAND
CONCIOUSNESS
N0. 0f consumers
Yes 110
No 15
For some products 25
79%
8%13%
YES NO FOR SOME PRODUCTS
BRAND COCIOUSNESS
YES NO FOR SOME PRODUCTS
Interpretation:-
The above table shows the brand consciousness of the common consumers. On the
basis of above table, at the present time there are 79% people of India are brand
conscious 13% consumers are brand conscious for only few brands and remaining 8%
people who belongs to backward areas are not brand conscious

59
TABLE6:- PREFERECE OF DIFFERENT BRANDS (COUNTRY WISE)
brands No. of consumers
National 82
international 51
Local 17
55%
34%
11%
NATIONAL INTERNATIONAL LOCAL
PREFERENCE OF BRANDS
NATIONAL INTERNATIONAL LOCAL

60
Interpretation:-
The above data table shows the preference of consumers towards different
brands of cosmetic products on the basis of country. 55% of consumers prefer the
brands of different national companies. The main reason is less price and relatively
good quality. 34% consumers prefer the brands international companies or imported
products. These consumers contains models, relatively rich people, professionals etc.
last 11% consumers prefers local goods.
TABLE7: - SHOPPING HABIT OF CONSUMERS FOR PLACE

61
places No. of consumers
Malls 32
Supermarkets 72
Traditional shops 37
e-shopping 9
21%
48%
25%
6%
MALLS SUPER MARKETS TRADITIONALSHOPS
E- SHOPPING
SHOPPING HABIT OF CONSUMER
SHOPPING HABIT
Interpretation:-

62
The above data shows the different habits of consumers during they are on a
way to purchase the products. There was a time when consumers gone to only one or
two stores available in an area. They purchase only those things which the retailer gives
them. At the time, the consumers have very limited choice due to unavailability of more
retail stores in an area. But now a day there is a bunch of availability of super markets,
malls, and different ways to shopping. At the present time, 48% of people goes to a
super market, 25% goes to same old traditional stores, these persons are either
from backward area or some semi urban areas. 21% peoples goes to malls for
shopping, these are the peoples of metro cities or good developed city like
Lucknow, Ahemdabad, and Pune etc. Remaining 6% people deals with e- shopping.
TABLE 8:- FFECTING FACTORS RESPONSBLE FOR THE BUYING DECISION OF
CONSUMERS.
Effecting factors No of consumers

63
Company 17
Packaging 28
Brand name 57
price 48
BRAND NAME38%
PRICE32%
PACKAGING19%
COMPANY11%
EFFECTING FACTORS
Interpretation:-

64
The above table shows the different factors which effects the buying decision
of the consumers. At the present time more than 35%(38%) of consumers prefers the
brand name before purchasing of a cosmetic product. 32% of consumers prefers price
as a important factor in the purchasing of a cosmetic product. 19% preference goes to
the packaging and remaining 11% preference goes to reputation of companies.

65
CONCLUSION AND
SUGGESTION

66
CONCLUSION:- As the research has shown the comparison between customer buying behavior
regarding Indian and International product in recent time. Since the consumer buying
behavior is the important factor to forecast the sales of any product in a particular
area. So company should keep close eye on the market situation. yet, customer
were price sensitive, but the changing market trend and customer view and
preference shown that customer are now quality sensitive .They want quality
product, good services, easy availability of product and better performance by the
product.
These days no of customer buying from malls has been increased. Also the
frequency to visit the malls has been increased substantially. People are more
brands conscious and they are satisfied with the range of products available there.
We can conclude from our study that still more inclination is towards indigenous
product the preference ratio of indigenous to imported products is 7: 3This is
because of the relatively higher price of imported product.

67
Suggestions
1. Customer like best quality product on any price, so company should add
latest technology to their products.
2. After sales services is the area where Indian and International Company can
highly satisfy the existing customer, because they can make more customer through
their word of mouth. So Indian and International Company should provide latest and
reliable service to their customers.
3. Customer’s behavior always looks for some extra benefit with purchasing. They
demand for affordable price for product and gifts with purchasing.
4. International Company should make strategy to cater every income group
customers in city. Upper income group are affordable to purchase but lower
income group is not. So International Company should make policies to send
their product and every home.
5. The Indian company should give more emphasis on advertising to create
market awareness and to make a brand image in the minds of investors.

68
6. Companies should do more publicity through road shows, newspaper and
advertisement. As this will create awareness about he fund and schemes that are at
present managed by the International Company.
7. They should keep a close eye on competitor strategy.

69
Reference:-
News paper: - The Economic Times.
Business Standard.
Journals: - Business World, Business Today.
Website: - www.wikipedia.com
www.fmcgmarketers.blogspot.com
www.google.com
www.a2zmba.com
Book: - Kotler Philip, Principle of Management
Kothari C R, Research Methodology

70
A) PERSONAL BACKGROUND
a. Name……………
b. Gender………….
c. Age
Blow 18 18-22 23-27
28-32 above 32
d. Education level
Primary secondary hr. Secondary
Graduate post graduate
e. Monthly income
<10,000 10,001-20,000 20,001-30,000
30,000-40,000 >40,000
B) GENERAL CONSUMPTION DETAILS
7. On an average how much do you spend on personal care product each
month?
0-500 500-1000 1000-1500
1500-2500 above 2500
(Please indicate the importance of the following criteria in choosing your
personal care products 1-most imp; 5-least important)
1 2 3 4 5
8. Price
9. Packaging
10. Ingredients
11. Location of retail store

71
12. Promoters’ service
13. Function
14. How do you determine the trust worthiness of the cosmetic brand you are
using?
Product origin Awards received
Laboratory recommendation Editorial recommendation
C) RELATIONSHIP BETWEEN PRODUCTS KNOWLEDGE AND
CONSUMPTION
15. How do you get to know your cosmetic products?
Internet Sample
Newspaper leaflets
Seminars words of mouth
16. Which areas interest you the most?
Discount Latest product
Product reviews Beauty
17. Are you satisfied with the variety of brand availability in the market?
Yes No
18. If yes you prefer?
National brand International brand
19. Where do you like to go for shopping?
Super market Mall
Traditional shop e-shopping

72
20. How do you differentiate one brand from the other?
Brand name spokesperson
Function Leaflets
21. What kind of promotion would you attract you to buy skin care products the
most?
Newspapers seminars
Promoters’ persuasion Leaflets & TV comments