Perceived environmental change as a determinant of ...
19
Journal of Management and Marketing Research Volume 18- February, 2015 Perceived environmental change, Page 1 Perceived environmental change as a determinant of managerial information seeking behavior John Leaptrott Georgia Southern University J. Michael McDonald Georgia Southern University ABSTRACT Environmental scanning is a necessary component of the strategic management process. Several prior studies have examined aspects of purposeful information search behavior related to the business environment because it is deemed to be a necessary component of the formulation of business policy and strategy. This study used a sample of managers in the credit union industry to assess how the managers’ information search behavior related to various environmental sectors was affected by their perceived rate of change in those sectors. The study measured the managers' use of five different types of information sources related to each of six environmental sectors. The five types of information sources included internal and external personal and written sources and the use of the Internet in their environmental scanning behavior. The six sectors were equally divided between the task and general environments. The hypothesized positive relationship between perceived sector importance and search behavior, measured by the frequency of information source usage, was supported for sectors related to the general environment, but not for sectors related to the task environment. Keywords: Strategy, Environmental Sector Uncertainty, Environmental Sector Rate of Change, Environmental Sector Scanning Copyright statement: Authors retain the copyright to the manuscripts published in AABRI journals. Please see the AABRI Copyright Policy at http://www.aabri.com/copyright.html
Transcript of Perceived environmental change as a determinant of ...

Journal of Management and Marketing Research Volume 18- February, 2015
Perceived environmental change, Page 1
Perceived environmental change as a determinant of
managerial information seeking behavior
John Leaptrott
Georgia Southern University
J. Michael McDonald
Georgia Southern University
ABSTRACT
Environmental scanning is a necessary component of the strategic management process.
Several prior studies have examined aspects of purposeful information search behavior related to
the business environment because it is deemed to be a necessary component of the formulation
of business policy and strategy. This study used a sample of managers in the credit union
industry to assess how the managers’ information search behavior related to various
environmental sectors was affected by their perceived rate of change in those sectors. The study
measured the managers' use of five different types of information sources related to each of six
environmental sectors. The five types of information sources included internal and external
personal and written sources and the use of the Internet in their environmental scanning
behavior. The six sectors were equally divided between the task and general environments. The
hypothesized positive relationship between perceived sector importance and search behavior,
measured by the frequency of information source usage, was supported for sectors related to the
general environment, but not for sectors related to the task environment.
Keywords: Strategy, Environmental Sector Uncertainty, Environmental Sector Rate of Change,
Environmental Sector Scanning
Copyright statement: Authors retain the copyright to the manuscripts published in AABRI
journals. Please see the AABRI Copyright Policy at http://www.aabri.com/copyright.html

Journal of Management and Marketing Research Volume 18- February, 2015
Perceived environmental change, Page 2
INTRODUCTION
The common normative model of the strategic management process describes an ongoing
proactive process where management personnel assess the environment and, when necessary,
modify an organization’s operations to better accommodate perceived environmental changes in
order to improve the chances of reaching strategic objectives (Aguilar, 1967: Hambrick, 1982).
This process may be affected by the degree individual managers perceive environmental changes
as potentially beneficial or threatening to the organization. One such perception is the rate of
change in a particular element of the environment. Higher rates of change could foster increased
managerial uncertainty which would, in turn, result in higher levels of information seeking
behavior in an attempt to reduce that uncertainty (Daft, Sormunen & Parks, 1988; Nadkarni &
Barr, 2008; Forbes, 2007). The present study tests how the degree managers’ information
seeking behavior involved in scanning and assessing the environment, using a variety of
information sources, is related to their perception of the rate of change in individual
environmental sectors.
Many previous studies aggregated perceived environmental sector importance with
perceived environmental sector complexity and environmental sector rate of change into the
single latent predictor variable, perceived strategic uncertainty. The present study focuses on the
more direct relationship between perceived environmental sector rate of change and scanning
frequency and, in doing so, avoids some of the methodological problems involved combining
observed variables into a single calculated latent variable. Using this methodology, the
relationship between perceived sector rate of change and scanning frequency for five information
sources was measured in six environmental sectors encompassing both the task environment and
general environment.
LITERATURE REVIEW AND HYPOTHESES
Organizations operate in dynamic environments. This dynamism has been described as
the “velocity” of the environment consisting of the direction and rate of change in the various
environmental sectors (Bourgeois & Eisenhardt, 1988). Initially, the description of industry
velocity has been somewhat coarse with industries typically being described as “low”, “medium”
or “high” based on an aggregation of velocities in the environmental sectors affecting the
industry (McCarthy, Lawrence, Wixted & Gordon, 2010). McCarthy et al. (2010) suggest a
much more nuanced framework for describing environmental velocity that considers how
velocity varies across environmental dimensions such as technology, products, demand,
regulatory requirements and competitive activity and how the velocity of the various dimensions
are causally linked.
Regardless of how the velocity or rate of change of elements in a task or general
environment can be defined, organizational leaders will likely base their responses to changes in
the environment based on their perceptions of those changes. Realistically, the process of
scanning and interpreting the information that is derived from the process is subject to certain
individual and organizational resource limitations. Organizations may or may not have
organizational structures in place to closely monitor and assess changes in their industry’s
environment. A large public company may be involved in several industries simultaneously
Journal of Management and Marketing Research Volume 18- February, 2015
Perceived environmental change, Page 3
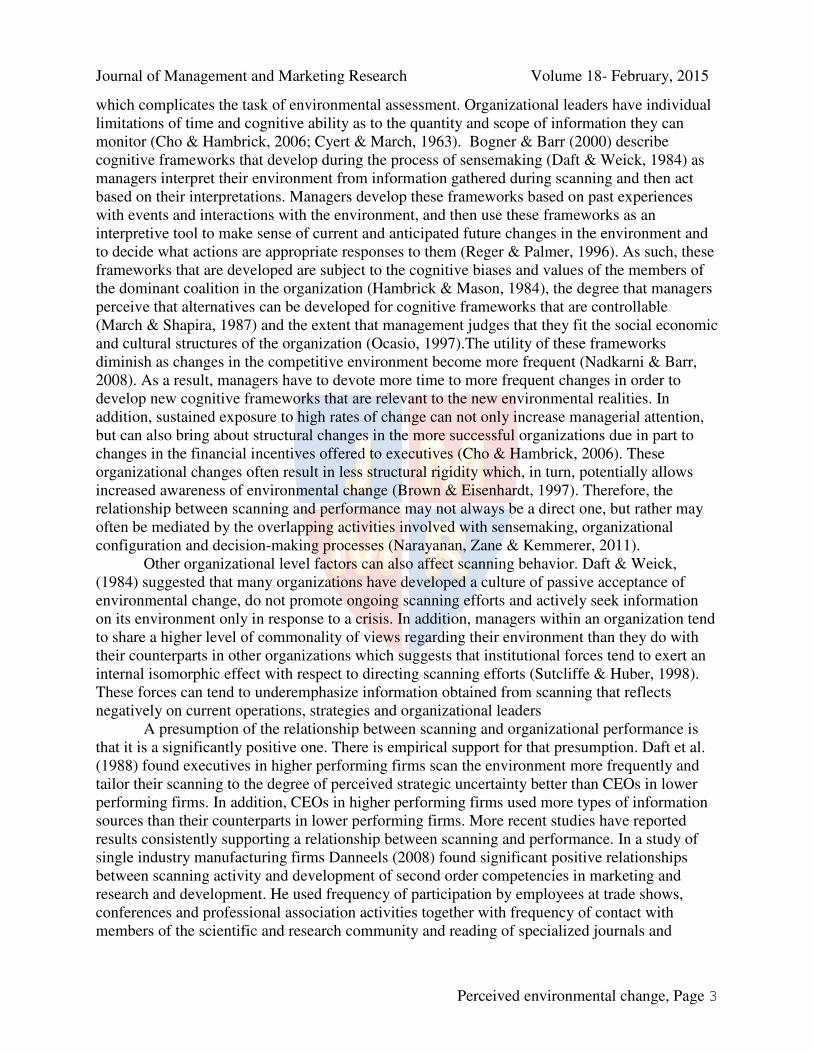
which complicates the task of environmental assessment. Organizational leaders have individual
limitations of time and cognitive ability as to the quantity and scope of information they can
monitor (Cho & Hambrick, 2006; Cyert & March, 1963). Bogner & Barr (2000) describe
cognitive frameworks that develop during the process of sensemaking (Daft & Weick, 1984) as
managers interpret their environment from information gathered during scanning and then act
based on their interpretations. Managers develop these frameworks based on past experiences
with events and interactions with the environment, and then use these frameworks as an
interpretive tool to make sense of current and anticipated future changes in the environment and
to decide what actions are appropriate responses to them (Reger & Palmer, 1996). As such, these
frameworks that are developed are subject to the cognitive biases and values of the members of
the dominant coalition in the organization (Hambrick & Mason, 1984), the degree that managers
perceive that alternatives can be developed for cognitive frameworks that are controllable
(March & Shapira, 1987) and the extent that management judges that they fit the social economic
and cultural structures of the organization (Ocasio, 1997).The utility of these frameworks
diminish as changes in the competitive environment become more frequent (Nadkarni & Barr,
2008). As a result, managers have to devote more time to more frequent changes in order to
develop new cognitive frameworks that are relevant to the new environmental realities. In
addition, sustained exposure to high rates of change can not only increase managerial attention,
but can also bring about structural changes in the more successful organizations due in part to
changes in the financial incentives offered to executives (Cho & Hambrick, 2006). These
organizational changes often result in less structural rigidity which, in turn, potentially allows
increased awareness of environmental change (Brown & Eisenhardt, 1997). Therefore, the
relationship between scanning and performance may not always be a direct one, but rather may
often be mediated by the overlapping activities involved with sensemaking, organizational
configuration and decision-making processes (Narayanan, Zane & Kemmerer, 2011).
Other organizational level factors can also affect scanning behavior. Daft & Weick,
(1984) suggested that many organizations have developed a culture of passive acceptance of
environmental change, do not promote ongoing scanning efforts and actively seek information
on its environment only in response to a crisis. In addition, managers within an organization tend
to share a higher level of commonality of views regarding their environment than they do with
their counterparts in other organizations which suggests that institutional forces tend to exert an
internal isomorphic effect with respect to directing scanning efforts (Sutcliffe & Huber, 1998).
These forces can tend to underemphasize information obtained from scanning that reflects
negatively on current operations, strategies and organizational leaders
A presumption of the relationship between scanning and organizational performance is
that it is a significantly positive one. There is empirical support for that presumption. Daft et al.
(1988) found executives in higher performing firms scan the environment more frequently and
tailor their scanning to the degree of perceived strategic uncertainty better than CEOs in lower
performing firms. In addition, CEOs in higher performing firms used more types of information
sources than their counterparts in lower performing firms. More recent studies have reported
results consistently supporting a relationship between scanning and performance. In a study of
single industry manufacturing firms Danneels (2008) found significant positive relationships
between scanning activity and development of second order competencies in marketing and
research and development. He used frequency of participation by employees at trade shows,
conferences and professional association activities together with frequency of contact with
members of the scientific and research community and reading of specialized journals and

Journal of Management and Marketing Research Volume 18- February, 2015
Perceived environmental change, Page 4
magazines as measures of scanning activity. Higher performing organizations may also develop
organizational competencies specifically designed to address rapidly changing environments
such as the ability to rapidly acquire knowledge through the development of professional
networks and through collaboration once those networks are established (Eisenhardt & Martin,
2000; Teece, Pisano, & Shuen, 1997).
Perceived Strategic Uncertainty Studies Related to Environmental Scanning
Several studies has been conducted using a latent variable, perceived strategic
uncertainty, to reflect the uncertainty based motivation for environmental scanning conducted by
managers. Daft, Sormunen & Parks (1988) defined rate of change as …“the frequency of
changes that occur in the organization’s environment (p. 125).” While they correctly point out
that the importance, complexity and frequency of the environmental changes that potentially
affect an organization may individually or jointly affect the scanning behavior of company
executives, separating the effects of these factors has not been emphasized in prior research.
Many prior researchers (e.g. Daft et al., 1988; Sawyerr, 1993; Elenkov, 1994; May, Stewart &
Sweo, 2000) have tested relationships between “perceived strategic uncertainty” and scanning
behavior. In these studies, the latent predictor variable “perceived strategic uncertainty” was
comprised of three individual predictor variables (i.e. perceived rate of environmental change,
perceived level of environmental complexity and the level of importance in obtaining the
organizational goals). Perceived strategic uncertainty in these studies was calculated as follows
(Daft et al., 1988:130):
PSU= I (C + R).
Where
PSU= Perceived Strategic Uncertainty
I = Perceived Sector Importance
C=Perceived Sector Complexity
R=Perceived Sector Rate of Change
Two criterion variables were designated in the Daft et al., (1988) model and in multiple
subsequent studies: CEO scanning frequency and CEO scanning mode (i.e. the use of verbal or
written information from personal or impersonal sources). The modes of scanning were
categorized along the dimension of written versus verbal, and the dimension of internal versus
external. The criterion variable results between high and low performing firms in the same
industry were also compared on an industry-by-industry basis. A summary of this research is
displayed in Figure 1 (Appendix).
In the first study in this stream of research Daft et al. (1988) surveyed 50 chief executive
officers in manufacturing companies to examine the relationship between the perceived strategic
uncertainty in the various sectors of the environment and the amount of scanning they performed
in these sectors. The environmental sectors were divided into two types pursuant to typologies
developed by Bourgeois (1980) and Dill (1958). The task environment consisted of the
environment closest to the organization including the customer sector, supplier sector and
competitor sector. These sectors in the task environment are differentiated from those in the
general environment, consisting of the social, demographic and economic sectors, because the
former involve direct contacts with the organization and the contacts between the latter and the

Journal of Management and Marketing Research Volume 18- February, 2015
Perceived environmental change, Page 5
organization tend to be more indirect. While this typology on environmental sectors has been
frequently used, other classifications of environmental elements have been utilized. Priem, Love
& Shaffer’s (2002) exploratory analysis with Hong Kong based executives found some evidence
to support a more fine grained taxonomy of environmental sectors than the internal, task and
societal or general environmental classification system that has traditionally been used.
The results of Daft et al., (1988) study did not support the hypothesis that the task
environment would create more strategic uncertainty than the general environment. Strategic
uncertainty regarding the economic sector, classified in the general environment, exceeded the
amount in the competitor and technological sectors of the task environment. They designated the
technological sector as a task environment sector because the CEOs surveyed managed
companies engaged in manufacturing. However, the results of this study did support the
hypothesized positive relationship between scanning frequency and perceived strategic
uncertainty in all sectors. They also found a positive relationship between perceived strategic
uncertainty and scanning frequency in all scanning modes. In addition, the study found the
correlation between scanning frequency and perceived strategic uncertainty was higher for the
personal modes than the written modes.
Using a sample of 47 CEOs leading Nigerian manufacturing firms, Sawyerr (1993)
studied the relationship between the perceptions of environmental uncertainty and environmental
scanning behavior. The study's methodology followed Hambrick (1981; 1982) in measuring
scanning frequency and scanning interest. Information source utilization was measured using the
Aguilar (1967) typology of internal, external, personal and impersonal sources. Perceived
environmental uncertainty was calculated using the aforementioned Daft et al. (1988) latent
variable method. The two major sectors of the environment were not perceived as similarly
uncertain. The perceived environmental uncertainty scores were significantly higher for the task
environment than the societal environment. The results provided evidence of a significant
positive relationship between perceived environmental uncertainty scores and the scanning
interest criterion variable in all sectors. However, a positive relationship between perceived
environmental uncertainty scores and the criterion variable, scanning frequency, was not found
for all sectors. In addition, the author found different rankings of perceived environmental
uncertainty for various environmental sectors in the Nigerian sample compared to rankings in
the Daft et al. (1988) United States sample. Sawyerr attributed the differences to country-specific
factors, such as the relatively higher political instability in Nigeria.
In a sample of 141 Bulgarian company executives, Elenkov (1997) further tested the
Daft et al.'s (1988) methodology. The results of this study bore some resemblance to the results
in the Sawyerr (1993) study. While scanning mode results in Bulgaria were similar to the results
in the United States, he did not find evidence to support the hypothesized positive relationship
between strategic uncertainty and scanning found in the United States sample. The uncertainty
rankings of various sectors were once again different than those of the Daft et al. (1988) United
States sample. In the 1988 Daft et al. sample of United States executives, the customer sector
ranked highest in perceived strategic uncertainty, whereas Bulgarian respondents gave the
highest ranking to the political/legal or regulatory sector. Elenkov attributed certain differences
from those in the Daft et al. (1988) study to specific characteristics of the Bulgarian economy.
Using a sample of Russian executives, May et al. (2000) also reported results different
from results from the United States sample in the Daft et al. (1988) study. In contrast to the
results of the Daft et al. (1988) U.S. sample, the sector rate of change and sector complexity were
not significant predictors of scanning behavior in the Russian sample. May et al. (2000) also

Journal of Management and Marketing Research Volume 18- February, 2015
Perceived environmental change, Page 6
attributed differences to country specific factors. In this case, the researchers speculated the
persistence of a turbulent economic environment, such as that faced by Russian executives,
might result in decision-making that is more centralized and based on substantially less
information compared to decision-making in the United States.
Methodological Issues Related to the Perceived Strategic Uncertainty Variable
The use of a latent variable, Strategic Uncertainty, consisting of three different measured
variables, Sector Uncertainty, Sector Importance and Sector Rate of Change in the studies
summarized in Figure 1. invites further analysis. The use of latent variables can be somewhat
problematic for several reasons. Problems with the use of the Strategic Uncertainty in these prior
scanning related studies can be illustrated by comparing its use in these studies to various
definitions of latent variables. A latent variable has been defined by Nunnally (1978) as being a
“hypothetical variable” (p. 607) derived from academic supposition. Alternatively, a latent
variable has also been defined as a variable that is unmeasurable or unobservable (Jöreskog &
Sörbom, 1979). A third definition describes the outcome of data reduction such as factor
analysis (Harman, 1960: Bollen, 2002). Performing factor analysis on the combined items of the
component variables in the Daft et al. (1988) study would have possibly yielded a latent variable
that is distinct from the mathematically derived latent variable used in the aforementioned prior
studies. Another accepted “formal definition” (Bollen, 2002, p.614) of a latent variable includes
the requirement that the measured variables forming the basis of the latent variable are
uncorrelated. The results in the May et al. (2000) study suggest that the component variables in
the Strategic Uncertainty latent variable were indeed highly correlated and therefore not
candidates for aggregation into the same latent variable using this definition.
In addition to these arguments against aggregating these individual variables into the
Strategic Uncertainty latent variable, doing so makes the actual cognitive motivation less clear
than if each component variable was assessed individually. Therefore, the disaggregation of the
Strategic Uncertainty latent variable into studies that are limited to individual assessment of its
component variables is justified. To investigate the effects of this disaggregation, hypotheses
involving the relationship between one of the latent variable components, perceived
environmental sector rate of change, and the criterion variable, scanning frequency, for each
environmental sector in both the task and societal environment and information source were
tested.
Hypothesis 1. There will be a significant positive relationship between perceived
environmental sector rate of change and information source scanning frequency for the
elements of the task environment.
Hypothesis 2. There will be a significant positive relationship between perceived
environmental sector rate of change and information source scanning frequency for the
elements of the societal environment.
METHODS
Sample
Journal of Management and Marketing Research Volume 18- February, 2015
Perceived environmental change, Page 7
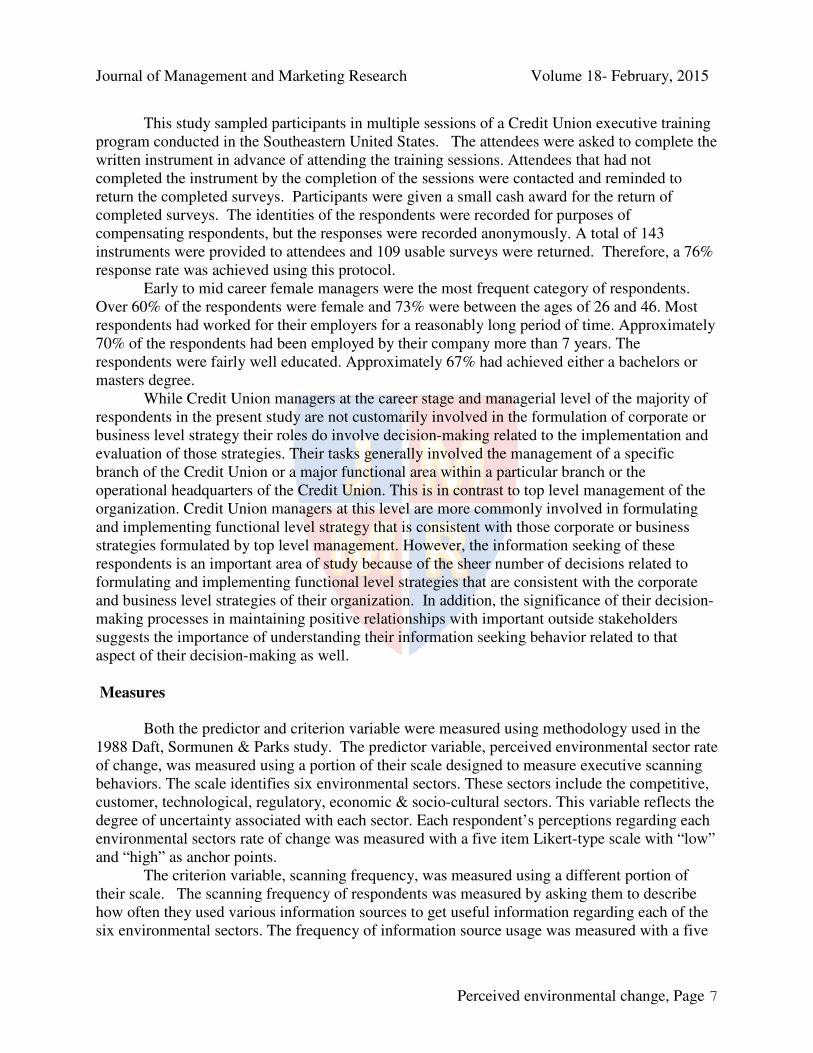
This study sampled participants in multiple sessions of a Credit Union executive training
program conducted in the Southeastern United States. The attendees were asked to complete the
written instrument in advance of attending the training sessions. Attendees that had not
completed the instrument by the completion of the sessions were contacted and reminded to
return the completed surveys. Participants were given a small cash award for the return of
completed surveys. The identities of the respondents were recorded for purposes of
compensating respondents, but the responses were recorded anonymously. A total of 143
instruments were provided to attendees and 109 usable surveys were returned. Therefore, a 76%
response rate was achieved using this protocol.
Early to mid career female managers were the most frequent category of respondents.
Over 60% of the respondents were female and 73% were between the ages of 26 and 46. Most
respondents had worked for their employers for a reasonably long period of time. Approximately
70% of the respondents had been employed by their company more than 7 years. The
respondents were fairly well educated. Approximately 67% had achieved either a bachelors or
masters degree.
While Credit Union managers at the career stage and managerial level of the majority of
respondents in the present study are not customarily involved in the formulation of corporate or
business level strategy their roles do involve decision-making related to the implementation and
evaluation of those strategies. Their tasks generally involved the management of a specific
branch of the Credit Union or a major functional area within a particular branch or the
operational headquarters of the Credit Union. This is in contrast to top level management of the
organization. Credit Union managers at this level are more commonly involved in formulating
and implementing functional level strategy that is consistent with those corporate or business
strategies formulated by top level management. However, the information seeking of these
respondents is an important area of study because of the sheer number of decisions related to
formulating and implementing functional level strategies that are consistent with the corporate
and business level strategies of their organization. In addition, the significance of their decision-
making processes in maintaining positive relationships with important outside stakeholders
suggests the importance of understanding their information seeking behavior related to that
aspect of their decision-making as well.
Measures
Both the predictor and criterion variable were measured using methodology used in the
1988 Daft, Sormunen & Parks study. The predictor variable, perceived environmental sector rate
of change, was measured using a portion of their scale designed to measure executive scanning
behaviors. The scale identifies six environmental sectors. These sectors include the competitive,
customer, technological, regulatory, economic & socio-cultural sectors. This variable reflects the
degree of uncertainty associated with each sector. Each respondent’s perceptions regarding each
environmental sectors rate of change was measured with a five item Likert-type scale with “low”
and “high” as anchor points.
The criterion variable, scanning frequency, was measured using a different portion of
their scale. The scanning frequency of respondents was measured by asking them to describe
how often they used various information sources to get useful information regarding each of the
six environmental sectors. The frequency of information source usage was measured with a five
Journal of Management and Marketing Research Volume 18- February, 2015
Perceived environmental change, Page 8
item Likert-type scale with “daily”, “weekly”, “monthly” “few times a year” and “less than once
a year” as the measurement options.
The instrument listed written external sources, written internal sources, personal external
sources and personal internal sources as possible information sources. Written external sources
included the Wall Street Journal, other periodicals, and trade magazines. Written internal sources
included special studies, reports, and memos produced by the firm. Personal external sources
included business associates, customers, vendors, officials and trade shows. Personal internal
sources included subordinates, superiors, coworkers and staff. The Internet was also included as
an information source. This source was not included in the Daft et al. (1988) study as its use was
more limited at the time the data for that study was collected then when the data for the present
study was obtained.
Each environmental sector constituted a different predictor variable in this study.
Scanning frequency was measured for each of the five types of information sources for each of
the six environmental sectors. Therefore, the significance of 30 individual relationships between
perceived environmental sector importance and scanning frequency were assessed. Although
prior studies generally aggregated the environmental sectors into either task or general
environment (Daft et al., 1988; Bourgeois, 1980; Dill, 1958), the significance of these individual
bivariate relationships were measured and assessed in the present study to allow the discovery of
the patterns of relationships between perceived uncertainty in each environmental sector and the
frequency of use for various information sources. Because the sectors were not aggregated, each
relationship was measured with a single item scale and therefore scale reliability and
dimensionality concerns were not relevant.
RESULTS
Descriptive statistics for the predictor and criterion variables are shown in Tables 1
through 7 (Appendix). The significance of relationships between the predictor and criterion
variables are shown in Table 8 (Appendix). Table 8 reflects reverse coding of the change values
so that both environmental sector change and scanning frequency reflect similar ordinal ranking.
The pattern of significant relationships between perceived environmental rate of change,
reflecting uncertainty, and scanning frequency were somewhat unexpected. The patterns of
relationships were distinctly different between the elements of the task and general
environments.
The placement of environmental sectors in either the task or general environments is
somewhat a matter of judgment. Clearly, the competitive and customer sectors belong in the task
environment. Similarly, the economic and sociocultural sectors are clearly part of the societal
environment. Arguments can be made that the technological and regulatory sectors could be
placed in either the task or general environmental. Respondents in this study were given the
definition of each sector. The definitions of these two sectors, based on those used in the Daft et
al. (1988) study, given to the respondents were as follows:
The Technological Sector-This sector includes the development of new techniques, methods,
innovations and general trends in technology relevant to your company.
The Regulatory Sector-This sector includes federal and state legislation and regulations, city or
county policies and political developments at all levels of government.

Journal of Management and Marketing Research Volume 18- February, 2015
Perceived environmental change, Page 9
Based in these definitions, the technology sector was categorized as a task environment
sector and the regulatory sector was classified as a general environment sector for purposes of
testing the hypotheses.
As shown by Table 8, there were 11 positive significant relationships out of a possible 15
relationships between perceived sector rate of change and scanning frequency for sectors in the
general environment. This evidence tends to support Hypothesis 2. However, there were no
positive significant relationship between perceived sector rate of change and scanning frequency
for sectors in the task environment. This evidence tends not to support Hypothesis 1.
Table 1 reflects the relative perceptions of the rate of change in each environmental
sector. The technology sector was reported by respondents as having the highest rate of change
and the sociocultural sector was reported as having the lowest. Surprisingly, the regulatory sector
rate of change ranked as the second lowest in perceived rate of change. This result was
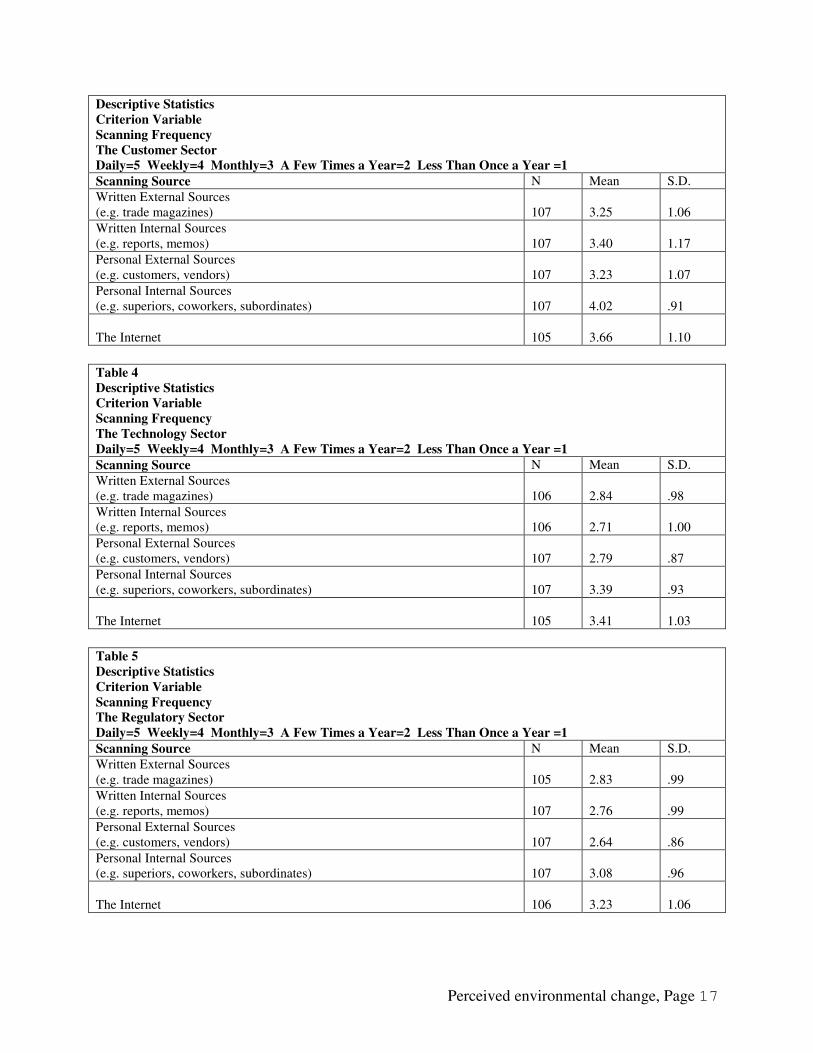
somewhat unexpected given the highly regulated nature of the financial industry. Tables 2
through 7 provide some insight into how the information seeking behavior changes with respect
to different environmental sectors. Personal internal sources were most frequently used as an
information source for the competitive and customer sectors. The Internet was used as the most
frequently accessed source for the technology, regulatory, and sociocultural sectors. Personal
Internal Sources and the Internet were tied as the most frequently used for the economic sector.
Personal external sources such as business associates, customers, vendors, officials and trade
shows were consistently among the least accessed source in each sector. This relatively low level
of information seeking activity using these sources may be unique to this industry. These results
indicate that the respondents varied their information seeking behavior based from sector to
sector.
Only Hypothesis 2, predicting a significant positive relationship between perceived
environmental sector rate of change and information source scanning frequency for elements of
the general environment, was supported for virtually all information sources and environmental
sectors. Hypothesis 1, predicting a significant positive relationship between perceived
environmental sector rate of change and information source scanning frequency for elements of
the task environment, was not supported.
DISCUSSION
The purpose of this study was to assess the relationship between the perceived rate of
change in an environmental sector and the frequency that managers utilize various information
sources to get useful information regarding that sector presumably in an effort to reduce
uncertainty. The use of more information should usually result in better managerial decisions and
organizational performance. The results indicated that the effect of perceived rate of change in an
environmental sector did affect the frequency of use for various information sources, but only for
certain sectors.
Significant relationships between perceived rate of change and scanning frequency were
observed for sectors of the general environment, but not for sectors of the task environment. As
the task environment is generally closer and arguably more important to the organization than the
general environment, a reasonable expectation would be that there would be a stronger
relationship between the perceived rate of change and scanning frequency in the task
environment than the general environment. There are several possible explanations as to why

Journal of Management and Marketing Research Volume 18- February, 2015
Perceived environmental change, Page 10
significant relationships between rate of change of the task environment and the frequency of use
of information sources were not observed, while these relationships were observed for the rate
change of the general environment.
One possibility is that the task environment for the respondent’s industry in this study is
so stable that it is not deemed necessary by respondents to frequently gather information
regarding it. However, as shown in Table 1, the mean scores for perceived rate of change for the
task environment sectors were higher for the task environment than for the general environment
that did show significant relationships with scanning frequency. Further inspection of Tables 2
through 7 reveal that the most commonly used sources of useful information for both the task
and general environmental sectors were personal internal information sources and the Internet. It
is possible that these sources are used very frequently on an ongoing basis for a variety or
reasons and, therefore, not sensitive to the influence of a particular factor, such as perceived
uncertainty.
The Nadkarni & Barr study (2008) suggests another possible explanation for these
findings. The stable nature of the Credit Union industry task environment could possibly be
expected to result in more scanning related to the general environment. Their finding suggests
that managers may tend to focus scanning efforts on based on the relative stability in an
environmental sector. They found that that managers tend to scan general environments more
frequently when task environments are more stable. However, in the present study the perception
of change was higher in the task environment sectors, but there were not significant positive
relationships with information source usage for those sectors.
Another possible explanation may be a function of the type of information that would be
deemed useful by a manager in assessing each sector. Compared to task environment
information, information related to the general environment tends to be more widely available,
easier to access, written in less technical language and whose correct interpretation is less critical
to the success of the manager and the organization. Therefore, for these reasons information on
these sectors may be more likely to be accessed. This possibility is consistent with prior research
on the dual system theory of decision-making.
Many recent descriptive decision-making models are based on two distinct systems of
reasoning (Sloman, 1996). The terminology used to describe these two systems can vary but
the characteristics of the two systems are described in a similar manner. Epstein (1994) described
the two systems as experiential and rational; Sloman (2002) characterized them as associative
and rule-based, Stanovich and West (2000) and Kahneman (2003) have labeled them as System
1 and System 2. The System 1 or the experiential system is described as a fast, effortless,
intuitive process that is subject to emotional influences and is utilized to make many decisions in
a near simultaneous manner. The System 2 or the rational system is described as a slow,
effortful, rational process that results in decisions that are made sequentially rather that
simultaneously. The underlying assumptions regarding the use of the two systems are that
System 2 reasoning requires the use of appropriate information and analysis (Kahneman 2003)
and that a greater use of System 2 or logic-based reasoning by the decision maker will result in
better solutions to more complex problems than a greater use of intuitive reasoning (Stanovich
and West 2002). However, the use of System 2 reasoning is slower and more effortful and, as a
result is much less frequently utilized than System 1 reasoning. Therefore, information seeking
activity for the general environment may be more frequent because it is easier and faster to
access and interpret.
Journal of Management and Marketing Research Volume 18- February, 2015
Perceived environmental change, Page 11
The results, shown in Tables 2 through 7, provide some empirical support for this
explanation. The two most frequently accessed information sources for all six environmental
sectors were personal internal sources, which included subordinates, superiors, coworkers and
staff, and the Internet. Presumably, managers access these sources regularly for many reasons
and gathering information regarding environmental sectors from these sources requires very little
additional effort. Gathering information from written external and internal sources and from
personal external sources such as business associates, customers, vendors, officials and trade
shows would likely require substantially more effort and planning.
However, information that is the easiest to access and most readily available may not be
the most accurate. Information from the Internet may not always be reliable. Information gained
from within the organization may be subject to institutional forces that result in a degree of
isomorphism with respect to how information is expressed and interpreted (DiMaggio & Powell,
1983). The relatively less frequent use of personal external sources to monitor all environmental
sectors suggests that this information source, which may often be more objective but also the
most effortful, may be underutilized.
Organizational leaders have the potential to improve the scanning performance of their
lower level managers in many ways. First, the creation of an organizational culture that
encourages managers to regularly seek information, particularly from personal external sources,
can be encouraged by providing resources to access these sources on a frequent basis and by
recognizing superior performance in seeking and obtaining information from them. Second,
organizational leadership can clearly articulate the strategic direction of the organization and
what environmental factors are critical to the success in executing the preferred strategic
direction. Members of the organization would then benefit from having their information focused
in more productive directions. Finally, managers can be provided training in which specific
information is the most helpful in monitoring changes in the environmental sectors and where
that information can be found.
The decision-making processes of managers should consider relevant changes in the
environment if optimum decision outcomes are to be achieved. That objective may not be
achieved if a scanning process omits important information about such changes. The results of
this study suggest ease of access to information rather than information relevancy may
significantly influence the information gathering process used by managers to the possible
detriment of the organization.
LIMITATIONS AND SUGGESTIONS FOR FUTURE RESEARCH
Busy individuals are often reluctant to participate in survey-based data collection efforts
(Newby, Watson, & Woodliff, 2003; Markman, Balkin, & Baron, 2002). Consequently, the
length and scope of survey instruments are limited as is the ability to assess the relationship of
large numbers of variables. Collecting cognitively based data from managers related to decision-
making behavior often requires the use of self-report measures and reliance on the recollection of
past behaviors or attitudes. However, Brewin, Andrews and Gotlib (1993) have determined the
retrospective recall of specific events or facts is quite accurate.
These limitations often also preclude the desirable use of multiple measures of a single
construct. An additional bias resulting from obtaining the data using a single method is possible
(Avolio, Yammarino & Bass, 1991; Spector, 1987). Spector (1987) found this bias was of minor
consequence in an analysis of employee self-report measures. Relative rankings of similar items

Journal of Management and Marketing Research Volume 18- February, 2015
Perceived environmental change, Page 12
were used for analysis. In the present study, any common method bias would similarly affect
those items and be less influential with respect to individual rankings. The present study
involved only one industry. This methodology eliminates any industry effects on the results, but
also imposes possible limits on the generalizability of the findings to managers in other
industries. Designing studies that simultaneously include managers from two or more industries
should increase the generalizability of these findings.
While providing evidence to support the differential frequency of use of information
sources by managers based on their perceived rate of change the environmental sectors in which
their organization operates, many new questions became apparent. The study assessed the
frequency of information seeking behavior by measuring the number of times information
sources were judged to be helpful, but did not endeavor to assess the quality of the sources that
were contacted. A future study that includes a much finer grained listing of sources within each
category should prove instructive. Not all external and internal information sources are likely to
be of equal value. Soliciting the opinions of respondents regarding what they perceive as the
most helpful external personal and written sources might not only provide useful directions for
future research, but also provide guidance to organizational leadership seeking to provide
training to its managers. Since the Internet was rated highest or next to highest in the frequency
of use, further research is warranted to determine what sites are the most frequently visited to
provide information on each environmental sector and which are perceived to be the most
helpful. Finally, because one possible explanation for the lack of relationship between perceived
rate of change in task environmental sectors and frequency of scanning relates to possible
difficulty in obtaining information, future studies could include an assessment of respondents
perceived effort associated with obtaining information from specific sources.
PRACTICAL IMPLICATIONS
The results of this study suggest many managers do not always allocate time to scanning
environmental sectors based on how rapid they perceive the rate of change to be in that sector.
Scanning related to the task sector is arguably more important to organizational performance
than the general sector in most cases, but may be less influenced by the perceived rate of change
in that sector. A likely explanation for this phenomenon is that the scanning related to the task
environment from certain sources requires more time and effort. This suggests that organizations
do not sufficiently encourage scanning behavior by their managers, particularly with respect to
the task environment, by providing sufficient resources and incentives to encourage that
behavior. Thus, the information seeking behavior of managers can be greatly influenced by not
only the perceived rate of change of an environmental sector and the effect of that change on
organizational performance, but also by their perceptions of the importance of the information
seeking process to their organizational leaders.
An organization where managers do not sufficiently recognize the importance of changes
in environmental sectors to organizational performance and where organizational leadership does
little to encourage information search behavior will likely be at a significant competitive
disadvantage compared to an organization that articulates a strategic direction to its managers,
describes what environmental information relates to that direction and facilitates an ongoing
quest for that relevant environmental information.
REFERENCES

Journal of Management and Marketing Research Volume 18- February, 2015
Perceived environmental change, Page 13
Aguilar, F. J. (1967). Scanning the business environment. MacMillan: New York.
Avolio, B., Yammarino, F., & Bass, B. (1991). Identifying common methods variance with data
collected from a single source: An unresolved sticky issue. Journal of Management, 17,
571-587.
Bogner, W. C. & Barr, P. S. (2000). Making sense in hypercompetitive environments: A
cognitive explanation for the persistence of high velocity competition. Organizational
Science, 11 (2) 212-226.
Bourgeois, L. J. (1980). Strategy and environment: A conceptual integration. Academy of
Management Review, 5, 25-39.
Bourgeois, L. J. & Eisenhardt, K. M. (1988). Strategic decision processes in high velocity
environments: Four cases in the microcomputer industry. Management Science, 3, 816-
835.
Bollen, K.A. (2002). Latent variables in psychology and the social sciences. Annual Review of
Psychology, 53, 605-634.
Brewin, C. R., Andrews, B., & Gotlib, I. H. (1993). Psychopathology and early experience: A
reappraisal of retrospective reports. Psychological Bulletin, 113, 82-98.
Brown, S. L. & Eisenhardt, K. M. (1997). The art of continuous change: Linking complexity
theory and time-paced evolution in relentlessly shifting organizations. Administrative
Science Quarterly, 42, 1-34.
Cho, T. S. & Hambrick, D. C. (2006). Attention as the mediator between top management team
characteristics and strategic change: The case of airline deregulation. Organizational
Science, 17 (4), 453-469.
Cyert, R. M. & March, J. G. (1963). A behavioral theory of the firm. Englewood Cliffs, N. J.:
Prentice Hall.
Daft, R. L., Sormunen, J., & Parks, D. (1988). Chief executive scanning, environmental
characteristics and company performance: An empirical study. Strategic Management
Journal, 9, 123-139.
Daft, R. L. & Weick, K. E. (1984). Toward a model of organizations as interpretation systems.
Academy of Management Review, 9 (2) 284-293.
Danneels, E. (2008). Organizational antecedents of second-order competences. Strategic
Management Journal, 29, 519-543.
Dill, W. R. (1958). Environment as an influence on managerial autonomy. Administrative
Science Quarterly, 3, 409-443.
DiMaggio, P. J., & Powell, W. W. (1983). The iron cage revisited: Institutional isomorphism and
collective rationality in organizational fields. American Sociological Review, 48, 147-
160.
Elenkov, D. S. (1997). Strategic uncertainty and environmental scanning: The case for
institutional influences on scanning behavior. Strategic Management Journal, 18 (4),
287-302.
Eisenhardt, K. M. & Martin, J. A. (2000). Dynamic capabilities: What are they? Strategic
Management Journal, 21, 1105-1121.
Epstein, S. (1994). Integration of the cognitive and psychodynamic unconscious. American
Psychologist, 49, 709-724.
Forbes, D. P. (2007). Reconsidering the strategic implications of decision comprehensiveness.
Academy of Management Review, 32 (2), 381-376.

Journal of Management and Marketing Research Volume 18- February, 2015
Perceived environmental change, Page 14
Hambrick, D. C. (1981). Specialization of environmental scanning activities among upper level
executives. Journal of Management Studies, 18, 299-320.
Hambrick, D. C. (1982). Environmental scanning and organizational strategy. Strategic
Management Journal, 3, 159-174.
Hambrick, D. C. & Mason, P. A. (1984). Upper echelons: The organization as a reflection of its
top managers. Academy of Management Review, 9 (3), 193-206.
Harman, H. H. (1960). Modern factor analysis. Chicago: University of Chicago Press.
Huber, G. & Daft, R. (1987). The information environments of organizations. In F. Jablin, L.
Putnam, K. Roberts & L. Porter (Eds.) Handbook of organizational communication. 130-
164. Newbury Park, CA: Sage.
Jöreskog, K., & Sörbom, D. (1979). Advances in factor analysis and structural equation models.
Cambridge, MA: Abt Books.
Kahneman, D. (2003). A perspective on judgment and choice: Mapping bounded rationality.
American Psychologist, 58, 697-720.
March, J. G. & Shapira, Z. (1987). Managerial perspectives on risk and risk taking. Management
Science, 33 (11) 1404-1418.
Markman, G. D., D. B. Balkin, and R. A. Baron (2002). Inventors and new venture formation:
The effects of general self-efficacy and regretful thinking. Entrepreneurship Theory and
Practice, 27, 149-165.
May, R. C., Stewart, Jr., W. H., & Sweo, R. (2000). Environmental scanning behavior in a
transitional economy: Evidence from Russia. Academy of Management Journal, 43(3),
403-427.
McCarthy, I. P., Lawrence, T. B., Wixted, B. & Gordon, B. R. (2010). A multidimensional
conceptualization of environmental velocity. Academy of Management Review, 35(4),
604-626.
Nadkarni, S. & Barr, P. A. (2008). Environmental context, managerial cognition and strategic
action: An integrated view. Strategic Management Journal, 29, 1395-1427.
Narayanan, V. K., Zane, L. J. & Kemmerer, B. (2011). The cognitive perspective in strategy: An
integrative view. Journal of Management, 37, 1 305-351.
Newby, R., J. Watson, and D. Woodliff, (2003). SME survey methodology: Response rates, data
quality, and cost effectiveness. Entrepreneurship Theory and Practice, 28, 163-172.
Nunnally, J.C. (1978). Psychometric theory. New York: McGraw Hill.
Ocasio, W. (1997). Towards an attention-based view of the firm. Strategic Management Journal,
18, 187-206.
Priem, R. L., Love, L. G. & Shaffer, M. A. (2002). Executives’ perceptions of uncertainty
sources: A numerical taxonomy and underlying dimensions. Journal of Management,
28(6) 725-746.
Reger, R. K. & Palmer, T. B. (1996). Managerial categorization of competitors: Using old maps
to navigate new environments. Organization Science 7 (1) 22-39.
Sawyerr, O. O. (1993). Environmental uncertainty and environmental scanning activities of
Nigerian manufacturing executives: A comparative analysis. Strategic Management
Journal, 14, 287-299.
Sloman, S. A. (1996). The empirical case for two systems of reasoning. Psychological Bulletin,
119, 3-22.

Journal of Management and Marketing Research Volume 18- February, 2015
Perceived environmental change, Page 15
Sloman, S. A. (2002). Two systems of reasoning. In T. Gilovich, D. Griffin and D. Kahneman
(Eds.) Heuristics and biases: The psychology of intuitive judgment (pp.379-396).
Cambridge: Cambridge University Press.
Spector, P. (1987). Method variance as an artifact in self-reported affect and perceptions at work:
Myth or a significant problem. Journal of Applied Psychology, 72, 438-443.
Stanovich, K. E., and R. F. West, (2000). Individual differences in reasoning: Implications for
the rationality debate. Behavior and Brain Sciences, 23, 645-665.
Stanovich, K. E., and R. F. West, (2002). Individual differences in reasoning: Implications for
the rationality debate. In T. Gilovich, D. Griffin, and D. Kahneman (Eds.) Heuristics and
biases (pp. 421-440). New York: Cambridge University Press.
Sutcliffe, K. M. & Huber, G. P. (1998). Firm and industry perceptions as determinants of
executive perceptions of the environment. Strategic Management Journal, 19, 793-807.
Teece, D. J., Pisano, G. & Shuen, A. (1997). Dynamic capabilities and strategic management.
Strategic Management Journal, 18 (7) 509-533.

Perceived environmental change, Page 16
APPENDIX
Figure 1.
Summary of Prior Research
Perceived Strategic Uncertainty (PSU) Criterion
Study
Setting
PSU positively
related to
scanning frequency
PSU positively
related to the use
of personal
scanning modes
PSU positively
related to the use of
impersonal personal
scanning modes
Daft et al.
(1988)
United
States
Supported
Supported
Supported
Sawyerr
(1993)
Nigeria
Partially supported
Not supported
Partially
supported
Elenkov
(1994)
Bulgaria
Not supported
Supported
Not supported
May et al.
(2000)
Russia
Not supported
Not supported
Not supported
Table 1
Descriptive Statistics
Predictor Variable
Perceived Rate of Sector Change
Low=1 High=5
N Mean S.D.
Task Sectors
Competitive Sector 106 4.05 .89
Customer Sector 106 3.76 .86
Technology Sector 106 4.32 .74
General Sectors
Regulatory Sector 106 3.40 .76
Economic Sector 106 4.03 .88
Sociocultural Sector 106 2.82 1.05
Table 2
Descriptive Statistics
Criterion Variable
Scanning Frequency
The Competitive Sector
Daily=5 Weekly=4 Monthly=3 A Few Times a Year=2 Less Than Once a Year =1
Scanning Source N Mean S.D.
Written External Sources
(e.g. trade magazines)
107
3.33
.94
Written Internal Sources
(e.g. reports, memos)
107
3.13
1.12
Personal External Sources
(e.g. customers, vendors)
107
3.15
.95
Personal Internal Sources
(e.g. superiors, coworkers, subordinates)
107
3.87
.89
The Internet
106
3.56
.95
Table 3
Perceived environmental change, Page 17
Descriptive Statistics
Criterion Variable
Scanning Frequency
The Customer Sector
Daily=5 Weekly=4 Monthly=3 A Few Times a Year=2 Less Than Once a Year =1
Scanning Source N Mean S.D.
Written External Sources
(e.g. trade magazines)
107
3.25
1.06
Written Internal Sources
(e.g. reports, memos)
107
3.40
1.17
Personal External Sources
(e.g. customers, vendors)
107
3.23
1.07
Personal Internal Sources
(e.g. superiors, coworkers, subordinates)
107
4.02
.91
The Internet
105
3.66
1.10
Table 4
Descriptive Statistics
Criterion Variable
Scanning Frequency
The Technology Sector
Daily=5 Weekly=4 Monthly=3 A Few Times a Year=2 Less Than Once a Year =1
Scanning Source N Mean S.D.
Written External Sources
(e.g. trade magazines)
106
2.84
.98
Written Internal Sources
(e.g. reports, memos)
106
2.71
1.00
Personal External Sources
(e.g. customers, vendors)
107
2.79
.87
Personal Internal Sources
(e.g. superiors, coworkers, subordinates)
107
3.39
.93
The Internet
105
3.41
1.03
Table 5
Descriptive Statistics
Criterion Variable
Scanning Frequency
The Regulatory Sector
Daily=5 Weekly=4 Monthly=3 A Few Times a Year=2 Less Than Once a Year =1
Scanning Source N Mean S.D.
Written External Sources
(e.g. trade magazines)
105
2.83
.99
Written Internal Sources
(e.g. reports, memos)
107
2.76
.99
Personal External Sources
(e.g. customers, vendors)
107
2.64
.86
Personal Internal Sources
(e.g. superiors, coworkers, subordinates)
107
3.08
.96
The Internet
106
3.23
1.06

Perceived environmental change, Page 18
Table 6
Descriptive Statistics
Criterion Variable
Scanning Frequency
The Economic Sector
Daily=5 Weekly=4 Monthly=3 A Few Times a Year=2 Less Than Once a Year =1
Scanning Source N Mean S.D.
Written External Sources
(e.g. trade magazines)
106
3.51
1.12
Written Internal Sources
(e.g. reports, memos)
107
3.16
1.27
Personal External Sources
(e.g. customers, vendors)
107
3.07
1.01
Personal Internal Sources
(e.g. superiors, coworkers, subordinates)
107
3.70
2.02
The Internet
106
3.70
1.14
Table 7
Descriptive Statistics
Criterion Variable
Scanning Frequency
The Sociocultural Sector
Daily=5 Weekly=4 Monthly=3 A Few Times a Year=2 Less Than Once a Year =1
Scanning Source N Mean S.D.
Written External Sources
(e.g. trade magazines)
106
2.25
1.04
Written Internal Sources
(e.g. reports, memos)
107
2.06
.99
Personal External Sources
(e.g. customers, vendors)
107
2.34
1.11
Personal Internal Sources
(e.g. superiors, coworkers, subordinates)
107
2.64
1.32
The Internet
106
2.82
1.40

Perceived environmental change, Page 19
Table 8
Patterns of Relationships Between Perceived Sector Rate of Change and
Information Source Frequency of Use
Bivariate Pairwise
Correlations N = 104-106
*<.05 **<.01
(two tailed)
Competitive
Sector
Customer
Sector
Technology
Sector
Regulatory
Sector
Economic
Sector
Sociocultural
Sector
Written External Sources
(e.g. trade magazines) .06 -.15 .04 .33** .19 .38**
Written Internal
Sources
(e.g. reports, memos)
.13 .13 .04 .35** .34** .27**
Personal External Sources
(e.g. customers, vendors) .04 .05 .14 .05 .29** .34**
Personal Internal Sources
(e.g. superiors, coworkers,
subordinates)
.15 .00 .13 .25* .01 .51**
The Internet
.14 -.02 .11 .31** .16 .33**