pepsi AR2000 covers6a - zonebourse.com · Summary of Operations ... Chief Executive Officer ......
48
PepsiCo, Inc. 2000 EAT… DRINK… AND BE MERRY!
Transcript of pepsi AR2000 covers6a - zonebourse.com · Summary of Operations ... Chief Executive Officer ......

PepsiCo, Inc. 2000
EAT…
DRINK…
AND BE MERRY!

Financial HighlightsPepsiCo, Inc. and Subsidiaries($ in millions except per share amounts; all per share amounts assume dilution)
As Reported Pro Forma(b)
2000 1999 % Chg(a) 2000 1999 % Chg( a)
Summary of OperationsNet sales $20,438 $ 20,367 – $20,144 $18,666 8
Segment operating profit $ 3,550 $ 3,068 16 $ 3,482 $ 3,080 13
Net income $ 2,183 $ 2,050 6 $ 2,139 $ 1,850 16
Net income per share $ 1.48 $ 1.37 8 $ 1.45 $ 1.24 17
Other Data
Net cash provided by operating activities $ 3,911 $ 3,027 29
Share repurchases $ 1,430 $ 1,285 11
Dividends paid $ 796 $ 778 2
Long-term debt $ 2,346 $ 2,812 (17)
Capital spending $ 1,067 $ 1,118 (5)
(a) Percentage changes are based on unrounded amounts.
(b) PepsiCo’s fiscal year ends on the last Saturday in December and, as a result, a fifty-third week is added every 5 or 6 years. The fiscalyear ended December 30, 2000 consisted of fifty-three weeks. For comparative purposes, the pro forma information for 2000excludes the impact of the fifty-third week. The pro forma information for 1999 also gives effect to the bottling transactionsdescribed in Note 2 to the financial statements as if the transactions occurred at the beginning of PepsiCo’s 1998 fiscal year. In addition, the 1999 pro forma results exclude the Frito-Lay impairment and restructuring pre-tax charge of $65 million ($40 millionafter-tax), the pre-tax gain on the sale of a chocolate business in Poland of $28 million ($25 million after-tax), the pre-tax net gainon the PBG and Whitman bottling transactions of $1 billion ($270 million after-tax) and the income tax provision of $25 millionrelated to the PepCom transaction. The pro forma information does not purport to represent what PepsiCo’s results of operationswould have been had such transactions been completed as of the dates indicated nor does it give effect to any other events.
Pro Forma Segment Operating Profit Total: $3,482$ In Millions
Pro Forma PepsiCo Net SalesTotal: $20,144 $ In Millions
To help us toast a great year, we invited several PepsiCo shareholders to pose for a few pictures eating, drinking and beingmerry. As you’ll see, they very kindly obliged.
Michael ThomasShareholder since 2001.
ContentsLetter from the Chairman . . . . . . . . . . . . . . . . . . . . . . . . . . . . .1Corporate Citizenship . . . . . . . . . . . . . . . . . . . . . . . . . . . . . . . .14
Principal Divisions and Corporate Officers . . . . . . . . . . . . . .15Board of Directors . . . . . . . . . . . . . . . . . . . . . . . . . . . . . . . . . . .16
Financial ReviewManagement’s Discussion and AnalysisIntroduction To Our Business . . . . . . . . . . . . . . . . . . . . . . . . .17Results of Operations
Consolidated Review . . . . . . . . . . . . . . . . . . . . . . . . . . . . .20Business Segments
Frito-Lay . . . . . . . . . . . . . . . . . . . . . . . . . . . . . . . . . . . .21Pepsi-Cola . . . . . . . . . . . . . . . . . . . . . . . . . . . . . . . . . .23Tropicana . . . . . . . . . . . . . . . . . . . . . . . . . . . . . . . . . . .24
Consolidated Cash Flows . . . . . . . . . . . . . . . . . . . . . . . . . . . . .24Liquidity and Capital Resources . . . . . . . . . . . . . . . . . . . . . . .24Consolidated Statement of Income . . . . . . . . . . . . . . . . . . . .25Consolidated Statement of Cash Flows . . . . . . . . . . . . . . . . .26Consolidated Balance Sheet . . . . . . . . . . . . . . . . . . . . . . . . . .27Consolidated Statement of Shareholders’ Equity . . . . . . . .28Notes to Consolidated Financial Statements . . . . . . . . . . . .29Management’s Responsibility for
Financial Statements . . . . . . . . . . . . . . . . . . . . . . . . . . . .43Report of Independent Auditors . . . . . . . . . . . . . . . . . . . . . .43Selected Financial Data . . . . . . . . . . . . . . . . . . . . . . . . . . . . . .44
Tropicana $2,393 12%
Pepsi-Cola $5,09525%
Frito-Lay $12,65663%
Tropicana $2206%
Pepsi-Cola $96828%
Frito-Lay $2,29466%

1
Roger A. EnricoChairman and
Chief Executive Officer
We rang up our best performance
since 1995, with a total return to
shareholders of nearly 43%. That put
us way ahead of the Dow Jones
Industrials, the Standard & Poor’s
500, the S&P Food Index and the
S&P Beverage Index.
Strong business results drove that
healthy return, as the highlights on
the facing page show. On a pro forma
basis, revenue growth of 8%, a rate
rare among big consumer packaged
goods companies, led the way. And
that’s just the beginning:
• We posted double-digit growth in
segment operating profit and
earnings per share every quarter.
• Our return on invested capital
moved up 2.5 points to 23%.
• Operating cash flow grew to $2.7
billion. That’s after capital expen-
ditures and other investments.
• Our balance sheet remained very
strong, with a relatively low net
debt of $1.1 billion.
• We returned some $2.2 billion to
shareholders in dividends and
share repurchases.
Especially exciting is the breadth
of our performance. If you’ll pardon
the metaphor, we’ve been firing on
all cylinders:
• Every operating division posted
volume gains.
• Every operating division posted
revenue gains.
• Every operating division increased
its market share.
• Every operating division delivered
solid growth in operating profit,
with four out of five posting
double-digit gains.
Total Return to ShareholdersStock appreciation plus dividends reinvested
Dear Friends:I admit our cover could be more subtle.But 2000 was a great year for PepsiCo.
Good news spanned the globe.
There are lots of examples.
Our Sabritas unit in Mexico, post-
ed salty snack volume growth of
17%. In Thailand, Pepsi-Cola volume
grew 12%. In the United States,
volume of Tropicana’s flagship Pure
Premium brand surged 12%.
A Top Consumer Products CompanySo the numbers were good. Our
strength was broad-based. We had
lots of momentum. And our sights
are set squarely on the vast global
opportunity in convenient foods
and beverages.
-10%
0%
10%
20%
30%
40%
December1999
December2000
est bodega to the mightiest club
store — and they get bigger each
year. Unlike many competitors,
our DSD systems give us the abili-
ty to merchandise our products for
maximum appeal to consumers.
• We benefit from an increasinglyglobal portfolio. We already have
a strong position in many markets
around the globe. In snacks, for
example, we are the leader in 30
countries. In beverages, we’re
either number one or number two
in some 60 markets. So the appeal
of our products has been widely
demonstrated. Yet virtually every
one of our markets offers the
opportunity for dramatic growth.
• We help our retail customersmake lots of money. As retailers
continue merging to gain scale
and improve efficiency, they look
for products that provide clear,
measurable benefits to their bot-
tom line. Ours do — on a grand
scale. Among big U.S. retailers,
for example, PepsiCo is the
#1 contributor to their sales
growth and the #1 contributor
to their profit growth.
Perhaps that’s why in
Progressive Grocer’s annual ProGro
awards, Pepsi-Cola and Frito-Lay
each earned the top spot in their
respective categories.
New Platforms for GrowthAdd it all up and we could probably
generate respectable results for
years. But we want to do even bet-
ter. So we are also adding new plat-
forms for growth — that strengthen
our portfolio and enhance our vitally
important innovation capabilities.
For example, in January 2001 we
acquired a majority of the South
Beach Beverage Company, whose
2
And, as our stock chart suggests,
investors noticed. More and more rec-
ognized that PepsiCo’s performance
puts it among the world’s top con-
sumer products companies. More
important, they recognized that
PepsiCo is well positioned to continue
posting healthy, consistent results.
That’s crucial. At PepsiCo, we
aspire to be among the best of the
best — the companies that deliver
solid, dependable growth every year.
That’s the ambitious destination
we’ve chosen. And we’re well on our
way. Today PepsiCo is highly disci-
plined and sharply focused, with so
many great things going for us:
• We’re in the industry sweet spot:convenient foods and beverages.The trend is clear and global.
Time-pressed consumers want
great-tasting foods and drinks that
are convenient to buy and con-
sume. They spend hundreds of
billions of dollars a year on these
products, and that’s growing.
With decades of experience selling
and creating great-tasting conven-
ient foods and beverages, we’re
well-equipped to succeed.
• We hold strong market positions.As the world’s #1 salty snack com-
pany, the world’s #2 refreshment
beverage company and the
world’s #1 maker and marketer of
branded juices, we operate from a
position of strength. And our
marketplace experience, technical
expertise and innovation capabili-
ties reflect our market leadership.
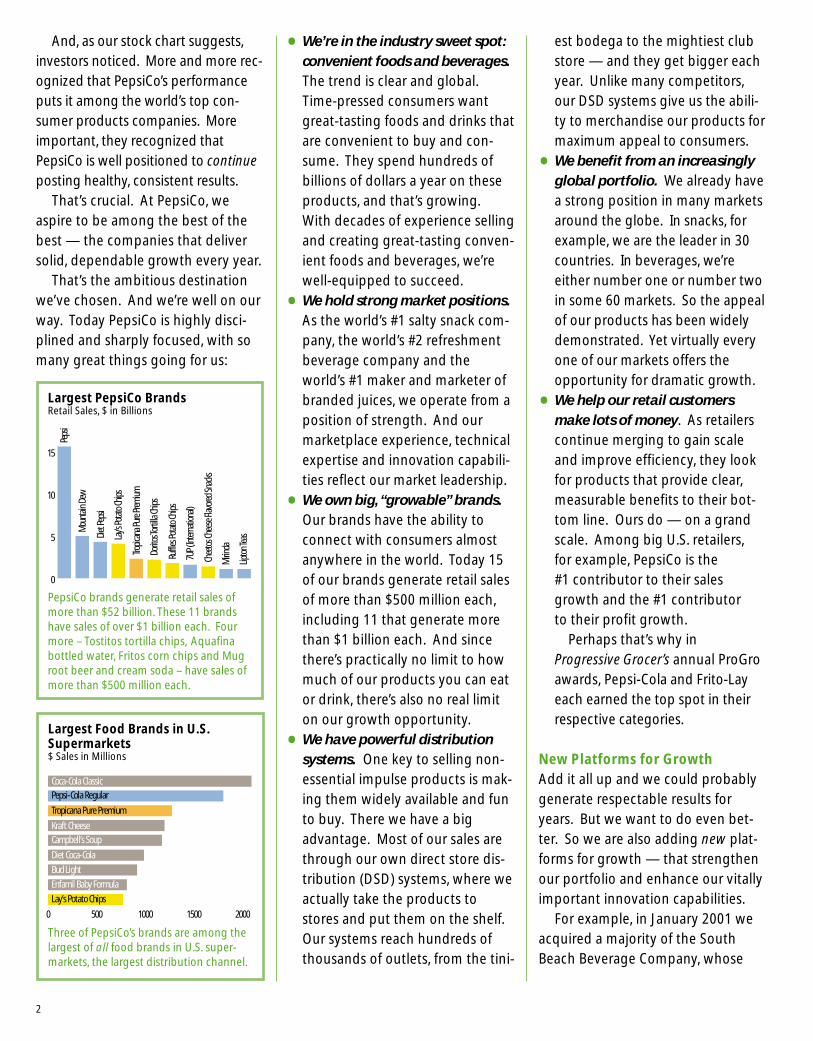
• We own big, “growable” brands.Our brands have the ability to
connect with consumers almost
anywhere in the world. Today 15
of our brands generate retail sales
of more than $500 million each,
including 11 that generate more
than $1 billion each. And since
there’s practically no limit to how
much of our products you can eat
or drink, there’s also no real limit
on our growth opportunity.
• We have powerful distributionsystems. One key to selling non-
essential impulse products is mak-
ing them widely available and fun
to buy. There we have a big
advantage. Most of our sales are
through our own direct store dis-
tribution (DSD) systems, where we
actually take the products to
stores and put them on the shelf.
Our systems reach hundreds of
thousands of outlets, from the tini-
Largest Food Brands in U.S.Supermarkets$ Sales in Millions
Three of PepsiCo’s brands are among thelargest of all food brands in U.S. super-markets, the largest distribution channel.
Largest PepsiCo BrandsRetail Sales, $ in Billions
PepsiCo brands generate retail sales ofmore than $52 billion. These 11 brandshave sales of over $1 billion each. Fourmore – Tostitos tortilla chips, Aquafinabottled water, Fritos corn chips and Mugroot beer and cream soda – have sales ofmore than $500 million each.
0
5
10
15
Peps
i
Mou
ntain
Dew
Diet
Peps
i
Lay’s
Pota
to Ch
ips
Tropic
ana P
ure P
remium
Dorit
os To
rtilla
Chips
Ruffl
es Po
tato
Chips
7UP (
Inter
natio
nal)
Chee
tos C
hees
e Flav
ored
Snac
ks
Miri
nda
Lipto
n Tea
s
0 500 1000 1500 2000
Coca-Cola Classic
Pepsi-Cola Regular
Tropicana Pure Premium
Kraft Cheese
Campbell’s Soup
Diet Coca-Cola
Bud Light
Enfamil Baby Formula
Lay’s Potato Chips

president and chief operating officer,
will succeed me as chairman of the
board and chief executive officer.
Chief Financial Officer Indra Nooyi
will add the role of PepsiCo president
and will be nominated for election to
our board of directors.
I’m a big fan of Steve and Indra,
and I’m not alone. BusinessWeek
magazine recently said that together
they may be one of the most power-
ful management teams in Corporate
America. I know they are.
In 16 years at PepsiCo, Steve has
proven to be an exceptional leader.
He sees opportunities others miss,
and he can rally a team to seize them.
He certainly proved that at Pizza Hut,
where he built the world’s largest
pizza delivery business from scratch.
As head of Frito-Lay, he took one of
the most successful food companies
on Earth and made it even better.
And as PepsiCo president and chief
operating officer, he has been a
prime mover in our delivering
healthy, consistent earnings while
building a foundation for the future.
Indra is outstanding in her own
right. She joined PepsiCo seven
years ago as senior vice president of
strategic planning and is a principal
architect of the highly focused
corporation you see today. She has
been at the forefront of all our big
financial transactions. And over the
last year, she has distinguished her-
self as chief financial officer.
When Steve and Indra move up, I’ll
become a PepsiCo vice chairman. At
the time of the merger, Bob Morrison,
Quaker’s chairman, president and
chief executive officer, will join our
board, also with the title of vice
chairman. Bob and I intend to help
ensure that the merger of our
companies fulfills its great promise.
SoBe line of drinks adds to the
Pepsi-Cola portfolio some of the
fastest-growing brands in the fastest-
growing segment of the industry,
non-carbonated beverages.
We also began or completed sev-
eral snack transactions that vault
Frito-Lay to the top of the salty snack
market in three more countries.
They also give us the scale to operate
more efficiently and grow the salty
snack category.
But without question the biggest
step we’ve taken to ensure a bright
future of growth for PepsiCo is our
planned merger with The Quaker Oats
Company, which we expect to com-
plete in the second quarter of 2001.
The merger will make PepsiCo an
even more effective competitor in
the expanding market for convenient
foods and beverages. It will add two
very powerful brands to our portfo-
lio, Gatorade and Quaker, and create
new opportunities for every PepsiCo
division. The combined enterprise
will rank among the world’s five
largest consumer product compa-
nies. (For more details, see page 4.)
A Wealth of TalentThere’s another reason I am confident
PepsiCo will achieve its goal: our peo-
ple. We have a wealth of talent across
this corporation. It starts with our
exceptional frontline team, the peo-
ple out there serving our customers
365 days a year, and it extends to our
corporate staff. To me, that says we
have not only big opportunities, but
the skills, experience, dedication and
intellectual horsepower to make the
most of them.
Nowhere is that strength more
evident than in the people who will
lead PepsiCo into the 21st century.
This year, Steve Reinemund, our
3
Three Outstanding DirectorsSpeaking of promise fulfilled, let me
pay tribute to one of our great lead-
ers, Karl von der Heyden. After a dis-
tinguished career that included six
years at PepsiCo and culminated as
co-chairman and chief executive offi-
cer of RJR Nabisco, Karl rejoined
PepsiCo as chief financial officer and
vice chairman of our board in 1996.
He signed on for “about a year” —
and stayed until January 2001.
I’m delighted that he did. Karl has
been a true friend to PepsiCo and a
great resource for me. He played a
crucial role in revitalizing this corpo-
ration. From all of us at PepsiCo, I
want to say thanks and best wishes.
Let me also thank two other
outstanding PepsiCo directors, Roy
Vagelos and Arnold Weber, who
retired in May 2000. Roy had served
on our board eight years and Arnie,
22. In that time they provided
invaluable counsel and guidance to
me, my predecessors and scores of
other PepsiCo senior managers. I
thank them immensely for their wis-
dom and support.
As I think about what the future
holds for PepsiCo, I am very opti-
mistic. We are in the heart of a
growing consumer market rich with
opportunity. We have strong, global
brands, powerful distribution sys-
tems and vast financial resources.
Most of all, we have a team of bright,
highly motivated people with the
skills, experience and commitment to
make the most of the opportunity
before us.
Roger Enrico
Chairman of the Board and
Chief Executive Officer

0.0
0.5
1.0
1.5
2.0
2.5
97 98 99 00
PepsiCo to Merge with The Quaker Oats CompanyOn December 4, 2000 PepsiCo and The Quaker Oats Company announced plansto merge. The agreement calls for PepsiCo to exchange 2.3 shares of its stock foreach Quaker share, up to a maximum value of $105 for each Quaker share.
This historic merger will bring together two of the food and beverage industry’sstrongest companies and many of its most recognized brands. The merger alsowill provide an array of strategic and financial benefits.
From a financial perspective, the deal is expected to:
• add to PepsiCo’s earnings per share in the first full year and thereafter;
• immediately improve PepsiCo’s return on invested capital by two percentagepoints, and
• strengthen PepsiCo’s ongoing sales and profit growth.
Strategically, the merger creates important new growth platforms:
• Quaker’s powerful Gatorade brand, the world’s number one sports drink, willmake PepsiCo the clear leader in the United States in non-carbonated bever-ages, the fastest growing sector of the beverage industry. Gatorade has beengrowing every year since it was acquired by Quaker in 1983 and shows nosigns of slowing. Plus the scale of Gatorade’s vast warehouse distribution system will help Tropicana’s non-refrigerated juice and juice drink brands tobecome stronger and more profitable.
• Quaker’s rapidly expanding snack business — including granola bars, ricesnacks and fruit and oatmeal bars — is highly complementary to Frito-Lay,the world leader in salty snacks. The Quaker brand, a symbol of healthy,wholesome eating, will extend PepsiCo’s reach into morning on-the-go foods,snacks aimed at kids and grain-based snacks. Adding Quaker snacks to Frito-Lay’s vast distribution system will create very substantial growth opportunities in the United States and internationally.
• Quaker’s highly profitable non-snack food business (with leading brands likeQuaker oatmeal, Life and Cap’n Crunch cereals, Rice-A-Roni and Aunt Jemimasyrup) generates hundreds of millions of dollars in cash. Through greaterinnovation and efficiencies, it can continue providing steady profit growthand lots of free cash flow.
The transaction is expected to be tax-free and accounted for as a pooling-of-interests.It requires the approval of PepsiCo and Quaker shareholders. It also requires theissuance of approximately 315 million new PepsiCo shares to Quaker shareholders.
0
100
200
300
400
97 98 99 00
4
Gatorade Sales$ In Billions
Quaker Snack Sales$ In Millions

North AmericaFrito-Lay North America had an excel-
lent year. Pound volume grew a very
solid 4%, outpacing the salty snack
category, while revenues grew 7%.
Frito-Lay’s market share grew by
nearly two percentage points to 58%.
That healthy underlying growth
led to a 10% gain in operating profit.
In fact, the fourth quarter of 2000
marked Frito-Lay’s eighth consecutive
quarter of double-digit profit growth.
Strong performance in core
brands — like Lay’s, Ruffles, Tostitos
and Cheetos — contributed to the
growth. So did innovation, an area in
which Frito-Lay excels. A few exam-
ples: Fritos and Tostitos brand snack
kits that combine a container of
chips and a container of dip; Ruffles
Flavor Rush potato chips, in flavors
more intense than traditional Ruffles;
new flavors of Doritos tortilla chips
and Cheetos Xs and Os. Frito-Lay’s
innovation efforts generated some
$1 billion in retail sales in 2000.
More important, they reflect the
company’s extraordinary ability to
bring excitement to the marketplace
quickly and drive growth year
after year.
Frito-Lay also grew by exploiting
underdeveloped distribution chan-
nels, with particularly strong gains in
mass merchandisers and conven-
ience stores as well as in the vend-
ing and foodservice channel.
And a relentless focus on improv-
ing productivity and using its vast
system to the greatest advantage
helped Frito-Lay raise operating
margins to an all-time high.
U.S. Snack Chip Industry% VolumeIncludes potato chips, tortilla chips, extrudedsnacks and pretzels.
Frito-Lay gained nearly two share points.
Frito-Lay North America Product Mix% Sales
Frito-Lay products in the United Statesand Canada account for $9.9 billion inretail sales.
Ruffles Potato Chips 9%
Doritos Tortilla Chips 18%Tostitos Tortilla Chips 9%
Cheetos Cheese Flavored Snacks 8%Fritos Corn Chips 7%
Rold Gold Pretzels 3%Dips & Salsa 5%
Other 15%Variety Pack 4%
Lay’s Potato Chips 22%
U.S. Frito-Lay DistributionChannels% Sales
Frito-Lay sales grew in every channel,with strong increases in mass merchandising/warehouse/club stores.
Supermarket/Grocery 51%
Convenience Stores 15%
Mass Merchandisers Warehouse/Clubs 15%
Other 10%
Foodservice/Vending 9%
5
Frito-Lay 58%
Private Label 8%
Other 29%
Procter & Gamble 5%

6
efficiently and expand the salty
snack industry. So we continue
to acquire or merge with other
snack producers. In 2000 we made
excellent progress:
• Our Latin American snack joint
venture’s acquisition of the
Margarita snack business boosted
InternationalFrito-Lay International (FLI) had
excellent results, posting its highest
volume growth in six years. Salty
snack kilos grew 13%, which fueled
revenue growth of 14% and operat-
ing profit growth of 19%.
Well-executed marketing pro-
grams drove powerful growth,
particularly the highly successful
Pokemon and money-in-the-bag
promotions.
With a leading market share of
28%, FLI has both a strong position
and vast opportunities, particularly
in the many underdeveloped mar-
kets. The key is to achieve sufficient
scale in those markets to operate
Members of the Dinamat Investment Club
Nancy O’BrienShareholder since the 1980s.
Lorna MinerShareholder since 1995.
Joan ToletteShareholder since 1993.
Josephine MoseleyShareholder since 1984.
Frito-Lay Share of Major SnackChip Categories in U.S.Supermarkets and OtherMeasured Channels% Volume
Frito-Lay’s market share grew in nearlyevery major snack chip category.
Corn Chips 89%
Tortilla Chips 74%
Extruded Snacks 58%
Potato Chips 56%
Pretzels 27%
Top-Selling Snack Chip Brands inU.S. Supermarkets$ Sales in Millions
Frito-Lay sells nine of the top-10 snackchip brands in supermarkets.
0
200
400
600
800 Lay’s
Pota
to Ch
ips
Dorit
os To
rtilla
Chips
Tosti
tos T
ortil
la Ch
ips
Ruffl
es Po
tato
Chips
Frito
s Cor
n Chip
s
Chee
tos C
hees
e Flav
ored
Snac
ks
Wav
y Lay
’s Pot
ato Ch
ips
Pring
les Po
tato
Crisp
s
WOW
! Sna
cks
Rold
Gold
Pret
zels
International Snack Chip Industry% Retail SalesExcludes United States and Canada.Includes potato chips, tortilla chips andextruded snacks. Excludes pretzels.
Frito-Lay, the largest snack chip companyin the world, sells $5.9 billion worth ofsnack chips outside North America.
Frito-Lay 28%
Other 72%
Worldwide Frito-Lay Volume by Region% Volume
Frito-Lay manufactures its products in 45countries and makes them available in120 countries.
Europe 12%
Latin America 28%
North America 54%
Middle East/Africa 2%
Asia/Pacific 4%

Frito-Lay Snack Chip Share inMajor International MarketsIncludes potato chips, tortilla chips, extrudedsnacks. Excludes pretzels.
Frito-Lay has the leading share in 30countries outside the United States andCanada, including nine of the 15 largestinternational snack chip markets.
Mexico 82%
Netherlands 62%
South Africa 55%
Brazil 51%
Australia 45%
Spain 43%
United Kingdom 42%
Thailand 35%
Poland 33%
Annual Per Capita Consumption of Snack Chips in Largest Frito-Lay MarketsIn PoundsIncludes potato chips, tortilla chips andextruded snacks. Excludes pretzels.
Outside the United States, relatively lowconsumption of snack chips offers plentyof opportunity, even in Frito-Lay’s largestinternational markets.
0
3
6
9
12
15
U.S.
Unite
d King
dom
Cana
da
Neth
erlan
ds
Austr
alia
Mex
ico
Sout
h Afri
ca
Spain
Braz
il
our market share in Colombia
from 21% to nearly 50%.
• In Taiwan we bought out our joint
venture partner to gain greater
control of the business and
improve our prospects in this
promising market.
• In Egypt we agreed to merge with
the market leader to form a new
joint venture majority-owned by
PepsiCo. The company will
account for over 60% of Egypt’s
salty snack market and eventually
expand across North Africa.
• In Saudi Arabia we agreed to
merge our snack business with the
current market leader. That boost-
ed our market share to over 45%.
• In India, our purchase of Uncle
Chipps made us the leader in
the country’s small but growing
potato chip market.
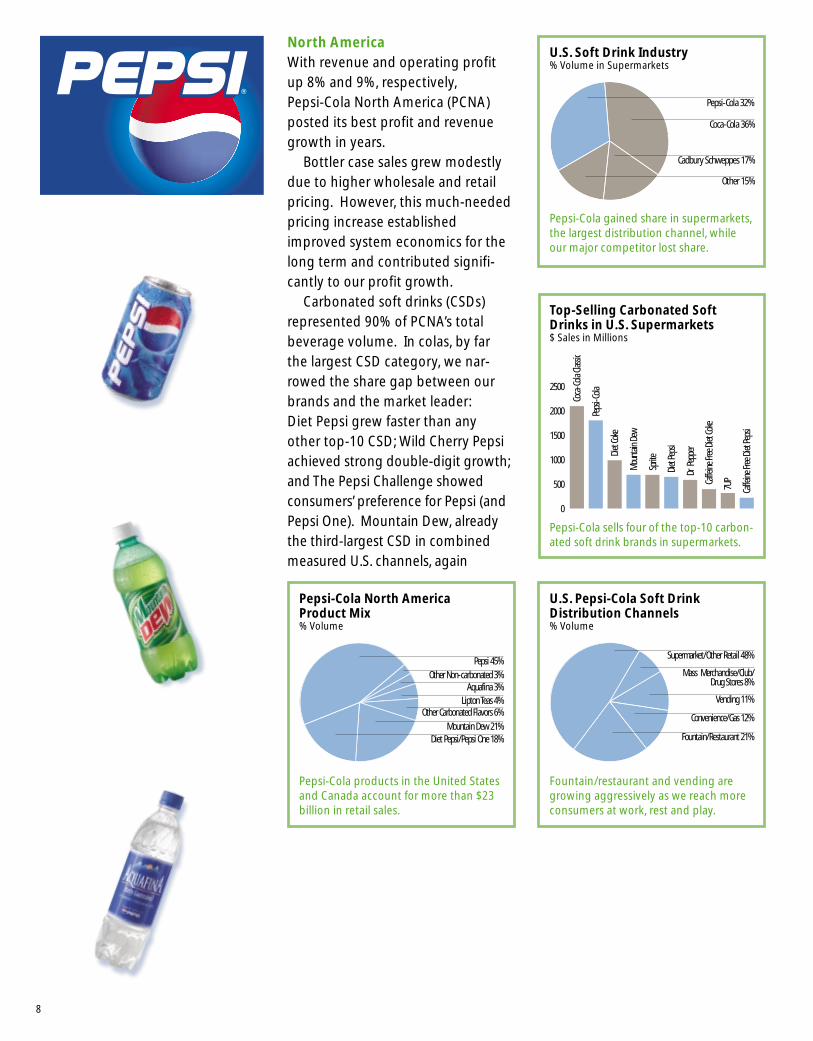
North AmericaWith revenue and operating profit
up 8% and 9%, respectively,
Pepsi-Cola North America (PCNA)
posted its best profit and revenue
growth in years.
Bottler case sales grew modestly
due to higher wholesale and retail
pricing. However, this much-needed
pricing increase established
improved system economics for the
long term and contributed signifi-
cantly to our profit growth.
Carbonated soft drinks (CSDs)
represented 90% of PCNA’s total
beverage volume. In colas, by far
the largest CSD category, we nar-
rowed the share gap between our
brands and the market leader:
Diet Pepsi grew faster than any
other top-10 CSD; Wild Cherry Pepsi
achieved strong double-digit growth;
and The Pepsi Challenge showed
consumers’ preference for Pepsi (and
Pepsi One). Mountain Dew, already
the third-largest CSD in combined
measured U.S. channels, again
Top-Selling Carbonated SoftDrinks in U.S. Supermarkets$ Sales in Millions
Pepsi-Cola sells four of the top-10 carbon-ated soft drink brands in supermarkets.
Coca
-Cola
Clas
sic
Peps
i-Cola
Diet
Coke
Mou
ntain
Dew
Sprit
e
Diet
Peps
i
Dr P
eppe
r
Caffe
ine Fr
ee D
iet Co
ke
7UP
Caffe
ine Fr
ee D
iet Pe
psi
0
500
1000
1500
2000
2500
U.S. Soft Drink Industry % Volume in Supermarkets
Pepsi-Cola gained share in supermarkets,the largest distribution channel, whileour major competitor lost share.
Pepsi-Cola 32%
Coca-Cola 36%
Other 15%
Cadbury Schweppes 17%
Pepsi-Cola North America Product Mix % Volume
Pepsi-Cola products in the United Statesand Canada account for more than $23billion in retail sales.
Pepsi 45%
Other Non-carbonated 3%
Lipton Teas 4%Other Carbonated Flavors 6%
Mountain Dew 21%Diet Pepsi/Pepsi One 18%
Aquafina 3%
U.S. Pepsi-Cola Soft DrinkDistribution Channels% Volume
Fountain/restaurant and vending aregrowing aggressively as we reach moreconsumers at work, rest and play.
Supermarket/Other Retail 48%
Mass Merchandise/Club/Drug Stores 8%
Convenience/Gas 12%
Fountain/Restaurant 21%
Vending 11%
8

outperformed the industry. The
fourth-quarter launch of Sierra Mist
dramatically increased our presence
in lemon-lime, the second-largest
CSD segment in the U.S.
As consumers increasingly seek
variety, PCNA continued building its
very strong portfolio of non-carbon-
ated beverages, the fastest-growing
part of the beverage industry.
Aquafina, with volume up 32%,
remained the number one single-
serve bottled water in the United
States. Lipton again was the number
one ready-to-drink tea. Frappuccino
defined the ready-to-drink coffee
segment. We also added new
brands, launching FruitWorks and, in
January 2001, acquiring the tremen-
dously successful SoBe brand drinks
enhanced with herbal ingredients.
U.S. Non-carbonated Beverage Market% Volume
The addition of Quaker’s Gatoradewould make PepsiCo the clear leader inthe non-carbonated beverage market.*Includes SoBe, acquired 2001.
PepsiCo* 16%
Gatorade 8%
Coca-Cola 16%
Other 60%
U.S. Beverage Market% Retail Sales
Non-carbonated beverages make up anincreasing percentage of the U.S. beveragemarket and have grown more than twiceas fast as carbonated beverages.
Carbonated Soft Drinks 71%
Bottled Water 3%
Shelf Stable Juices 10%
Sports Drinks 3%
Ready-To-Drink Coffee/Tea 5%
Chilled Juices 8%
9
Charlotte DossinShareholder since 1993.
Diane DossinShareholder since 1977.
Douglas DossinShareholder since 1976.
Claire DossinShareholder since 1992.

In fountain beverages, Tricon Global
Restaurants, our largest fountain cus-
tomer, signed a multi-year agreement
to make Pepsi-Cola the preferred
beverage supplier for its system of
20,000 Pizza Hut, Taco Bell and KFC
restaurants in the United States.
Average Per Capita Consumptionof Carbonated Soft Drinks inLargest Pepsi-Cola MarketsIn Gallons
Relatively low average per capita consumption outside the United Statesmeans opportunity for growth. Pepsi-Colaincreased its share in a majority of ourlargest markets.
0
10
20
30
40
50
60 U.S.
Mex
ico
Cana
da
Spain
Arge
ntina
Braz
il
Saud
i Ara
bia
Unite
d King
dom
Philip
pines
Thail
and
China
India
Worldwide Pepsi-Cola Volume byRegion% Volume
Pepsi-Cola volume climbed both inNorth America and worldwide. Aroundthe world, Pepsi-Cola products accountedfor $32.9 billion in retail sales.
North America 54%
Europe 11%
Middle East/Africa 8%
Asia 12%
Latin America 15%
10
Finally, the merger of Whitman
Corporation and PepsiAmericas com-
bined our second- and third-largest
U.S.-based bottlers and substantially
strengthened our manufacturing and
distribution system.
InternationalPepsi-Cola International (PCI) posted
very healthy performance. Bottler
case sales were up 5% for the year,
and we grew faster than our primary
competitor in nine of the last 10
quarters. That contributed to market
share gains in most of PCI’s top-25
markets. It also helped to drive oper-
ating profit growth by 37%.
The strong results reflect PCI’s
devotion to building its core carbon-
ated soft drink brands, particularly
Pepsi-Cola, 7UP and the Mirinda fla-
vor line. The results also reflect our
strategic focus on the most populous
emerging markets, which offer big
long-term growth opportunities. It’s
paying off: volume grew 10% in
India, 16% in China and, in a dramatic
recovery, more than 100% in Russia.
These results were also due to a
stronger distribution system. During
the year, PCI’s anchor bottlers, PBG
and PepsiAmericas, strengthened
their international operations. Other
important bottling network
upgrades were made in markets such
as Argentina, Brazil, Mexico and
Australia.
Pepsi-Cola International also
renewed its agreement with Tricon
Global Restaurants, ensuring that
Pepsi-Cola brands will continue to be
the preferred beverages of Pizza Hut,
KFC and Taco Bell around the world.

Tropicana showed great strength,
again exceeding our projections
when we acquired the company in
1998. Volume was up 8%, revenue
was up 6% and operating profit rose
30%. In fact, Tropicana’s 2000 profit
was double the annual level of two
years ago.
The biggest engine behind
Tropicana’s growth is its flagship
Tropicana Pure Premium brand, the
fastest-growing major brand in its
category. With double-digit volume
growth in every quarter in 2000,
Pure Premium moved up to become
the third-largest brand of all prod-
ucts sold in U.S. grocery stores. By
year-end, Tropicana’s number one
share in the U.S. chilled juices and
drinks category had grown to 35%,
with gains in every region of the
United States.
Barbara BannisterShareholder since 1980.
Michael ThomasShareholder since 2001.
Pam ThomasShareholder since 1992.
11
The potential of Tropicana Pure
Premium is enormous. It offers an
ideal combination of great taste, con-
venience and nutrition. Chilled, not-
from-concentrate orange juice natu-
rally offers an array of nutritional
benefits that consumers value highly
— and that Tropicana actively pro-
motes. In fact, Tropicana actually
uses a health claim in advertising:
“Diets containing foods that are
good sources of potassium and low
in sodium (such as Tropicana Pure
Premium) may reduce the risk of
high blood pressure and stroke.”
To provide consumers even
greater nutritional benefits and
variety, Tropicana is fortifying its
juices with calcium, Vitamin E and
additional Vitamin C and offering
tasty blends of juices.
John SivertsenShareholder since 1993.
Elizabeth SivertsenShareholder since 1994.
John Sivertsen IIShareholder since 1994.
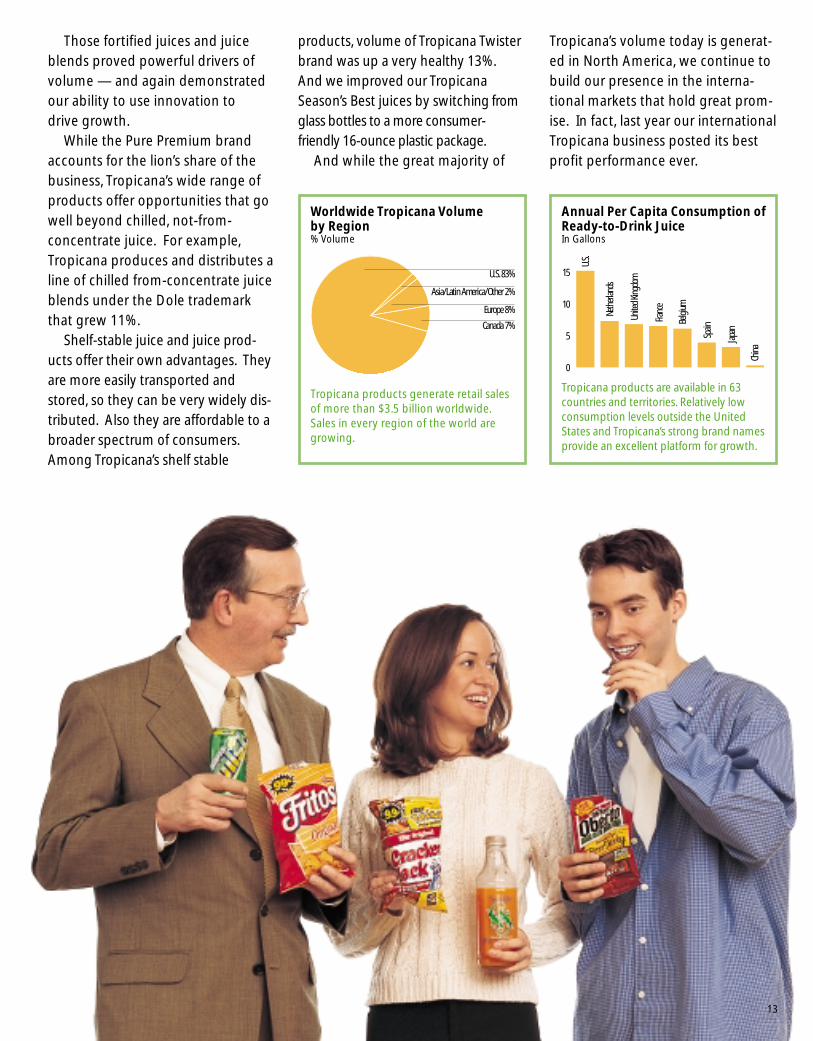
Tropicana Pure Premium Not-From-Concentrate Orange Juice Sales% Share in U.S. Supermarkets
Tropicana Pure Premium is gaining share,with sales growing faster than the not-from-concentrate orange juice market.
1996 1997 1998 1999 2000
70%71% 71%
72%
74%
Top-Selling Refrigerated JuiceBrands in U.S. Supermarkets $ Sales in Millions
Tropicana Pure Premium orange juiceretail sales are $1.3 billion in supermarkets,making it the largest-selling refrigeratedjuice in the largest distribution channel.
0
300
600
900
1200
1500
Tropic
ana P
ure P
remium
Ora
nge J
uice
Minu
te M
aid O
rang
e Juic
e
Sunn
y Deli
ght D
rink
Florid
a’s N
atur
al Or
ange
Juice
Minu
te M
aid D
rink
Dole
Blen
d
Tam
pico D
rink
Tropic
ana S
easo
n’s B
est
Tropic
ana P
ure P
remium
Gra
pefru
it Ju
ice
Welc
h’s D
rink
U.S. Tropicana DistributionChannels% Volume
Tropicana volume grew in all major distribution channels, with volume in the foodservice and massmerchandise/club/military/drug channels rising at double-digit rates.
Supermarkets 66%
Convenience/Direct StoreDelivery/Dairy 12%
Mass Merchandise/Club/Military/Drug 14%
Foodservice 8%
Tropicana U.S. Product Mix% Volume
Innovations such as fortifying juices, newpackaging and new flavors increased vol-umes of Pure Premium as well as otherchilled and shelf-stable juices.
Tropicana Pure Premium 63%
Tropicana Twister 8%
Other 8%
Dole 5%
Tropicana Season’s Best 16%
U.S. Chilled Juices and Drinks Market % Retail Sales in Supermarkets
Tropicana grew its share of the chilledjuices and drinks market for the third consecutive year.
Tropicana 35%
Minute Maid 18%
Procter & Gamble 7%
Private Label 16%
Other 16%
Florida’s Natural 8%
12
Those fortified juices and juice
blends proved powerful drivers of
volume — and again demonstrated
our ability to use innovation to
drive growth.
While the Pure Premium brand
accounts for the lion’s share of the
business, Tropicana’s wide range of
products offer opportunities that go
well beyond chilled, not-from-
concentrate juice. For example,
Tropicana produces and distributes a
line of chilled from-concentrate juice
blends under the Dole trademark
that grew 11%.
Shelf-stable juice and juice prod-
ucts offer their own advantages. They
are more easily transported and
stored, so they can be very widely dis-
tributed. Also they are affordable to a
broader spectrum of consumers.
Among Tropicana’s shelf stable
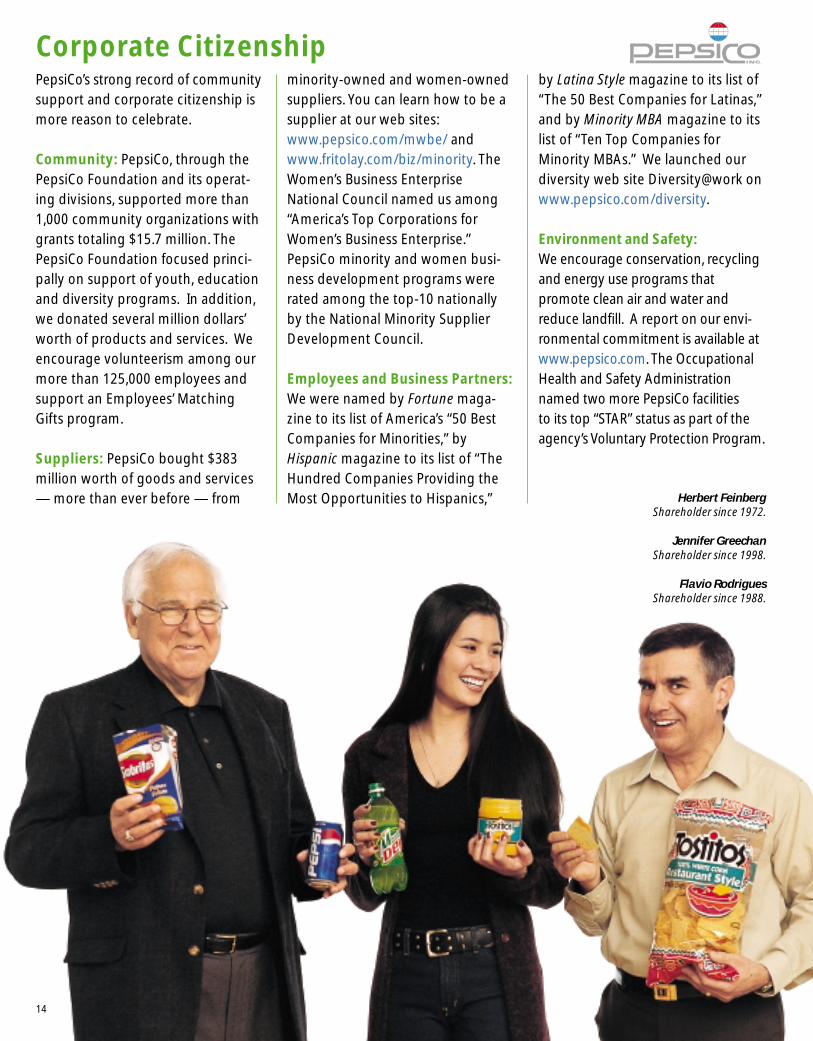
Annual Per Capita Consumption ofReady-to-Drink Juice In Gallons
Tropicana products are available in 63countries and territories. Relatively lowconsumption levels outside the UnitedStates and Tropicana’s strong brand namesprovide an excellent platform for growth.
0
5
10
15
U.S.
Neth
erlan
ds
Unite
d King
dom
Franc
e
Belgi
um
Spain
Japa
n
China
Worldwide Tropicana Volume by Region% Volume
Tropicana products generate retail salesof more than $3.5 billion worldwide.Sales in every region of the world aregrowing.
U.S. 83%
Asia/Latin America/Other 2%
Europe 8%
Canada 7%
13
products, volume of Tropicana Twister
brand was up a very healthy 13%.
And we improved our Tropicana
Season’s Best juices by switching from
glass bottles to a more consumer-
friendly 16-ounce plastic package.
And while the great majority of
Tropicana’s volume today is generat-
ed in North America, we continue to
build our presence in the interna-
tional markets that hold great prom-
ise. In fact, last year our international
Tropicana business posted its best
profit performance ever.
PepsiCo’s strong record of community
support and corporate citizenship is
more reason to celebrate.
Community: PepsiCo, through the
PepsiCo Foundation and its operat-
ing divisions, supported more than
1,000 community organizations with
grants totaling $15.7 million. The
PepsiCo Foundation focused princi-
pally on support of youth, education
and diversity programs. In addition,
we donated several million dollars’
worth of products and services. We
encourage volunteerism among our
more than 125,000 employees and
support an Employees’ Matching
Gifts program.
Suppliers: PepsiCo bought $383
million worth of goods and services
— more than ever before — from
minority-owned and women-owned
suppliers. You can learn how to be a
supplier at our web sites:
www.pepsico.com/mwbe/ and
www.fritolay.com/biz/minority. The
Women’s Business Enterprise
National Council named us among
“America’s Top Corporations for
Women’s Business Enterprise.”
PepsiCo minority and women busi-
ness development programs were
rated among the top-10 nationally
by the National Minority Supplier
Development Council.
Employees and Business Partners:We were named by Fortune maga-
zine to its list of America’s “50 Best
Companies for Minorities,” by
Hispanic magazine to its list of “The
Hundred Companies Providing the
Most Opportunities to Hispanics,”
by Latina Style magazine to its list of
“The 50 Best Companies for Latinas,”
and by Minority MBA magazine to its
list of “Ten Top Companies for
Minority MBAs.” We launched our
diversity web site Diversity@work on
www.pepsico.com/diversity.
Environment and Safety:We encourage conservation, recycling
and energy use programs that
promote clean air and water and
reduce landfill. A report on our envi-
ronmental commitment is available at
www.pepsico.com. The Occupational
Health and Safety Administration
named two more PepsiCo facilities
to its top “STAR” status as part of the
agency’s Voluntary Protection Program.
14
Corporate Citizenship
Herbert FeinbergShareholder since 1972.
Jennifer GreechanShareholder since 1998.
Flavio RodriguesShareholder since 1988.

Principal Divisions and Corporate Officers(Listings include age and years of PepsiCo experience.)
Executive OfficesPepsiCo, Inc.700 Anderson Hill RoadPurchase, NY 10577(914) 253-2000
Co-Founder of PepsiCo, Inc.Donald M. KendallOver 50 years of PepsiCo experience
Corporate OfficersRoger A. EnricoChairman of the Board andChief Executive Officer56, 29 years
Steven S ReinemundPresident and Chief Operating Officer52, 16 years
Arthur B. AndersonSenior Vice President,Advanced Technology51, under one year
Peter A. BridgmanSenior Vice President and Controller48, 15 years
Albert P. CareySenior Vice President,Sales and Retailer Strategies49, 19 years
Massimo F. d’AmoreSenior Vice President,Corporate Development45, 5 years
Ronald E. HarrisonSenior Vice President,Global Diversity andCommunity Affairs65, 36 years
Tod J. MacKenzieSenior Vice President,Corporate Communications43, 13 years
Matthew M. McKennaSenior Vice President and Treasurer50, 7 years
Margaret D. MooreSenior Vice President,Human Resources53, 27 years
Indra K. NooyiSenior Vice President and Chief Financial Officer45, 7 years
Robert F. Sharpe, Jr.Senior Vice President, PublicAffairs, General Counsel and Secretary49, 3 years
Principal Divisions and Officers
Pepsi-Cola Company700 Anderson Hill RoadPurchase, NY 10577(914) 253-2000
Pepsi-Cola North AmericaGary M. RodkinPresident and Chief Executive Officer48, 5 years
Pepsi-Cola InternationalPeter M. ThompsonPresident and Chief Executive Officer54, 10 years
Frito-Lay Company7701 Legacy DrivePlano, TX 75024(972) 334-7000
Frito-Lay North AmericaAbelardo E. BruPresident and Chief Executive Officer52, 24 years
Frito-Lay Europe/Africa/Middle EastFrito-Lay Trading Company(Europe), GmbH18 avenue Louis CasaiCH-1211 Geneva 28Switzerland
Michael D. WhitePresident and Chief Executive Officer49, 11 years
Frito-Lay Latin America/Asia Pacific/AustraliaAv. De las Palmas No. 735Col. Lomas de ChapultepecMexico, 11000, D.F.
Rogelio M. RebolledoPresident and Chief Executive Officer56, 24 years
Tropicana Products, Inc.1001 13th Avenue EastBradenton, FL 34208(941) 747-4461
Brock H. LeachPresident and Chief Executive Officer42, 18 years
PepsiCo ProductsPepsiCo has hundreds ofbrands. These are some ofthe best known.
Frito-Lay BrandsLay’s Potato ChipsBaked Lay’s Potato CrispsRuffles Potato ChipsBaked Ruffles Potato ChipsDoritos Tortilla Chips3D’s SnacksTostitos Tortilla ChipsBaked Tostitos Tortilla ChipsSantitas Tortilla ChipsFritos Corn ChipsCheetos Cheese Flavored
SnacksRold Gold Pretzels
Funyuns Onion Flavored Rings
Sunchips Multigrain SnacksCracker Jack Candy Coated
PopcornChester’s PopcornGrandma’s CookiesMunchos Potato CrispsSmartfood PopcornBaken-ets Fried Pork SkinsObertos Meat SnacksFrito-Lay Dips & SalsasOutside the U.S.Bocabits Wheat SnacksCrujitos Corn Snacks Fandangos Corn SnacksHamkas SnacksNibb-It Sticks and RingsNiknaks Cheese SticksQuavers Potato Snacks
Sabritas Potato ChipsTwisties Cheese SnacksWalkers Potato CrispsJack’s SnacksSimba Snacks
Pepsi-Cola BrandsPepsi-ColaDiet PepsiPepsi OneMountain DewWild Cherry PepsiSliceMug Sierra MistFruitworksAll SportLipton Brisk (Partnership)Lipton’s Iced Tea
(Partnership)
Aquafina Frappuccino (Partnership)SoBeOutside the U.S.Mirinda 7UPPepsi Max
Tropicana BrandsTropicana Pure PremiumTropicana Season’s BestTropicana Twister Dole (Under license)Pure TropicsOutside the U.S.LoózaCopella Fruvita
15

John F. AkersFormer Chairman of the Board and Chief Executive OfficerInternational Business Machines Corporation66. Elected 1991.
Robert E. AllenFormer Chairman of the Board and Chief Executive Officer, AT&T Corp.66. Elected 1990.
Roger A. EnricoChairman of the Board and Chief Executive OfficerPepsiCo, Inc.56. Elected 1987.
Peter FoyChairman, Whitehead Mann Group60. Elected 1997.
Ray L. HuntChairman and Chief Executive Officer Hunt Oil Company and Chairman,Chief Executive Officer and President Hunt Consolidated, Inc.57. Elected 1996.
Arthur C. MartinezFormer Chairman of the Board, President and Chief Executive Officer Sears, Roebuck and Co.61. Elected 1999.
John J. MurphyFormer Chairman of the Board and Chief Executive OfficerDresser Industries, Inc.69. Elected 1984.
Franklin D. RainesChairman of the Board and Chief Executive OfficerFannie Mae52. Elected 1999.
Steven S ReinemundPresident and Chief Operating OfficerPepsiCo, Inc.52. Elected 1996.
Sharon Percy RockefellerPresident and Chief Executive Officer WETA Public Stations, Washington, D.C.56. Elected 1986.
Franklin A. ThomasConsultant, TFF Study Group66. Elected 1994.
Cynthia M. TrudellVice President, General Motors and Chairman and President, Saturn Corporation47. Elected 2000.
Solomon D. TrujilloChairman, President and Chief Executive Officer Graviton, Inc.49. Elected 2000.
PepsiCo, Inc. Board of Directors(Listings include age and year elected PepsiCo director.)
Left to right: John F. Akers, Sharon Percy Rockefeller, Peter Foy
Left to right: Ray L. Hunt, Robert E. Allen, Steven S Reinemund,Franklin D. Raines
Left to right: Solomon D. Trujillo,4Cynthia M. Trudell, Roger A. Enrico4
Left to right: Franklin A. Thomas, John J. Murphy,Arthur C. Martinez
16

17
All per share amounts are computed using weighted average sharesoutstanding and assume dilution.
Management’s Discussion and Analysis is presented in four sections. The first section discusses certain items affecting the comparability of results and certain market and other risks we face.The second section analyzes the Results of Operations, first on a consolidated basis and then for each of our business segments (pages20-24). The final two sections address Consolidated Cash Flows andLiquidity and Capital Resources (page 24).
Cautionary StatementsFrom time to time, in written reports (including the Chairman’s letter inour annual report) and in oral statements, we discuss expectationsregarding our future performance, the impact of the euro conversionand the impact of current global macro-economic issues. These “forward-looking statements” are based on currently available compet-itive, financial and economic data and our operating plans. They areinherently uncertain, and investors must recognize that events couldturn out to be significantly different from our expectations.
Introduction To Our BusinessItems Affecting Comparability
Fifty-third Week in 2000Comparisons of 2000 to 1999 are affected by an additional week ofresults in the 2000 reporting year. Because our fiscal year ends on thelast Saturday in December, a fifty-third week is added every 5 or 6years. The fifty-third week increased 2000 net sales by an estimated$294 million, operating profit by an estimated $62 million and netincome by an estimated $44 million or $0.03 per share.
Bottling TransactionsIn 1998, we announced our intention to restructure our bottling operations in order to compete more effectively, particularly in theNorth American market.
During 1999, we completed four transactions creating four anchorbottlers. In April 1999, certain wholly-owned bottling businesses,referred to as The Pepsi Bottling Group (PBG), completed an initial public offering, with PepsiCo retaining a direct noncontrolling owner-ship interest of 35.5%. In May, we combined certain other bottlingoperations with Whitman Corporation retaining a noncontrolling ownership interest of approximately 38%. In July, we combined certainother bottling operations with PepCom Industries, Inc. retaining a non-controlling interest of 35%. In October, we formed a business venturewith Pohlad Companies, a Pepsi-Cola franchisee, retaining a noncon-trolling ownership interest of approximately 24% in the venture’s principal operating subsidiary, PepsiAmericas, Inc.
Our financial statements include the results of our bottling operations on a consolidated basis through the transaction datesabove, and our proportionate share of income under the equitymethod subsequent to those dates.
In December 2000, Whitman merged with PepsiAmericas. We nowown approximately 37% of the combined bottler which has sincechanged its name to PepsiAmericas, Inc. As part of the merger, we willparticipate in an earn-out option whereby we may receive additional
PepsiAmericas’ shares if certain performance targets are met. Ourthree anchor bottlers distribute approximately three-fourths of ourNorth American volume.
Asset Impairment and Restructuring Charges 1999 1998
Asset impairment chargesHeld and used in the business
Property, plant and equipment $ 8 $ 149
Intangible assets – 37
Other assets – 14
Held for disposal/abandonment
Property, plant and equipment 29 54
Total asset impairment 37 254
Restructuring chargesEmployee related costs 19 24
Other charges 9 10
Total restructuring 28 34
Total $ 65 $ 288
After-tax $ 40 $ 261
Per share $0.03 $0.17
Impairment by segmentFrito-Lay North America $ 37 $ 54
Pepsi-Cola International – 6
Combined segments 37 60
Bottling operations – 194
$ 37 $ 254
The 1999 asset impairment and restructuring charge of $65 millionrelated to the closure of three plants and impairment of equipment atFrito-Lay North America. The asset impairment charges primarilyreflected the reduction in the carrying value of the land and buildingsto their estimated fair market value based on current selling prices forcomparable real estate, less costs to sell, and the write-off of the netbook value of equipment which could not be redeployed. The plantclosures were completed during 1999. The majority of these assetswere either disposed of or abandoned in 1999. The restructuringcharges of $28 million primarily included severance costs for approxi-mately 860 employees and plant closing costs. Substantially all of the terminations occurred during 1999.
The 1998 asset impairment and restructuring charges of $288 million were comprised of the following:
• A charge of $218 million, for asset impairment of $200 million andrestructuring charges of $18 million related to our Russian bottlingoperations. The restructuring actions, in response to lowerdemand, an adverse change in the business climate and anexpected continuation of operating losses and cash deficits inRussia following the August 1998 devaluation of the ruble, includ-ed a reduction of our cost structure primarily through closing facil-ities, renegotiating manufacturing contracts and reducing thenumber of employees. We also evaluated our long-lived bottling
MANAGEMENT’S DISCUSSION AND ANALYSIS(tabular dollars in millions except per share amounts)
18
assets for impairment, triggered by the reduction in the utilizationof assets caused by the adverse economic conditions. The impair-ment charge reduced the net book value of the assets to their esti-mated fair market value, based primarily on amounts recently paidfor similar assets in that marketplace. Of the total charge of $218 million, $212 million related to bottling operations thatbecame part of PBG in 1999.
• An impairment charge of $54 million related to manufacturingequipment at Frito-Lay North America. The charge primarilyreflected the write-off of the net book value of the equipment andrelated projects. Disposal or abandonment of these assets wascompleted in 1999.
• A charge of $16 million for employee related costs resulting fromthe separation of Pepsi-Cola North America’s concentrate and bottling organizations. Of this amount, $10 million related to bottling operations that became part of PBG in 1999.
The employee related costs for 1998 of $24 million primarily includ-ed severance and relocation costs for approximately 2,700 mostly part-time employees. The terminations either occurred or related tothe bottling operations that became part of PBG in 1999.
Restructuring reserves totaling $24 million at December 30, 2000are included in accounts payable and other current liabilities in theConsolidated Balance Sheet.
Tropicana AcquisitionIn August 1998, we acquired Tropicana Products, Inc. for $3.3 billion.The 1998 results of operations include Tropicana subsequent to theacquisition date.
Subsequent Acquisition of South Beach BeverageCompany, LLCOn January 5, 2001, we completed the acquisition of South BeachBeverage Company, LLC for approximately $337 million in cash,retaining a 91% interest in the newly formed South Beach BeverageCompany, Inc. (SoBe). SoBe manufactures and markets an innovativeline of alternative non-carbonated beverages including fruit blends,energy drinks, dairy-based drinks, exotic teas and other beverages withherbal ingredients, which are distributed under license by a network ofindependent distributors, primarily in the United States.
Proposed Merger with The Quaker Oats CompanyOn December 4, 2000, we announced a merger agreement with TheQuaker Oats Company (Quaker). Under the terms of this agreement,Quaker shareholders will receive 2.3 shares of PepsiCo capital stocksubject to a maximum value of $105 for each Quaker share. In theevent that the value exceeds $105, the exchange ratio is subject toadjustment. Further, if the value of PepsiCo shares received by Quakershareholders for each Quaker share is below $92, Quaker may termi-nate the merger agreement. Based on the closing price of our stock of$42.375 per share on December 1, 2000, the proposed tax-free transac-tion would be valued at $97.4625 per Quaker share. The proposedmerger is subject to certain closing conditions, including shareholderapproval at both companies, and certain regulatory approvals.
Assuming that 2.3 shares of PepsiCo capital stock are issued foreach share of Quaker common stock, we will issue approximately 315million shares of PepsiCo capital stock to Quaker shareholders in themerger. These PepsiCo capital shares exchanged for Quaker shares willrepresent approximately 18% of the outstanding shares of PepsiCocapital stock after the merger. This information is based on the num-ber of shares of PepsiCo capital stock and Quaker common stockexpected to be outstanding at the time of the merger. In conjunctionwith the merger agreement, we entered into a stock option agreementwith Quaker which granted us an option, under certain circumstances,to purchase up to approximately 19.9% of the outstanding shares ofQuaker common stock.
The merger is expected to close in the first half of 2001 and is expected to be accounted for as a “pooling-of-interests.” We anticipate that we will sell between 15 to 20 million shares of repurchasedPepsiCo capital stock prior to the closing to qualify for “pooling-of-interests” accounting treatment.
We expect to incur transaction costs of approximately $100 millionnecessary to complete the merger. We also expect to incur additionalcosts subsequent to the merger to integrate the two companies.
New Accounting StandardsIn June 1998, the Financial Accounting Standards Board (FASB) issuedStatement of Financial Accounting Standards No. 133, Accounting forDerivative Instruments and Hedging Activities. SFAS 133, as amended bySFAS 137 and SFAS 138, is effective for our fiscal year beginningDecember 31, 2000. SFAS 133 establishes accounting and reportingstandards for derivative instruments, including certain derivativeinstruments embedded in other contracts, and for hedging activities.It requires that we recognize all derivative instruments as either assetsor liabilities in the Consolidated Balance Sheet and measure thoseinstruments at fair value. Based on derivatives outstanding atDecember 30, 2000, the adoption would increase assets by approxi-mately $14 million and liabilities by approximately $9 million withapproximately $5 million recognized in accumulated other compre-hensive income and less than $1 million recognized in theConsolidated Statement of Income.
In May 2000, the Emerging Issues Task Force (EITF) reached a consensus on Issue 00-14, Accounting for Certain Sales Incentives.EITF 00-14 addresses the recognition and income statement classification of various sales incentives. Among its requirements,the consensus will require the costs related to consumer coupons currently classified as marketing costs to be classified as a reduction ofrevenue. The impact of adopting this consensus is not expected tohave a material impact on our results of operations. The consensus iseffective for the second quarter of 2001.
In January 2001, the EITF reached a consensus on Issue 00-22,Accounting for “Points” and Certain Other Time-Based or Volume-BasedSales Incentive Offers, and Offers for Free Products or Services to BeDelivered in the Future. Issue 00-22 will require that certain cash rebatesto customers currently recognized as marketing costs be classified as areduction of revenue. The consensus is effective for the first quarter of2001. We are currently assessing this consensus and have not yetmade a determination of the impact adoption will have on our consolidated financial statements.
18

19
During 2000, the EITF added to its agenda various other revenuerecognition issues that could impact the income statement classifica-tion of certain promotional payments. We classify promotional payments as either a reduction of net sales or marketing costs. Total promotional expenses classified as marketing costs were $2.4 billion in 2000, $2.3 billion in 1999 and $2.1 billion in 1998.
Market and Other Risk Factors
Market RiskThe principal market risks (i.e., the risk of loss arising from adversechanges in market rates and prices) to which we are exposed are:
• commodity prices, affecting the cost of our raw materials and fuel,• foreign exchange risks, and• interest rates on our debt and short-term investment portfolios.In the normal course of business, we manage these risks through a
variety of strategies, including the use of hedging transactions, execut-ed in accordance with our policies. Our hedging transactions include,but are not limited to, the use of various derivative financial and com-modity instruments. As a matter of policy, we do not use derivativeinstruments unless there is an underlying exposure. We do not usederivative instruments for trading or speculative purposes.
Commodity PricesWe are subject to market risk with respect to the cost of commoditiesbecause our ability to recover increased costs through higher pricingmay be limited by the competitive environment in which we operate.We manage this risk primarily through the use of fixed-price purchaseorders, pricing agreements, geographic diversity and futures contracts.We use futures contracts to hedge fluctuations in prices of a portion ofanticipated commodity purchases, primarily oil, corn, fuel and juice concentrates. Our use of futures contracts is not significant to our commodity purchases.
Our commodity futures positions were $45 million at December 30,2000 and $145 million at December 25, 1999. Our commodity futuresposition resulted in a net unrealized gain of $3 million at December 30,2000 and a net unrealized loss of $6 million at December 25, 1999. Weestimate that a 10% decline in commodity prices would have reducedthe 2000 unrealized net gain by $5 million and increased the 1999unrealized net loss by $14 million. Any change in the value of our deriv-ative instruments would be substantially offset by an opposite changein the value of the underlying hedged items.
Foreign ExchangeInternational operations constitute about 21% of our 2000 and 20% ofour 1999 business segment operating profit. Operating in internation-al markets involves exposure to movements in foreign exchange rates,primarily the Mexican peso, British pound, Canadian dollar and euro.Changes in foreign exchange rates would have the largest impact ontranslating our international operating profit into U.S. dollars.
On occasion, we may enter into derivative financial instruments, asnecessary, to reduce the effect of foreign exchange rate changes. Wemanage the use of foreign exchange derivatives centrally. AtDecember 30, 2000, we had forward contracts to exchange Britishpounds for U.S. dollars with an aggregate notional amount of
$336 million. Unrealized losses on these contracts were $9 million at December 30, 2000. We estimate that an unfavorable 10% change in the exchange rate would have increased the 2000 unrealized losses by $32 million. Forward contracts outstanding at December 25, 1999 were not material to the financial statements.Any change in the value of our derivative instruments would be substantially offset by an opposite change in the value of the underlying hedged items.
Interest RatesWe centrally manage our debt and investment portfolios consideringinvestment opportunities and risks, tax consequences and overallfinancing strategies. We use interest rate and currency swaps to effec-tively change the interest rate and currency of specific debt issuances,with the objective of reducing our overall borrowing costs. Theseswaps are entered into concurrently with the issuance of the debt thatthey are intended to modify. The notional amount, interest paymentand maturity dates of the swaps match the principal, interest paymentand maturity dates of the related debt. Accordingly, any market risk oropportunity associated with these swaps is offset by the opposite market impact on the related debt.
Our investment portfolios primarily consist of cash equivalents andshort-term marketable securities. Accordingly, the carrying amountsapproximate market value. It is our practice to hold these investmentsto maturity.
Assuming year-end 2000 and 1999 variable rate debt and invest-ment levels, a one-point increase in interest rates would have increasednet interest expense by $8 million in 2000 and $13 million in 1999. Thechange in this impact from 1999 resulted from decreased variable ratedebt levels and increased investment levels at year-end 2000. This sensitivity analysis includes the impact of existing interest rate and currency swaps.
Euro ConversionOn January 1, 1999, member countries of the European Union fixedconversion rates between their existing currencies (legacy currencies)and one common currency - the euro. The euro trades on currencyexchanges and may be used in business transactions. Conversion tothe euro eliminated currency exchange rate risk between the membercountries. Beginning in January 2002, new euro-denominated billsand coins will be issued, and legacy currencies will be withdrawn fromcirculation. Our operating subsidiaries affected by the euro conversionhave established plans to address the issues raised by the euro currency conversion. These issues include, among others, the need toadapt computer and financial systems, business processes and equipment, such as vending machines, to accommodate euro-denominated transactions and the impact of one common currency onpricing. Since financial systems and processes currently accommodatemultiple currencies, the plans contemplate conversion in 2001 if notalready addressed in conjunction with other system or process initia-tives. We do not expect the system and equipment conversion costs tobe material. Due to numerous uncertainties, we cannot reasonablyestimate the long-term effects one common currency may have onpricing and the resulting impact, if any, on financial condition or resultsof operations.
20
Results of OperationsConsolidated Review
GeneralIn the discussions below, the year-over-year dollar change in pound or kilosales of salty and sweet snacks for Frito-Lay, bottler case sales by company-owned bottling operations and concentrate unit sales to franchisees forPepsi-Cola, and four-gallon equivalent cases for Tropicana is referred to asvolume. Price changes over the prior year and the impact of product, pack-age and country sales mix changes are referred to as effective net pricing.
Comparable net sales and operating profit, also referred to as newPepsiCo, present the deconsolidation of our bottling operations as if ithad occurred at the beginning of 1998, and exclude impairment andrestructuring charges and the impact of the fifty-third week in 2000.Tropicana results are included subsequent to its acqusition in 1998.
Net Sales% Change B/(W)
2000 1999 1998 2000 1999
Reported $20,438 $20,367 $22,348 – (9)
Comparable $20,144 $18,666 $16,300 8 15
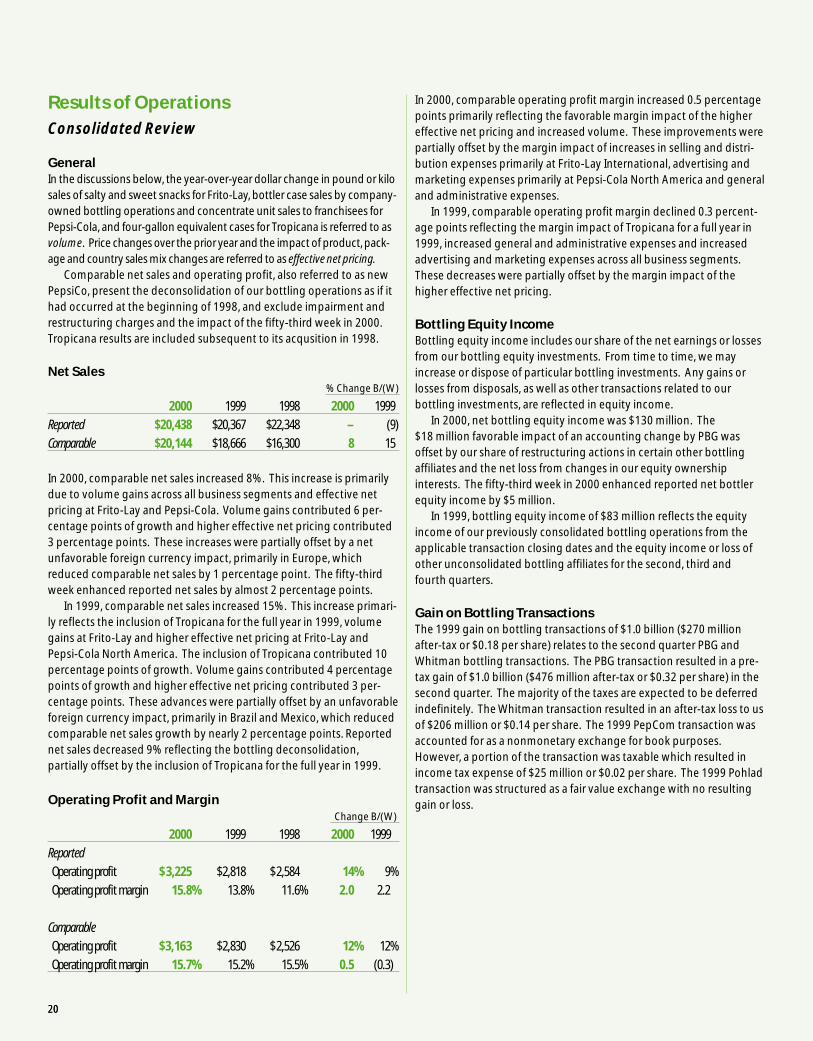
In 2000, comparable net sales increased 8%. This increase is primarilydue to volume gains across all business segments and effective netpricing at Frito-Lay and Pepsi-Cola. Volume gains contributed 6 per-centage points of growth and higher effective net pricing contributed3 percentage points. These increases were partially offset by a netunfavorable foreign currency impact, primarily in Europe, whichreduced comparable net sales by 1 percentage point. The fifty-thirdweek enhanced reported net sales by almost 2 percentage points.
In 1999, comparable net sales increased 15%. This increase primari-ly reflects the inclusion of Tropicana for the full year in 1999, volumegains at Frito-Lay and higher effective net pricing at Frito-Lay andPepsi-Cola North America. The inclusion of Tropicana contributed 10percentage points of growth. Volume gains contributed 4 percentagepoints of growth and higher effective net pricing contributed 3 per-centage points. These advances were partially offset by an unfavorableforeign currency impact, primarily in Brazil and Mexico, which reducedcomparable net sales growth by nearly 2 percentage points. Reportednet sales decreased 9% reflecting the bottling deconsolidation,partially offset by the inclusion of Tropicana for the full year in 1999.
Operating Profit and MarginChange B/(W)
2000 1999 1998 2000 1999
Reported
Operating profit $ 3,225 $2,818 $ 2,584 14% 9%
Operating profit margin 15.8% 13.8% 11.6% 2.0 2.2
Comparable
Operating profit $3,163 $2,830 $ 2,526 12% 12%
Operating profit margin 15.7% 15.2% 15.5% 0.5 (0.3)
In 2000, comparable operating profit margin increased 0.5 percentagepoints primarily reflecting the favorable margin impact of the highereffective net pricing and increased volume. These improvements werepartially offset by the margin impact of increases in selling and distri-bution expenses primarily at Frito-Lay International, advertising andmarketing expenses primarily at Pepsi-Cola North America and generaland administrative expenses.
In 1999, comparable operating profit margin declined 0.3 percent-age points reflecting the margin impact of Tropicana for a full year in1999, increased general and administrative expenses and increasedadvertising and marketing expenses across all business segments.These decreases were partially offset by the margin impact of the higher effective net pricing.
Bottling Equity IncomeBottling equity income includes our share of the net earnings or lossesfrom our bottling equity investments. From time to time, we mayincrease or dispose of particular bottling investments. Any gains orlosses from disposals, as well as other transactions related to our bottling investments, are reflected in equity income.
In 2000, net bottling equity income was $130 million. The $18 million favorable impact of an accounting change by PBG was offset by our share of restructuring actions in certain other bottlingaffiliates and the net loss from changes in our equity ownership interests. The fifty-third week in 2000 enhanced reported net bottlerequity income by $5 million.
In 1999, bottling equity income of $83 million reflects the equityincome of our previously consolidated bottling operations from theapplicable transaction closing dates and the equity income or loss ofother unconsolidated bottling affiliates for the second, third and fourth quarters.
Gain on Bottling TransactionsThe 1999 gain on bottling transactions of $1.0 billion ($270 millionafter-tax or $0.18 per share) relates to the second quarter PBG andWhitman bottling transactions. The PBG transaction resulted in a pre-tax gain of $1.0 billion ($476 million after-tax or $0.32 per share) in thesecond quarter. The majority of the taxes are expected to be deferredindefinitely. The Whitman transaction resulted in an after-tax loss to usof $206 million or $0.14 per share. The 1999 PepCom transaction wasaccounted for as a nonmonetary exchange for book purposes.However, a portion of the transaction was taxable which resulted inincome tax expense of $25 million or $0.02 per share. The 1999 Pohladtransaction was structured as a fair value exchange with no resultinggain or loss.
20

21
Interest Expense, net% Change B/(W)
2000 1999 1998 2000 1999
Reported
Interest expense $ (221) $(363) $(395) 39 8
Interest income 76 118 74 (36) 59
Interest expense, net $ (145) $(245) $(321) 41 24
In 2000, interest expense declined 39% reflecting significantly loweraverage debt levels, partially offset by higher average interest rates.Lower average debt levels reflect the third quarter 1999 repayment ofborrowings used to finance the Tropicana acquisition and the absenceof the financing related to the Pepsi Bottling Group. Interest incomedeclined 36% primarily due to lower average investment balances partially offset by favorable changes in the fair value of equity derivative contracts. The fifty-third week increased net interestexpense by $3 million.
In 1999, interest expense decreased 8% due to lower average interestrates on slightly lower average outstanding debt levels. Interest incomeincreased 59% primarily due to higher average investment balances,partially offset by lower average interest rates on these balances. Thehigher average investment balances primarily result from the first quarter proceeds received from PBG as settlement of pre-existing intercompany balances.
Provision for Income Taxes2000 1999 1998
ReportedProvision for income taxes $1,027 $1,606 $270Effective tax rate 32.0% 43.9% 11.9%
Comparable*Provision for income taxes $1,007 $ 876 $791Effective tax rate 32.0% 32.2% 31.0%
* Excludes the tax effects of the fifty-third week in 2000, the tax effects of the bottling transactions of $755and impairment and restructuring charges of $25 in 1999, and the income tax benefit of $494 and the taxeffect of the impairment and restructuring charges of $27 in 1998.
In 2000, the comparable effective tax rate remained nearly flat. Thereported effective tax rate decreased 11.9 percentage points primarilyas a result of the tax effects of the 1999 bottling transactions.
In 1999, the comparable effective tax rate increased 1.2 percentagepoints primarily from the absence in 1999 of the settlement in 1998 ofprior years' audit issues offset by the benefit of proportionately lowerbottling income. The reported effective tax rate increased 32 percent-age points primarily as a result of the tax effects of the bottling transac-tions and the absence in 1999 of the 1998 income tax benefit relatingto our concentrate operations in Puerto Rico.
Net Income and Net Income Per Share - Assuming Dilution% Change B/(W)
2000 1999 1998 2000 1999Net income
Reported $2,183 $2,050 $1,993 6 3
Comparable* $2,139 $1,845 $1,760 16 5
Net income per share -
assuming dilution
Reported $ 1.48 $ 1.37 $ 1.31 8 5
Comparable* $ 1.45 $ 1.23 $ 1.16 18 6
* Excludes the impact of the fifty-third week in 2000, the bottling transactions of $245 and impairment andrestructuring charges of $40 in 1999, and the income tax benefit of $494 and impairment and restructuringcharges of $261 in 1998.
In 2000, comparable net income increased 16% and the related netincome per share increased 18% reflecting higher operating profit andlower net interest expense. The increase in net income per share alsoreflects the benefit from a 1.4% reduction in average shares outstand-ing assuming dilution.
In 1999, comparable net income increased 5% and the related netincome per share increased 6% due to increased operating profit and adecrease in net interest expense, partially offset by a higher effectivetax rate. Net income per share also benefited from a 1.5% reduction inaverage shares outstanding assuming dilution.
Business Segments
Additional information concerning our operating segments is
presented in Note 17.
Frito-Lay
The standard volume measure is pounds for North America and kilosfor International. Pound and kilo growth are reported on a systemwidebasis which includes joint ventures.
Frito-Lay North America% Change B/(W)
2000 1999 1998 2000 1999
Net salesReported $8,562 $7,865 $7,474 9 5Comparable* $8,398 $7,865 $7,474 7 5
Operating profitReported $1,851 $1,580 $1,424 17 11Comparable* $1,811 $1,645 $1,478 10 11
* Excludes the impact of the fifty-third week in 2000. Operating profit also excludes impairment and restructuring charges of $65 in 1999 and $54 in 1998.

22
2000 vs. 1999Comparable net sales increased 7% primarily due to volume gains andhigher effective net pricing. Sales of our new Snack Kit and Snack Mixproducts and Oberto’s natural beef jerky snacks accounted for almostone-third of this growth. The fifty-third week enhanced reported netsales by 2 percentage points.
Pound volume advanced 4% excluding the impact of the fifty-thirdweek. This growth was primarily driven by most of our core brands,excluding the low-fat and no-fat versions, and by our new Snack Kitproducts. The growth in core brands was led by solid single-digitgrowth in Lay’s brand potato chips, Cheetos brand cheese puffs andRuffles brand potato chips, as well as double-digit growth in Tostitosbrand tortilla chips. These gains were partially offset by continueddeclines in WOW! brand products. Pound volume growth includingthe fifty-third week was 6%.
Comparable operating profit increased 10% primarily reflecting thehigher volume, higher effective net pricing and reduced vegetable oilcosts partially offset by higher energy and fuel costs. Advertising andmarketing expenses grew at a slightly slower rate than sales. The mar-gin impact of these favorable factors contributed to the comparableoperating profit margin improvement of 0.7 percentage points.The fifty-third week enhanced reported operating profit growth by 2 percentage points.
1999 vs. 1998Net sales grew 5% due to volume gains and higher effective net pricing.
Pound volume advanced 4%. The advance was led by high single-digit growth in our core corn products, excluding the low-fat and no-fat versions, mid single-digit growth in Lay's brand potato chips andsignificant growth in Cracker Jack brand products and branded dips.Volume declines in our WOW!, “Baked” Lay's and “Baked” Tostitosbrand products partially offset these gains.
Comparable operating profit increased 11% reflecting the highervolume, higher effective net pricing and reduced commodity costs,partially offset by higher advertising and marketing expenses.Advertising and marketing expenses grew at a faster rate than salesdue primarily to increased promotional allowances.
Frito-Lay International% Change B/(W)
2000 1999 1998 2000 1999
Net salesReported $4,319 $3,750 $3,501 15 7Comparable* $4,258 $3,750 $3,501 14 7
Operating profitReported $ 493 $ 406 $ 367 21 11Comparable* $ 483 $ 406 $ 367 19 11
* Excludes the impact of the fifty-third week in 2000.
2000 vs. 1999Comparable net sales increased 14% primarily driven by volumegrowth at Sabritas in Mexico, Walkers in the United Kingdom and in Turkey, largely due to promotional programs, and effective net pricing at Gamesa and Sabritas in Mexico. The net impact from acquisitions/divestitures contributed 2 percentage points to salesgrowth. Weaker foreign currencies, primarily in the United Kingdomand Australia, decreased net sales by 2 percentage points.
Salty snack kilos increased 13% excluding the impact of the fifty-third week. This growth was led by double-digit increases at Sabritas,our European and Latin American joint ventures and Walkers.Acquisitions did not significantly impact the growth in salty snack volume. Salty snack kilo growth increased 15% including the fifty-third week. Sweet snack kilos increased 4%, excluding the impact of the 1999 sale of our chocolate business in Poland, led by ourbusinesses in Mexico. Sweet snack kilos increased 2% over 1999 including the chocolate business in Poland.
Comparable operating profit grew 19% reflecting strong operatingperformances at Sabritas, Gamesa and in Turkey. The net impact fromacquisitions/divestitures decreased operating profit by 3 percentagepoints. Weaker foreign currencies, primarily in the United Kingdom,decreased operating profit by 2 percentage points.
1999 vs. 1998Net sales increased 7%. Excluding the negative impact of Brazil, whichwas primarily due to macro-economic conditions, net sales increased13% reflecting higher volume and higher effective net pricing. Overall,the higher effective net pricing more than offset the net impact ofweaker currencies outside of Brazil. The unfavorable foreign currencyimpact, primarily in Mexico, reduced net sales growth by 4 percentagepoints. Net contributions from acquisitions/divestitures contributed 1 percentage point to the sales growth.
Salty snack kilos increased 6%. The advance was led by double-digitgrowth at Sabritas in Mexico and several of our businesses in Central andSouth America and in Asia. Including acquisitions/divestitures, total saltysnack kilos increased an additional 4 percentage points to 10% driven primarily by the acquisition in Australia and by acquisitions and mergersof salty snack food businesses in South America. Sweet snack kilosincreased 6% led by strong growth at Gamesa and Sabritas in Mexico.Sweet snack kilos, including the net effect of acquisitions/divestitures,declined 5% primarily as a result of the disposal of our chocolate and biscuit businesses in Poland.
Operating profit increased 11%. Excluding Brazil, operating profitincreased 25% driven by strong performances at Sabritas, Gamesa andseveral of our businesses in Asia. The net impact of weaker foreign currencies outside of Brazil, primarily in Mexico and the UnitedKingdom, reduced operating profit growth by 5 percentage points.The unfavorable foreign currency impact was more than offset by higher effective net pricing.
22
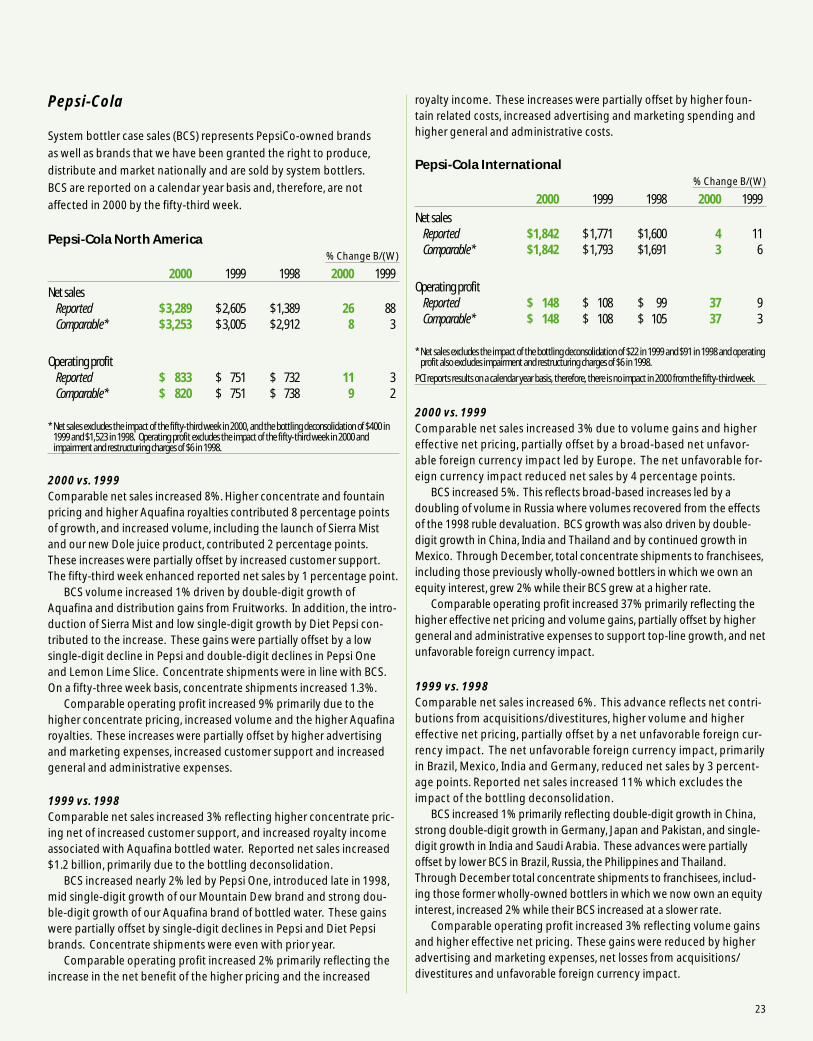
23
Pepsi-Cola
System bottler case sales (BCS) represents PepsiCo-owned brands
as well as brands that we have been granted the right to produce,
distribute and market nationally and are sold by system bottlers.
BCS are reported on a calendar year basis and, therefore, are not
affected in 2000 by the fifty-third week.
Pepsi-Cola North America% Change B/(W)
2000 1999 1998 2000 1999
Net salesReported $ 3,289 $ 2,605 $ 1,389 26 88Comparable* $ 3,253 $ 3,005 $ 2,912 8 3
Operating profitReported $ 833 $ 751 $ 732 11 3Comparable* $ 820 $ 751 $ 738 9 2
* Net sales excludes the impact of the fifty-third week in 2000, and the bottling deconsolidation of $400 in1999 and $1,523 in 1998. Operating profit excludes the impact of the fifty-third week in 2000 and impairment and restructuring charges of $6 in 1998.
2000 vs. 1999Comparable net sales increased 8%. Higher concentrate and fountainpricing and higher Aquafina royalties contributed 8 percentage pointsof growth, and increased volume, including the launch of Sierra Mistand our new Dole juice product, contributed 2 percentage points.These increases were partially offset by increased customer support.The fifty-third week enhanced reported net sales by 1 percentage point.
BCS volume increased 1% driven by double-digit growth ofAquafina and distribution gains from Fruitworks. In addition, the intro-duction of Sierra Mist and low single-digit growth by Diet Pepsi con-tributed to the increase. These gains were partially offset by a low single-digit decline in Pepsi and double-digit declines in Pepsi One and Lemon Lime Slice. Concentrate shipments were in line with BCS.On a fifty-three week basis, concentrate shipments increased 1.3%.
Comparable operating profit increased 9% primarily due to thehigher concentrate pricing, increased volume and the higher Aquafinaroyalties. These increases were partially offset by higher advertisingand marketing expenses, increased customer support and increasedgeneral and administrative expenses.
1999 vs. 1998Comparable net sales increased 3% reflecting higher concentrate pric-ing net of increased customer support, and increased royalty incomeassociated with Aquafina bottled water. Reported net sales increased$1.2 billion, primarily due to the bottling deconsolidation.
BCS increased nearly 2% led by Pepsi One, introduced late in 1998,mid single-digit growth of our Mountain Dew brand and strong dou-ble-digit growth of our Aquafina brand of bottled water. These gainswere partially offset by single-digit declines in Pepsi and Diet Pepsibrands. Concentrate shipments were even with prior year.
Comparable operating profit increased 2% primarily reflecting theincrease in the net benefit of the higher pricing and the increased
royalty income. These increases were partially offset by higher foun-tain related costs, increased advertising and marketing spending andhigher general and administrative costs.
Pepsi-Cola International% Change B/(W)
2000 1999 1998 2000 1999
Net salesReported $1,842 $ 1,771 $1,600 4 11Comparable* $1,842 $ 1,793 $1,691 3 6
Operating profitReported $ 148 $ 108 $ 99 37 9Comparable* $ 148 $ 108 $ 105 37 3
* Net sales excludes the impact of the bottling deconsolidation of $22 in 1999 and $91 in 1998 and operatingprofit also excludes impairment and restructuring charges of $6 in 1998.
PCI reports results on a calendar year basis, therefore, there is no impact in 2000 from the fifty-third week.
2000 vs. 1999Comparable net sales increased 3% due to volume gains and highereffective net pricing, partially offset by a broad-based net unfavor-able foreign currency impact led by Europe. The net unfavorable for-eign currency impact reduced net sales by 4 percentage points.
BCS increased 5%. This reflects broad-based increases led by a doubling of volume in Russia where volumes recovered from the effectsof the 1998 ruble devaluation. BCS growth was also driven by double-digit growth in China, India and Thailand and by continued growth inMexico. Through December, total concentrate shipments to franchisees,including those previously wholly-owned bottlers in which we own anequity interest, grew 2% while their BCS grew at a higher rate.
Comparable operating profit increased 37% primarily reflecting thehigher effective net pricing and volume gains, partially offset by highergeneral and administrative expenses to support top-line growth, and netunfavorable foreign currency impact.
1999 vs. 1998Comparable net sales increased 6%. This advance reflects net contri-butions from acquisitions/divestitures, higher volume and highereffective net pricing, partially offset by a net unfavorable foreign cur-rency impact. The net unfavorable foreign currency impact, primarilyin Brazil, Mexico, India and Germany, reduced net sales by 3 percent-age points. Reported net sales increased 11% which excludes theimpact of the bottling deconsolidation.
BCS increased 1% primarily reflecting double-digit growth in China,strong double-digit growth in Germany, Japan and Pakistan, and single-digit growth in India and Saudi Arabia. These advances were partiallyoffset by lower BCS in Brazil, Russia, the Philippines and Thailand.Through December total concentrate shipments to franchisees, includ-ing those former wholly-owned bottlers in which we now own an equityinterest, increased 2% while their BCS increased at a slower rate.
Comparable operating profit increased 3% reflecting volume gainsand higher effective net pricing. These gains were reduced by higheradvertising and marketing expenses, net losses from acquisitions/divestitures and unfavorable foreign currency impact.

24
Tropicana
The standard measure of volume is four-gallon equivalent cases.% Change B/(W)
2000 1999 1998 2000 1999
Net salesReported $ 2,426 $ 2,253 $ 722 8 NMComparable* $ 2,393 $ 2,253 $ 722 6 NM
Operating profitReported $ 225 $ 170 $ 40 32 NMComparable* $ 220 $ 170 $ 40 30 NM
* Excludes the impact in 2000 of the fifty-third week.
1998 reflects results from August 26, 1998 (the date of acquisition) through December 26, 1998.
NM – not meaningful
2000 vs. 1999Comparable net sales grew 6% primarily due to volume gains. Thesegains were partially offset by lower effective net pricing driven byhigher trade spending and an unfavorable foreign currency impact in Europe. The unfavorable foreign currency impact reduced netsales by 1 percentage point.
Equivalent case volume grew 8%, led by continued double-digitworldwide growth in Pure Premium including strong double-digitgrowth in Pure Premium nutritionals and blends. On a fifty-threeweek basis, equivalent case volume increased 10%.
Comparable operating profit increased 30% primarily due to thevolume gains, production leverage and lower orange juice costs.These increases were partially offset by the higher trade spending,increased media spending and consumer promotions and the unfa-vorable foreign currency impact. The unfavorable foreign currencyimpact reduced operating profit by 4 percentage points.
1999 vs. 1998Volume for the fiscal year 1999 increased 4%, led by an 8% increase inTropicana Pure Premium worldwide. Higher pricing taken to offsetincreases in the cost of oranges, combined with volume growth,drove 1999 operating performance.
Consolidated Cash FlowsIn 2000, cash and cash equivalents decreased $100 million to $864 million. Cash flows from operating activities were used to fundshare repurchases, capital spending, dividend payments and long-term debt payments.
In 1999, cash and cash equivalents increased $653 million to $964million. Cash flows from operating activities and proceeds from debtissuances were used primarily for repayments of short-term borrow-ings, share repurchases, capital spending and dividend payments.
Share RepurchasesOur share repurchase activity was as follows:
2000 1999 1998
Cost $1,430 $1,285 $2,230
Shares repurchasedNumber of shares (in millions) 38.0 35.8 59.2% of shares outstanding at beginning of year 2.6% 2.4% 3.9%
Our Board of Directors rescinded all authorizations for share repurchases on December 3, 2000 as a result of the merger agree-ment with Quaker.
Liquidity and Capital ResourcesOur strong cash-generating capability and financial condition give usready access to capital markets throughout the world.
We maintain $1.5 billion of revolving credit facilities. Of the $1.5 billion as of year-end 2000, $600 million expires in June 2001.The remaining $900 million expires in June 2005. At expiration,these facilities can be extended an additional year upon the mutualconsent of PepsiCo and the lending institutions. The credit facilitiesexist largely to support issuances of short-term debt and remainunused at year-end 2000. At year-end 2000, $750 million of short-term borrowings were reclassified as long-term, reflecting our intentand ability, through the existence of the unused credit facilities, torefinance these borrowings.
24

25
2000 1999 1998
Net SalesNew PepsiCo . . . . . . . . . . . . . . . . . . . . . . . . . . . . . . . . . . . . . . . . . . . . . . . . . . . . . . . . . . . . . . . . . . . . . . . . . . . . . . . . . . . . . . . $20,438 $18,244 $14,686Bottling operations . . . . . . . . . . . . . . . . . . . . . . . . . . . . . . . . . . . . . . . . . . . . . . . . . . . . . . . . . . . . . . . . . . . . . . . . . . . . . . . . . – 2,123 7,662Total Net Sales . . . . . . . . . . . . . . . . . . . . . . . . . . . . . . . . . . . . . . . . . . . . . . . . . . . . . . . . . . . . . . . . . . . . . . . . . . . . . . . . . . . . . . 20,438 20,367 22,348
Costs and ExpensesCost of sales . . . . . . . . . . . . . . . . . . . . . . . . . . . . . . . . . . . . . . . . . . . . . . . . . . . . . . . . . . . . . . . . . . . . . . . . . . . . . . . . . . . . . . . . 7,943 8,198 9,330Selling, general and administrative expenses . . . . . . . . . . . . . . . . . . . . . . . . . . . . . . . . . . . . . . . . . . . . . . . . . . . . . . . . . . . 9,132 9,103 9,924Amortization of intangible assets . . . . . . . . . . . . . . . . . . . . . . . . . . . . . . . . . . . . . . . . . . . . . . . . . . . . . . . . . . . . . . . . . . . . . 138 183 222Impairment and restructuring charges . . . . . . . . . . . . . . . . . . . . . . . . . . . . . . . . . . . . . . . . . . . . . . . . . . . . . . . . . . . . . . . . – 65 288Total Costs and Expenses . . . . . . . . . . . . . . . . . . . . . . . . . . . . . . . . . . . . . . . . . . . . . . . . . . . . . . . . . . . . . . . . . . . . . . . . . . . . . 17,213 17,549 19,764
Operating ProfitNew PepsiCo . . . . . . . . . . . . . . . . . . . . . . . . . . . . . . . . . . . . . . . . . . . . . . . . . . . . . . . . . . . . . . . . . . . . . . . . . . . . . . . . . . . . . . . 3,225 2,765 2,460Bottling operations and equity investments . . . . . . . . . . . . . . . . . . . . . . . . . . . . . . . . . . . . . . . . . . . . . . . . . . . . . . . . . . . . – 53 124Total Operating Profit . . . . . . . . . . . . . . . . . . . . . . . . . . . . . . . . . . . . . . . . . . . . . . . . . . . . . . . . . . . . . . . . . . . . . . . . . . . . . . . . 3,225 2,818 2,584
Bottling equity income, net . . . . . . . . . . . . . . . . . . . . . . . . . . . . . . . . . . . . . . . . . . . . . . . . . . . . . . . . . . . . . . . . . . . . . . . . . . 130 83 –Gain on bottling transactions . . . . . . . . . . . . . . . . . . . . . . . . . . . . . . . . . . . . . . . . . . . . . . . . . . . . . . . . . . . . . . . . . . . . . . . . . – 1,000 –Interest expense . . . . . . . . . . . . . . . . . . . . . . . . . . . . . . . . . . . . . . . . . . . . . . . . . . . . . . . . . . . . . . . . . . . . . . . . . . . . . . . . . . . . (221) (363) (395)Interest income . . . . . . . . . . . . . . . . . . . . . . . . . . . . . . . . . . . . . . . . . . . . . . . . . . . . . . . . . . . . . . . . . . . . . . . . . . . . . . . . . . . . . 76 118 74Income Before Income Taxes . . . . . . . . . . . . . . . . . . . . . . . . . . . . . . . . . . . . . . . . . . . . . . . . . . . . . . . . . . . . . . . . . . . . . . 3,210 3,656 2,263
Provision for Income Taxes . . . . . . . . . . . . . . . . . . . . . . . . . . . . . . . . . . . . . . . . . . . . . . . . . . . . . . . . . . . . . . . . . . . . . . . . 1,027 1,606 270Net Income . . . . . . . . . . . . . . . . . . . . . . . . . . . . . . . . . . . . . . . . . . . . . . . . . . . . . . . . . . . . . . . . . . . . . . . . . . . . . . . . . . . . . . . $ 2,183 $ 2,050 $ 1,993
Net Income Per Share – Basic . . . . . . . . . . . . . . . . . . . . . . . . . . . . . . . . . . . . . . . . . . . . . . . . . . . . . . . . . . . . . . . . . . . . . $ 1.51 $ 1.40 $ 1.35Average shares outstanding - basic . . . . . . . . . . . . . . . . . . . . . . . . . . . . . . . . . . . . . . . . . . . . . . . . . . . . . . . . . . . . . . . . . . . . 1,446 1,466 1,480
Net Income Per Share – Assuming Dilution . . . . . . . . . . . . . . . . . . . . . . . . . . . . . . . . . . . . . . . . . . . . . . . . . . . . . . . $ 1.48 $ 1.37 $ 1.31Average shares outstanding - assuming dilution . . . . . . . . . . . . . . . . . . . . . . . . . . . . . . . . . . . . . . . . . . . . . . . . . . . . . . . . 1,475 1,496 1,519
See accompanying Notes to Consolidated Financial Statements.
CONSOLIDATED STATEMENT OF INCOME(in millions except per share amounts)PepsiCo, Inc. and SubsidiariesFiscal years ended December 30, 2000, December 25, 1999 and December 26, 1998

26
2000 1999 1998Operating ActivitiesNet income . . . . . . . . . . . . . . . . . . . . . . . . . . . . . . . . . . . . . . . . . . . . . . . . . . . . . . . . . . . . . . . . . . . . . . . . . . . . . . . . . . . . . . . . . $ 2,183 $ 2,050 $ 1,993Adjustments to reconcile net income to net cash provided by operating activities
Gain on bottling transactions . . . . . . . . . . . . . . . . . . . . . . . . . . . . . . . . . . . . . . . . . . . . . . . . . . . . . . . . . . . . . . . . . . . . . – (1,000) –Bottling equity income, net . . . . . . . . . . . . . . . . . . . . . . . . . . . . . . . . . . . . . . . . . . . . . . . . . . . . . . . . . . . . . . . . . . . . . . . (130) (83) –Depreciation and amortization . . . . . . . . . . . . . . . . . . . . . . . . . . . . . . . . . . . . . . . . . . . . . . . . . . . . . . . . . . . . . . . . . . . . 960 1,032 1,234Noncash portion of income tax benefit . . . . . . . . . . . . . . . . . . . . . . . . . . . . . . . . . . . . . . . . . . . . . . . . . . . . . . . . . . . . . – – (259)Noncash portion of impairment and restructuring charges . . . . . . . . . . . . . . . . . . . . . . . . . . . . . . . . . . . . . . . . . . . – 37 254Deferred income taxes . . . . . . . . . . . . . . . . . . . . . . . . . . . . . . . . . . . . . . . . . . . . . . . . . . . . . . . . . . . . . . . . . . . . . . . . . . . 63 529 150Other noncash charges and credits, net . . . . . . . . . . . . . . . . . . . . . . . . . . . . . . . . . . . . . . . . . . . . . . . . . . . . . . . . . . . . 317 364 237Changes in operating working capital, excluding effects of acquisitions and dispositions
Accounts and notes receivable . . . . . . . . . . . . . . . . . . . . . . . . . . . . . . . . . . . . . . . . . . . . . . . . . . . . . . . . . . . . . . . . . (15) (149) (104)Inventories . . . . . . . . . . . . . . . . . . . . . . . . . . . . . . . . . . . . . . . . . . . . . . . . . . . . . . . . . . . . . . . . . . . . . . . . . . . . . . . . . . (26) (186) 29Prepaid expenses and other current assets . . . . . . . . . . . . . . . . . . . . . . . . . . . . . . . . . . . . . . . . . . . . . . . . . . . . . . – (203) (12)Accounts payable and other current liabilities . . . . . . . . . . . . . . . . . . . . . . . . . . . . . . . . . . . . . . . . . . . . . . . . . . . 245 310 (195)Income taxes payable . . . . . . . . . . . . . . . . . . . . . . . . . . . . . . . . . . . . . . . . . . . . . . . . . . . . . . . . . . . . . . . . . . . . . . . . 314 326 (116)
Net change in operating working capital . . . . . . . . . . . . . . . . . . . . . . . . . . . . . . . . . . . . . . . . . . . . . . . . . . . . . . . . . . . 518 98 (398)Net Cash Provided by Operating Activities . . . . . . . . . . . . . . . . . . . . . . . . . . . . . . . . . . . . . . . . . . . . . . . . . . . . . . . . . 3,911 3,027 3,211Investing ActivitiesCapital spending . . . . . . . . . . . . . . . . . . . . . . . . . . . . . . . . . . . . . . . . . . . . . . . . . . . . . . . . . . . . . . . . . . . . . . . . . . . . . . . . . . . . (1,067) (1,118) (1,405)Acquisitions and investments in unconsolidated affiliates . . . . . . . . . . . . . . . . . . . . . . . . . . . . . . . . . . . . . . . . . . . . . . . . (98) (430) (4,537)Sales of businesses . . . . . . . . . . . . . . . . . . . . . . . . . . . . . . . . . . . . . . . . . . . . . . . . . . . . . . . . . . . . . . . . . . . . . . . . . . . . . . . . . . 33 499 17Sales of property, plant and equipment . . . . . . . . . . . . . . . . . . . . . . . . . . . . . . . . . . . . . . . . . . . . . . . . . . . . . . . . . . . . . . . . 53 126 134Short-term investments, by original maturity
More than three months-purchases . . . . . . . . . . . . . . . . . . . . . . . . . . . . . . . . . . . . . . . . . . . . . . . . . . . . . . . . . . . . . . . (4,536) (2,025) (525)More than three months-maturities . . . . . . . . . . . . . . . . . . . . . . . . . . . . . . . . . . . . . . . . . . . . . . . . . . . . . . . . . . . . . . . 4,171 2,008 584Three months or less, net . . . . . . . . . . . . . . . . . . . . . . . . . . . . . . . . . . . . . . . . . . . . . . . . . . . . . . . . . . . . . . . . . . . . . . . . . (9) 12 839
Other, net . . . . . . . . . . . . . . . . . . . . . . . . . . . . . . . . . . . . . . . . . . . . . . . . . . . . . . . . . . . . . . . . . . . . . . . . . . . . . . . . . . . . . . . . . . (260) (144) (126)Net Cash Used for Investing Activities . . . . . . . . . . . . . . . . . . . . . . . . . . . . . . . . . . . . . . . . . . . . . . . . . . . . . . . . . . . . . (1,713) (1,072) (5,019)Financing ActivitiesProceeds from issuances of long-term debt . . . . . . . . . . . . . . . . . . . . . . . . . . . . . . . . . . . . . . . . . . . . . . . . . . . . . . . . . . . . 130 3,480 990Payments of long-term debt . . . . . . . . . . . . . . . . . . . . . . . . . . . . . . . . . . . . . . . . . . . . . . . . . . . . . . . . . . . . . . . . . . . . . . . . . (795) (1,123) (2,277)Short-term borrowings, by original maturity
More than three months-proceeds . . . . . . . . . . . . . . . . . . . . . . . . . . . . . . . . . . . . . . . . . . . . . . . . . . . . . . . . . . . . . . . . 156 3,691 2,713More than three months-payments . . . . . . . . . . . . . . . . . . . . . . . . . . . . . . . . . . . . . . . . . . . . . . . . . . . . . . . . . . . . . . . (79) (2,741) (417)Three months or less, net . . . . . . . . . . . . . . . . . . . . . . . . . . . . . . . . . . . . . . . . . . . . . . . . . . . . . . . . . . . . . . . . . . . . . . . . . (43) (2,856) 1,753
Cash dividends paid . . . . . . . . . . . . . . . . . . . . . . . . . . . . . . . . . . . . . . . . . . . . . . . . . . . . . . . . . . . . . . . . . . . . . . . . . . . . . . . . . (796) (778) (757)Share repurchases . . . . . . . . . . . . . . . . . . . . . . . . . . . . . . . . . . . . . . . . . . . . . . . . . . . . . . . . . . . . . . . . . . . . . . . . . . . . . . . . . . . (1,430) (1,285) (2,230)Proceeds from exercises of stock options . . . . . . . . . . . . . . . . . . . . . . . . . . . . . . . . . . . . . . . . . . . . . . . . . . . . . . . . . . . . . . . 559 308 415Net Cash (Used for) Provided by Financing Activities . . . . . . . . . . . . . . . . . . . . . . . . . . . . . . . . . . . . . . . . . . . . . . (2,298) (1,304) 190Effect of exchange rate changes on cash and cash equivalents . . . . . . . . . . . . . . . . . . . . . . . . . . . . . . . . . . . . . . . . . . . . – 2 1Net (Decrease) Increase in Cash and Cash Equivalents . . . . . . . . . . . . . . . . . . . . . . . . . . . . . . . . . . . . . . . . . . . . . (100) 653 (1,617)Cash and Cash Equivalents – Beginning of Year . . . . . . . . . . . . . . . . . . . . . . . . . . . . . . . . . . . . . . . . . . . . . . . . . . . 964 311 1,928Cash and Cash Equivalents – End of Year . . . . . . . . . . . . . . . . . . . . . . . . . . . . . . . . . . . . . . . . . . . . . . . . . . . . . . . . . . $ 864 $ 964 $ 311
Supplemental Cash Flow InformationInterest paid . . . . . . . . . . . . . . . . . . . . . . . . . . . . . . . . . . . . . . . . . . . . . . . . . . . . . . . . . . . . . . . . . . . . . . . . . . . . . . . . . . . . . . . . $ 170 $ 321 $ 367Income taxes paid . . . . . . . . . . . . . . . . . . . . . . . . . . . . . . . . . . . . . . . . . . . . . . . . . . . . . . . . . . . . . . . . . . . . . . . . . . . . . . . . . . . $ 691 $ 525 $ 521Schedule of Noncash Investing and Financing ActivitiesFair value of assets acquired . . . . . . . . . . . . . . . . . . . . . . . . . . . . . . . . . . . . . . . . . . . . . . . . . . . . . . . . . . . . . . . . . . . . . . . . . . $ 80 $ 717 $ 5,359Cash paid and stock issued . . . . . . . . . . . . . . . . . . . . . . . . . . . . . . . . . . . . . . . . . . . . . . . . . . . . . . . . . . . . . . . . . . . . . . . . . . . (98) (438) (4,537)Liabilities assumed . . . . . . . . . . . . . . . . . . . . . . . . . . . . . . . . . . . . . . . . . . . . . . . . . . . . . . . . . . . . . . . . . . . . . . . . . . . . . . . . . . $ (18) $ 279 $ 822
See accompanying Notes to Consolidated Financial Statements.
CONSOLIDATED STATEMENT OF CASH FLOWS(in millions)PepsiCo, Inc. and SubsidiariesFiscal years ended December 30, 2000, December 25, 1999 and December 26, 1998
26
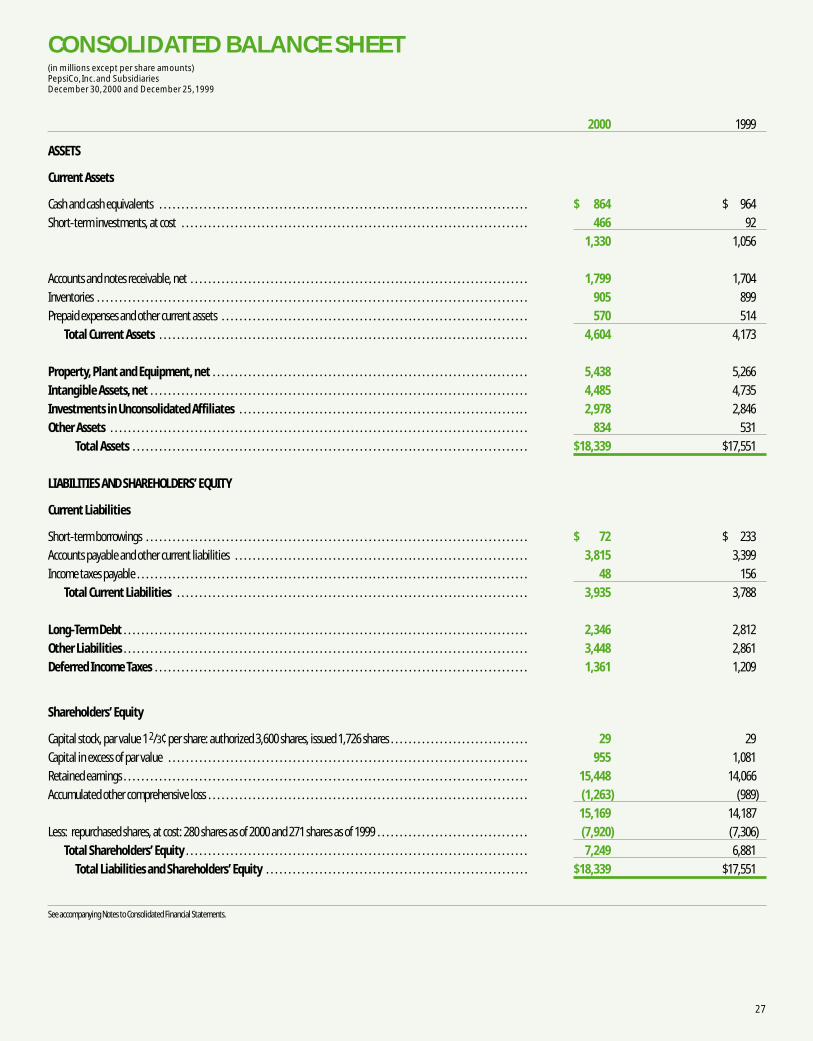
27
2000 1999
ASSETS
Current Assets
Cash and cash equivalents . . . . . . . . . . . . . . . . . . . . . . . . . . . . . . . . . . . . . . . . . . . . . . . . . . . . . . . . . . . . . . . . . . . . . . . . . . . . . . . . . . . $ 864 $ 964
Short-term investments, at cost . . . . . . . . . . . . . . . . . . . . . . . . . . . . . . . . . . . . . . . . . . . . . . . . . . . . . . . . . . . . . . . . . . . . . . . . . . . . . . 466 92
1,330 1,056
Accounts and notes receivable, net . . . . . . . . . . . . . . . . . . . . . . . . . . . . . . . . . . . . . . . . . . . . . . . . . . . . . . . . . . . . . . . . . . . . . . . . . . . . 1,799 1,704
Inventories . . . . . . . . . . . . . . . . . . . . . . . . . . . . . . . . . . . . . . . . . . . . . . . . . . . . . . . . . . . . . . . . . . . . . . . . . . . . . . . . . . . . . . . . . . . . . . . . . 905 899
Prepaid expenses and other current assets . . . . . . . . . . . . . . . . . . . . . . . . . . . . . . . . . . . . . . . . . . . . . . . . . . . . . . . . . . . . . . . . . . . . . 570 514
Total Current Assets . . . . . . . . . . . . . . . . . . . . . . . . . . . . . . . . . . . . . . . . . . . . . . . . . . . . . . . . . . . . . . . . . . . . . . . . . . . . . . . . . . . 4,604 4,173
Property, Plant and Equipment, net . . . . . . . . . . . . . . . . . . . . . . . . . . . . . . . . . . . . . . . . . . . . . . . . . . . . . . . . . . . . . . . . . . . . . . . 5,438 5,266
Intangible Assets, net . . . . . . . . . . . . . . . . . . . . . . . . . . . . . . . . . . . . . . . . . . . . . . . . . . . . . . . . . . . . . . . . . . . . . . . . . . . . . . . . . . . . . 4,485 4,735
Investments in Unconsolidated Affiliates . . . . . . . . . . . . . . . . . . . . . . . . . . . . . . . . . . . . . . . . . . . . . . . . . . . . . . . . . . . . . . . . . 2,978 2,846
Other Assets . . . . . . . . . . . . . . . . . . . . . . . . . . . . . . . . . . . . . . . . . . . . . . . . . . . . . . . . . . . . . . . . . . . . . . . . . . . . . . . . . . . . . . . . . . . . . . 834 531
Total Assets . . . . . . . . . . . . . . . . . . . . . . . . . . . . . . . . . . . . . . . . . . . . . . . . . . . . . . . . . . . . . . . . . . . . . . . . . . . . . . . . . . . . . . . . . $18,339 $17,551
LIABILITIES AND SHAREHOLDERS’ EQUITY
Current Liabilities
Short-term borrowings . . . . . . . . . . . . . . . . . . . . . . . . . . . . . . . . . . . . . . . . . . . . . . . . . . . . . . . . . . . . . . . . . . . . . . . . . . . . . . . . . . . . . . $ 72 $ 233
Accounts payable and other current liabilities . . . . . . . . . . . . . . . . . . . . . . . . . . . . . . . . . . . . . . . . . . . . . . . . . . . . . . . . . . . . . . . . . . 3,815 3,399
Income taxes payable . . . . . . . . . . . . . . . . . . . . . . . . . . . . . . . . . . . . . . . . . . . . . . . . . . . . . . . . . . . . . . . . . . . . . . . . . . . . . . . . . . . . . . . . 48 156
Total Current Liabilities . . . . . . . . . . . . . . . . . . . . . . . . . . . . . . . . . . . . . . . . . . . . . . . . . . . . . . . . . . . . . . . . . . . . . . . . . . . . . . . 3,935 3,788
Long-Term Debt . . . . . . . . . . . . . . . . . . . . . . . . . . . . . . . . . . . . . . . . . . . . . . . . . . . . . . . . . . . . . . . . . . . . . . . . . . . . . . . . . . . . . . . . . . . 2,346 2,812
Other Liabilities . . . . . . . . . . . . . . . . . . . . . . . . . . . . . . . . . . . . . . . . . . . . . . . . . . . . . . . . . . . . . . . . . . . . . . . . . . . . . . . . . . . . . . . . . . . 3,448 2,861
Deferred Income Taxes . . . . . . . . . . . . . . . . . . . . . . . . . . . . . . . . . . . . . . . . . . . . . . . . . . . . . . . . . . . . . . . . . . . . . . . . . . . . . . . . . . . . 1,361 1,209
Shareholders’ Equity
Capital stock, par value 1 2/3¢ per share: authorized 3,600 shares, issued 1,726 shares . . . . . . . . . . . . . . . . . . . . . . . . . . . . . . . 29 29
Capital in excess of par value . . . . . . . . . . . . . . . . . . . . . . . . . . . . . . . . . . . . . . . . . . . . . . . . . . . . . . . . . . . . . . . . . . . . . . . . . . . . . . . . . 955 1,081
Retained earnings . . . . . . . . . . . . . . . . . . . . . . . . . . . . . . . . . . . . . . . . . . . . . . . . . . . . . . . . . . . . . . . . . . . . . . . . . . . . . . . . . . . . . . . . . . . 15,448 14,066
Accumulated other comprehensive loss . . . . . . . . . . . . . . . . . . . . . . . . . . . . . . . . . . . . . . . . . . . . . . . . . . . . . . . . . . . . . . . . . . . . . . . . (1,263) (989)
15,169 14,187
Less: repurchased shares, at cost: 280 shares as of 2000 and 271 shares as of 1999 . . . . . . . . . . . . . . . . . . . . . . . . . . . . . . . . . . (7,920) (7,306)
Total Shareholders’ Equity . . . . . . . . . . . . . . . . . . . . . . . . . . . . . . . . . . . . . . . . . . . . . . . . . . . . . . . . . . . . . . . . . . . . . . . . . . . . . 7,249 6,881
Total Liabilities and Shareholders’ Equity . . . . . . . . . . . . . . . . . . . . . . . . . . . . . . . . . . . . . . . . . . . . . . . . . . . . . . . . . . . $18,339 $17,551
See accompanying Notes to Consolidated Financial Statements.
CONSOLIDATED BALANCE SHEET(in millions except per share amounts)PepsiCo, Inc. and SubsidiariesDecember 30, 2000 and December 25, 1999

28
Capital Stock Accumulated TotalNet Capital in Other CurrencyIssued Repurchased Outstanding Excess of Retained Comprehensive Translation
Shares Amount Shares Amount Shares Par Value Earnings Loss Total Adjustment
Shareholders’ Equity, December 27, 1997 . . . . . . . . 1,726 $ 29 (224) $ (4,986) 1,502 $1,314 $ 11,567 $ (988) $ 6,936 $ (988)1998 Net income . . . . . . . . . . . . . . . . . . . . . . . . . . – – – – – – 1,993 – 1,993Currency translation adjustment . . . . . . . . . . . . – – – – – – – (75) (75) (75)CTA reclassification adjustment . . . . . . . . . . . . . – – – – – – – 24 24 24Minimum pension liability adjustment,
net of tax benefit of $11 . . . . . . . . . . . . . . . . . . – – – – – – – (20) (20)Comprehensive income . . . . . . . . . . . . . . . . . 1,922
Cash dividends declared . . . . . . . . . . . . . . . . . . . . – – – – – – (760) – (760)Share repurchases . . . . . . . . . . . . . . . . . . . . . . . . . – – (59) (2,230) (59) – – – (2,230)Stock option exercises, including
tax benefit of $109 . . . . . . . . . . . . . . . . . . . . . . . – – 28 675 28 (151) – – 524Other . . . . . . . . . . . . . . . . . . . . . . . . . . . . . . . . . . . . – – – 6 – 3 – – 9
Shareholders’ Equity, December 26, 1998 . . . . . . . . 1,726 29 (255) (6,535) 1,471 1,166 12,800 (1,059) 6,401 (1,039)1999 Net income . . . . . . . . . . . . . . . . . . . . . . . . . . – – – – – – 2,050 – 2,050Currency translation adjustment . . . . . . . . . . . . – – – – – – – (121) (121) (121)CTA reclassification adjustment . . . . . . . . . . . . . – – – – – – – 175 175 175Minimum pension liability adjustment,
net of tax of $9 . . . . . . . . . . . . . . . . . . . . . . . . . . – – – – – – – 17 17Other comprehensive income . . . . . . . . . . . . . . . – – – – – – – (1) (1)
Comprehensive income . . . . . . . . . . . . . . . . . 2,120Cash dividends declared . . . . . . . . . . . . . . . . . . . . – – – – – – (784) – (784)Share repurchases . . . . . . . . . . . . . . . . . . . . . . . . . – – (36) (1,285) (36) – – – (1,285)Stock option exercises, including
tax benefit of $82 . . . . . . . . . . . . . . . . . . . . . . . . – – 20 514 20 (131) – – 383Other . . . . . . . . . . . . . . . . . . . . . . . . . . . . . . . . . . . . – – – – – 46 – – 46
Shareholders’ Equity, December 25, 1999 . . . . . . . . 1,726 29 (271) (7,306) 1,455 1,081 14,066 (989) 6,881 (985)2000 Net income . . . . . . . . . . . . . . . . . . . . . . . . . . – – – – – – 2,183 – 2,183Currency translation adjustment . . . . . . . . . . . . – – – – – – – (273) (273) (273)Minimum pension liability adjustment,
net of tax benefit of $1 . . . . . . . . . . . . . . . . . . . – – – – – – – (2) (2)Other comprehensive income . . . . . . . . . . . . . . . – – – – – – – 1 1
Comprehensive income . . . . . . . . . . . . . . . . . 1,909Cash dividends declared . . . . . . . . . . . . . . . . . . . . – – – – – – (801) – (801)Share repurchases . . . . . . . . . . . . . . . . . . . . . . . . . – – (38) (1,430) (38) – – – (1,430)Stock option exercises, including
tax benefit of $131 . . . . . . . . . . . . . . . . . . . . . . . – – 29 816 29 (126) – – 690
Shareholders’ Equity, December 30, 2000 . . . . . . . . 1,726 $29 (280) $(7,920) 1,446 $ 955 $15,448 $(1,263) $7,249 $ (1,258)
See accompanying Notes to Consolidated Financial Statements.
CONSOLIDATED STATEMENT OF SHAREHOLDERS’ EQUITY(in millions)PepsiCo, Inc. and SubsidiariesFiscal years ended December 30, 2000, December 25, 1999 and December 26, 1998
28

2929
NOTES TO CONSOLIDATED FINANCIAL STATEMENTS(tabular dollars in millions except per share amounts; all per share amounts assume dilution)
Note 1 – Summary of Significant Accounting PoliciesThe preparation of the consolidated financial statements in conformitywith generally accepted accounting principles requires managementto make estimates and assumptions that affect reported amounts ofassets, liabilities, revenues, expenses and disclosure of contingentassets and liabilities. Actual results could differ from these estimates.
Items Affecting ComparabilityOur fiscal year ends on the last Saturday in December and, as a result,a fifty-third week is added every five or six years. The fiscal year endedDecember 30, 2000 consisted of fifty-three weeks. The fifty-third week increased 2000 net sales by an estimated $294 million, operatingprofit by an estimated $62 million and net income by an estimated $44 million or $0.03 per share. See Note 17 - Business Segments for the impact on PepsiCo’s business segments.
The consolidated financial statements subsequent to the date ofthe bottling transactions described in Note 2 are not comparable withthe consolidated financial statements presented for prior periods ascertain bottling operations that were previously consolidated are nowaccounted for under the equity method. In addition, the third quarter1998 acquisition of Tropicana described in Note 3 and the asset impairment and restructuring charges described in Note 4 affect comparability. Certain reclassifications were made to the 1999 and1998 amounts to conform to the 2000 presentation.
Principles of ConsolidationThe financial statements include the consolidated accounts of PepsiCo,Inc. and its controlled affiliates. Intercompany balances and transac-tions have been eliminated. Investments in unconsolidated affiliates,over which we exercise significant influence, but not control, areaccounted for by the equity method. Accordingly, our share of the net income or loss of such unconsolidated affiliates is included in consolidated net income.
Issuances of Subsidiary StockThe issuance of stock by one of our subsidiaries to third parties reducesour proportionate ownership interest in the subsidiary. Unless theissuance of such stock is part of a broader corporate reorganization, werecognize a gain or loss, equal to the difference between the issuanceprice per share and our carrying amount per share. Such gain or loss,net of the related tax, is recognized in consolidated net income whenthe transaction occurs.
Revenue RecognitionWe recognize revenue when products are delivered to customers.Sales terms generally do not allow a right to return.
Marketing CostsMarketing costs are reported in selling, general and administrativeexpenses and include costs of advertising, promotional programs andother marketing activities. Advertising expenses were $1.3 billion in2000, $1.3 billion in 1999 and $1.0 billion in 1998. Deferred advertisingexpense, classified as prepaid expenses in the Consolidated BalanceSheet, was $92 million in 2000 and $73 million in 1999. Deferred advertising costs are expensed in the year first used and consist of:
• media and personal service prepayments,• promotional materials in inventory, and• production costs of future media advertising.We classify promotional payments as either a reduction of net
sales or as marketing costs. New PepsiCo total promotional expensesclassified as marketing costs were $2.4 billion in 2000, $2.3 billion in 1999 and $2.1 billion in 1998.
During 2000, the Financial Accounting Standards Board’s (FASB)Emerging Issues Task Force (EITF) added to its agenda various revenuerecognition issues that could impact the income statement classifica-tion of certain promotional payments. In May 2000, the EITF reached aconsensus on Issue 00-14, Accounting for Certain Sales Incentives.EITF 00-14 addresses the recognition and income statement classif-ication of various sales incentives. Among its requirements, the consensus will require the costs related to consumer coupons currentlyclassified as marketing costs to be classified as a reduction of revenue.The impact of adopting this consensus is not expected to have a material impact on our results of operations. The consensus is effective for the second quarter of 2001.
In January 2001, the EITF reached a consensus on Issue 00-22,Accounting for “Points” and Certain Other Time-Based or Volume-BasedSales Incentive Offers, and Offers for Free Products or Services to BeDelivered in the Future. Issue 00-22 will require that certain cash rebatesto customers currently recognized as marketing costs be classified as areduction of revenue. The consensus is effective for the first quarter of2001. We are currently assessing this consensus and have not yetmade a determination of the impact adoption will have on our consoli-dated financial statements.
Distribution CostsDistribution costs are reported in selling, general and administrativeexpenses and include the costs of shipping and handling activities.Shipping and handling expenses were $2.5 billion in 2000, $2.4 billionin 1999 and $2.9 billion in 1998.
Stock-Based CompensationWe measure stock-based compensation cost as the excess of the quoted market price of PepsiCo Capital Stock at the grant date over the amount the employee must pay for the stock (exercise price). Our policy is to generally grant stock options with an exercise price equal tothe stock price at the date of grant and accordingly, no compensationcost is recognized. Under our incentive programs, compensation costfor performance share units granted and for cash payments expectedto be paid to employees in lieu of stock options is based on the grantdate value and recognized over the vesting period of the award.
Derivative InstrumentsThe interest differential to be paid or received on an interest rate swapis recognized as an adjustment to interest expense as the differentialoccurs. If an interest rate swap position were to be terminated, thegain or loss realized upon termination would be deferred and amor-tized to interest expense over the remaining term of the underlyingdebt instrument it was intended to modify. However, if the underlyingdebt instrument were to be settled prior to maturity, the gain or lossrealized upon termination would be recognized immediately.
The differential to be paid or received on a currency swap related tonon-U.S. dollar denominated debt is charged or credited to selling,general and administrative expenses as the differential occurs. This isfully offset by the corresponding gain or loss recognized on the curren-cy translation of the debt, as both amounts are based upon the sameexchange rates. The currency differential not yet settled in cash isreflected in the Consolidated Balance Sheet under the appropriate
29

30
current or noncurrent receivable or payable caption. If a currencyswap position were to be terminated prior to maturity, the gain or lossrealized upon termination would be immediately recognized in selling,general and administrative expenses.
Gains and losses on futures contracts designated as hedges offuture commodity purchases are deferred in the Consolidated BalanceSheet under the appropriate current asset or liability caption andincluded in the cost of the hedged commodity when purchased.Changes in the value of such contracts used to hedge commodity purchases are highly correlated to the changes in the value of the purchased commodity. Subsequent changes in the value of such contracts that cease to be highly correlated or changes in the value of futures contracts not designated as hedges are recognized in cost of sales immediately. If a futures contract designated as a hedge wereto be terminated, the gain or loss realized upon termination would beincluded in the cost of the hedged commodity when purchased.
Forward exchange contracts used to hedge the foreign currencyexposure of monetary assets and liabilities denominated in currenciesother than the functional currency are reflected in the ConsolidatedBalance Sheet at fair value. Changes in the fair value of these contractsare recognized in selling, general and administrative expenses.
Equity derivative contracts for the purchase of PepsiCo capital stockare reflected in the Consolidated Balance Sheet at fair value as a pre-paid expense. Changes in fair value of these contracts are recognizedas interest income.
The cash flows related to the above derivative instruments are classified in the Consolidated Statement of Cash Flows in a mannerconsistent with those of the transactions being hedged.
Cash EquivalentsCash equivalents represent funds temporarily invested with originalmaturities of three months or less. All other investment portfolios areprimarily classified as short-term investments.
InventoriesInventories are valued at the lower of cost (computed on the average,first-in, first-out or last-in, first-out method) or net realizable value.
Property, Plant and EquipmentProperty, plant and equipment are stated at cost. Depreciation is calculated on a straight-line basis. Buildings and improvements are depreciated over their estimated useful lives, generally rangingfrom 20 to 40 years. Machinery and equipment (including fleet) aredepreciated over their estimated useful lives, generally ranging from 2 to 10 years.
Intangible AssetsGoodwill, the excess of our investments in unconsolidated affiliatesover our equity in the underlying assets of these investments, andtrademarks are amortized on a straight-line basis over their estimateduseful lives, generally ranging from 20 to 40 years. Reacquired franchise rights and other identifiable intangibles are amortized on a straight-line basis over their estimated useful lives, generally ranging from 20 to 40 years.
Recoverability of Long-Lived Assets to be Held and Used inthe Business All long-lived assets, including goodwill, investments in unconsolidatedaffiliates and other identifiable intangibles, are evaluated for impairment
on the basis of undiscounted cash flows whenever events or changesin circumstances indicate that the carrying amount of an asset may notbe recoverable. An impaired asset is written down to its estimated fairmarket value based on the best information available. Estimated fairmarket value is generally measured by discounting estimated futurecash flows. Considerable management judgment is necessary to esti-mate discounted future cash flows.
The depreciation or amortization periods for long-lived assets to beheld and used are periodically evaluated to determine whether eventsor circumstances have occurred that warrant revision.
Accounting ChangesIn June 1998, the Financial Accounting Standards Board (FASB) issuedStatement of Financial Accounting Standards No. 133, Accounting forDerivative Instruments and Hedging Activities. SFAS 133, as amended bySFAS 137 and SFAS 138, is effective for our fiscal year beginningDecember 31, 2000. SFAS 133 establishes accounting and reportingstandards for derivative instruments, including certain derivative instru-ments embedded in other contracts, and for hedging activities. Itrequires that we recognize all derivative instruments as either assets orliabilities in the Consolidated Balance Sheet and measure those instru-ments at fair value. Based on derivatives outstanding at December 30,2000, the adoption would increase assets by approximately $14 millionand liabilities by approximately $9 million with approximately $5 mil-lion recognized in accumulated other comprehensive income and lessthan $1 million recognized in the Consolidated Statement of Income.
Note 2 – Investments in Unconsolidated AffiliatesDuring 1999, we completed four transactions creating four anchor bottlers which manufacture, sell and distribute carbonated and non-carbonated Pepsi-Cola beverages under master bottling agreements with us.
In April 1999, certain wholly-owned bottling businesses, referred toas The Pepsi Bottling Group (PBG), completed an initial public offering,with PepsiCo retaining a direct noncontrolling ownership interest of35.5%. We received $5.5 billion of debt proceeds as settlement of pre-existing intercompany amounts due to us and recognized a pre-tax gainof $1.0 billion ($476 million after-tax or $0.32 per share) as a result of thetransaction. In May, we combined certain other bottling operations withWhitman Corporation to create new Whitman, retaining a noncontrol-ling ownership interest of approximately 38%. The transaction resultedin an after-tax loss to PepsiCo of $206 million or $0.14 per share. In July,we combined certain other bottling operations with PepCom Industries,Inc. retaining a noncontrolling interest of 35%. This transaction wasaccounted for as a nonmonetary exchange for book purposes. However,a portion of the transaction was taxable and resulted in income taxexpense of $25 million or $0.02 per share. In October, we formed a busi-ness venture with Pohlad Companies, a Pepsi-Cola franchisee, retaining anoncontrolling ownership interest of approximately 24% in the venture'sprincipal operating subsidiary, PepsiAmericas, Inc. The transaction wasstructured as a fair value exchange with no resulting gain or loss.
In December 2000, Whitman merged with PepsiAmericas. We nowown approximately 37% of the combined company. As part of the merger, we will participate in an earn-out option whereby we mayreceive additional shares if certain performance targets are met.Effective January 2001, the name of the combined company waschanged to PepsiAmericas, Inc.

31
PBGIn addition to approximately 38% of PBG's outstanding common stockthat we now own, we own 100% of PBG's class B common stock andapproximately 7% of the equity of Bottling Group, LLC, PBG's principaloperating subsidiary. This gives us economic ownership of approxi-mately 42% of PBG's combined operations.
PBG's summarized full year 2000 and 1999 financial information isas follows:
2000 1999
Current assets $1,584 $ 1,498
Noncurrent assets 6,152 6,126
Total assets $7,736 $ 7,624
Current liabilities $ 967 $ 952
Noncurrent liabilities 4,817 4,831
Minority interest 306 278
Total liabilities $6,090 $ 6,061
Our equity investment $ 934 $ 829
2000 1999 1998
Net sales $7,982 $ 7,505 $7,041
Gross profit $3,577 $ 3,209 $2,860
Operating profit $ 590 $ 412 $ 55
Net income (loss) $ 229 $ 118 $ (146)
The excess of our investment in PBG over our equity in the underly-ing net assets, net of amortization, was approximately $40 million atyear-end 2000. Based upon the quoted closing price of PBG shares atyear-end 2000, the calculated market value of our direct investment inPBG, excluding our investment in Bottling Group, LLC, exceeded ourcarrying value by approximately $1.6 billion.
PepsiAmericas (formerly Whitman)PepsiAmericas' summarized full year 2000 and 1999 financial information is as follows:
2000 1999
Current assets $ 477 $ 538
Noncurrent assets 2,859 2,326
Total assets $3,336 $2,864
Current liabilities $ 887 $ 739
Noncurrent liabilities 999 983
Total liabilities $1,886 $1,722
Our equity investment $ 741 $ 668
2000 1999
Net sales $2,528 $2,138
Gross profit $1,033 $ 890
Operating profit $ 223 $ 182
Income from continuing operations $ 72 $ 43
Net income (loss) $ 80 $ (9)
The above financial information for 2000 includes the results of theformer PepsiAmericas after the date of the merger with Whitman.Comparable 1998 information is not available.
The excess of our investment in PepsiAmericas over our equity inthe underlying net assets, net of amortization, was approximately $208 million at year-end 2000. Based upon the quoted closing price at year-end 2000, the calculated market value of our investment inPepsiAmericas exceeded our carrying value by approximately $197 million.
Other Equity InvestmentsSummarized financial information regarding our principal equityinvestments, other than PBG and PepsiAmericas follows. Information ispresented in the aggregate and generally from the acquisition date.
2000 1999
Current assets $1,033 $ 1,210
Noncurrent assets 2,200 2,568
Total assets $3,233 $ 3,778
Current liabilities $ 972 $ 1,214
Noncurrent liabilities 578 673
Minority interest 35 41
Total liabilities $1,585 $ 1,928
Our related equity investments $1,030 $ 1,054
2000 1999 1998
Net sales $4,714 $ 3,754 $3,088
Gross profit $2,066 $ 1,691 $1,356
Operating profit $ 254 $ 89 $ 101
Net income (loss) $ 79 $ (10) $ 22
Related Party TransactionsOur significant related party transactions involve our investments inunconsolidated bottling affiliates. We sell concentrate to these affili-ates that is used in the production of carbonated soft drinks andnon-carbonated beverages. We also sell certain finished goods. Theypurchase sweeteners and certain other raw materials through us. Theraw material purchases on behalf of these bottling affiliates, relatedpayments to suppliers and collections from the bottlers are not reflect-ed in our consolidated financial statements. We also provide certainadministrative and other services to these bottling affiliates undernegotiated fee arrangements.
Further, because we share a common business objective with thesebottling affiliates of increasing the availability and consumption ofPepsi-Cola beverages, we provide various forms of marketing supportto or on behalf of them to promote our beverages. This support coversa variety of initiatives, including marketplace support, marketing pro-grams, capital equipment investment and shared media expense.Based on the objective of the programs and initiatives, we record marketing support as an adjustment to net sales or as selling,general and administrative expense.

32
These transactions with our unconsolidated bottling affiliates arereflected in the Consolidated Statement of Income as follows:
2000 1999 1998
Net sales $2,546 $1,779 $576
Selling, general and administrative expenses $ 653 $ 554 $169
As of December 30, 2000, the receivables from these bottling affili-ates are $187 million and payables to these affiliates are $125 million. Asof December 25, 1999, the receivables from these bottling affiliates were$93 million and the payables to these affiliates were $131 million. Suchamounts are settled on terms consistent with other trade receivablesand payables. See Note 16 regarding our guarantee of PBG related debt.
Note 3 – AcquisitionsDuring 2000, we made acquisitions, primarily of various internationalsalty snack food businesses, which aggregated $98 million.
During 1999, we made acquisitions, primarily investments in various bottlers including investments in unconsolidated affiliates,which aggregated $430 million in cash.
During 1998, we completed the acquisitions of Tropicana Products,Inc. from The Seagram Company Ltd. for $3.3 billion in cash and TheSmith’s Snackfoods Company in Australia from United BiscuitsHoldings plc for $270 million in cash. In addition during 1998, acquisi-tions and investments in unconsolidated affiliates included thepurchase of the remaining ownership interest in various bottlers andpurchases of various other international salty snack food businesses.Acquisitions for 1998 aggregated $4.5 billion in cash.
The results of operations of acquisitions are generally included inthe consolidated financial statements from their respective dates ofacquisition. The acquisitions were accounted for under the purchasemethod. The purchase prices have been allocated based on the esti-mated fair value of the assets acquired and liabilities assumed. Theexcess purchase prices over the fair values of the net assets acquired ofapproximately $4 million in 2000, $271 million in 1999 and $3.2 billionin 1998 were allocated to goodwill.
Unaudited Tropicana Pro Forma ResultsThe following table presents the unaudited pro forma combinedresults of PepsiCo and Tropicana as if the acquisition had occurred atthe beginning of our 1998 fiscal year. The aggregate impact of otheracquisitions in this period was not material to our net sales, net incomeor net income per share.
(unaudited) 1998
Net sales $23,674
Net income $ 1,939
Net income per share – assuming dilution $ 1.28
The pro forma amounts include the amortization of the goodwill arising from the allocation of the purchase price and interest expense onthe debt issued to finance the purchase. The pro forma information doesnot necessarily present what the combined results would have been forthis period and is not intended to be indicative of future results.
Note 4 – Asset Impairment and Restructuring1999 1998
Asset impairment charges
Held and used in the business
Property, plant and equipment $ 8 $ 149
Intangible assets – 37
Other assets – 14
Held for disposal/abandonment
Property, plant and equipment 29 54
Total asset impairment 37 254
Restructuring charges
Employee related costs 19 24
Other charges 9 10
Total restructuring 28 34
Total $ 65 $ 288
After-tax $ 40 $ 261
Per share $0.03 $0.17
Impairment by segment
Frito-Lay North America $ 37 $ 54
Pepsi-Cola International – 6
Combined segments 37 60
Bottling operations – 194
$ 37 $ 254
The 1999 asset impairment and restructuring charge of $65 millionrelated to the closure of three plants and impairment of equipment atFrito-Lay North America. The asset impairment charges primarilyreflected the reduction in the carrying value of the land and buildingsto their estimated fair market value based on current selling prices forcomparable real estate, less costs to sell, and the write-off of the netbook value of equipment which cannot be redeployed. The plant closures were completed during 1999. The majority of these assetswere either disposed of or abandoned in 1999. The restructuringcharges of $28 million primarily included severance costs for approxi-mately 860 employees and plant closing costs. Substantially all of the terminations occurred during 1999.
The 1998 asset impairment and restructuring charges of $288 million were comprised of the following:
• A charge of $218 million, for asset impairment of $200 million andrestructuring charges of $18 million related to our Russian bot-tling operations. The restructuring actions, in response to lowerdemand, an adverse change in the business climate and anexpected continuation of operating losses and cash deficits inRussia following the August 1998 devaluation of the ruble, includ-ed a reduction of our cost structure primarily through closingfacilities, renegotiating manufacturing contracts and reducing thenumber of employees. We also evaluated our long-lived bottlingassets for impairment, triggered by the reduction in the utilizationof assets caused by the adverse economic conditions. The impair-ment charge reduced the net book value of the assets to theirestimated fair market value, based primarily on amounts recently

33
paid for similar assets in that marketplace. Of the total charge of $218 million, $212 million related to bottling operations thatbecame part of PBG in 1999 (see Note 2).
• An impairment charge of $54 million related to manufacturingequipment at Frito-Lay North America. The charge primarilyreflected the write-off of the net book value of the equipment andrelated projects. Disposal or abandonment of these assets wascompleted in 1999.
• A charge of $16 million for employee related costs resulting fromthe separation of Pepsi-Cola North America’s concentrate and bottling organizations (see Note 2). Of this amount, $10 millionrelated to bottling operations that became part of PBG in 1999.
The employee related costs for 1998 of $24 million primarily includ-ed severance and relocation costs for approximately 2,700 mostlypart-time employees. The terminations either occurred or related tothe bottling operations that became part of PBG in 1999.
Note 5 – Income Per ShareWe present two income per share measures, basic and assuming dilu-tion, on the face of the Consolidated Statement of Income. “Basic”income per share equals net income divided by weighted averagecommon shares outstanding during the period. Income per share“assuming dilution” equals net income divided by the sum of weighted average common shares outstanding during the period plus common stock equivalents, such as stock options.
The following reconciles shares outstanding at the beginning of theyear to average shares outstanding:
2000 1999 1998
Shares outstanding at beginning of year 1,455 1,471 1,502
Weighted average shares issued during
the year for exercise of stock options 16 11 18
Weighted average shares repurchased (25) (16) (40)
Average shares outstanding - basic 1,446 1,466 1,480
Effect of dilutive securities
Dilutive shares contingently issuable
upon the exercise of stock options 146 132 144
Shares assumed purchased with
proceeds from exercise of stock options (117) (102) (105)
Average shares outstanding - assuming dilution 1,475 1,496 1,519
Net income per share - assuming dilution excludes incrementalshares of 0.1 million in 2000, 48.9 million in 1999 and 31.1 million in1998 related to employee stock options due to their antidilutive effect at each respective year end.
Note 6 – Accounts and Notes Receivable, net2000 1999 1998
Trade receivables $1,293 $1,234
Receivables from affiliates 190 243
Other receivables 420 312
1,903 1,789
Allowance, beginning of year 85 127 $125
Charged to expense 40 26 47
Other additions 7 9 8
Deductions (28) (77) (53)
Allowance, end of year 104 85 $127
Net receivables $1,799 $1,704
Other additions include acquisitions, currency translation effects and reclassifications. Deductions include the impact of the bottlingtransactions, accounts written off and currency translation effects.
Note 7 – Inventories2000 1999
Raw materials $ 433 $464
Work-in-process 160 89
Finished goods 312 346
$ 905 $899
The cost of approximately 9% of 2000 and 1999 inventories was computed using the last-in, first-out method.
Note 8 – Property, Plant and Equipment, net2000 1999
Land $ 380 $ 363
Buildings and improvements 2,336 2,352
Machinery and equipment, including fleet 6,139 5,554
Construction in progress 684 547
9,539 8,816
Accumulated depreciation (4,101) (3,550)
$ 5,438 $ 5,266
Depreciation expense was $716 million in 2000, $759 million in 1999and $968 million in 1998.
Note 9 – Intangible Assets, net2000 1999
Goodwill $ 3,576 $3,745
Trademarks 582 640
Reacquired franchise rights and
other identifiable intangibles 327 350
$ 4,485 $4,735
Identifiable intangible assets possess economic value but lack physicalsubstance. These assets primarily arise from the allocation of purchaseprices of businesses acquired. Amounts assigned to such identifiable

34
intangibles are based on independent appraisals or internal estimates.Goodwill represents the excess purchase price after allocation to allidentifiable net assets.
The above amounts are presented net of accumulated amortizationof $751 million at year-end 2000 and $640 million at year-end 1999.
Note 10 – Accounts Payable and Other CurrentLiabilities
2000 1999
Accounts payable $1,000 $ 924
Accrued selling, advertising and marketing 859 706
Accrued compensation and benefits 673 602
Insurance accruals 210 86
Dividends payable 202 197
Other current liabilities 871 884
$3,815 $3,399
Note 11 – Short-Term Borrowings and Long-Term Debt2000 1999
Short-Term Borrowings
Current maturities of long-term debt $ 404 $ 718
Other borrowings (7.2% and 6.9%) 418 415
Amount reclassified to long-term debt (750) (900)
$ 72 $ 233
Long-Term Debt
Short-term borrowings, reclassified $ 750 $ 900
Notes due 2001-2013 (6.2% and 6.1%) 1,236 1,685
Various foreign currency debt, due 2001 (6.5% and 6.1%) 219 341
Zero coupon notes, $735 million due 2011-2012 (13.4%) 339 324
Other, due 2001-2026 (7.8% and 7.3%) 206 280
2,750 3,530
Less current maturities of long-term debt (404) (718)
$2,346 $ 2,812
The weighted average interest rates in the above table include theeffects of associated interest rate and currency swaps at year-end 2000 and 1999. Also, see Note 12 for a discussion of our use of interestrate and currency swaps, our management of the inherent credit risk and fair value information related to debt and interest rate and currency swaps.
Interest Rate SwapsThe following table indicates the notional amount and weighted average interest rates of interest rate swaps outstanding at year-end2000 and 1999. The weighted average variable interest rates that wepay, which are primarily linked to either commercial paper or LIBORrates, are based on rates as of the respective balance sheet date andare subject to change.
2000 1999
Receive fixed-pay variable
Notional amount $1,242 $1,162
Weighted average receive rate 4.8% 6.1%
Weighted average pay rate 5.2% 6.1%
The terms of the interest rate swaps match the terms of the debtthey modify. The swaps terminate at various dates through 2013. Atyear-end 2000, approximately 72% of total debt, including the effectsof the associated interest rate swaps, was exposed to variable interestrates, compared to 67% in 1999. In addition to variable rate long-termdebt, all debt with maturities of less than one year is categorized asvariable for purposes of this measure.
Currency SwapsWe enter into currency swaps to hedge our currency exposure on certain non-U.S. dollar denominated debt upon issuance of such debt.The terms of the currency swaps match the terms of the debt they modify. The currency swaps terminate at various dates in 2001.
At year-end 2000, the aggregate carrying amount of debt denomi-nated in Swiss francs and Luxembourg francs was $122 million. Thepayables under related currency swaps were $43 million, resulting in aneffective U.S. dollar liability of $165 million with a weighted averageinterest rate of 6.6%, including the effects of related interest rate swaps.
At year-end 1999, the aggregate carrying amount of debt denomi-nated in Swiss francs, Luxembourg francs and Australian dollars was$244 million. The payables under related currency swaps were $62 million, resulting in an effective U.S. dollar liability of $306 millionwith a weighted average interest rate of 6.3%, including the effects ofrelated interest rate swaps.
Revolving Credit FacilitiesWe maintain $1.5 billion of revolving credit facilities. Of the $1.5 billion,$600 million expire in June 2001. The remaining $900 million expire inJune 2005. The credit facilities exist largely to support issuances of short-term debt. Annually, these facilities can be extended an additional yearupon the mutual consent of PepsiCo and the lending institutions. Thesefacilities are subject to normal banking terms and conditions.
The current reclassification of short-term borrowings to long-termdebt reflects our intent and ability, through the existence of the unusedcredit facilities, to refinance these borrowings on a long-term basis.
Long-term debt outstanding at December 30, 2000 matures as follows during the next five years:
2001 2002 2003 2004 2005
Maturities $404 $232 $417 $64 $62
Note 12 – Financial InstrumentsDerivative Financial InstrumentsOur policy prohibits the use of derivative financial instruments forspeculative purposes and we have procedures in place to monitor andcontrol their use. The following discussion excludes futures contractsused to hedge our commodity purchases.
Our use of derivative financial instruments primarily involves inter-est rate and currency swaps, which are intended to reduce borrowingcosts by effectively modifying the interest rate and currency of specificdebt issuances. These swaps are entered into concurrently with the
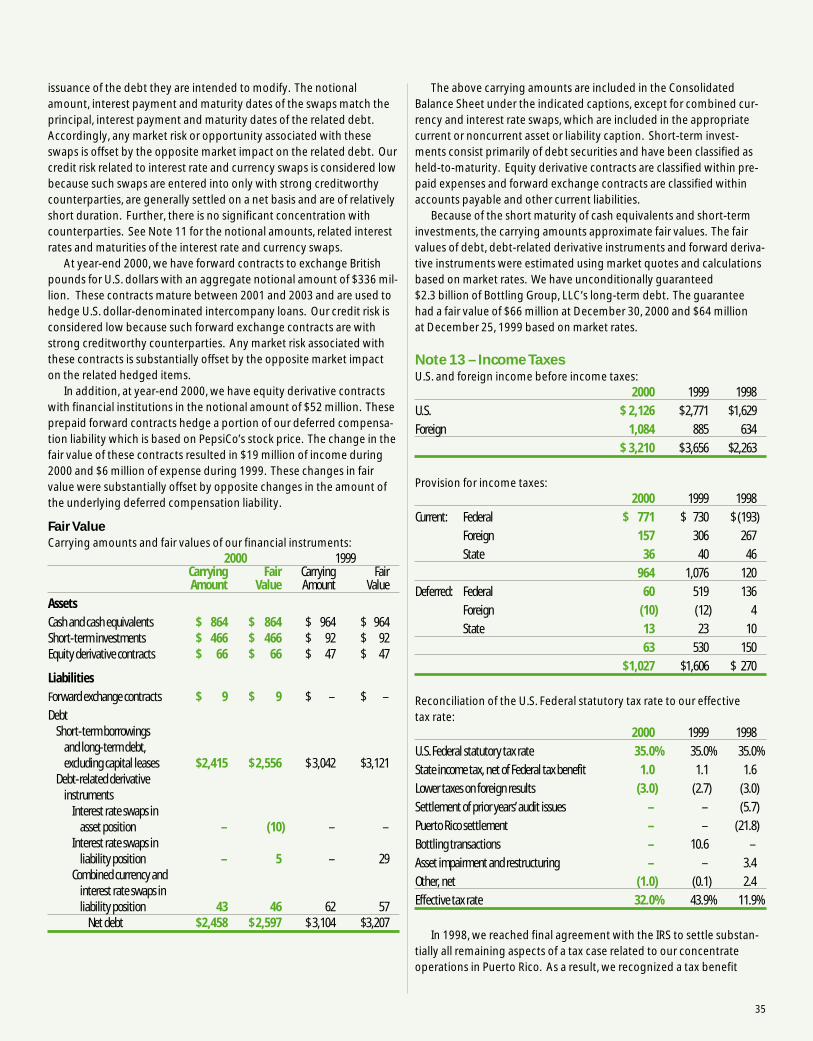
35
issuance of the debt they are intended to modify. The notionalamount, interest payment and maturity dates of the swaps match theprincipal, interest payment and maturity dates of the related debt.Accordingly, any market risk or opportunity associated with theseswaps is offset by the opposite market impact on the related debt. Ourcredit risk related to interest rate and currency swaps is considered lowbecause such swaps are entered into only with strong creditworthycounterparties, are generally settled on a net basis and are of relativelyshort duration. Further, there is no significant concentration withcounterparties. See Note 11 for the notional amounts, related interestrates and maturities of the interest rate and currency swaps.
At year-end 2000, we have forward contracts to exchange Britishpounds for U.S. dollars with an aggregate notional amount of $336 mil-lion. These contracts mature between 2001 and 2003 and are used tohedge U.S. dollar-denominated intercompany loans. Our credit risk isconsidered low because such forward exchange contracts are withstrong creditworthy counterparties. Any market risk associated withthese contracts is substantially offset by the opposite market impacton the related hedged items.
In addition, at year-end 2000, we have equity derivative contractswith financial institutions in the notional amount of $52 million. Theseprepaid forward contracts hedge a portion of our deferred compensa-tion liability which is based on PepsiCo’s stock price. The change in thefair value of these contracts resulted in $19 million of income during2000 and $6 million of expense during 1999. These changes in fairvalue were substantially offset by opposite changes in the amount ofthe underlying deferred compensation liability.
Fair ValueCarrying amounts and fair values of our financial instruments:
2000 1999Carrying Fair Carrying FairAmount Value Amount Value
Assets
Cash and cash equivalents $ 864 $ 864 $ 964 $ 964Short-term investments $ 466 $ 466 $ 92 $ 92Equity derivative contracts $ 66 $ 66 $ 47 $ 47
Liabilities
Forward exchange contracts $ 9 $ 9 $ – $ –
DebtShort-term borrowings
and long-term debt,excluding capital leases $2,415 $ 2,556 $ 3,042 $3,121
Debt-related derivative instruments
Interest rate swaps in asset position – (10) – –
Interest rate swaps in liability position – 5 – 29
Combined currency andinterest rate swaps inliability position 43 46 62 57
Net debt $2,458 $ 2,597 $ 3,104 $3,207
The above carrying amounts are included in the ConsolidatedBalance Sheet under the indicated captions, except for combined cur-rency and interest rate swaps, which are included in the appropriatecurrent or noncurrent asset or liability caption. Short-term invest-ments consist primarily of debt securities and have been classified asheld-to-maturity. Equity derivative contracts are classified within pre-paid expenses and forward exchange contracts are classified withinaccounts payable and other current liabilities.
Because of the short maturity of cash equivalents and short-terminvestments, the carrying amounts approximate fair values. The fairvalues of debt, debt-related derivative instruments and forward deriva-tive instruments were estimated using market quotes and calculationsbased on market rates. We have unconditionally guaranteed $2.3 billion of Bottling Group, LLC’s long-term debt. The guaranteehad a fair value of $66 million at December 30, 2000 and $64 million at December 25, 1999 based on market rates.
Note 13 – Income TaxesU.S. and foreign income before income taxes:
2000 1999 1998
U.S. $ 2,126 $ 2,771 $1,629
Foreign 1,084 885 634
$ 3,210 $ 3,656 $2,263
Provision for income taxes:2000 1999 1998
Current: Federal $ 771 $ 730 $ (193)
Foreign 157 306 267
State 36 40 46
964 1,076 120
Deferred: Federal 60 519 136
Foreign (10) (12) 4
State 13 23 10
63 530 150
$1,027 $1,606 $ 270
Reconciliation of the U.S. Federal statutory tax rate to our effective tax rate:
2000 1999 1998
U.S.Federal statutory tax rate 35.0% 35.0% 35.0%
State income tax, net of Federal tax benefit 1.0 1.1 1.6
Lower taxes on foreign results (3.0) (2.7) (3.0)
Settlement of prior years’audit issues – – (5.7)
Puerto Rico settlement – – (21.8)
Bottling transactions – 10.6 –
Asset impairment and restructuring – – 3.4
Other, net (1.0) (0.1) 2.4
Effective tax rate 32.0% 43.9% 11.9%
In 1998, we reached final agreement with the IRS to settle substan-tially all remaining aspects of a tax case related to our concentrateoperations in Puerto Rico. As a result, we recognized a tax benefit

36
totaling $494 million (or $0.32 per share) which reduced our 1998 provision for income taxes.
Deferred taxes are recorded to give recognition to temporary differ-ences between the tax bases of assets or liabilities and their reportedamounts in the financial statements. We record the tax effect of thesetemporary differences as deferred tax assets or deferred tax liabilities.Deferred tax assets generally represent items that can be used as a taxdeduction or credit in future years. Deferred tax liabilities generallyrepresent items that we have taken a tax deduction for, but have notyet recorded in the Consolidated Statement of Income.
Deferred tax liabilities (assets):2000 1999
Investments in unconsolidated affiliates $ 672 $ 667
Property, plant and equipment 576 545
Safe harbor leases 94 101
Zero coupon notes 73 76
Intangible assets other than nondeductible goodwill 54 47
Other 404 328
Gross deferred tax liabilities 1,873 1,764
Net operating loss carryforwards (443) (450)
Postretirement benefits (187) (179)
Various current liabilities and other (640) (626)
Gross deferred tax assets (1,270) (1,255)
Deferred tax assets valuation allowances 464 461
Deferred tax assets, net of valuation allowances (806) (794)
Net deferred tax liabilities $ 1,067 $ 970
Included in:
Prepaid expenses and other current assets $ (294) $ (239)
Deferred income taxes 1,361 1,209
$ 1,067 $ 970
Net operating loss carryforwards totaling $2.9 billion at year-end2000 are being carried forward and are available to reduce future taxable income of certain subsidiaries in a number of foreign and state jurisdictions. These net operating losses will expire as follows:$.1 billion in 2001, $2.5 billion between 2002 and 2016 and $.3 billionmay be carried forward indefinitely.
Valuation allowances have been established primarily for deferredtax assets related to net operating losses in certain state and foreigntax jurisdictions where the amount of expected future taxable incomefrom operations does not support the recognition of these deferredtax assets.
Analysis of Valuation Allowances:2000 1999 1998
Balance, beginning of year $ 461 $ 571 $458
Provision 1 81 113
Other additions/deductions 2 (191) –
Balance, end of year $ 464 $ 461 $571
Other additions/deductions include currency translation effect, andin 1999 the impact of the bottling transactions.
Deferred tax liabilities are not recognized for temporary differencesrelated to investments in foreign subsidiaries and in unconsolidatedforeign affiliates that are essentially permanent in duration. It wouldnot be practicable to determine the amount of any such deferred tax liabilities.
Note 14 – Employee Stock OptionsStock options are granted to employees under two different incentive plans:
• the SharePower Stock Option Plan (SharePower) and• the Long-Term Incentive Plan (LTIP).
SharePowerSharePower stock options are granted to essentially all full-timeemployees. SharePower options generally have a 10 year term.Beginning in 1998, the number of SharePower options granted isbased on each employee's annual earnings and tenure and generallybecome exercisable after three years. Prior to 1998, the number ofoptions granted was based on each employee’s annual earnings andgenerally became exercisable ratably over five years.
LTIPBeginning in 1998, all executive (including middle management)awards are made under the LTIP. Under the LTIP, an executive general-ly receives an award based on a multiple of base salary. Two-thirds ofthe award consists of stock options with an exercise price equal to theaverage stock price on the date of the award. These options generallybecome exercisable at the end of three years and have a 10 year term.At the date of the award, the executive selects whether the remainingone-third of the award will be granted in stock options or paid in cashat the end of three years. The number of options granted or the cashpayment, if any, will depend on the attainment of prescribed perform-ance goals over the three year measurement period. If the executivechooses stock options, they are granted with an exercise price equal tothe average stock price on the date of the grant, vest immediately andhave a 10 year term. If the executive chooses a cash payment, one dollar of cash will be received for every four dollars of the award.Amounts expensed for expected cash payments were $36.7 million in2000, $17.9 million in 1999 and $7 million in 1998. At year-end 2000,125 million shares were available for grants under the LTIP.
Prior to 1998Prior to 1998, Stock Option Incentive Plan (SOIP) options were grantedto middle management employees and were exercisable after one year.LTIP options were granted to senior management employees and weregenerally exercisable after four years. Both SOIP and LTIP options have10 year terms. Certain LTIP options could be exchanged by employeesfor a specified number of performance share units (PSUs) within 60 daysof the grant date. The value of a PSU was fixed at the stock price at thegrant date and the PSU was payable four years from the grant date, con-tingent upon attainment of prescribed performance goals. At year-end2000, there were no PSUs outstanding. There were 68,000 and 84,000PSUs outstanding in 1999 and 1998, respectively. Payment of PSUs wasmade in cash and/or in stock as approved by the CompensationCommittee of our Board of Directors. Amounts expensed for PSUs were$.3 million in 1999 and $1 million in 1998.

37
Stock option activity:
(Options in thousands) 2000 1999 1998Weighted Weighted Weighted
Average Average AverageExercise Exercise Exercise
Options Price Options Price Options PriceOutstanding at
beginning of year 163,383 $26.90 146,991 $23.28 146,329 $18.95Granted 23,111 34.42 44,017 35.04 34,906 36.33
Exercised (29,546) 18.90 (19,646) 15.68 (28,076) 15.31Surrendered
for PSUs – – – – (24) 37.46Forfeited/expired (9,141) 34.48 (7,979) 33.34 (6,144) 28.83
Outstanding at
end of year 147,807 29.13 163,383 26.90 146,991 23.28
Exercisable at
end of year (a) 62,656 $21.72 75,045 $18.98 82,692 $16.74Weighted average fair
value of optionsgranted during the year $11.85 $10.43 $ 9.82
(a) In connection with the 1999 bottling transactions, substantially all non-vested PepsiCo capital stockoptions held by bottling employees vested. The acceleration resulted in a $46 million pre-tax chargeincluded in the determination of the related net gain.
Stock options outstanding and exercisable at December 30, 2000:
Options Outstanding Options ExercisableWeighted
Average Weighted WeightedRemaining Average Average
Range of Contractual Exercise ExerciseExercise Price Options Life Price Options Price$ 4.25 to $13.88 5,940 1.57 yrs. $ 9.67 5,936 $ 9.67
$14.20 to $32.25 72,282 5.26 24.43 48,380 20.93
$32.40 to $47.00 69,585 7.92 35.95 8,340 34.94
147,807 6.32 29.13 62,656 21.72
Pro forma income and pro forma income per share, as if we had record-ed compensation expense based on fair value for stock-based awards:
2000 1999 1998
Reported
Net income $2,183 $2,050 $1,993
Income per share – basic $ 1.51 $ 1.40 $ 1.35
Income per share – assuming dilution $ 1.48 $ 1.37 $ 1.31
Pro Forma
Net income $2,000 $1,904 $1,888
Income per share – basic $ 1.38 $ 1.30 $ 1.28
Income per share – assuming dilution $ 1.36 $ 1.27 $ 1.24
The pro forma amounts disclosed above are not fully representativeof the effects of stock-based awards because, except for the impactresulting from the bottling transactions, the amounts exclude the proforma cost related to the unvested stock options granted before 1995.
We estimate the fair value of stock-based awards using the Black-Scholes option-pricing model based on the following weightedaverage assumptions for options granted during the year:
2000 1999 1998
Risk free interest rate 6.7% 5.2% 4.7%
Expected life 5 yrs. 5 yrs. 5 yrs.
Expected volatility 29% 27% 23%
Expected dividend yield 1.08% 1.34% 1.14%
Note 15 – Pension and Postretirement BenefitsPension BenefitsOur pension plans cover substantially all full-time U.S. employees andcertain international employees. Benefits depend on years of serviceand earnings or are based on stated amounts for each year of service.
Postretirement BenefitsOur postretirement plans provide medical and life insurance benefitsprincipally to U.S. retirees and their dependents. Employees are eligible for benefits if they meet age and service requirements andqualify for retirement benefits.
Components of net periodic benefit cost:Pension
2000 1999 1998
Service cost $ 92 $ 99 $ 95
Interest cost 138 128 136
Expected return on plan assets (151) (156) (169)
Amortization of transition asset (2) (2) (9)
Amortization of prior service amendments 6 8 12
Amortization of net loss 6 15 5
Net periodic benefit cost 89 92 70
Curtailment/settlement loss – 52 9
Special termination benefits – 10 4
Net periodic benefit cost including curtailments/
settlements and special termination benefits $ 89 $ 154 $ 83

38
Components of net periodic benefit cost:Postretirement
2000 1999 1998
Service cost $ 16 $ 16 $ 16
Interest cost 37 35 39
Amortization of prior service amendments (12) (14) (18)
Amortization of net gain (1) (1) (2)
Net periodic benefit cost 40 36 35
Special termination benefits – 3 1
Net periodic benefit cost including
special termination benefits $ 40 $ 39 $ 36
Prior service costs are amortized on a straight-line basis over the average remaining service period of employees expected toreceive benefits.
Change in benefit obligation:Pension Postretirement
2000 1999 2000 1999
Obligation at beginning of year $1,872 $2,479 $468 $ 644
Service cost 92 99 16 16
Interest cost 138 128 37 35
Plan amendments 3 1 – –
Participant contributions 5 6 – –
Actuarial (gain)/loss (28) 3 27 6
Acquisitions/(divestitures) 3 (717) – (205)
Benefit payments (104) (134) (25) (31)
Special termination benefits – 10 – 3
Foreign currency adjustment (28) (3) – –
Obligation at end of year $1,953 $1,872 $523 $ 468
Change in the fair value of plan assets:Pension Postretirement
2000 1999 2000 1999
Fair value at beginning of year $1,615 $2,045 $ – $ –
Actual return on plan assets 285 343 – –
Acquisitions/(divestitures) 14 (659) – –
Employer contributions 92 17 25 31
Participant contributions 5 6 – –
Benefit payments (104) (134) (25) (31)
Foreign currency adjustment (30) (3) – –
Fair value at end of year $1,877 $1,615 $ – $ –
In 1999, as a result of the bottling transactions, $717 million of pension benefit obligation and $205 million of postretirement benefitobligation were assumed by bottling affiliates. In addition, bottlingaffiliate plans assumed ownership of $659 million of pension assets.The net gain on the bottling transactions includes a curtailment/settlement net loss of $52 million.
Selected information for plans with accumulated benefit obligation inexcess of plan assets:
Pension Postretirement
2000 1999 2000 1999
Projected benefit obligation $(208) $ (780) $ (523) $(468)
Accumulated benefit obligation $(101) $ (586) $ (523) $(468)
Fair value of plan assets $ 9 $ 500 $ – $ –
Funded status as recognized in the Consolidated Balance Sheet:Pension Postretirement
2000 1999 2000 1999
Funded status at end of year $ (76) $(257) $(523) $(468)
Unrecognized prior service cost 30 34 (21) (33)
Unrecognized (gain)/loss (121) 61 50 14
Unrecognized transition asset (1) (3) – –
Net amounts recognized $(168) $(165) $(494) $(487)
Net amounts as recognized in the Consolidated Balance Sheet:Pension Postretirement
2000 1999 2000 1999
Prepaid benefit cost $ 115 $ 117 $ – $ –
Intangible assets 1 – – –
Accrued benefit liability (292) (287) (494) (487)
Accumulated other
comprehensive income 8 5 – –
Net amounts recognized $(168) $(165) $(494) $(487)
Weighted-average assumptions at end of year:Pension
2000 1999 1998
Discount rate for benefit obligation 7.9% 7.7% 6.8%
Expected return on plan assets 10.3% 10.4% 10.2%
Rate of compensation increase 4.5% 4.6% 4.7%
The discount rate assumption used to compute the postretirementbenefit obligation at year end was 8.0% in 2000 and 7.75% in 1999.
Measurement DateWe use a September 30 measurement date.
Components of Pension AssetsThe pension plan assets are principally stocks and bonds. These assetsinclude approximately 4.7 million shares of PepsiCo capital stock with afair value of $214 million in 2000 and 6.5 million shares with a fair valueof $198 million in 1999. To maintain diversification, 1.8 million sharesof PepsiCo capital stock were sold in 2000 and .5 million shares weresold in 1999. In addition, in 1999, PBG pension plans assumed owner-ship of 3.1 million shares of PepsiCo capital stock with a fair value of$95 million.

39
Health Care Cost Trend RatesAn average increase of 5.9% in the cost of covered postretirementmedical benefits is assumed for 2001 for employees who retire with-out cost sharing. This average increase is then projected to declinegradually to 5.5% in 2005 and thereafter.
An average increase of 5.5% in the cost of covered postretirementmedical benefits is assumed for 2001 for employees who retire withcost sharing. This average increase is then projected to decline to zero in 2003 and thereafter.
Assumed health care cost trend rates have a significant effect on the amounts reported for postretirement medical plans. A onepercentage point change in assumed health care costs would have the following effects:
1% Increase 1% Decrease
Effect on total of 2000 service
and interest cost components $ 2 $ (2)
Effect on the 2000 accumulated
postretirement benefit obligation $26 $(24)
Note 16 – Commitments, Contingencies and LeasesWe are subject to various claims and contingencies related to lawsuits,taxes, environmental and other matters arising out of the normalcourse of business. Contingent liabilities primarily reflect guaranteesto support financial arrangements of certain unconsolidated affiliates,including the unconditional guarantee for $2.3 billion of BottlingGroup, LLC’s long-term debt. We believe that the ultimate liability, ifany, in excess of amounts already recognized arising from such claimsor contingencies is not likely to have a material adverse effect on ourresults of operations, financial condition or liquidity.
We have non-cancelable commitments under both capital andlong-term operating leases, primarily for warehouses, distributioncenters and office space. Capital and operating lease commitmentsexpire at various dates through 2047 and may provide for renewal orpurchase options. Most leases require payment of related executorycosts, which include property taxes, maintenance and insurance.
Future minimum commitments under non-cancelable leases:
Capital Operating
2001 $ 1 $ 101
2002 1 83
2003 – 66
2004 – 32
2005 – 24
Later years 2 99
Total minimum lease payments 4 $ 405
Less imputed interest (1)
Present value of net minimum capital lease payments $ 3
Capitalized leases, included as property, plant and equipment,were $14 million in 2000 and $13 million in 1999. The related accumu-lated amortization was $7 million in 2000 and $7 million in 1999.Amortization expense related to capitalized leases was $1 million in2000, $1 million in 1999 and $6 million in 1998.
Details of rental expense:2000 1999 1998
Minimum $117 $ 91 $141
Contingent 2 1 1
$119 $ 92 $142
Note 17 – Business SegmentsIn 1998, we adopted Statement of Financial Accounting Standards No.131, Disclosures about Segments of a Business Enterprise and RelatedInformation, which is based on management reporting. In early 1999,in contemplation of the separation from PepsiCo of our bottling oper-ations, we completed a reorganization of our Pepsi-Cola business.Accordingly, our 1999 disclosure presents operating results consistentwith the new Pepsi-Cola organization. 1998 amounts have beenreclassified to conform to the 1999 and 2000 presentation. Therefore,the results in 1998 and through the applicable transaction closingdates in 1999 of consolidated bottling operations in which we nowown an equity interest are presented separately with the 1998 andfirst quarter 1999 equity income or loss of other unconsolidated bottling affiliates. From the applicable transaction closing dates in1999, the equity income of those previously consolidated bottlingoperations and the equity income or loss of other unconsolidated bottling affiliates from the second quarter of 1999, are presented separately below operating profit in the Condensed ConsolidatedStatement of Income. The combined results of our five reportablesegments are referred to as New PepsiCo.
The North American segments include the United States andCanada. The Tropicana segment includes its international results.Pepsi-Cola North America results include the North American concentrate and fountain businesses. Pepsi-Cola International results include the international concentrate business and consolidated international bottling operations.
The accounting policies of the segments are the same as thosedescribed in Note 1. All intersegment net sales and expenses areimmaterial and have been eliminated in computing net sales andoperating profit.
Frito-Lay North AmericaFrito-Lay North America manufactures, markets, sells and distributessalty and sweet snacks. Products manufactured and sold in NorthAmerica include Lay’s and Ruffles brand potato chips, Doritos andTostitos brand tortilla chips, Cheetos brand cheese-flavored snacks,Fritos brand corn chips, a variety of branded dips and salsas and RoldGold brand pretzels. Low-fat and no-fat versions of several brands arealso manufactured and sold in North America.
Frito-Lay InternationalFrito-Lay International manufactures, markets, sells and distributessalty and sweet snacks. Products include Walkers brand snack foods inthe United Kingdom, Smith's brand snack foods in Australia, Sabritasbrand snack foods and Alegro and Gamesa brand sweet snacks inMexico. Many of our U.S. brands have been introduced internationallysuch as Lay’s and Ruffles brand potato chips, Doritos and Tostitosbrand tortilla chips, Fritos brand corn chips and Cheetos brandcheese-flavored snacks.
Principal international snack markets include Mexico, the UnitedKingdom, Brazil, Spain, the Netherlands, Australia and South Africa.

40
Pepsi-Cola North AmericaPepsi-Cola North America manufactures concentrates of brand Pepsi,Mountain Dew, Mug, Slice, Fruitworks, Sierra Mist and other brands forsale to franchised bottlers. PCNA also sells syrups to national fountainaccounts. PCNA markets and promotes its brands. PCNA also manu-factures, markets and distributes ready-to-drink tea and coffeeproducts through joint ventures with Lipton and Starbucks and licenses the processing, distribution and sale of Aquafina bottledwater. In addition, PCNA manufactures and sells Dole juice drinks fordistribution and sale by Pepsi-Cola bottlers.
Pepsi-Cola InternationalPepsi-Cola International manufactures concentrates of brand Pepsi,7UP, Mirinda, KAS, Mountain Dew and other brands internationally forsale to franchised bottlers and company-owned bottlers. PCI operatesbottling plants and distribution facilities in various international mar-kets for the production, distribution and sale of company-owned andlicensed brands. PCI markets and promotes its brands internationally.
Principal international markets include Mexico, China, Saudi Arabia,India, Argentina, Thailand, the United Kingdom, Spain, the Philippinesand Brazil.
TropicanaTropicana produces, markets, sells and distributes its juices in theUnited States and internationally. Products primarily sold in the UnitedStates include Tropicana Pure Premium, Season’s Best, TropicanaTwister and Dole brand juices. Many of these products are distributedand sold in Canada and brands such as Fruvita, Looza and Copella arealso available in Europe.
Principal international markets include Canada, the United Kingdomand France.
Fiscal YearComparisons of 2000 to 1999 and 1998 are affected by an additionalweek of results in the 2000 reporting period. The estimated impact ofthe fifty-third week on 2000 segment results is as follows:
Net Operating
Sales Profit
Frito-Lay
– North America $164 $40
– International 61 10
Pepsi-Cola North America 36 13
Tropicana 33 5
$294 68
Corporate unallocated (6)
$62
Impairment and Restructuring Charges By Segment1999 1998
Frito-Lay North America $65 $ 54
Pepsi-Cola
– North America – 6
– International – 6
Combined segments 65 66
Bottling operations/investments – 222
$65 $288
See Note 4 for details on the above asset impairment and restructuring charges.
BUSINESS SEGMENTS2000 1999 1998
Net Sales
Frito-Lay
– North America $ 8,562 $ 7,865 $ 7,474
– International 4,319 3,750 3,501
Pepsi-Cola
– North America 3,289 2,605 1,389
– International 1,842 1,771 1,600
Tropicana 2,426 2,253 722
New PepsiCo 20,438 18,244 14,686
Bottling operations/investments – 2,123 7,662
$20,438 $20,367 $22,348
Operating Profit (a)
Frito-Lay
– North America $ 1,851 $ 1,580 $ 1,424
– International 493 406 367
Pepsi-Cola
– North America 833 751 732
– International 148 108 99
Tropicana 225 170 40
Combined segments 3,550 3,015 2,662
Corporate (b) (325) (250) (202)
New PepsiCo 3,225 2,765 2,460
Bottling operations/investments – 53 124
$ 3,225 $ 2,818 $ 2,584
Total Assets
Frito-Lay
– North America $ 4,119 $ 4,013 $ 3,915
– International 4,085 4,170 4,039
Pepsi-Cola
– North America 836 729 547
– International 1,432 1,454 1,177
Tropicana 3,743 3,708 3,661
Combined segments 14,215 14,074 13,339
Corporate (c) 1,592 1,008 215
Bottling operations/investments 2,532 2,469 9,106
$18,339 $17,551 $22,660

41
2000 1999 1998
Amortization of Intangible Assets
Frito-Lay
– North America $ 7 $ 8 $ 7
– International 46 46 43
Pepsi-Cola
– North America 2 2 3
– International 14 13 8
Tropicana 69 70 22
Combined segments 138 139 83
Bottling operations/investments – 44 139
$ 138 $ 183 $ 222
Depreciation and Other Amortization Expense
Frito-Lay
– North America $ 366 $ 338 $ 326
– International 172 149 142
Pepsi-Cola
– North America 94 72 30
– International 91 85 64
Tropicana 83 81 27
Combined segments 806 725 589
Corporate 16 10 8
Bottling operations/investments – 114 415
$ 822 $ 849 $ 1,012
Significant Other Noncash Items (d)
Frito-Lay North America $ 37 $ 54
Pepsi-Cola International – 6
Combined segments 37 60
Bottling operations/investments – 194
$ 37 $ 254
Capital Spending
Frito-Lay
– North America $ 502 $ 472 $ 402
– International 264 282 314
Pepsi-Cola
– North America 59 22 21
– International 72 82 46
Tropicana 134 123 50
Combined segments 1,031 981 833
Corporate 36 42 29
Bottling operations/investments – 95 543
$1,067 $1,118 $ 1,405
2000 1999 1998
Investments in Unconsolidated Affiliates
Frito-Lay International $ 373 $ 284 $ 341
Pepsi-Cola North America 32 50 33
Tropicana 19 21 22
Combined segments 424 355 396
Corporate 22 22 22
Bottling operations/investments 2,532 2,469 978
$ 2,978 $ 2,846 $ 1,396
Equity Income/(Loss) from Unconsolidated Affiliates
Frito-Lay International $ 26 $ 3 $ (5)
Pepsi-Cola North America 33 31 21
Tropicana 2 2 1
Combined segments 61 36 17
Bottling operations/investments 130 76 8
$ 191 $ 112 $ 25
GEOGRAPHIC AREAS
Net Sales
United States $13,179 $11,772 $ 8,782
International 7,259 6,472 5,904
Combined segments 20,438 18,244 14,686
Bottling operations/investments – 2,123 7,662
$20,438 $20,367 $22,348
Long-Lived Assets (e)
United States $ 8,179 $ 7,980 $ 6,732
International 4,722 4,867 4,276
Combined segments 12,901 12,847 11,008
Bottling operations/investments – – 6,702
$12,901 $12,847 $17,710(a) Includes asset impairment and restructuring charges.
(b) Includes unallocated corporate headquarters expenses and costs of centrally managed insurance programs, minority interests and foreign exchange translation and transaction gains and losses.
(c) Corporate assets consist principally of cash and cash equivalents, short-term investments primarily heldoutside the U.S. and property and equipment.
(d) Represents the noncash portion of asset impairment and restructuring charges. See Note 4.
(e) Represents net property, plant and equipment, net intangible assets and investments in unconsolidatedaffiliates.

Note 19 – Subsequent Event and Proposed MergerSubsequent Acquisition of South Beach Beverage Company, Inc.On January 5, 2001, we completed the acquisition of South BeachBeverage Company, LLC for approximately $337 million in cash,retaining a 91% interest in the newly formed South Beach BeverageCompany, Inc. (SoBe). SoBe manufactures and markets an innovativeline of alternative non-carbonated beverages including fruit blends,energy drinks, dairy-based drinks, exotic teas and other beverages withherbal ingredients, which are distributed under license by a network ofindependent distributors, primarily in the United States.
Proposed Merger with The Quaker Oats Company On December 4, 2000, we announced a merger agreement with TheQuaker Oats Company (Quaker). Under the terms of this agreement,Quaker shareholders will receive 2.3 shares of PepsiCo capital stocksubject to a maximum value of $105 for each Quaker share. In theevent that the value exceeds $105, the exchange ratio is subject toadjustment. Further, if the value of PepsiCo shares received by Quaker
shareholders for each Quaker share is below $92, Quaker may termi-nate the merger agreement. Based on the closing price of our stock of$42.375 per share on December 1, 2000, the proposed tax-free transac-tion is valued at $97.4625 per Quaker share. In conjunction with themerger agreement, we entered into a stock option agreement withQuaker which granted us an option, under certain circumstances, topurchase up to approximately 19.9% of the outstanding shares ofQuaker common stock. The proposed merger is subject to certain closing conditions, including shareholder approval at both companies,and certain regulatory approvals. The merger is expected to close inthe first half of 2001 and is expected to be accounted for as a “pooling- of-interests.”
Note 18 – Selected Quarterly Financial Data (unaudited)
First Quarter (a) Second Quarter (a) Third Quarter (a) Fourth Quarter (f) Full Year (a)(f)
(12 Weeks) (12 Weeks) (12 Weeks) (17 Weeks)(16 Weeks) (53 Weeks)(52 Weeks)2000 1999 2000 1999 2000 1999 2000 1999 2000 1999
Net sales $ 4,191 5,114 4,928 4,982 4,909 4,591 6,410 5,680 20,438 20,367
Gross profit $ 2,514 2,974 3,037 2,970 3,044 2,798 3,900 3,427 12,495 12,169
Asset impairment and
restructuring charges (b) $ – 65 – – – – – – – 65
Gain on bottling transactions (c) $ – – – 1,000 – – – – – 1,000
Net income (d) $ 422 333 563 743 587 484 611 490 2,183 2,050
Net income per share - basic $ 0.29 0.23 0.39 0.50 0.41 0.33 0.42 0.34 1.51 1.40
Net income per share -
assuming dilution $ 0.29 0.22 0.38 0.49 0.40 0.32 0.41 0.33 1.48 1.37
Cash dividends declared per share $ 0.135 0.13 0.14 0.135 0.14 0.135 0.14 0.135 0.555 0.535
Stock price per share (e)
High $ 38 5/8 42 9/16 42 1/2 41 7/16 47 1/16 41 1/2 49 15/16 37 3/4 49 15/16 42 9/16
Low $ 29 11/16 36 3/16 31 9/16 34 1/16 39 11/16 33 3/8 41 5/16 30 1/8 29 11/16 30 1/8
Close $ 33 39 15/16 41 1/4 35 3/8 42 5/16 34 5/8 49 9/16 35 7/16 49 9/16 35 7/16
(a) 1999 includes the operating results of deconsolidated bottling operations through their respective closing dates (see Note 2).
(b) First quarter 1999 includes an asset impairment and restructuring charge of $65 million ($40 million after-tax or $0.03 per share) (see Note 4).
(c) Second quarter 1999 gain on bottling transactions of $1.0 billion ($270 million after-tax or $0.18 per share) relates to the PBG and Whitman bottling transactions (see Note 2).
(d) Includes, in 1999, in addition to $270 million associated with the bottling transactions described in (c) above, a tax provision of $25 million (or $0.02 per share) in the third quarter related to the PepCom transaction.
(e) Represents the composite high and low sales price and quarterly closing prices for one share of PepsiCo’s capital stock.
(f) Fiscal year 2000 consisted of fifty-three weeks and 1999 consisted of fifty-two weeks. The favorable impact for the fourth quarter and full year to net sales was an estimated $294 million, to operating profit was an estimated $62 million, and to net income was an estimated $44 million or $0.03 per share.
42
43
MANAGEMENT’SRESPONSIBILITY FORFINANCIAL STATEMENTSTo Our Shareholders:
Management is responsible for the reliability of the consolidated finan-cial statements and related notes. The financial statements wereprepared in conformity with generally accepted accounting principlesand include amounts based upon our estimates and assumptions, asrequired. The financial statements have been audited by our inde-pendent auditors, KPMG LLP, who were given free access to all financialrecords and related data, including minutes of the meetings of theBoard of Directors and Committees of the Board. We believe that ourrepresentations to the independent auditors are valid and appropriate.
Management maintains a system of internal controls designed toprovide reasonable assurance as to the reliability of the financial statements, as well as to safeguard assets from unauthorized use ordisposition. The system is supported by formal policies and proce-dures, including an active Code of Conduct program intended toensure employees adhere to the highest standards of personal andprofessional integrity. Our internal audit function monitors andreports on the adequacy of and compliance with the internal controlsystem, and appropriate actions are taken to address significant con-trol deficiencies and other opportunities for improving the system asthey are identified. The Audit Committee of the Board of Directors consists solely of directors who are not salaried employees and whoare, in the opinion of the Board of Directors, free from any relationshipthat would interfere with the exercise of independent judgment as acommittee member. The Committee meets during the year with representatives of management, including internal auditors and theindependent accountants to review our financial reporting processand our controls to safeguard assets. Both our independent auditorsand internal auditors have free access to the Audit Committee.
Although no cost-effective internal control system will preclude allerrors and irregularities, we believe our controls as of December 30,2000 provide reasonable assurance that the financial statements arereliable and that our assets are reasonably safeguarded.
Peter A. BridgmanSenior Vice President and Controller
Indra K. NooyiSenior Vice President and Chief Financial Officer
REPORT OF INDEPENDENTAUDITORS
Board of Directors and ShareholdersPepsiCo, Inc.
We have audited the accompanying consolidated balance sheet ofPepsiCo, Inc. and Subsidiaries as of December 30, 2000 and December25, 1999 and the related consolidated statements of income, cashflows and shareholders’equity for each of the years in the three-yearperiod ended December 30, 2000. These consolidated financial statements are the responsibility of PepsiCo, Inc.’s management.Our responsibility is to express an opinion on these consolidated financial statements based on our audits.
We conducted our audits in accordance with auditing standardsgenerally accepted in the United States of America. Those standardsrequire that we plan and perform the audit to obtain reasonable assurance about whether the financial statements are free of materialmisstatement. An audit includes examining, on a test basis, evidencesupporting the amounts and disclosures in the financial statements.An audit also includes assessing the accounting principles used andsignificant estimates made by management, as well as evaluating theoverall financial statement presentation. We believe that our auditsprovide a reasonable basis for our opinion.
In our opinion, the consolidated financial statements referred to above present fairly, in all material respects, the financial position of PepsiCo, Inc. and Subsidiaries as of December 30, 2000 and December 25, 1999, and the results of their operations and theircash flows for each of the years in the three-year period endedDecember 30, 2000, in conformity with accounting principles generallyaccepted in the United States of America.
KPMG LLPNew York, New YorkFebruary 2, 2001

44
SELECTED FINANCIAL DATA(in millions except per share, unaudited)
PepsiCo, Inc. and Subsidiaries
2000(a) 1999(b)(c) 1998(c)(d) 1997(c) 1996(c)
Net sales $ 20,438 20,367 22,348 20,917 20,337
Income from continuing operations $ 2,183 2,050 1,993 1,491 942
Income per share - continuing operations – basic $ 1.51 1.40 1.35 0.98 0.60
Income per share - continuing operations – assuming dilution $ 1.48 1.37 1.31 0.95 0.59
Cash dividends declared per share $ 0.555 0.535 0.515 0.49 0.445
Total assets (e) $ 18,339 17,551 22,660 20,101 22,160
Long-term debt $ 2,346 2,812 4,028 4,946 8,174
As a result of the bottling deconsolidation in 1999 and the Tropicana acquisition late in 1998, the data provided above is not comparable (see Note 1).
In 1997, we disposed of our restaurants segment and accounted for the disposal as discontinued operations. Accordingly, all information has been restated for 1997 and 1996.
(a) The 2000 fiscal year consisted of fifty-three weeks versus fifty-two weeks in our normal fiscal year. The fifty-third week increased 2000 net sales by an estimated $294 million and net income by an estimated $44 million or $0.03 per share.
(b) Includes a net gain on bottling transactions in 1999 of $1.0 billion ($270 million after-tax or $0.18 per share) and a tax provision related to the PepCom transaction of $25 million ($0.02 per share).
(c) Includes asset impairment and restructuring charges of $65 million ($40 million after-tax or $0.03 per share) in 1999, $288 million ($261 million after-tax or $0.17 per share) in 1998, $290 million ($239 million after-tax or $0.15 per share) in 1997 and $576 million ($527 million after-tax or $0.33 per share) in 1996 (see Note 4).
(d) Includes a tax benefit of $494 million (or $0.32 per share) (see Note 13).
(e) Includes net assets of discontinued operations of $4,450 million in 1996.
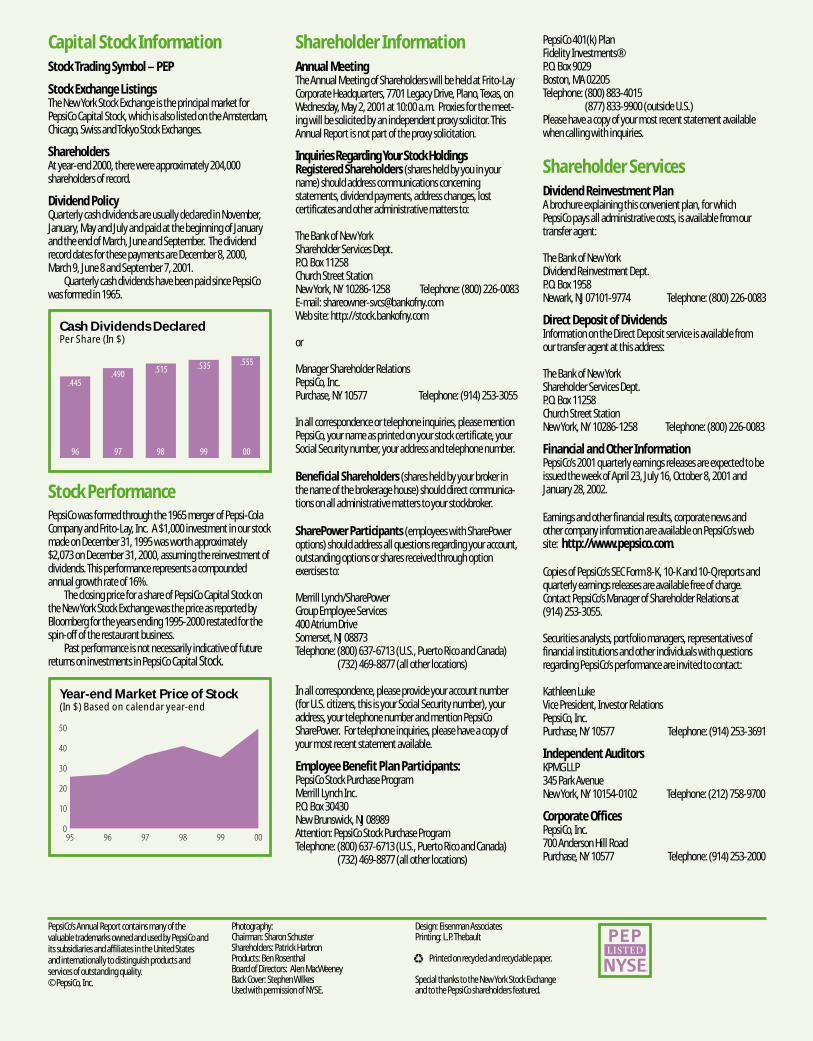
Capital Stock InformationStock Trading Symbol – PEP
Stock Exchange ListingsThe New York Stock Exchange is the principal market forPepsiCo Capital Stock, which is also listed on the Amsterdam,Chicago, Swiss and Tokyo Stock Exchanges.
ShareholdersAt year-end 2000, there were approximately 204,000 shareholders of record.
Dividend PolicyQuarterly cash dividends are usually declared in November,January, May and July and paid at the beginning of Januaryand the end of March, June and September. The dividendrecord dates for these payments are December 8, 2000,March 9, June 8 and September 7, 2001.
Quarterly cash dividends have been paid since PepsiCowas formed in 1965.
Stock PerformancePepsiCo was formed through the 1965 merger of Pepsi-ColaCompany and Frito-Lay, Inc. A $1,000 investment in our stockmade on December 31, 1995 was worth approximately$2,073 on December 31, 2000, assuming the reinvestment ofdividends. This performance represents a compounded annual growth rate of 16%.
The closing price for a share of PepsiCo Capital Stock onthe New York Stock Exchange was the price as reported byBloomberg for the years ending 1995-2000 restated for thespin-off of the restaurant business.
Past performance is not necessarily indicative of futurereturns on investments in PepsiCo Capital Stock.
Shareholder InformationAnnual MeetingThe Annual Meeting of Shareholders will be held at Frito-LayCorporate Headquarters, 7701 Legacy Drive, Plano, Texas, onWednesday, May 2, 2001 at 10:00 a.m. Proxies for the meet-ing will be solicited by an independent proxy solicitor. ThisAnnual Report is not part of the proxy solicitation.
Inquiries Regarding Your Stock HoldingsRegistered Shareholders (shares held by you in yourname) should address communications concerning statements, dividend payments, address changes, lost certificates and other administrative matters to:
The Bank of New YorkShareholder Services Dept.P.O. Box 11258 Church Street StationNew York, NY 10286-1258 Telephone: (800) 226-0083E-mail: [email protected] site: http://stock.bankofny.com
or
Manager Shareholder RelationsPepsiCo, Inc.Purchase, NY 10577 Telephone: (914) 253-3055
In all correspondence or telephone inquiries, please mentionPepsiCo, your name as printed on your stock certificate, yourSocial Security number, your address and telephone number.
Beneficial Shareholders (shares held by your broker inthe name of the brokerage house) should direct communica-tions on all administrative matters to your stockbroker.
SharePower Participants (employees with SharePoweroptions) should address all questions regarding your account,outstanding options or shares received through option exercises to:
Merrill Lynch/SharePower Group Employee Services400 Atrium DriveSomerset, NJ 08873Telephone: (800) 637-6713 (U.S., Puerto Rico and Canada)
(732) 469-8877 (all other locations)
In all correspondence, please provide your account number(for U.S. citizens, this is your Social Security number), youraddress, your telephone number and mention PepsiCoSharePower. For telephone inquiries, please have a copy ofyour most recent statement available.
Employee Benefit Plan Participants:PepsiCo Stock Purchase Program Merrill Lynch Inc.P.O. Box 30430New Brunswick, NJ 08989Attention: PepsiCo Stock Purchase ProgramTelephone: (800) 637-6713 (U.S., Puerto Rico and Canada)
(732) 469-8877 (all other locations)
PepsiCo 401(k) PlanFidelity Investments®P.O. Box 9029Boston, MA 02205Telephone: (800) 883-4015
(877) 833-9900 (outside U.S.)Please have a copy of your most recent statement availablewhen calling with inquiries.
Shareholder ServicesDividend Reinvestment PlanA brochure explaining this convenient plan, for which PepsiCo pays all administrative costs, is available from ourtransfer agent:
The Bank of New YorkDividend Reinvestment Dept.P.O. Box 1958Newark, NJ 07101-9774 Telephone: (800) 226-0083
Direct Deposit of DividendsInformation on the Direct Deposit service is available fromour transfer agent at this address:
The Bank of New YorkShareholder Services Dept.P.O. Box 11258Church Street StationNew York, NY 10286-1258 Telephone: (800) 226-0083
Financial and Other InformationPepsiCo’s 2001 quarterly earnings releases are expected to beissued the week of April 23, July 16, October 8, 2001 andJanuary 28, 2002.
Earnings and other financial results, corporate news andother company information are available on PepsiCo’s website: http://www.pepsico.com.
Copies of PepsiCo’s SEC Form 8-K, 10-K and 10-Q reports andquarterly earnings releases are available free of charge.Contact PepsiCo’s Manager of Shareholder Relations at (914) 253-3055.
Securities analysts, portfolio managers, representatives offinancial institutions and other individuals with questionsregarding PepsiCo’s performance are invited to contact:
Kathleen LukeVice President, Investor RelationsPepsiCo, Inc.Purchase, NY 10577 Telephone: (914) 253-3691
Independent AuditorsKPMG LLP345 Park AvenueNew York, NY 10154-0102 Telephone: (212) 758-9700
Corporate OfficesPepsiCo, Inc.700 Anderson Hill RoadPurchase, NY 10577 Telephone: (914) 253-2000
PepsiCo’s Annual Report contains many of the valuable trademarks owned and used by PepsiCo andits subsidiaries and affiliates in the United States and internationally to distinguish products and services of outstanding quality.© PepsiCo, Inc.
Photography:Chairman: Sharon SchusterShareholders: Patrick HarbronProducts: Ben RosenthalBoard of Directors: Alen MacWeeneyBack Cover: Stephen WilkesUsed with permission of NYSE.
Design: Eisenman AssociatesPrinting: L.P. Thebault
Printed on recycled and recyclable paper.
Special thanks to the New York Stock Exchange and to the PepsiCo shareholders featured.
Cash Dividends DeclaredPer Share (In $)
96 97 98 99 00
.445.490 .515 .535 .555
Year-end Market Price of Stock(In $) Based on calendar year-end
095 96 97 98 99 00
10
20
30
40
50