
PeopleSoft: A Properly Instrumented...
43
PeopleSoft: A Properly Instrumented Application? David Kurtz Go-Faster Consultancy Ltd. [email protected] www.go-faster.co.uk
Transcript of PeopleSoft: A Properly Instrumented...

PeopleSoft Instrumentation © www.go-faster.co.uk 2
PeopleSoft: A Properly Instrumented Application?
David KurtzGo-Faster Consultancy Ltd.
www.go-faster.co.uk

PeopleSoft Instrumentation © www.go-faster.co.uk 3
Agenda
• Instrumentation – Oracle RDBMS– PeopleSoft PeopleTools
• Fusion– The shape of things to come

PeopleSoft Instrumentation © www.go-faster.co.uk 4
• Oracle Database Specialist– Independent consultant
• System Performance tuning– PeopleSoft ERP– Oracle RDBMS
• UK Oracle User Group – PeopleSoft Director
• Book– www.psftdba.com
Who Am I?

PeopleSoft Instrumentation © www.go-faster.co.uk 5
Resources
• If you can’t hear me say so now.• Please feel free to ask questions as we go
along.• The presentation will be available from
• Hotsos website• www.go-faster.co.uk
• Article in UKOUG Oracle Scene magazine
PeopleSoft Instrumentation © www.go-faster.co.uk 6
Taking the Con out of Fusion
• Project Fusion is a new ERP application suite that Oracle will develop.
• Taking the best bits from:– Oracle’s own E-Business suite– PeopleSoft– JD Edwards– Siebel
• All of which are now legacy applications!?

PeopleSoft Instrumentation © www.go-faster.co.uk 7
What databases will Fusion Support?
• Not just Oracle RDBMS?– SQL Server?– DB2?
PeopleSoft Instrumentation © www.go-faster.co.uk 8
Performance Tuning
• We do not use ratio based tuning any more.– Especially the buffer cache hit ratio
• We do use timed event based tuning.
• Further reading:– YAPP – Kolk, Yamaguchi, and Viscusi– Optimising Oracle Performance - Millsap & Holt
• www.hotsos.com, www.oreilley.com– The Goal – Eli Goldratt
PeopleSoft Instrumentation © www.go-faster.co.uk 9
Performance Instrumentation
• Oracle does understand instrumentation.– Instrumentation is built in throughout the
database kernel.
• PeopleTools 8.44 upwards includes Performance Monitor.– Instrumentation built into PeopleSoft
technology.

PeopleSoft Instrumentation © www.go-faster.co.uk 10
Oracle RDBMS Instrumentation
• Dynamic Performance Views– Statspack– AWR / ADDM (licensed extras)
• Trace/Dump to operating system files– Enhanced by setting events – Profilers
PeopleSoft Instrumentation © www.go-faster.co.uk 11
What does this instrumentation do for us?
• If you have a performance problem, then you can determine exactly what the database is doing, and how long that is taking.– It can also prove that the problem is not located
in the database!• Hence, you can work out what to do about
it.

PeopleSoft Instrumentation © www.go-faster.co.uk 12
Event 10046 Level 8
• a.k.a. SQL*Trace with timed event information• Includes
– Every SQL Statement• How long it took to parse/execute/fetch
– Row source operation list• How long each operation took
– STATISTICS_LEVEL
– Every event for which the database waits• Can then profile with TKPROF, Trace File
Analyzer, or Hotsos profiler
PeopleSoft Instrumentation © www.go-faster.co.uk 13
Nørgaard’s Law
• Every 18 months one of your vendors will add another tier or layer of software somewhere in your stack.
• Below the database– SAN, Cache, Raid Controller
• Above the database– Application Server, Web Server, Java, E-WAN (Ever
Wider Area Network), Encryption, Browser, Javascript

PeopleSoft Instrumentation © www.go-faster.co.uk 14
You probably don’t need event 10046!
• SQL*Net Message from Client– Idle Event?– Database is Idle, but is the user idle?– Or is something else active in the technology
stack (so the user is still waiting)?• This event cannot distinguish between these
conditions.
You probably won’t get all you need from event 10046!
PeopleSoft Instrumentation © www.go-faster.co.uk 15
Timed Event Information
• Oracle timed events tell us about the database.
• We need similar information for every element in the technology chain.
• PeopleSoft realised this and instrumented their entire technology stack.– And they got it right!
PeopleSoft Instrumentation © www.go-faster.co.uk 16
PeopleTools Performance Utilities
• New instrumentation in PeopleTools 8.4– Query Statistics
• 8.44, usable from 8.45
– PeopleSoft Ping• 8.42, back-ported to 8.19
– Performance Monitor• 8.44

PeopleSoft Instrumentation © www.go-faster.co.uk 17
Performance Monitor
• PeopleTools 8.44 – Fully instrumented– Including a timed-event interface– Event 10046 for the application– Useful PeopleBook– Additional analytics in PT8.45

PeopleSoft Instrumentation © www.go-faster.co.uk 18
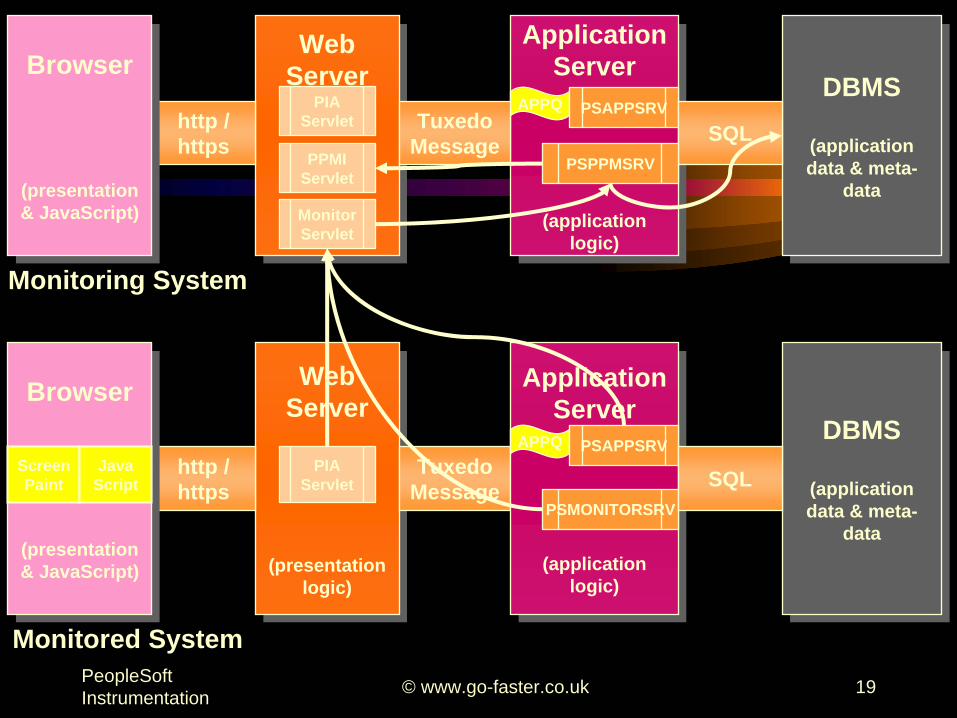
Performance Monitor Architecture
• Based upon existing PeopleSoft technology• Monitored System
– Send information to servlet in monitoring system
• Monitoring System– Monitor servlet writes results to database via
PSPPMSRV process in application server • Ideally PeopleTools only system database
• This minimises measurement intrusion effect
PeopleSoft Instrumentation © www.go-faster.co.uk 19
WebServerWeb
ServerApplication
Server
(application logic)
Application Server
(application logic)
APPQ PSAPPSRV DBMS
(application data & meta-
data
DBMS
(application data & meta-
data
SQLTuxedo Message
http / https
Browser
(presentation & JavaScript)
Browser
(presentation & JavaScript)
Monitoring System
PIAServlet
PSPPMSRV
Monitored System
Web Server
(presentation logic)
Web Server
(presentation logic)
PIAServlet
DBMS
(application data & meta-
data
DBMS
(application data & meta-
data
Tuxedo Message
http / https
Browser
(presentation & JavaScript)
Browser
(presentation & JavaScript)
ScreenPaint
JavaScript
Application Server
(application logic)
Application Server
(application logic)
APPQ PSAPPSRV
PSMONITORSRV
SQL
PPMIServlet
MonitorServlet

PeopleSoft Instrumentation © www.go-faster.co.uk 20
Performance Monitor Architecture
• Instrumentation in – Application Server processes
• PSMONITORSRV collects host resource statistics– Memory – CPU
– Process Scheduler– PIA servlet
PeopleSoft Instrumentation © www.go-faster.co.uk 21
Performance Monitor Metrics
• Transactions– User activities in PIA that cause communications with
application server– Sampled– Enabled to form a trace
• Events– Periodic samples– Usually initiated by monitoring agents– eg. CPU, Tuxedo counters
PeopleSoft Instrumentation © www.go-faster.co.uk 22
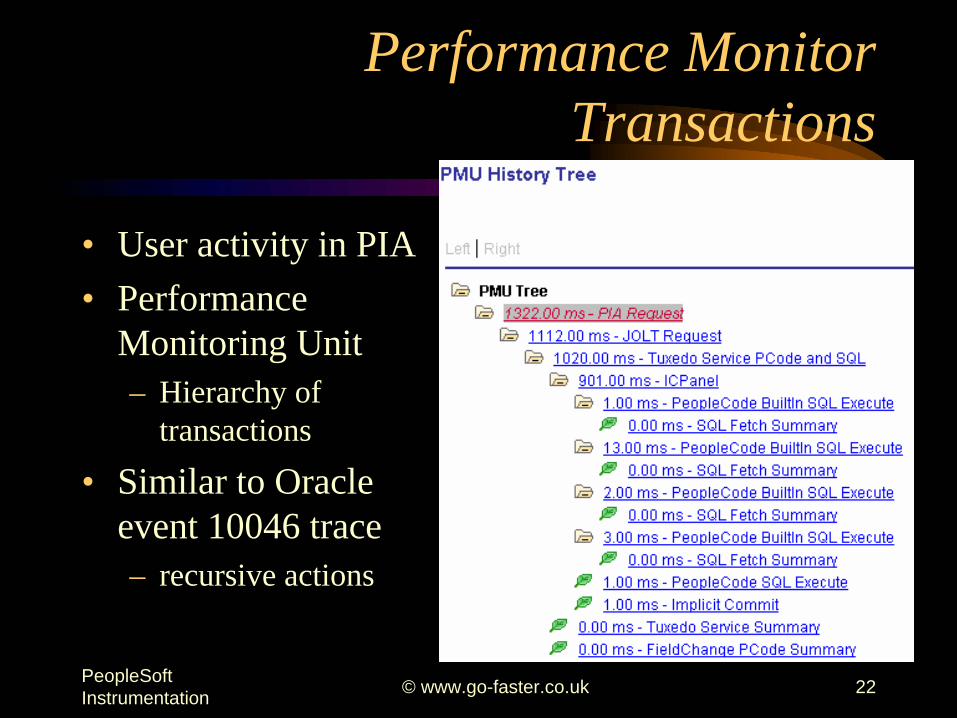
Performance Monitor Transactions
• User activity in PIA• Performance
Monitoring Unit– Hierarchy of
transactions
• Similar to Oracle event 10046 trace– recursive actions

PeopleSoft Instrumentation © www.go-faster.co.uk 23
Transactions
• Stored to PSPMTRANSCURR table– As PMUs are closed moved to
PSPMTRANSHIST– Later deleted or archived to
PSPMTRANSARCH
• ERD downloadable from Customer Connection

PeopleSoft Instrumentation © www.go-faster.co.uk 24
ERD of TransactionPSTRANSHIST
(C)
PSPMSYSDEFN(B)
PSPMAGENT(A)
PSPMCONTEXTDEFN(C1)
PSPMMETRICDEFN(M1)
PSPMCONTEXTDEFN(C2)
PSPMCONTEXTDEFN(C3)
PSPMMETRICDEFN(M2)
PSPMMETRICDEFN(M3)
PSPMMETRICDEFN(M4)
PSPMMETRICDEFN(M5)
PSPMMETRICDEFN(M6)
PSPMMETRICDEFN(M7)
PM_CONTEXTID_n
(n=1-3)
PM_SYSTEMID
PM_TRANS_DEFN_SET, PM_TRANS_DEFN_ID
PM_AGENTID
PM_METRICIDn
(n=1-7)
search criteria
PSPMTRANSDEFN(E)
PeopleSoft Instrumentation © www.go-faster.co.uk 25
Metrics
• Metric IDs specified on transaction definition PSPMTRANSDEFN– Metrics Types defined on PSPMMETRICDEFN
• Type 1: Counters (including timers)– Metric 4: Total Servlet Request time (ms)
• Type 2: Gauges– Metric 102: %CPU Used
• Type 3: Numeric Identifier– Metric 20: HTTP response code
• Type 4: String Identifier– Metric 27: File Name
PeopleSoft Instrumentation © www.go-faster.co.uk 26
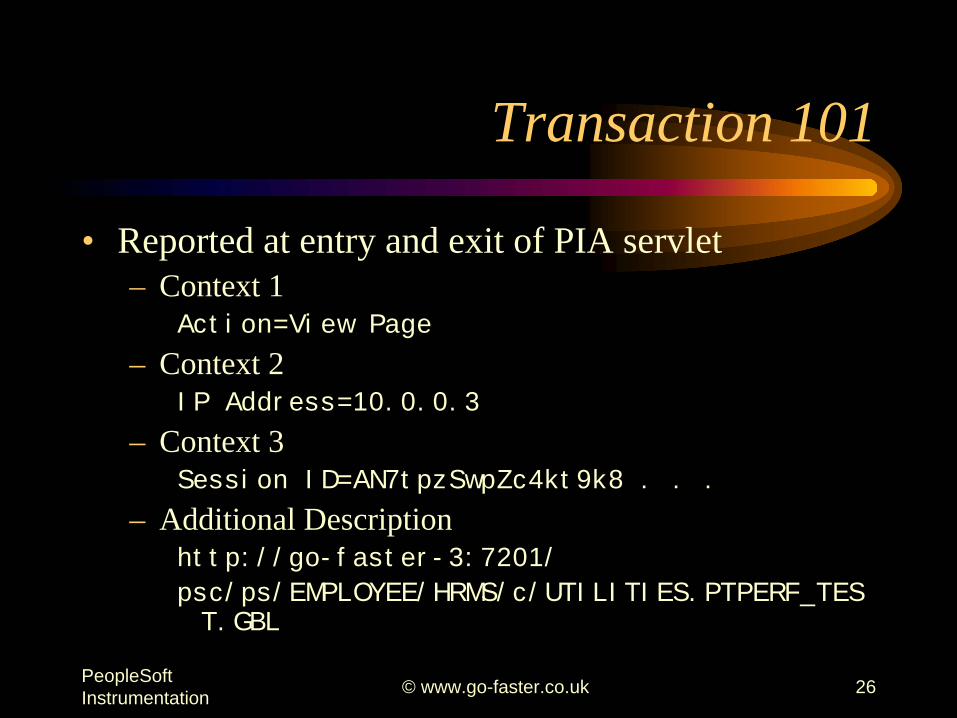
Transaction 101
• Reported at entry and exit of PIA servlet – Context 1
Action=View Page
– Context 2IP Address=10.0.0.3
– Context 3Session ID=AN7tpzSwpZc4kt9k8 . . .
– Additional Descriptionhttp://go-faster-3:7201/
psc/ps/EMPLOYEE/HRMS/c/UTILITIES.PTPERF_TES T.GBL

PeopleSoft Instrumentation © www.go-faster.co.uk 27
Transaction 101
• 4 metrics– Metric 19: Response Size (bytes)
=17613 – Metric 20: Response Code
=200– Metric 22: Static Content Count
=0– Metric 23: Is this a Pagelet?
=0

PeopleSoft Instrumentation © www.go-faster.co.uk 28
Transaction Query ResultsPM_TOP_INST_ID PM_INSTANCE_ID PM_PARENT_INST_ID DBNAME
PM_HOST_PORT
PM_DOMAIN_NAME PM_AGENT_TYPE
PM_INSTANCE PM_AGENT_STRT_DTTM PM_MON_STRT_DTTM
OPRID PM_PERF_TRACE PM_PROCESS_ID
PM_TRANS_DEFN_ID DESCR60
'CONTEXT1:'||C.PM_CONTEXTID_1||'-'||C1.PM_CONTEXT_LABEL||'='||C.PM_CONTEXT_VALUE …
PM_TRANS_DURATION
'METRIC1:'||M1.PM_METRICLABEL||'='||C.PM_METRIC_VALUE1 …
PM_ADDTNL_DESCR
--------------------------------------------------------------------------------
824633721163 824633721163 0 HR88
go-faster-3:7201:7202
ps WEBSERVER
-1 16:12:07 14.06.2004 16:12:09 14.06.2004
PS PS: 2004-06-14 16:01:11 0
101 Reported at entry and exit of PIA servlet
Context1:3-Session ID=AN7tpzSwpZc4kt9k8QNaCcYUWWh9FaFt!1963244185!1087224685145
Context2:2-IP Address=10.0.0.3
Context3:1-Action=View Page
1322
Metric1:Response Size (bytes)=17613
Metric2:Response Code=200
Metric3:Static Content Count=0
Metric4:Is this a Pagelet?=0
Metric5:=0
Metric6:=0
Metric7:=
http://go-faster-3:7201/psc/ps/EMPLOYEE/HRMS/c/UTILITIES.PTPERF_TEST.GBL

PeopleSoft Instrumentation © www.go-faster.co.uk 29
Events
• Certain events are defined for which the monitor agents collect metrics– Regular cycle
• Host resources
– In response to user action• PeopleSoft Ping
– On an exception• Jolt Exception or Query Timeout
PeopleSoft Instrumentation © www.go-faster.co.uk 30
Events
• Do not have an explicit context– Collecting agent provide context
• Stored in PSPMEVENTHIST– Later deleted or archived to PSPMEVETARCH
PeopleSoft Instrumentation © www.go-faster.co.uk 31
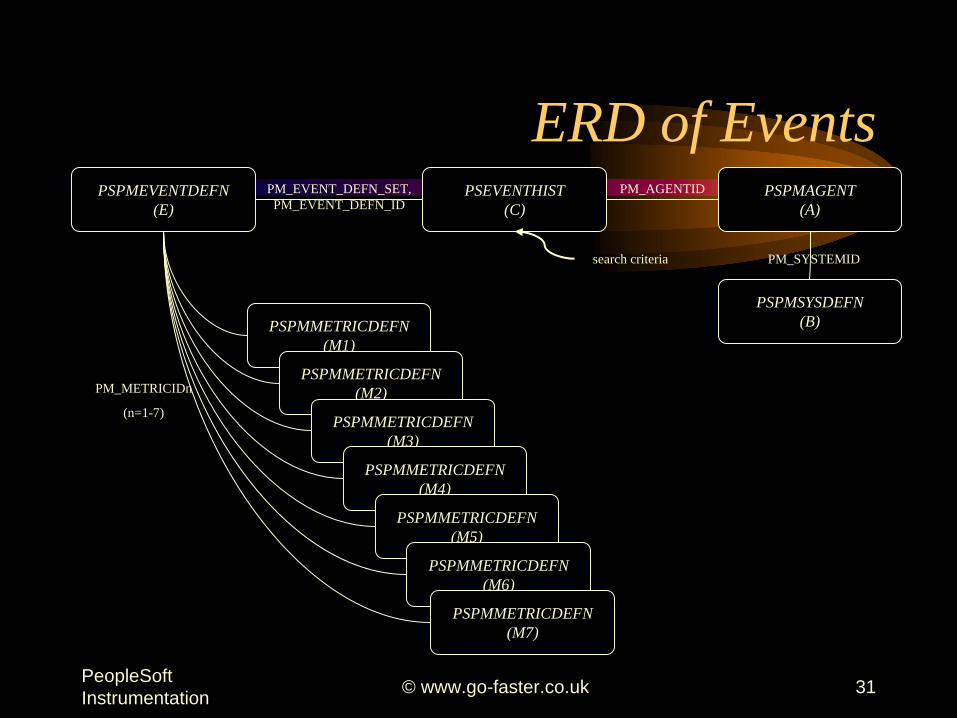
ERD of EventsPSEVENTHIST
(C)PSPMEVENTDEFN
(E)
PSPMSYSDEFN(B)
PSPMAGENT(A)
PSPMMETRICDEFN(M1)
PSPMMETRICDEFN(M2)
PSPMMETRICDEFN(M3)
PSPMMETRICDEFN(M4)
PSPMMETRICDEFN(M5)
PSPMMETRICDEFN(M6)
PSPMMETRICDEFN(M7)
PM_AGENTIDPM_EVENT_DEFN_SET, PM_EVENT_DEFN_ID
PM_SYSTEMIDsearch criteria
PM_METRICIDn
(n=1-7)

PeopleSoft Instrumentation © www.go-faster.co.uk 32
Event Query ResultsDBNAME PM_HOST_PORT
PM_AGENT_TYPE PM_DOMAIN_NAME
PM_INSTANCE PM_AGENT_DTTM PM_INSTANCE_ID
PM_EVENT_DEFN_ID DESCR60
'METRIC1:'||M1.PM_METRICLABEL||'='||C.PM_METRIC_VALUE1
'METRIC2:'||M2.PM_METRICLABEL||'='||C.PM_METRIC_VALUE2
'METRIC3:'||M3.PM_METRICLABEL||'='||C.PM_METRIC_VALUE3
'METRIC4:'||M4.PM_METRICLABEL||'='||C.PM_METRIC_VALUE4
'METRIC5:'||M5.PM_METRICLABEL||'='||C.PM_METRIC_VALUE5
'METRIC6:'||M6.PM_METRICLABEL||'='||C.PM_METRIC_VALUE6
'METRIC7:'||M7.PM_METRICLABEL||'='||C.PM_METRIC_VALUE7
PM_ADDTNL_DESCR
--------------------------------------------------------------------------------
HR88 go-faster-3:7201:7202
WEBSERVER ps
-1 16:12:08 14.06.2004 824633721166
600 PSPING metrics fowarded from browser
Metric1:Network Latency (ms)=435
Metric2:WebServer Latency (ms)=100
Metric3:AppServer Latency (ms)=561
Metric4:DB Latency (millisecs)=451
Metric5:=0
Metric6:=0
Metric7:IP Address=10.0.0.3
PS;AN7tpzSwpZc4kt9k8QNaCcYUWWh9FaFt!1963244185!1087224685145

PeopleSoft Instrumentation © www.go-faster.co.uk 33
Agent Filter Levels

PeopleSoft Instrumentation © www.go-faster.co.uk 34
Agent Filter Levels
• Controls amount of detail recorded in PMUs– 4- standard– 5 – verbose
• Includes SQL fetch operations • Performance penalty
– 6 - debug

PeopleSoft Instrumentation © www.go-faster.co.uk 35
Analytics: System Performance

PeopleSoft Instrumentation © www.go-faster.co.uk 36
Analytics: Top Components

PeopleSoft Instrumentation © www.go-faster.co.uk 37
Performance Trace
• Generates a group of PMUs for activity in a user session– Choose an ID to
identify records later

PeopleSoft Instrumentation © www.go-faster.co.uk 38
Performance Trace
PeopleSoft Instrumentation © www.go-faster.co.uk 39
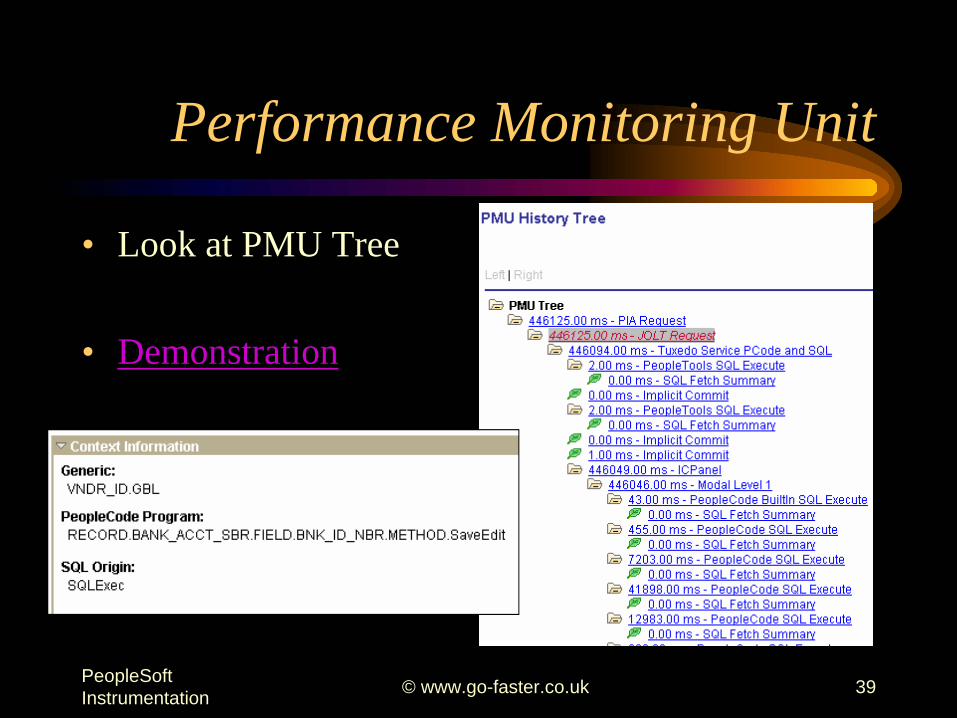
Performance Monitoring Unit
• Look at PMU Tree
• Demonstration

PeopleSoft Instrumentation © www.go-faster.co.uk 40
Summary
• Very impressive feature rich piece of code– It could also put me out of business!
• In house support tool– An end use could be enabled to collect a
performance trace

PeopleSoft Instrumentation © www.go-faster.co.uk 41
My Questions
• Will Fusion have a Performance Monitor?– I think it should
• Will it be separately licensed product?– PeopleSoft’s performance monitor isn’t

Your Questions?
PeopleSoft Instrumentation © www.go-faster.co.uk 43
PeopleSoft: A Properly Instrumented Application?
David KurtzGo-Faster Consultancy Ltd.
www.go-faster.co.uk