People´s Republic of China - · PDF fileMilitary firearms (Assault Rifles): ... (7.62...
22
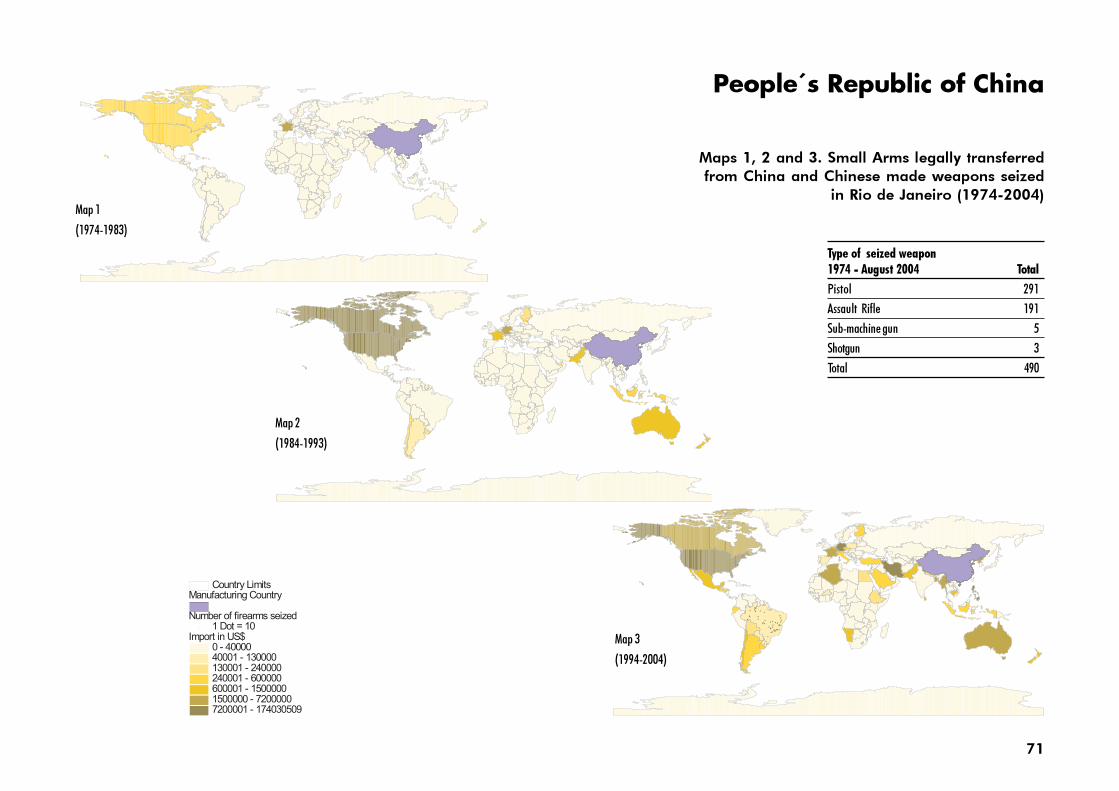
71 People´s Republic of China Type of seized weapon 1974 - August 2004 Total Pistol 291 Assault Rifle 191 Sub-machine gun 5 Shotgun 3 Total 490 Map 1 (1974-1983) Map 2 (1984-1993) Map 3 (1994-2004) Maps 1, 2 and 3. Small Arms legally transferred from China and Chinese made weapons seized in Rio de Janeiro (1974-2004)
Transcript of People´s Republic of China - · PDF fileMilitary firearms (Assault Rifles): ... (7.62...
71
People´s Republic of China
Type of seized weapon1974 - August 2004 Total
Pistol 291
Assault Rifle 191
Sub-machine gun 5
Shotgun 3
Total 490
Map 1
(1974-1983)
Map 2
(1984-1993)
Map 3
(1994-2004)
Maps 1, 2 and 3. Small Arms legally transferredfrom China and Chinese made weapons seized
in Rio de Janeiro (1974-2004)
72
China is one of the world’s largest producers of small arms and light weapons. As noted by Amnesty International and others it is oneof the main suppliers to some conflict zones in Africa. During the period 1994-2004 the South American market became much moreimportant to Chinese exporters. That period was also marked by a dramatic increase in the number of seized Chinese origin weapons.
Pistols:
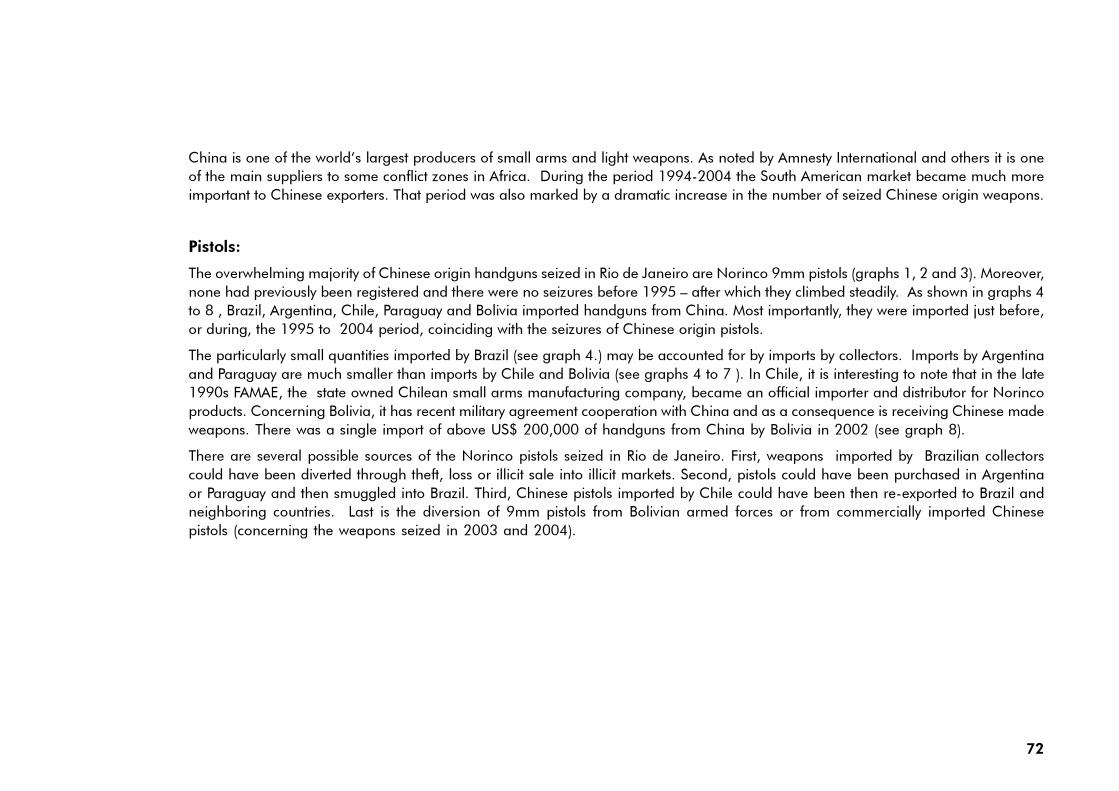
The overwhelming majority of Chinese origin handguns seized in Rio de Janeiro are Norinco 9mm pistols (graphs 1, 2 and 3). Moreover,none had previously been registered and there were no seizures before 1995 – after which they climbed steadily. As shown in graphs 4to 8 , Brazil, Argentina, Chile, Paraguay and Bolivia imported handguns from China. Most importantly, they were imported just before,or during, the 1995 to 2004 period, coinciding with the seizures of Chinese origin pistols.
The particularly small quantities imported by Brazil (see graph 4.) may be accounted for by imports by collectors. Imports by Argentinaand Paraguay are much smaller than imports by Chile and Bolivia (see graphs 4 to 7 ). In Chile, it is interesting to note that in the late1990s FAMAE, the state owned Chilean small arms manufacturing company, became an official importer and distributor for Norincoproducts. Concerning Bolivia, it has recent military agreement cooperation with China and as a consequence is receiving Chinese madeweapons. There was a single import of above US$ 200,000 of handguns from China by Bolivia in 2002 (see graph 8).
There are several possible sources of the Norinco pistols seized in Rio de Janeiro. First, weapons imported by Brazilian collectorscould have been diverted through theft, loss or illicit sale into illicit markets. Second, pistols could have been purchased in Argentinaor Paraguay and then smuggled into Brazil. Third, Chinese pistols imported by Chile could have been then re-exported to Brazil andneighboring countries. Last is the diversion of 9mm pistols from Bolivian armed forces or from commercially imported Chinesepistols (concerning the weapons seized in 2003 and 2004).
73
Graph 1. China: pistol registered (yes/no) Graph 2. Pistol by maker Graph 3. Pistol by caliber
Graph 4. Brazil: Handguns from China Graph 5. Argentina: Handguns from China Graph 6. Chile: Handguns from China
Graph 7. Paraguay: Handguns from China Graph 8. Bolivia: handguns from China
Seized small arms graphs:
Legal transfers graphs:
74
Military firearms (Assault Rifles):
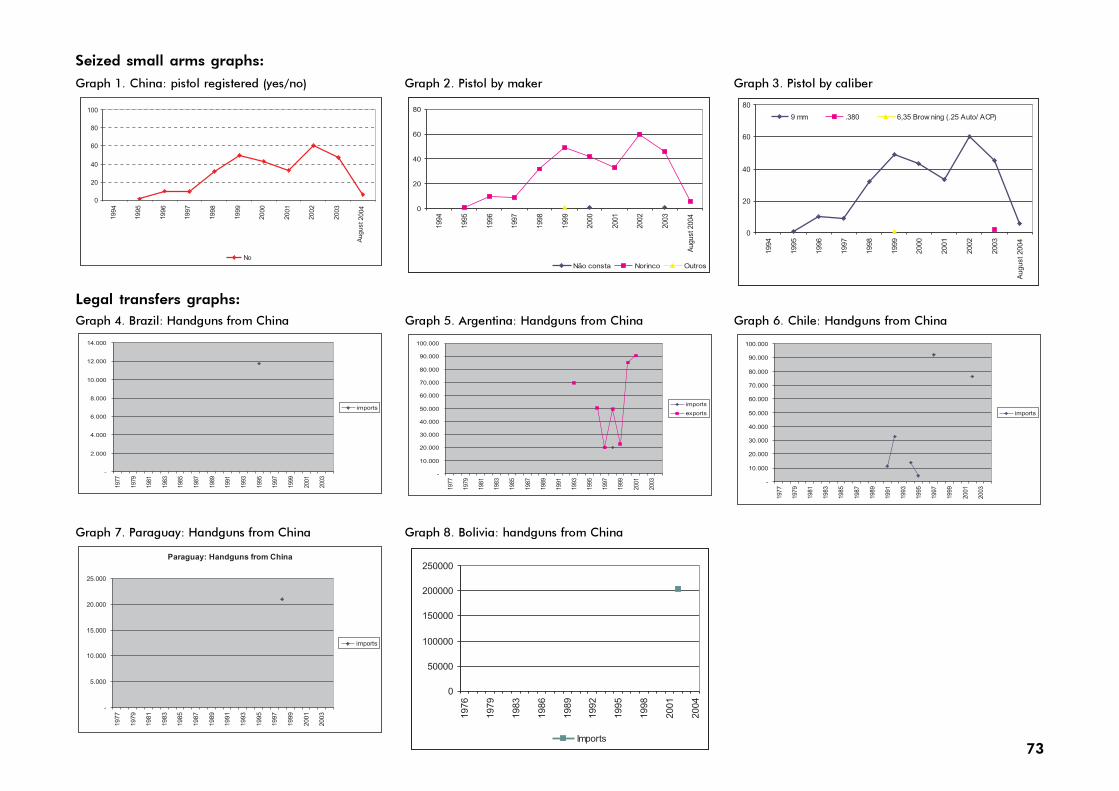
Much more concerning have been the Chinese origin assault rifles seized by the Rio de Janeiro police. Large numbers of theseweapons have been seized and most are Norinco manufactured (7.62 mm caliber) variants of the Kalashnikov assault rifle. Theseizures of Chinese origin assault rifles started in 1994 and peaked in the mid-late 1990s. Neither the Brazilian armed forces, nor thepolice, have been issued with Chinese origin assault rifles – so we must look elsewhere for the source of the weapons.
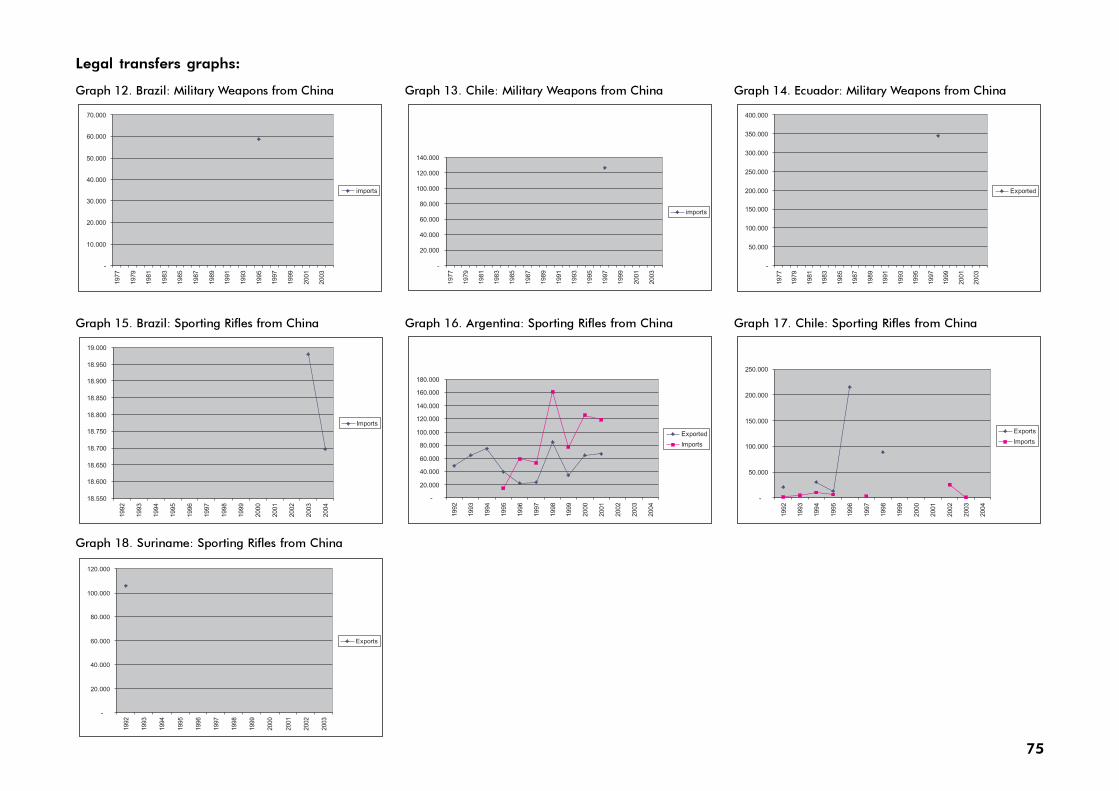
The Type-56 is a military assault rifle, and there have been relatively large imports of military weapons from China by Brazil, Chileand Ecuador (see graphs 12, 13, 14). Since Brazilian armed forces or police do not use Chinese made weapons, imports by Brazilare most likely by collectors which up to the year 2000 could legally purchase ‘civilianized’ semi-automatic versions of assault rifles.
The MAK-90 is a variant of the Kalashnikov which has been modified so it can be classified as a sporting rifle and marketed to civilians(in particular they are purchased by collectors).Such civilianized versions of military rifles are controversial because it is possible tore-modify them to military specifications (so they can fire fully automatic bursts). Imports of sporting rifles from China have beenmade by Brazil, Argentina, Chile, Paraguay, Uruguay and Suriname (see graphs 15 to 18). Of particular interest are the imports byParaguay and Suriname because both countries have previously been identified as diversion points.62 According to OCIT Trade data(see section 2 and 3) Paraguay imported 600 hundred units of Chinese rifles in 1998.
62 The firearms were recorded as being ’AK-47’, the first version of the Kalashnikov. However it is important to note that this description may also cover later variants of the AK-47, and so in the text the term‘Kalashnikov’ is used.
Graph 9. China: assault rifle registered (yes/no) Graph 10. Assault rifle by maker Graph 11. Assault rifle by caliber
Seized small arms graphs:
75
Graph 12. Brazil: Military Weapons from China Graph 13. Chile: Military Weapons from China Graph 14. Ecuador: Military Weapons from China
Graph 15. Brazil: Sporting Rifles from China Graph 16. Argentina: Sporting Rifles from China Graph 17. Chile: Sporting Rifles from China
Graph 18. Suriname: Sporting Rifles from China
Legal transfers graphs:
76
Israel
Type of seized weapon1974 - August 2004 Total
Pistol 174
Sub-machine gun 105
Assault Rifle 1
Carbine 1
NO DATA 1
Total 282
Map 1
(1974-1983)
Map 2
(1984-1993)
Map 3
(1994-2004)
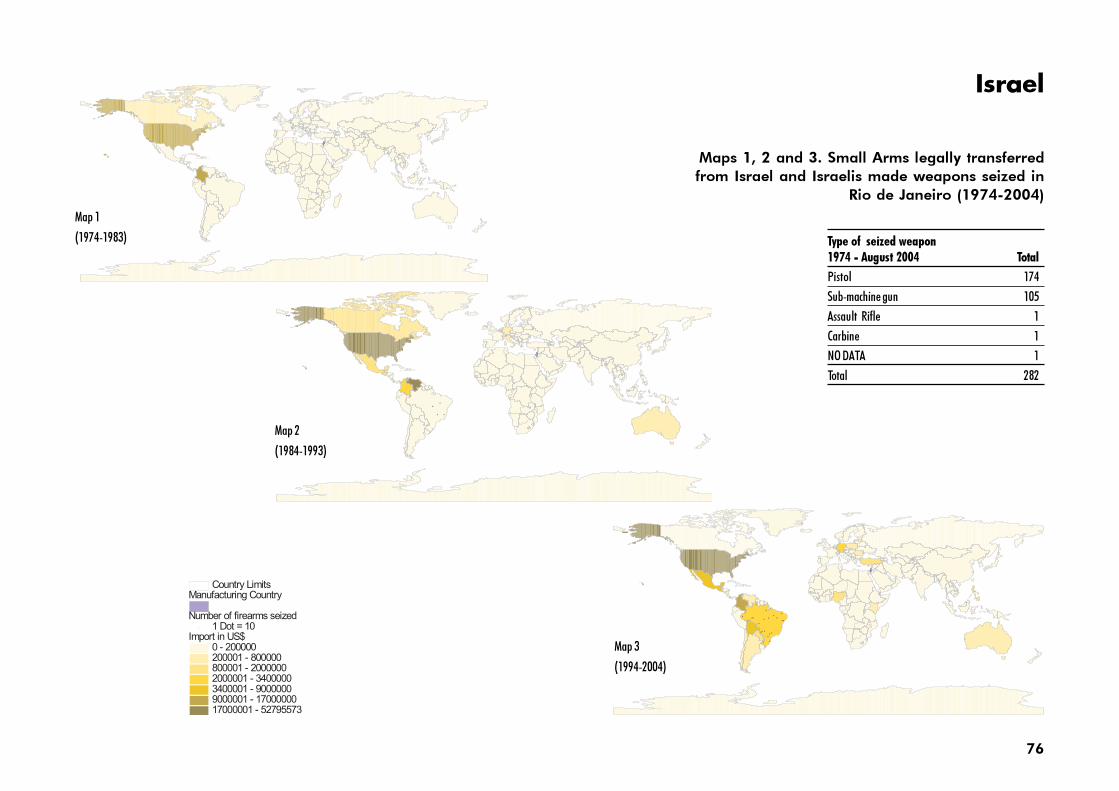
Maps 1, 2 and 3. Small Arms legally transferredfrom Israel and Israelis made weapons seized in
Rio de Janeiro (1974-2004)
77
Israel has developed several types of small arms with the most famous being the Uzi sub-machine gun. It has also developedsignificant markets in the Americas. The USA is the most important customer but in the decade 1994-2004 several countries in SouthAmerica, including Brazil, have imported significant quantities of Israeli origin weapons. This decade also experienced a rise in thenumber of seizures of Israeli origin weapons by the Rio de Janeiro police.
Pistols:
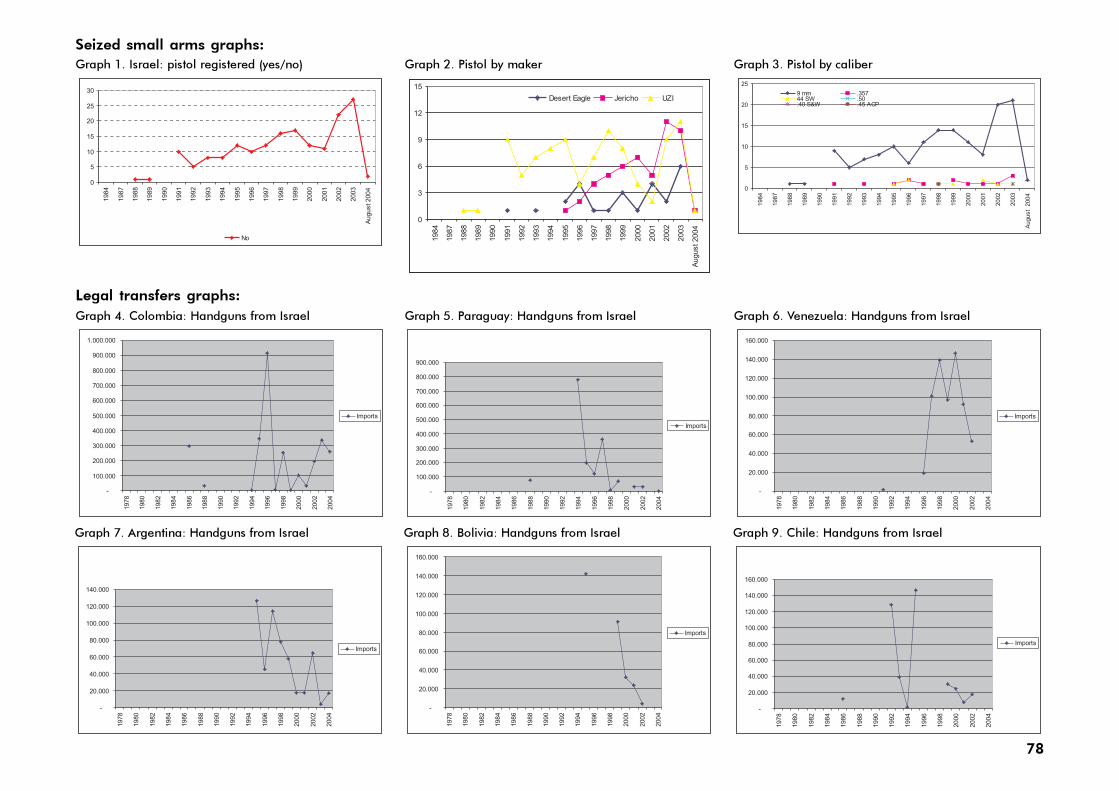
Seizures of Israeli origin pistols, primarily Jericho (9mm caliber), semiautomatic Mini-Uzi (9mm) and Desert Eagle (.357 caliber)models manufactured by Israeli Military Industries increased steadily after 1993 (Graphs 1 to 3). However, there is no record of anyimports by Brazil of handguns from Israel during the period covered by this report. It is therefore likely that the pistols were initiallyimported by Brazil’s neighbors. Six South American countries did import handguns from Brazil during, or immediately before, theperiod in which Israeli pistols started to be seized in Rio de Janeiro – they are Argentina (graph 7), Bolivia (graph 8), Chile (graph 9),Colombia (graph 4), Paraguay (Graph 5) and Venezuela (Graph 6).
A very likely source is Paraguay. In 1994 it suddenly imported some USD 800 000 worth of pistols from Israel, after which seizures inBrazil increased. Field research made in 2000 also found that gun shops in the border cities of Pedro Juan Caballero and Asunciónstocked large numbers of Jericho and Desert Eagle pistols. At the time, there were few restrictions placed on Brazilians purchasing pistolsin Paraguay. Paraguay reduced imports of handguns as a political decision since 1999 in order to combat small arms trafficking. Inaddition to Paraguay, it is also important to note other countries could also have acted as diversion points. In particular, Argentina,Venezuela and Colombia, (see graphs 7, 6 and 4) also imported large quantities of Israeli origin handguns and could have been usedas replacement sources after arms stopped being exported to Paraguay.
78
Graph 1. Israel: pistol registered (yes/no) Graph 2. Pistol by maker Graph 3. Pistol by caliber
Graph 4. Colombia: Handguns from Israel Graph 5. Paraguay: Handguns from Israel Graph 6. Venezuela: Handguns from Israel
Graph 7. Argentina: Handguns from Israel Graph 8. Bolivia: Handguns from Israel Graph 9. Chile: Handguns from Israel
Seized small arms graphs:
Legal transfers graphs:
79
Military Firearms:
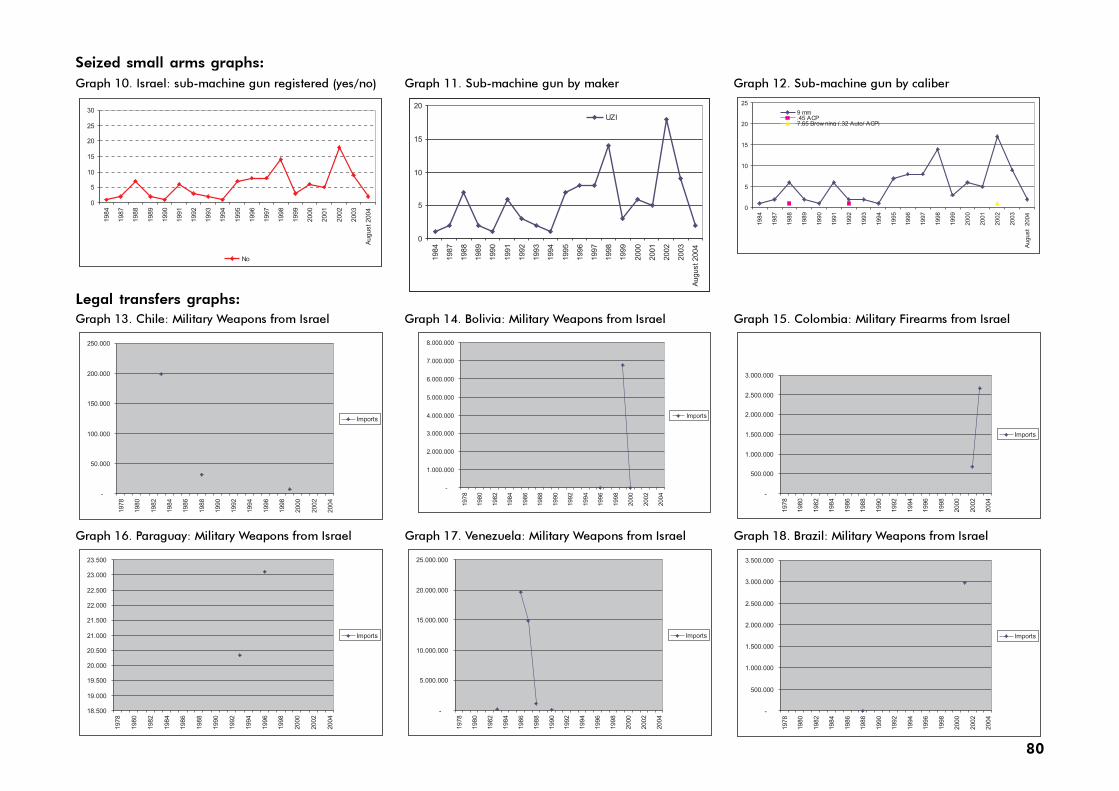
Since 1984 there have been consistent seizures of UZI sub-machine guns (9mm), none of which were previously registered with theDFAE (see graphs 10, 11, 12). UZIs are used by the military forces of Brazil and many of its neighbors: Bolivia; Chile ; Colombia;Ecuador; Paraguay; Peru, Suriname; and Venezuela. All of these countries have problems concerning the diversion to criminalmarkets of weapons in military and police stockpiles (and especially of surplus stocks). The UZI sub-machine guns seized in Rio couldhave originated from the leakages military stockpiles in Brazil or any of the other countries. Brazil had particularly high imports ofIsraeli military weapons in 2001, right before the “high” in seizures of UZI sub-machine guns in 2002 (see graph 18).
During the period in which Uzis were seized in Rio de Janeiro, Bolivia, Chile, Colombia and Venezuela also had large imports ofIsraeli military weapons (see graphs 13 to 17 ). However, other sources reveal that the import by Bolivia in 2000 concerns theacquisition of Galil rifles for its armed forces, so that trade is unlikely to be a source of UZIs. The same could be said about importsby Colombia in 1993, which is the year that Colombia adopted the Galil rifle as the min assault rifle for its military. Instead, otherlikely candidates for diversion points are imports of military weapons from Israel by Colombia from 1981 to 1986, and imports byVenezuela in 1986 .
80
Graph 17. Venezuela: Military Weapons from Israel
Graph 10. Israel: sub-machine gun registered (yes/no) Graph 11. Sub-machine gun by maker Graph 12. Sub-machine gun by caliber
Graph 13. Chile: Military Weapons from Israel Graph 14. Bolivia: Military Weapons from Israel Graph 15. Colombia: Military Firearms from Israel
Graph 16. Paraguay: Military Weapons from Israel Graph 18. Brazil: Military Weapons from Israel
Seized small arms graphs:
Legal transfers graphs:
81
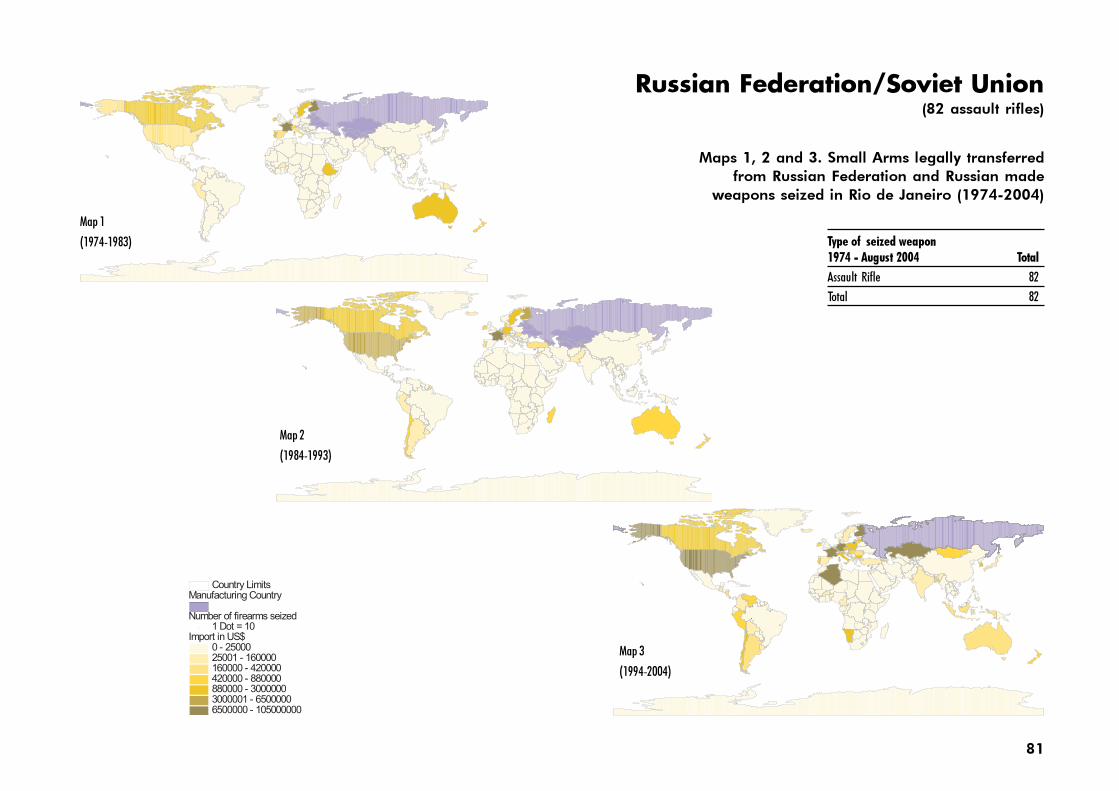
Russian Federation/Soviet Union(82 assault rifles)
Type of seized weapon1974 - August 2004 Total
Assault Rifle 82
Total 82
Map 1
(1974-1983)
Map 2
(1984-1993)
Map 3
(1994-2004)
Maps 1, 2 and 3. Small Arms legally transferredfrom Russian Federation and Russian made
weapons seized in Rio de Janeiro (1974-2004)
82
The Russian Federation (and Soviet Union) is most famous for producing the Kalashnikov assault rifle. This weapon was first producedin 1947, and has subsequently been produced in many variants in Russian and in other countries.
In addition to the Kalashnikov, Russia also produces a wide variety of small arms for military and civilian owners. In the period 1994-2004 important markets were located in Europe, North and South America, Africa and in Asia. Despite the ubiquity of Russian originsmall arms across the world comparatively few of them have been seized in Rio de Janeiro.
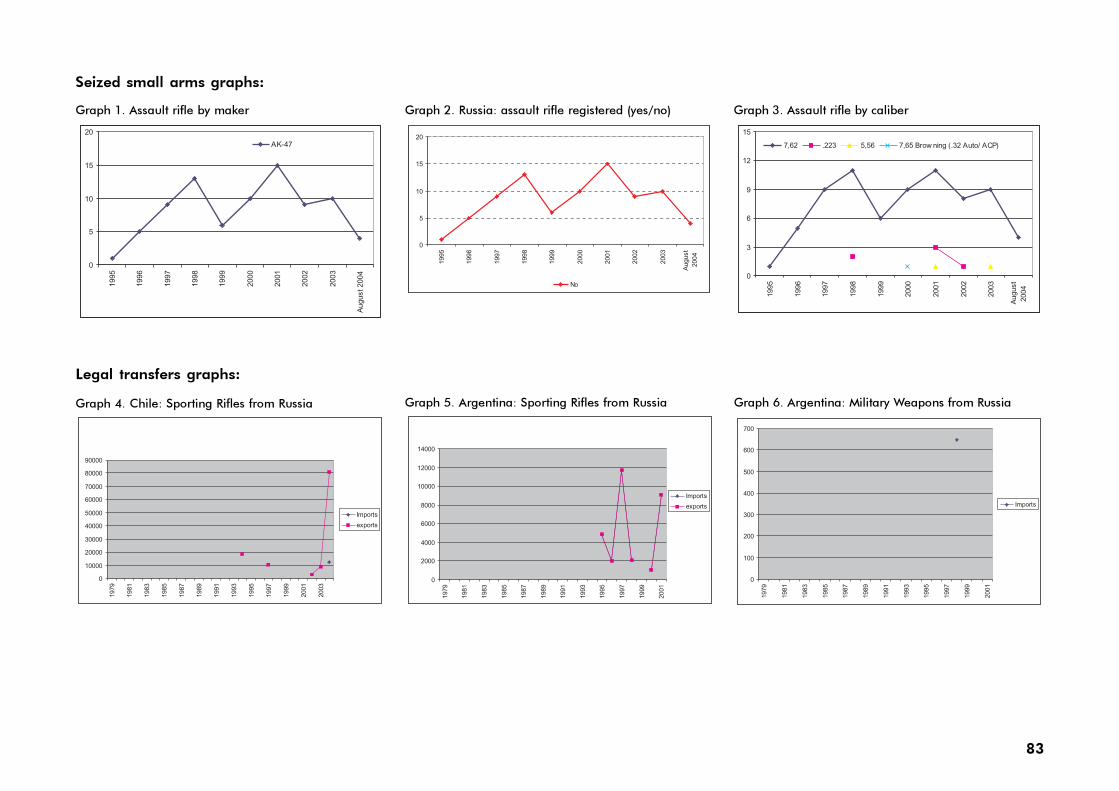
Between 1995 and 2004, there were yearly seizures of Russian origin Kalashnikov assault rifles – none of which had previously beenregistered by the DFAE. While the numbers seized are comparatively small, the Kalashnikov is a very powerful military weapon whichhas been used in wars across the world. Its use and possession by criminal organizations is a matter of great concern (Graphs 1 to 3).
Before the Venezuelan purchase of 100,000 AK-103 rifles from Russia in 2005 (which is not considered in this report because it wasmade after the period of study), the only two South American countries that reportedly had AK assault rifles in their military inventorieswere Peru and Suriname. Peru procured Russian made Kalashnikov rifles in the 1970s, however these sales however were not reportedby either country in official trade statistics. The only country reporting the purchase of Russian military firearms is Argentina, which is avery small import of 625 US$ (probably an individual purchase by a collector). Leaving aside the possibility of diversion from theremnants of the Cold War Central American conflicts (such as El Salvador, Honduras and Nicaragua), within South America thepossible sources could be the diversion of stockpiles in Peru or Suriname.
It is also possible that the Kalashnikovs seized in Brazil were originally ‘civilianized’ versions of the assault rifle. As with other such‘civilian’ versions of military firearms, in many cases it is not difficult to re-convert them back to military specifications. Theseweapons would therefore be recorded as sporting rifles in trade statistics. There were imports by Argentina and Uruguay of Russiansporting rifles in the period 1995 to 1999 – before and during the period when the Kalashnikovs were seized in Rio de Janeiro (seegraphs 4 to 6 ). It is therefore possible that the transfers of these weapons to the three neighbors of Brazil could have included ‘civilian’versions of the Kalashnikov which then made their way to criminal organizations in Brazil.
83
Graph 6. Argentina: Military Weapons from Russia
Graph 1. Assault rifle by maker Graph 2. Russia: assault rifle registered (yes/no) Graph 3. Assault rifle by caliber
Graph 4. Chile: Sporting Rifles from Russia Graph 5. Argentina: Sporting Rifles from Russia
Seized small arms graphs:
Legal transfers graphs:
84
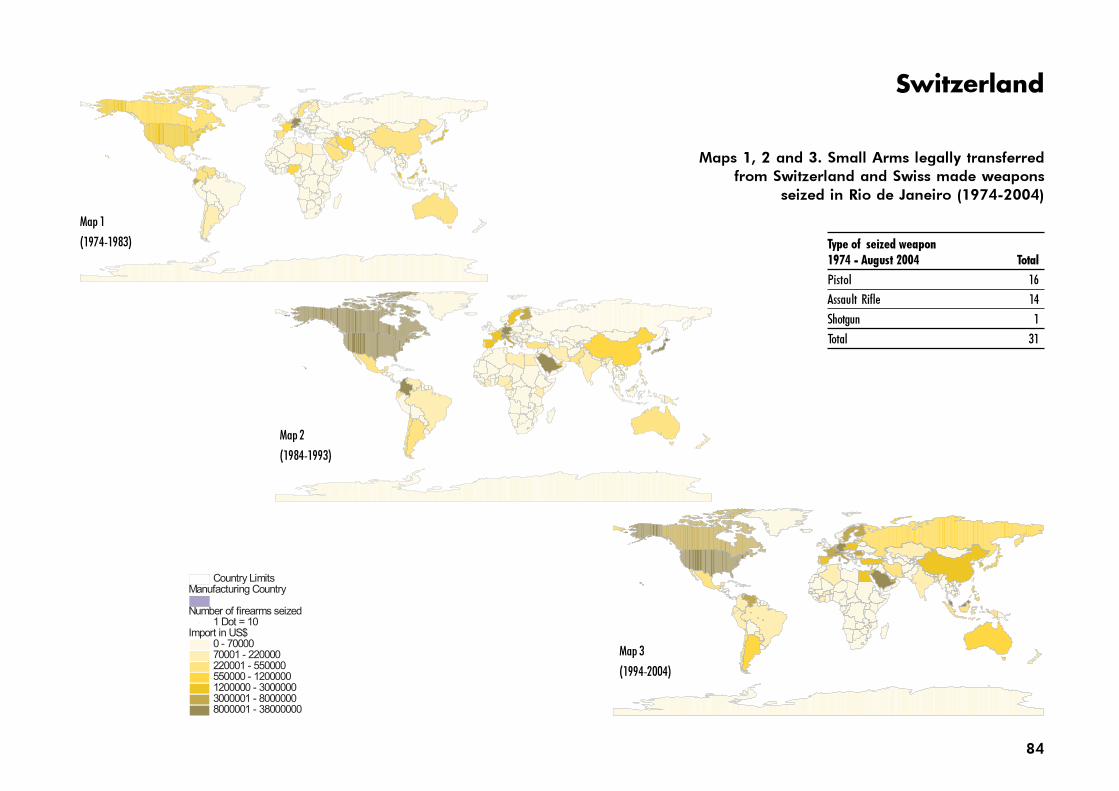
Switzerland
Type of seized weapon1974 - August 2004 Total
Pistol 16
Assault Rifle 14
Shotgun 1
Total 31
Map 1
(1974-1983)
Map 2
(1984-1993)
Map 3
(1994-2004)
Maps 1, 2 and 3. Small Arms legally transferredfrom Switzerland and Swiss made weapons
seized in Rio de Janeiro (1974-2004)
85
Swiss small arms are sold to very many countries across the world, and have gained a reputation for quality of manufacture. Importantmarkets are found in North and South America, the Middle East, East Asia, and Western and Eastern Europe.
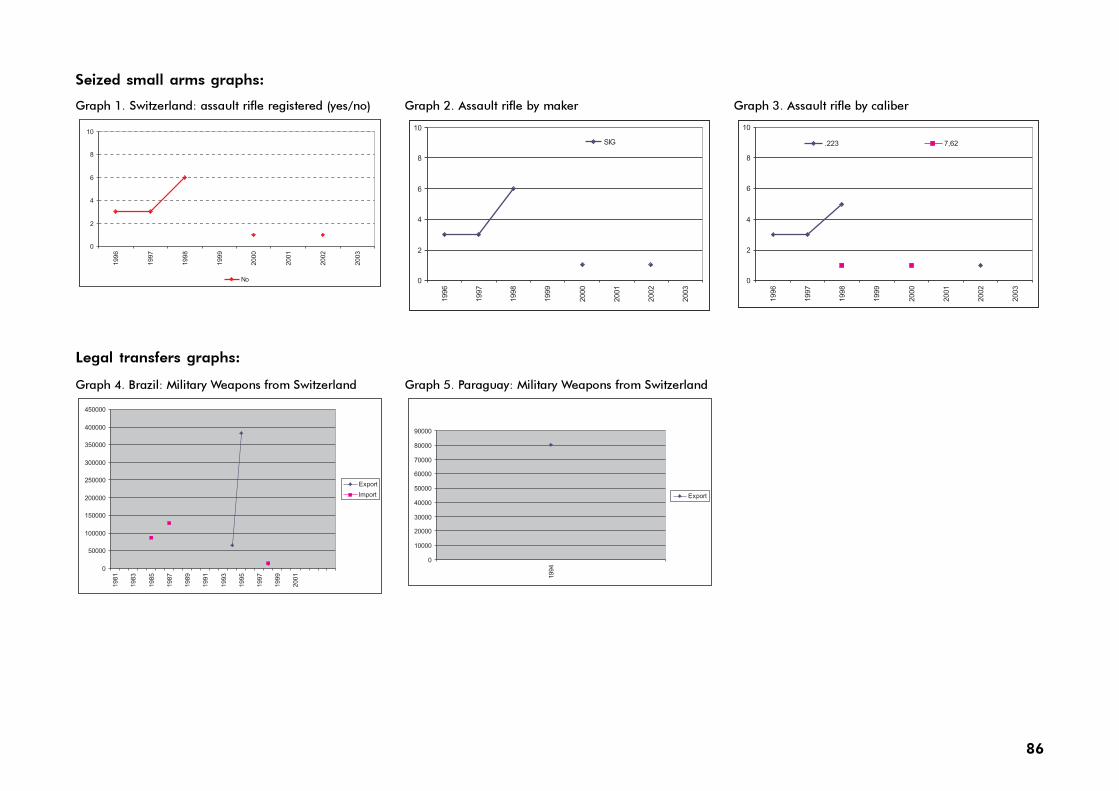
However, despite this wide dispersion, comparatively few Swiss origin firearms have been seized in Rio de Janeiro. During the period1996 to 2002 there were a small but consistent number of seizures of Swiss origin assault rifles. Some of these Swiss assault rifles wereobserved by one of the authors at the DFAE´s vault. The observations confirmed that most of the rifles are SIG SG 550/551 rifles(5.56x45mm or .223 caliber) which had been manufactured in Switzerland (and not under license elsewhere).
Military Firearms (assault rifles):
The most likely source for the SIG assault rifles were exports by Switzerland to Brazil in 1994 and 1995 (see graph 4 ) Interviews with anarms dealer have ascertained that the Brazilian Air Force imported SIG assault rifles during this period.63 These weapons may wellhave been diverted through theft, loss or corrupt sale by Air Force personnel. In addition, another possible source is diversion from ofmilitary weapons imported by Paraguay in 1993 (see graph5 ).
63 Interview with an arms importer, Rio de Janeiro, August 2004.
86
Graph 5. Paraguay: Military Weapons from Switzerland
Graph 1. Switzerland: assault rifle registered (yes/no) Graph 2. Assault rifle by maker Graph 3. Assault rifle by caliber
Graph 4. Brazil: Military Weapons from Switzerland
Seized small arms graphs:
Legal transfers graphs:
87
5. Conclusion:
This report outlines some of the possible means by which foreign made small arms and light weapons were diverted from legaltrade and ownership into illicit markets in Brazil and particularly in the State of Rio de Janeiro. It begins by conducting a pioneeringanalysis of the database of illegal weapons seized by the Rio de Janeiro police. The majority of the weapons seized as recorded inthat database were manufactured in Brazil. Many, however, were also produced abroad. Brazil’s strict imports restrictions on manytypes of small arms and light weapons have therefore made it possible to determine who are the most likely purchasers in Brazil (ininstances where the restrictions were relaxed) or identify the neighboring country to which the weapons were first exported before theweapons were diverted.
When licensing arms exports, governments should rigorously assess the risk that the weapons may be diverted into illicit ownership. Thisreport highlights numerous instances in which weapons transfers to Brazil’s neighbors have been identified as the most likely source ofthe firearms seized by the police in Rio de Janeiro.
- Many weapons, including sub-machine guns and assault rifles, were most likely diverted into criminal possession from stockpilesunder the control of the Brazilian government and from private ownership by collectors.
- Lax regulations in Paraguay in particular allowed that country to act as an open door for arms smugglers into illicit marketsin Brazil. For years, arms exports from the USA and Western Europe flowed into Paraguay and many were subsequently illicitlydiverted into Brazil. Thanks to unilateral initiatives and cooperation with Brazil, the problem of grey markets in Paraguay is nowbeginning to be contained. However, lack of adequate controls over gun shops, and the sale of weapons, in other neighboringcountries also facilitated the diversion of thousands of weapons.
- The importance of the pool of informal (that is unregistered) small arms in the possession of civilians as a source of domestic andforeign weapons for criminal and armed groups should not be under-estimated. Cheap, low quality revolvers produced and soldin Argentina during times of lax practices and regulations (before 1994) are still being smuggled to Paraguay and seized by thepolice in Rio de Janeiro. The surplus of non registered or poorly controlled small arms in civilian hands is as serious an issue asis the poorly controlled military weapons surplus. When controls are tightened in a given country, criminals look elsewhere forother potential sources. This report also recommends massive gun collection campaigns as a way of drying up the supply ofweapons for criminals. One such campaign was implemented by the Brazilian Government between July 2004 and October2005 that resulted in the hand over of approximately 460,000 weapons.
88
- The overwhelming majority of weapons seized by the Rio de Janeiro police had no previous records of ownership. Theseweapons were therefore either illicitly trafficked into Brazil from abroad, purchased and registered in other states andsubsequently illicitly brought into Rio de Janeiro, or were purchased by parties not required to register their weapons with thepolice (such as collectors, who, in Brazil, register their weapons with the Army).
- Weapons are diverted in Brazil or its neighbors. There is little or no evidence of weapons whose source was likely to be directlyfrom outside South America. This shows that, at least in the case of Brazil , global trafficking networks are legally transported tothe region and then diverted to illicit markets.
These findings naturally promote the following policy recommendations: Importing countries need to enact strict controls over the sale offirearms as well as measures to ensure that firearms are only sold to authorized parties that will own them responsibly. Furthermore, inorder to prevent diversion, governments need to insist upon strict control over official stockpiles (especially of surplus weapons); and overprivate holdings of weapons (especially by collectors). The centralization of information is extremely relevant at the domestic level andallows for international cooperation in tracing weapons and ammunition. Brazil federalized its registration procedures in 2003 and alsoestablished mandatory information exchange between the Army and the Federal Police (on-line and through confidentiality protocols).Information exchange between security agencies makes it possible to rapidly identify and curtail patterns of diversion of weapons held bygroups of users controlled by different government institutions.
Exporting countries need to thoroughly evaluate the risk of weapons diversion when considering issuing an export license. This shouldinclude inter alia: the national laws and regulations of the importing country – particularly those pertaining to the sale of weapons;control over official stockpiles; and the ability of a nation to implement its laws and policies. Most importantly, governments should notlook at an export license in isolation. Governments need to evaluate license applications in light of recent arms trade flowing in and out,of the prospective importer. This report indicates that such an analysis is possible.
89
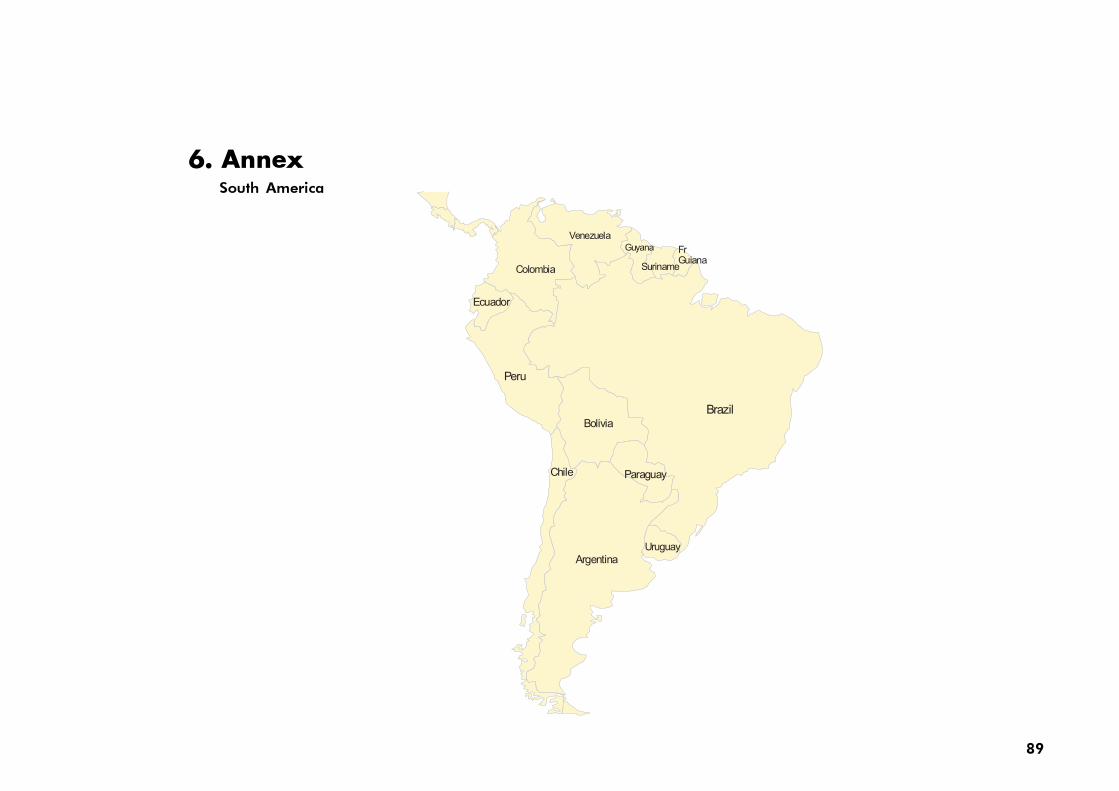
6. AnnexSouth America
90
1940 96,8 0,0978 0,0870 0,0836 0,0878 0,0931 0,0931 0,0931 0,0703 0,0978 0,0608 0,0847 0,1897 0,1623 0,2044
1941 114,1 0,1014 0,0928 0,0994 0,0876 0,0963 0,0963 0,0963 0,0640 0,1014 0,0583 0,0809 0,1830 0,1725 0,2149
1942 144,3 0,1089 0,1028 0,1186 0,0757 0,1053 0,1053 0,1053 0,0631 0,1089 0,0565 0,0661 0,1799 0,1772 0,2303
1943 180,3 0,1163 0,1122 0,1268 0,0682 0,1165 0,1165 0,1165 0,0675 0,1163 0,0554 0,0583 0,1736 0,1731 0,2278
1944 209,2 0,1209 0,1061 0,1157 0,0689 0,1251 0,1251 0,1251 0,0689 0,1209 0,0552 0,0562 0,1677 0,1675 0,2285
1945 221,4 0,1239 0,1041 0,1071 0,0843 0,1315 0,1316 0,1311 0,0691 0,1239 0,0569 0,0586 0,1559 0,1557 0,2286
1946 222,7 0,1328 0,1071 0,1052 0,1140 0,1387 0,1388 0,1385 0,0747 0,1328 0,0632 0,0684 0,1604 0,1595 0,2190
1947 233,2 0,1466 0,1162 0,1137 0,1177 0,1493 0,1493 0,1492 0,1022 0,1466 0,0834 0,0868 0,1839 0,1796 0,2128
1948 256,7 0,1606 0,1273 0,1052 0,1403 0,1631 0,1631 0,1630 0,1036 0,1606 0,1060 0,1118 0,2083 0,2009 0,2390
1949 271,3 0,1660 0,1246 0,1062 0,1367 0,1676 0,1676 0,1674 0,1110 0,1660 0,1033 0,1092 0,2222 0,2117 0,2501
1950 273,2 0,1635 0,1287 0,1059 0,1434 0,1656 0,1656 0,1650 0,1042 0,1635 0,1088 0,1162 0,2183 0,2107 0,2311
1951 320,3 0,1723 0,1279 0,1113 0,1523 0,1749 0,1750 0,1742 0,1198 0,1723 0,1045 0,1154 0,2306 0,2278 0,2429
1952 348,7 0,1792 0,1280 0,1162 0,1633 0,1816 0,1817 0,1810 0,1218 0,1792 0,1094 0,1222 0,2397 0,2380 0,2574
1953 372,6 0,1825 0,1368 0,1269 0,1661 0,1844 0,1845 0,1839 0,1291 0,1825 0,1157 0,1289 0,2426 0,2407 0,2698
1954 377,1 0,1846 0,1409 0,1290 0,1784 0,1868 0,1869 0,1866 0,1260 0,1846 0,1170 0,1360 0,2400 0,2383 0,2660
1955 395,9 0,1862 0,1455 0,1335 0,1709 0,1870 0,1870 0,1869 0,1292 0,1862 0,1204 0,1310 0,2473 0,2465 0,2603
1956 427,0 0,1911 0,1526 0,1425 0,1710 0,1894 0,1894 0,1893 0,1321 0,1911 0,1231 0,1317 0,2614 0,2611 0,2674
1957 450,9 0,1983 0,1601 0,1497 0,1780 0,1948 0,1949 0,1947 0,1434 0,1983 0,1277 0,1379 0,2783 0,2780 0,2822
1958 460,0 0,2043 0,1687 0,1562 0,1885 0,2006 0,2006 0,2005 0,1571 0,2043 0,1361 0,1491 0,2881 0,2878 0,2924
1959 490,2 0,2075 0,1746 0,1647 0,1875 0,2036 0,2037 0,2035 0,1667 0,2075 0,1423 0,1536 0,2928 0,2926 0,2956
1960 518,9 0,2100 0,1750 0,1603 0,1945 0,2073 0,2073 0,2071 0,1680 0,2100 0,1400 0,1570 0,2951 0,2945 0,3006
1961 529,9 0,2130 0,1795 0,1645 0,1981 0,2103 0,2104 0,2102 0,1656 0,2130 0,1464 0,1647 0,2968 0,2960 0,3038
1962 567,8 0,2154 0,1803 0,1657 0,1971 0,2123 0,2124 0,2122 0,1671 0,2154 0,1489 0,1665 0,2999 0,2988 0,3086
1963 599,2 0,2181 0,1873 0,1726 0,2034 0,2149 0,2149 0,2147 0,1727 0,2181 0,1533 0,1756 0,3068 0,3056 0,3158
1964 641,4 0,2207 0,1900 0,1739 0,2064 0,2178 0,2178 0,2176 0,1760 0,2207 0,1575 0,1832 0,3081 0,3050 0,3282
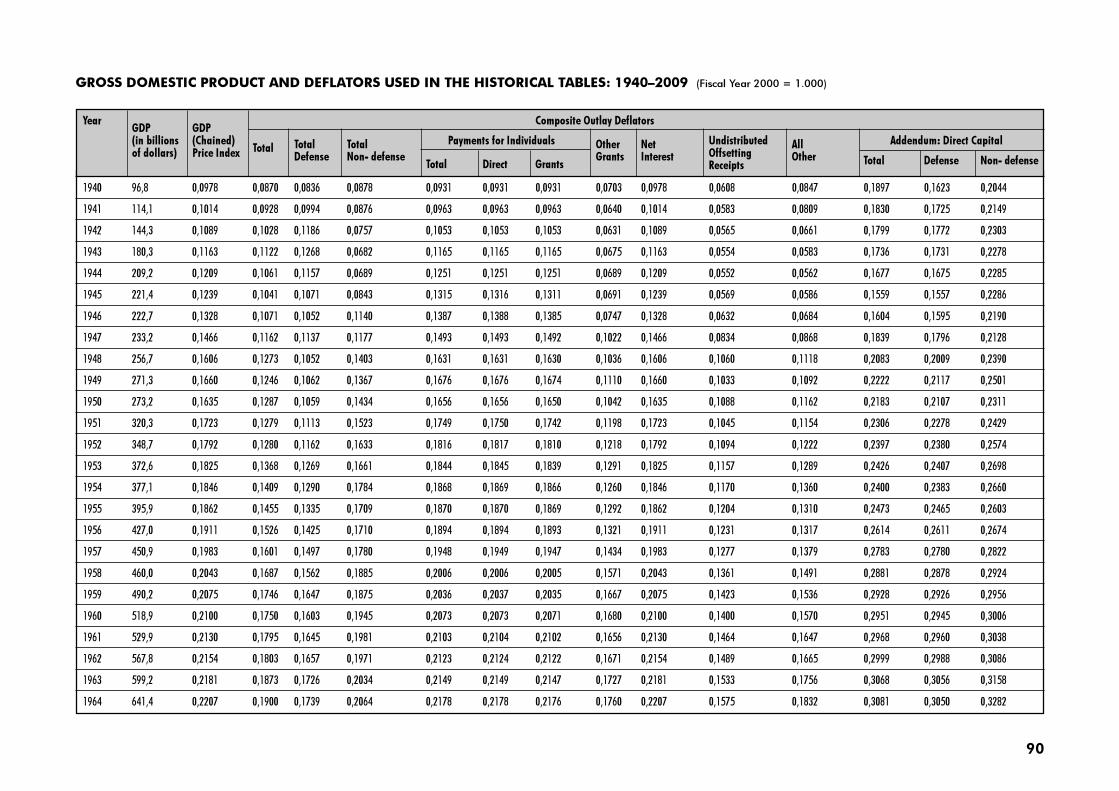
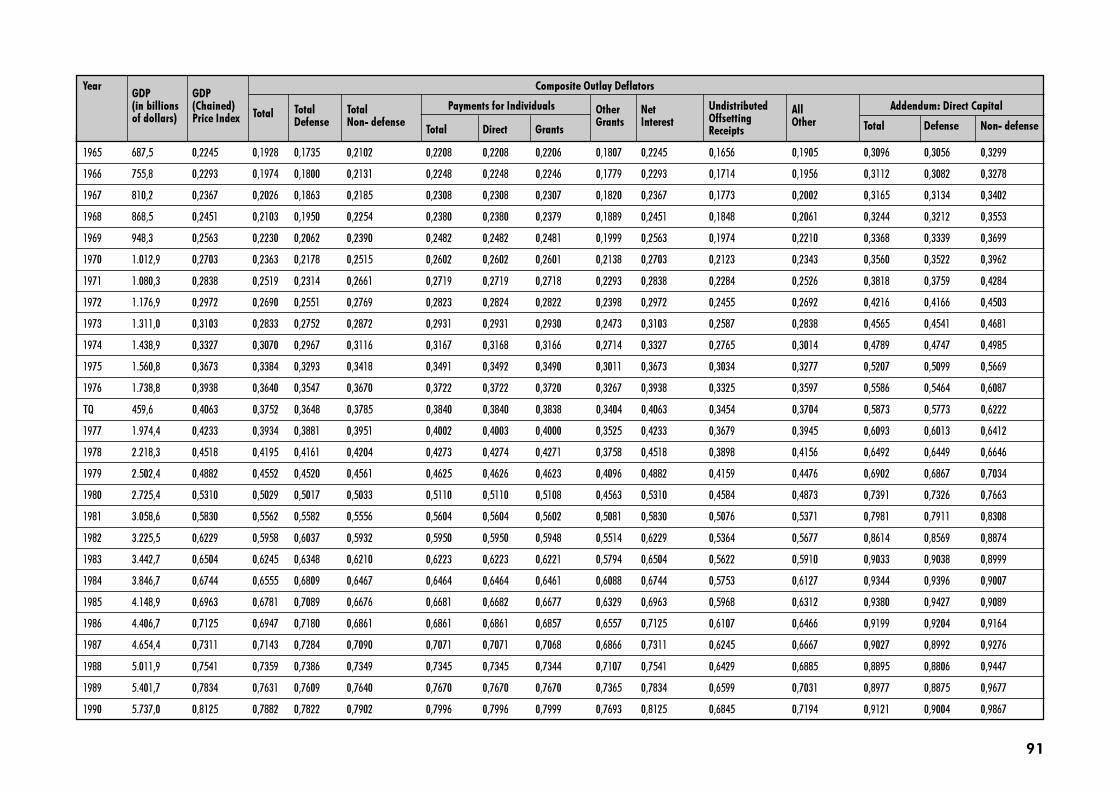
GROSS DOMESTIC PRODUCT AND DEFLATORS USED IN THE HISTORICAL TABLES: 1940–2009 (Fiscal Year 2000 = 1.000)
YearGDP GDP
Composite Outlay Deflators
(in billions (Chained)Total Total Total Payments for Individuals Other Net Undistributed All Addendum: Direct Capital
of dollars) Price Index Defense Non- defenseTotal Direct Grants
Grants Interest Offsetting Other Total Defense Non- defenseReceipts
91
1965 687,5 0,2245 0,1928 0,1735 0,2102 0,2208 0,2208 0,2206 0,1807 0,2245 0,1656 0,1905 0,3096 0,3056 0,3299
1966 755,8 0,2293 0,1974 0,1800 0,2131 0,2248 0,2248 0,2246 0,1779 0,2293 0,1714 0,1956 0,3112 0,3082 0,3278
1967 810,2 0,2367 0,2026 0,1863 0,2185 0,2308 0,2308 0,2307 0,1820 0,2367 0,1773 0,2002 0,3165 0,3134 0,3402
1968 868,5 0,2451 0,2103 0,1950 0,2254 0,2380 0,2380 0,2379 0,1889 0,2451 0,1848 0,2061 0,3244 0,3212 0,3553
1969 948,3 0,2563 0,2230 0,2062 0,2390 0,2482 0,2482 0,2481 0,1999 0,2563 0,1974 0,2210 0,3368 0,3339 0,3699
1970 1.012,9 0,2703 0,2363 0,2178 0,2515 0,2602 0,2602 0,2601 0,2138 0,2703 0,2123 0,2343 0,3560 0,3522 0,3962
1971 1.080,3 0,2838 0,2519 0,2314 0,2661 0,2719 0,2719 0,2718 0,2293 0,2838 0,2284 0,2526 0,3818 0,3759 0,4284
1972 1.176,9 0,2972 0,2690 0,2551 0,2769 0,2823 0,2824 0,2822 0,2398 0,2972 0,2455 0,2692 0,4216 0,4166 0,4503
1973 1.311,0 0,3103 0,2833 0,2752 0,2872 0,2931 0,2931 0,2930 0,2473 0,3103 0,2587 0,2838 0,4565 0,4541 0,4681
1974 1.438,9 0,3327 0,3070 0,2967 0,3116 0,3167 0,3168 0,3166 0,2714 0,3327 0,2765 0,3014 0,4789 0,4747 0,4985
1975 1.560,8 0,3673 0,3384 0,3293 0,3418 0,3491 0,3492 0,3490 0,3011 0,3673 0,3034 0,3277 0,5207 0,5099 0,5669
1976 1.738,8 0,3938 0,3640 0,3547 0,3670 0,3722 0,3722 0,3720 0,3267 0,3938 0,3325 0,3597 0,5586 0,5464 0,6087
TQ 459,6 0,4063 0,3752 0,3648 0,3785 0,3840 0,3840 0,3838 0,3404 0,4063 0,3454 0,3704 0,5873 0,5773 0,6222
1977 1.974,4 0,4233 0,3934 0,3881 0,3951 0,4002 0,4003 0,4000 0,3525 0,4233 0,3679 0,3945 0,6093 0,6013 0,6412
1978 2.218,3 0,4518 0,4195 0,4161 0,4204 0,4273 0,4274 0,4271 0,3758 0,4518 0,3898 0,4156 0,6492 0,6449 0,6646
1979 2.502,4 0,4882 0,4552 0,4520 0,4561 0,4625 0,4626 0,4623 0,4096 0,4882 0,4159 0,4476 0,6902 0,6867 0,7034
1980 2.725,4 0,5310 0,5029 0,5017 0,5033 0,5110 0,5110 0,5108 0,4563 0,5310 0,4584 0,4873 0,7391 0,7326 0,7663
1981 3.058,6 0,5830 0,5562 0,5582 0,5556 0,5604 0,5604 0,5602 0,5081 0,5830 0,5076 0,5371 0,7981 0,7911 0,8308
1982 3.225,5 0,6229 0,5958 0,6037 0,5932 0,5950 0,5950 0,5948 0,5514 0,6229 0,5364 0,5677 0,8614 0,8569 0,8874
1983 3.442,7 0,6504 0,6245 0,6348 0,6210 0,6223 0,6223 0,6221 0,5794 0,6504 0,5622 0,5910 0,9033 0,9038 0,8999
1984 3.846,7 0,6744 0,6555 0,6809 0,6467 0,6464 0,6464 0,6461 0,6088 0,6744 0,5753 0,6127 0,9344 0,9396 0,9007
1985 4.148,9 0,6963 0,6781 0,7089 0,6676 0,6681 0,6682 0,6677 0,6329 0,6963 0,5968 0,6312 0,9380 0,9427 0,9089
1986 4.406,7 0,7125 0,6947 0,7180 0,6861 0,6861 0,6861 0,6857 0,6557 0,7125 0,6107 0,6466 0,9199 0,9204 0,9164
1987 4.654,4 0,7311 0,7143 0,7284 0,7090 0,7071 0,7071 0,7068 0,6866 0,7311 0,6245 0,6667 0,9027 0,8992 0,9276
1988 5.011,9 0,7541 0,7359 0,7386 0,7349 0,7345 0,7345 0,7344 0,7107 0,7541 0,6429 0,6885 0,8895 0,8806 0,9447
1989 5.401,7 0,7834 0,7631 0,7609 0,7640 0,7670 0,7670 0,7670 0,7365 0,7834 0,6599 0,7031 0,8977 0,8875 0,9677
1990 5.737,0 0,8125 0,7882 0,7822 0,7902 0,7996 0,7996 0,7999 0,7693 0,8125 0,6845 0,7194 0,9121 0,9004 0,9867
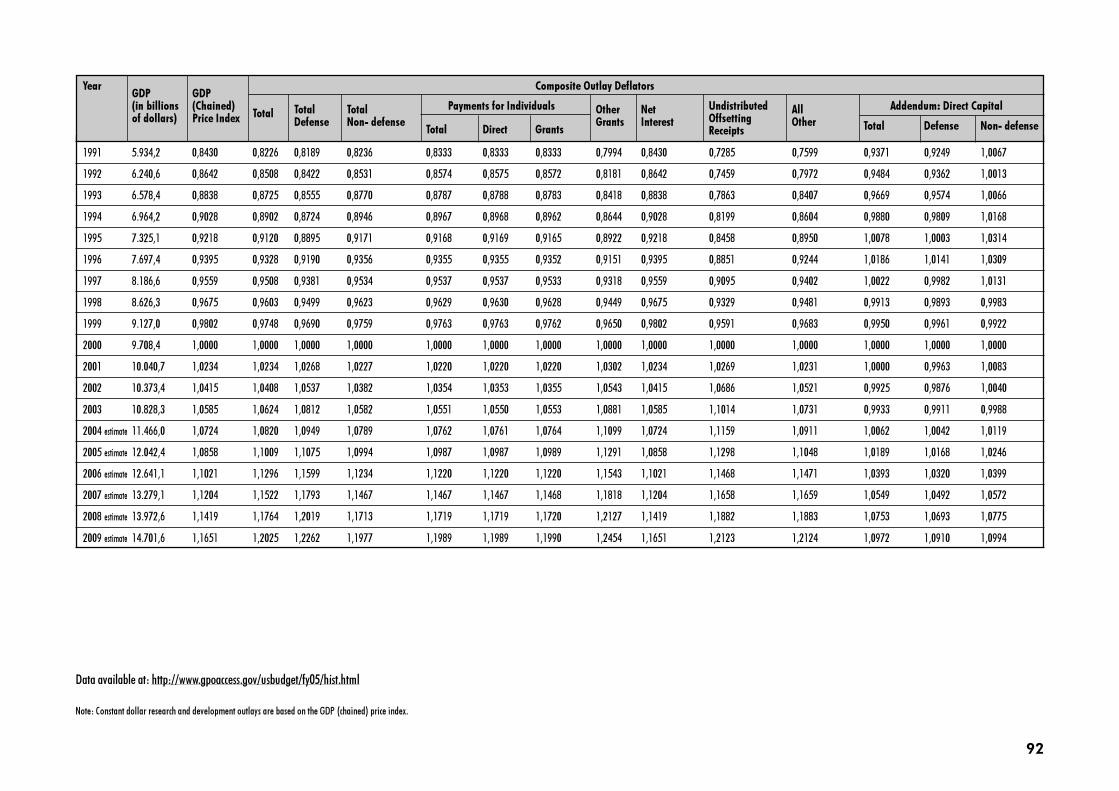
YearGDP GDP
Composite Outlay Deflators
(in billions (Chained)Total Total Total Payments for Individuals Other Net Undistributed All Addendum: Direct Capital
of dollars) Price Index Defense Non- defenseTotal Direct Grants
Grants Interest Offsetting Other Total Defense Non- defenseReceipts
92
1991 5.934,2 0,8430 0,8226 0,8189 0,8236 0,8333 0,8333 0,8333 0,7994 0,8430 0,7285 0,7599 0,9371 0,9249 1,0067
1992 6.240,6 0,8642 0,8508 0,8422 0,8531 0,8574 0,8575 0,8572 0,8181 0,8642 0,7459 0,7972 0,9484 0,9362 1,0013
1993 6.578,4 0,8838 0,8725 0,8555 0,8770 0,8787 0,8788 0,8783 0,8418 0,8838 0,7863 0,8407 0,9669 0,9574 1,0066
1994 6.964,2 0,9028 0,8902 0,8724 0,8946 0,8967 0,8968 0,8962 0,8644 0,9028 0,8199 0,8604 0,9880 0,9809 1,0168
1995 7.325,1 0,9218 0,9120 0,8895 0,9171 0,9168 0,9169 0,9165 0,8922 0,9218 0,8458 0,8950 1,0078 1,0003 1,0314
1996 7.697,4 0,9395 0,9328 0,9190 0,9356 0,9355 0,9355 0,9352 0,9151 0,9395 0,8851 0,9244 1,0186 1,0141 1,0309
1997 8.186,6 0,9559 0,9508 0,9381 0,9534 0,9537 0,9537 0,9533 0,9318 0,9559 0,9095 0,9402 1,0022 0,9982 1,0131
1998 8.626,3 0,9675 0,9603 0,9499 0,9623 0,9629 0,9630 0,9628 0,9449 0,9675 0,9329 0,9481 0,9913 0,9893 0,9983
1999 9.127,0 0,9802 0,9748 0,9690 0,9759 0,9763 0,9763 0,9762 0,9650 0,9802 0,9591 0,9683 0,9950 0,9961 0,9922
2000 9.708,4 1,0000 1,0000 1,0000 1,0000 1,0000 1,0000 1,0000 1,0000 1,0000 1,0000 1,0000 1,0000 1,0000 1,0000
2001 10.040,7 1,0234 1,0234 1,0268 1,0227 1,0220 1,0220 1,0220 1,0302 1,0234 1,0269 1,0231 1,0000 0,9963 1,0083
2002 10.373,4 1,0415 1,0408 1,0537 1,0382 1,0354 1,0353 1,0355 1,0543 1,0415 1,0686 1,0521 0,9925 0,9876 1,0040
2003 10.828,3 1,0585 1,0624 1,0812 1,0582 1,0551 1,0550 1,0553 1,0881 1,0585 1,1014 1,0731 0,9933 0,9911 0,9988
2004 estimate 11.466,0 1,0724 1,0820 1,0949 1,0789 1,0762 1,0761 1,0764 1,1099 1,0724 1,1159 1,0911 1,0062 1,0042 1,0119
2005 estimate 12.042,4 1,0858 1,1009 1,1075 1,0994 1,0987 1,0987 1,0989 1,1291 1,0858 1,1298 1,1048 1,0189 1,0168 1,0246
2006 estimate 12.641,1 1,1021 1,1296 1,1599 1,1234 1,1220 1,1220 1,1220 1,1543 1,1021 1,1468 1,1471 1,0393 1,0320 1,0399
2007 estimate 13.279,1 1,1204 1,1522 1,1793 1,1467 1,1467 1,1467 1,1468 1,1818 1,1204 1,1658 1,1659 1,0549 1,0492 1,0572
2008 estimate 13.972,6 1,1419 1,1764 1,2019 1,1713 1,1719 1,1719 1,1720 1,2127 1,1419 1,1882 1,1883 1,0753 1,0693 1,0775
2009 estimate 14.701,6 1,1651 1,2025 1,2262 1,1977 1,1989 1,1989 1,1990 1,2454 1,1651 1,2123 1,2124 1,0972 1,0910 1,0994
Note: Constant dollar research and development outlays are based on the GDP (chained) price index.
YearGDP GDP
Composite Outlay Deflators
(in billions (Chained)Total Total Total Payments for Individuals Other Net Undistributed All Addendum: Direct Capital
of dollars) Price Index Defense Non- defenseTotal Direct Grants
Grants Interest Offsetting Other Total Defense Non- defenseReceipts
Data available at: http://www.gpoaccess.gov/usbudget/fy05/hist.html