People, Resources & Climate Change What Does the 21 st Century Have in Store?
18
People, Resources & People, Resources & Climate Change Climate Change What Does the 21 What Does the 21 st st Century Have in Century Have in Store? Store?
-
Upload
dylan-turner -
Category
Documents
-
view
216 -
download
2
Transcript of People, Resources & Climate Change What Does the 21 st Century Have in Store?

People, Resources & Climate ChangePeople, Resources & Climate Change
What Does the 21What Does the 21stst Century Have in Store? Century Have in Store?

The Earth’s History in PerspectiveThe Earth’s History in PerspectiveDevelopment of Life Through TimeDevelopment of Life Through Time
To better comprehend “time” let’s use a calendar year to explain 4.6 billion years

The Earth’s History in One Calendar YearThe Earth’s History in One Calendar Year
- The earth needs until May before “life” appears in the form of microorganisms (Proterozoic / 2500-551 Million BP)
- It only gets interesting by mid November with invertebrates & algae in ancient oceans (Cambrian Period / 570-500 million BP)
- As November progresses fish & first terrestrial plants appear (Silurian Period)

- December 12: the dinosaurs have made it! (Triassic Period / 245-210 Million BP)
- Early December, reptiles evolve & great swamps form during the “Carboniferous” (Mississippian & Pennsylvanian Periods)
- End of November, amphibians & trees show up (Devonian Period / 410-360 Million BP)
The Earth’s History in One Calendar YearThe Earth’s History in One Calendar Year

- December 31, 8PM: first hominids in Africa (Pliocene Epoch / 5.3-1.6 million BP)
- December 20: dinosaurs extinct; mammals rule (Cretaceous Period / 140-65 million BP)
- December 16: first mammals join dinosaurs (Jurassic Period / 210-140 Million BP)
The Earth’s History in One Calendar YearThe Earth’s History in One Calendar Year
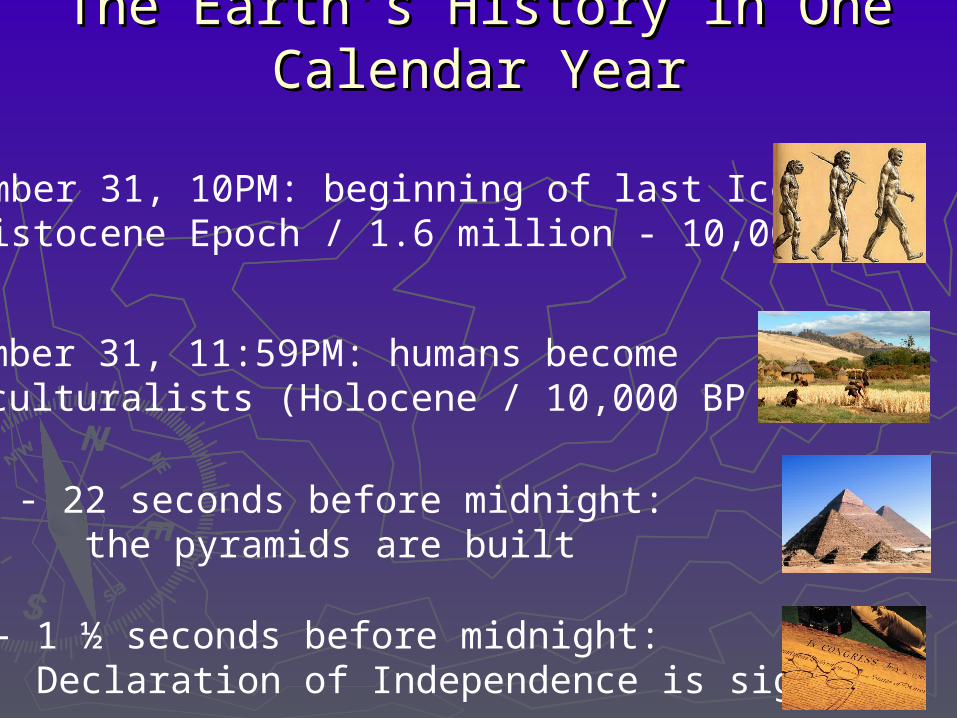
- December 31, 11:59PM: humans become agriculturalists (Holocene / 10,000 BP – now)
- 22 seconds before midnight: the pyramids are built
- 1 ½ seconds before midnight: Declaration of Independence is signed
- December 31, 10PM: beginning of last Ice Age (Pleistocene Epoch / 1.6 million - 10,000 BP)
The Earth’s History in One Calendar YearThe Earth’s History in One Calendar Year

Perspectives on Population GrowthPerspectives on Population Growth
• 7 billion today
• 8 billion by 2025?
• 9 billion by 2050?
• will we reach 10 billion?
• after that a decline?
Agricultural, medical and industrial revolutions contributed to population explosion

Dependence on Fossil Fuels

Fossil Fuels, Pollution & ExternalitiesFossil Fuels, Pollution & Externalities
Heart Disease
Asthma
Cancer
ADHD
Mortality

2050
Barr
els
of
oil p
er
year
(billion
s)
01234
56789
1011121314
Projected U.S.oil consumption
ANWR oil output over 50 years
2000 2010 2020 2030 2040
Trends and PrioritiesTrends and Priorities
Arctic National Wildlife Refuge? Keystone XL Pipeline? Fracking?
75-80% of the world’s energy demand is 75-80% of the world’s energy demand is covered by fossil fuelscovered by fossil fuels
We spend significantly more subsidy $$$ on We spend significantly more subsidy $$$ on finite sources of energy (e.g. fossil fuels) finite sources of energy (e.g. fossil fuels) than renewable sources (e.g. wind, solar)than renewable sources (e.g. wind, solar)

Energy EfficiencyEnergy Efficiency
The US could save more than > 35% of all the energy it uses by improving The US could save more than > 35% of all the energy it uses by improving energy efficiency of buildings, industrial operations and motor vehicles. energy efficiency of buildings, industrial operations and motor vehicles.

Renewable Energy in the USRenewable Energy in the US
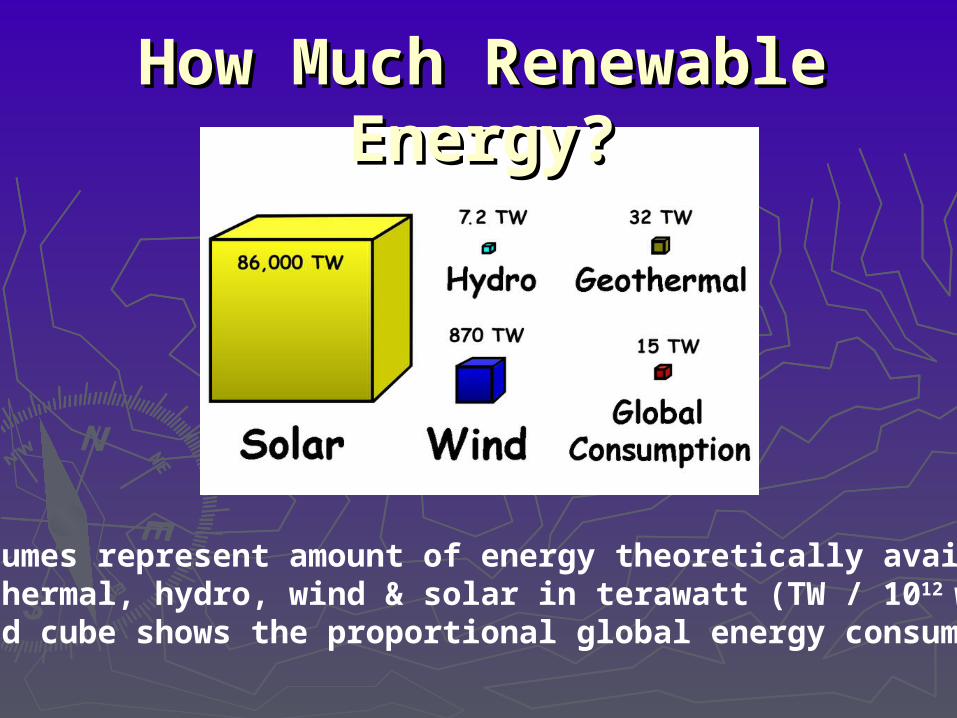
Cube volumes represent amount of energy theoretically available for geothermal, hydro, wind & solar in terawatt (TW / 1012 watts);small red cube shows the proportional global energy consumption.
How Much Renewable Energy?How Much Renewable Energy?
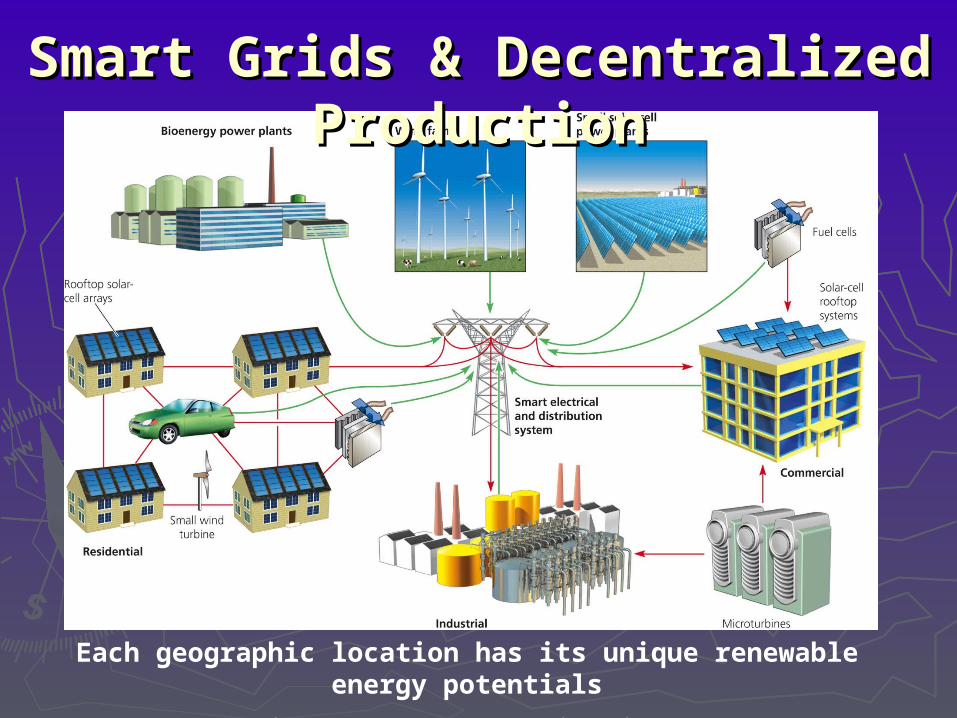
Smart Grids & Decentralized ProductionSmart Grids & Decentralized Production
Each geographic location has its unique renewable energy potentials
WSJ article in March 2013 on distributed solar as “mortal threat” to utilities

How Much Electricity From Renewable Sources?How Much Electricity From Renewable Sources? (An International Comparison as of 2011) (An International Comparison as of 2011)
Iceland: 100% (geothermal and hydroelectric)
Norway: 97% (mostly hydroelectric)
Canada: 63% (mostly hydroelectric)
Portugal: 47% (hydroelectric, wind)
Germany: 21% (wind, hydroelectric, solar)
United States: 13% (hydroelectric, biomass, wind)(Source: “How Much Electricity Comes From Renewable Sources”, NYT, March 23, 2013)

Planned 450 MW offshore wind farms near Nantucket Sound, MA
20 MW thermosolar power plant in Spain with molten salt heat storage technology
Reflections on Renewable Energy Alternatives
Energy efficiency is the only "energy source" which does not incur
environmental damage and is available immediately (>35%)!
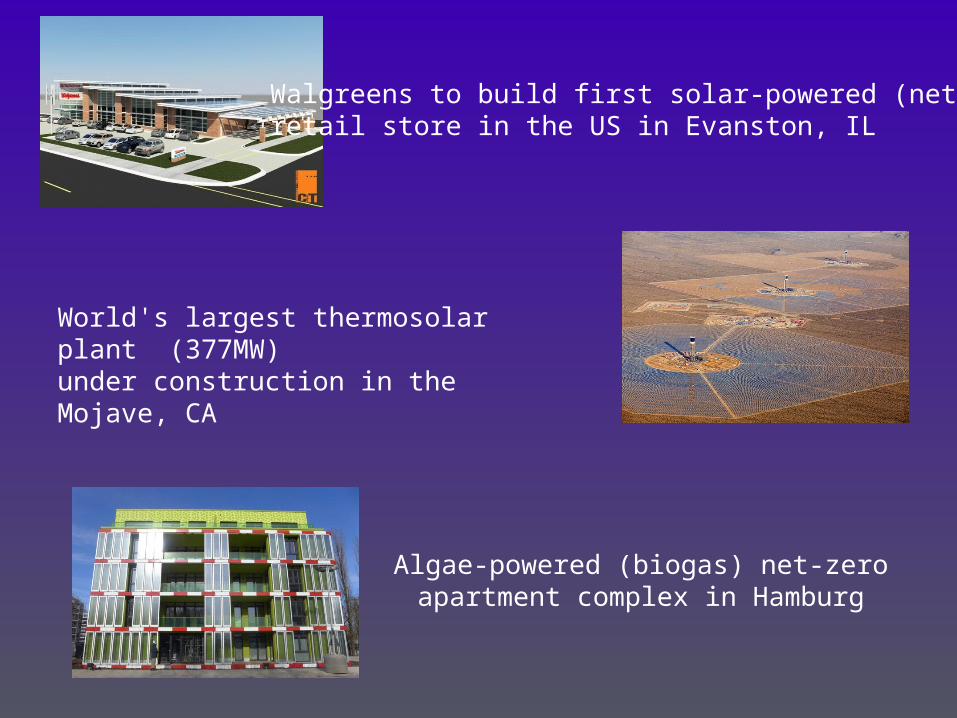
Algae-powered (biogas) net-zero apartment complex in Hamburg
World's largest thermosolar plant (377MW) under construction in the Mojave, CA
Walgreens to build first solar-powered (net-zero) retail store in the US in Evanston, IL

The United States At NightThe United States At Night
Thank YouThank You