Pentaho Business Analytics: a Business Intelligence Open ... · Pentaho Dashboard Designer for...
12
Database Systems Journal vol. III, no. 3/2012 23 Pentaho Business Analytics: a Business Intelligence Open Source Alternative Diana TÂRNĂVEANU West University of Timişoara, Faculty of Economics and Business Administration, Timi oara, ROMANIA [email protected] Most organizations strive to obtain fast, interactive and insightful analytics in order to fundament the most effective and profitable decisions. They need to incorporate huge amounts of data in order to run analysis based on queries and reports with collaborative capabilities. The large variety of Business Intelligence solutions on the market makes it very difficult for organizations to select one and evaluate the impact of the selected solution to the organization. The need of a strategy to help organization chose the best solution for investment emerges. In the past, Business Intelligence (BI) market was dominated by closed source and commercial tools, but in the last years open source solutions developed everywhere. An Open Source Business Intelligence solution can be an option due to time- sensitive, sprawling requirements and tightening budgets. This paper presents a practical solution implemented in a suite of Open Source Business Intelligence products called Pentaho Business Analytics, which provides data integration, OLAP services, reporting, dashboarding, data mining and ETL capabilities. The study conducted in this paper suggests that the open source phenomenon could become a valid alternative to commercial platforms within the BI context. Keywords: business intelligence (BI), decision-making, data analysis, data warehouses Introduction Ro of mania strives to meet the demands knowledge-based economy, such as: flexibility, globalization, horizontal/ vertical integration, innovative enterprises, organizational learning and customer-led strategy [1]. Business Intelligence (BI) is a concept often used in Romania for the last 10 years [2]. It is not a new trend anymore, but it became a must during the last decade, being considered as a basic tool used by the modern management [3]. Having as a main goal productivity and profitability, BI systems track down trends, problems and factors as soon as they act, outlining the key performance indicators (KPI) [4]. KPIs assess or measure certain aspects of the business operations (at operational level) and business strategies (at strategic level) that may otherwise be difficult to assign a quantitative value to [5]. The four main perspectives (Finance, Internal Business Processes, Education and Growth, Customers) provide relevant feedback for the managers’ initiatives [6]. Data analysis proved to be of a valuable importance in many sectors (such as banking, federal government, education performance management or executive scorecards for healthcare professionals); aggregating data across many dimensions being helpful for insight analysis [7], [8]. BI systems ensure obtaining of useful, correct and in-time information, usually taken from disparate data sources. They close the gap between the huge amount of data available to the decision factor, and the report analysis presented in a suggestive way that should support the decision making process [3]. BI offers sophisticate information analysis and information discovery technologies such as Data Warehouse, On-line Analytical Processing (OLAP), Data Mining, etc. BI 1
Transcript of Pentaho Business Analytics: a Business Intelligence Open ... · Pentaho Dashboard Designer for...

Database Systems Journal vol. III, no. 3/2012 23
Pentaho Business Analytics: a Business Intelligence Open Source Alternative
Diana TÂRNĂVEANU
West University of Timişoara, Faculty of Economics and Business Administration, Timi�oara, ROMANIA
Most organizations strive to obtain fast, interactive and insightful analytics in order to fundament the most effective and profitable decisions. They need to incorporate huge amounts of data in order to run analysis based on queries and reports with collaborative capabilities. The large variety of Business Intelligence solutions on the market makes it very difficult for organizations to select one and evaluate the impact of the selected solution to the organization. The need of a strategy to help organization chose the best solution for investment emerges. In the past, Business Intelligence (BI) market was dominated by closed source and commercial tools, but in the last years open source solutions developed everywhere. An Open Source Business Intelligence solution can be an option due to time-sensitive, sprawling requirements and tightening budgets. This paper presents a practical solution implemented in a suite of Open Source Business Intelligence products called Pentaho Business Analytics, which provides data integration, OLAP services, reporting, dashboarding, data mining and ETL capabilities. The study conducted in this paper suggests that the open source phenomenon could become a valid alternative to commercial platforms within the BI context. Keywords: business intelligence (BI), decision-making, data analysis, data warehouses
Introduction Roof
mania strives to meet the demands knowledge-based economy, such
as: flexibility, globalization, horizontal/ vertical integration, innovative enterprises, organizational learning and customer-led strategy [1]. Business Intelligence (BI) is a concept often used in Romania for the last 10 years [2]. It is not a new trend anymore, but it became a must during the last decade, being considered as a basic tool used by the modern management [3]. Having as a main goal productivity and profitability, BI systems track down trends, problems and factors as soon as they act, outlining the key performance indicators (KPI) [4]. KPIs assess or measure certain aspects of the business operations (at operational level) and business strategies (at strategic level) that may otherwise be difficult to assign a quantitative value to [5]. The four main
perspectives (Finance, Internal Business Processes, Education and Growth, Customers) provide relevant feedback for the managers’ initiatives [6]. Data analysis proved to be of a valuable importance in many sectors (such as banking, federal government, education performance management or executive scorecards for healthcare professionals); aggregating data across many dimensions being helpful for insight analysis [7], [8]. BI systems ensure obtaining of useful, correct and in-time information, usually taken from disparate data sources. They close the gap between the huge amount of data available to the decision factor, and the report analysis presented in a suggestive way that should support the decision making process [3]. BI offers sophisticate information analysis and information discovery technologies such as Data Warehouse, On-line Analytical Processing (OLAP), Data Mining, etc. BI
1
24 Pentaho Business Analytics: a Business Intelligence Open Source Alternative
solutions arrived to the third generation BI, providing access to information, advanced graphical and web-based OLAP, information mining tools and prepackaged applications that exploit the power of those tools [9]. A BI system has four major components: a data warehouse (with its data source), business analytics (a collection of tools for manipulating, mining and analyzing the data from the warehouse), business performance management (for monitoring and analyzing performance) and a user interface (connecting to the system via a browser) [10]. A data warehouse is the core component of a BI infrastructure. The dimensional model of a data warehouse consists in numeric measures, dimensions and fact tables. Related measures are collected into fact tables. The measures can be looked upon in different ways, those ways being called dimensions. A dimension is a particular area of interest such as time, geographic position, category and so on [9]. An OLAP instrument is a combination of analytical processing procedures and graphic presentations [10]. OLAP uses the word cube to describe what in the relational world would be the integration of the fact table with dimension tables [9]. It generally includes a calculation engine for adding complex analytical logic to the cube, and a query language. Because the standard relational query language (SQL) is not well suited to work with cubes, Multidimensional Expression (MDX), an OLAP-specific query language, has been developed. Data mining is a technology that uses complex algorithms for data analyzing and discovering valuable information for the decision maker [10]. The emphasis is on data’s quality to be valid, previously unknown, comprehensible and actionable. When designing the data scheme of the warehouse, the following types of schemes may be used: star, snowflake or
constellation [11]. Some of the most important factors that should be taken into account when successfully introducing a BI solution are: the BI solution should be business-oriented, rather than technology-oriented, act towards reaching the goals of the organization; a truthful partnership between management and informatics within the organization should be realized and the entire organization should be evaluated as a whole [12]. The need of a strategy for adopting a BI solution is a result of the following issues: high investment costs; the need of buying a BI solution suited for the needs of the organization; understanding the goal of implementation; the focus should be on incomes and results; it should monitor BI processes and provide feedback in order to refine and revise business strategy [12]. This paper presents a practical solution implemented in a suite of open source Business Intelligence products called Pentaho Business Analytics, providing data integration, OLAP services, reporting, dashboarding, data mining and ETL capabilities. 2 Pentaho BI – Analytics for everyone Analytics is all about gaining insights from the data for better decision making [13]. A competitor on the growing market of BI solutions, Pentaho BI is an ongoing effort by the Open Source (OS) community to provide organizations with best-in-class solutions for their enterprise BI needs. It encompasses the following major application areas: reporting, analysis, dashboards and data mining [2]. Pentaho Business Analytics (BA) enables business users to intuitively access, explore and analyze all data, enabling them to make information-driven decisions that positively impact the performance of their organizations. The collection of analysis components in Pentaho Business Analytics enables visualizations of data trends by creating static reports from an analysis data source, traversing an analysis cube, showing how
Database Systems Journal vol. III, no. 3/2012 25
data points compare by using charts, and monitoring the status of certain trends and thresholds with dashboards. The process starts by using any client tools, consolidating data from disparate sources into one canonical source and optimizing it for the metrics wanted to be analyzed; creating an analysis schema to
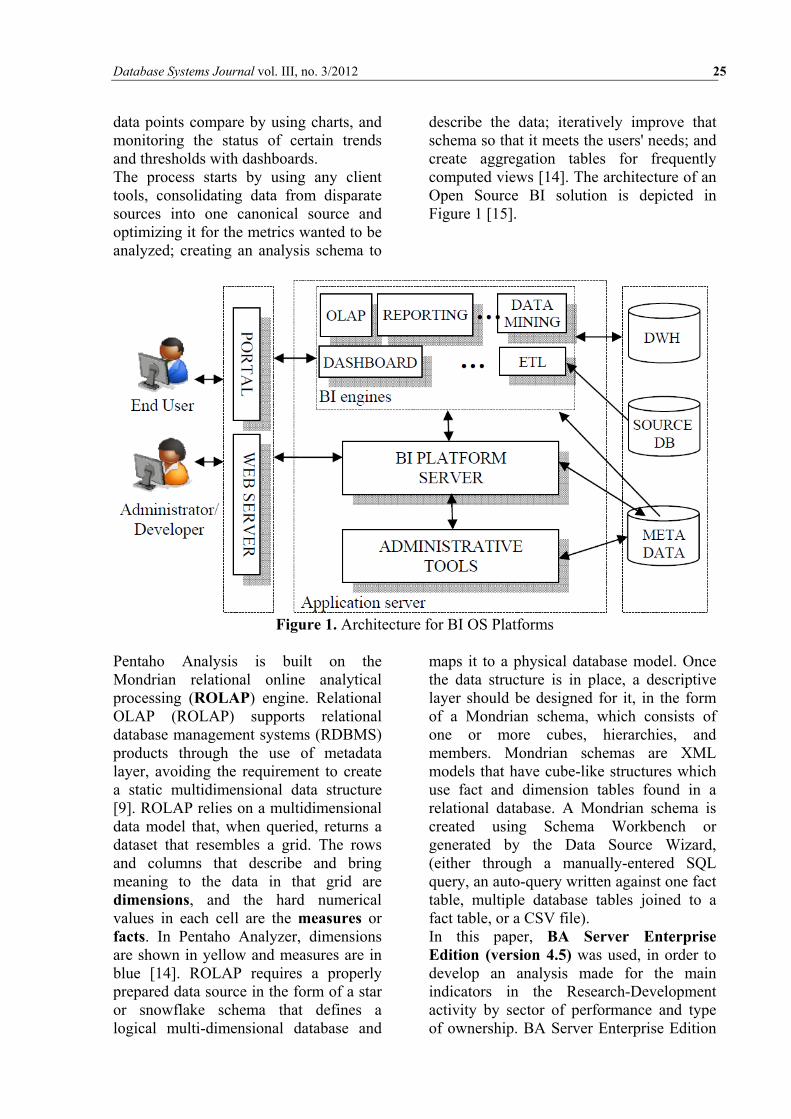
describe the data; iteratively improve that schema so that it meets the users' needs; and create aggregation tables for frequently computed views [14]. The architecture of an Open Source BI solution is depicted in Figure 1 [15].
Figure 1. Architecture for BI OS Platforms
Pentaho Analysis is built on the Mondrian relational online analytical processing (ROLAP) engine. Relational OLAP (ROLAP) supports relational database management systems (RDBMS) products through the use of metadata layer, avoiding the requirement to create a static multidimensional data structure [9]. ROLAP relies on a multidimensional data model that, when queried, returns a dataset that resembles a grid. The rows and columns that describe and bring meaning to the data in that grid are dimensions, and the hard numerical values in each cell are the measures or facts. In Pentaho Analyzer, dimensions are shown in yellow and measures are in blue [14]. ROLAP requires a properly prepared data source in the form of a star or snowflake schema that defines a logical multi-dimensional database and
maps it to a physical database model. Once the data structure is in place, a descriptive layer should be designed for it, in the form of a Mondrian schema, which consists of one or more cubes, hierarchies, and members. Mondrian schemas are XML models that have cube-like structures which use fact and dimension tables found in a relational database. A Mondrian schema is created using Schema Workbench or generated by the Data Source Wizard, (either through a manually-entered SQL query, an auto-query written against one fact table, multiple database tables joined to a fact table, or a CSV file). In this paper, BA Server Enterprise Edition (version 4.5) was used, in order to develop an analysis made for the main indicators in the Research-Development activity by sector of performance and type of ownership. BA Server Enterprise Edition
26 Pentaho Business Analytics: a Business Intelligence Open Source Alternative
includes two graphical user interfaces: User Console and Enterprise. The Pentaho User Console, includes:
1. Interactive Reporting for quick and easy data-driven reports;
2. Pentaho Analyzer for ROLAP-based reports and charts;
3. Pentaho Dashboard Designer for informative overviews of key performance indicators (KPI).
Pentaho Enterprise Console gives system administrators, IT managers, CIOs, and database administrators control over most aspects of BA Server configuration, management, and security [14]. 1. Pentaho Interactive Reporting provides a Web-based, drag-and-drop interface that allows adding elements to the report layout quickly and easily. Available features include: font selection, column resizing, column sorting, ability to rename column headers, copy and past functionality, unlimited undo and redo functionality, ability to output reports as HTML, PDF, CSV, or Excel files and ability to display reports in a dashboard. The data source for an Interactive Report is based on a metadata model. Queries are generated based on the metadata selection [14]. 2. Pentaho Analyzer is an interactive analysis tool that provides a rich Web-based, drag-and-drop user interface, which makes it easy to create reports based on exploration of the data. Pentaho Analyzer reports can be displayed in a dashboard. Pentaho Analyzer reports allow exploring data dynamically and drilling down into the data to discover previously hidden details. It presents data multi-dimensionally and allows selecting dimensions and measures. It is used to drill, slice, dice, pivot, filter, chart data and create calculated fields. 3. In order to create a dashboard in Dashboard Designer, a layout template, theme, and the content should be selected. In addition to displaying content generated from action sequences,
Interactive Reporting, and Analyzer, Dashboard Designer can also include: Charts: simple bar, line, area, pie, and dial charts created with Chart Designer; Data Tables: tabular data and URLs: Web sites. Dashboard Designer has dynamic filter controls, which enables end-users to change a dashboard's details by selecting different values from a drop-down list, and to control the content in one dashboard panel by changing the options in another (content linking). Using different combinations and controls, BI Dashboards provide a view of the features of the business monitoring environment [1]. 3 Developing an Open Source BI solution Today's BI architecture typically consists of a data warehouse (or one or more data marts), which consolidates data from several operational databases, and serves a variety of front-end querying, reporting, and analytic tools. 3.1 Establishing the future measures The indicators considered for the analysis were the ones provided by [16] – Research-Development activity by sectors of performance and type of ownership – Figure 2. In table presented below, related to the following fields: ownership type (state majority, private majority), years (2000-2009), gender (men, women), sector of performance (enterprises sector, government sector, tertiary education sector and private non-profit sector); the values for the following indicators are given: employees (number) end of year, employees number of persons in full-time equivalent, total expenditure, current expenditure and capital expenditure (investments) lei thou current prices. The analysis was made based on these measures: • M1 – employees number at the end of
the year and employees – number of persons in full time equivalent, with regards to the sector of performance and ownership type;
• M2 – employees number at the end of the year and employees – number of

Database Systems Journal vol. III, no. 3/2012 27
persons in full time equivalent, with regards to the sector of performance;
• M3 – employees number at the end of the year and employees – number of persons in full time equivalent, with regards to the ownership type, sectors of performance and gender;
• M4 – total expenditure, capital
expenditure (investments) and current expenditure (lei thou current prices) with regards to ownership type and sectors of performance;
• M5 – total expenditure (lei thou current prices) with regards to sectors of performance and years.
Figure 2. Main indicators for Research-Development Activity
3.2 Analyzing data sources The data base was created using
Microsoft Access 2007, proposing the following data scheme – Figure 3.
Figure 3. Research Development Database
28 Pentaho Business Analytics: a Business Intelligence Open Source Alternative
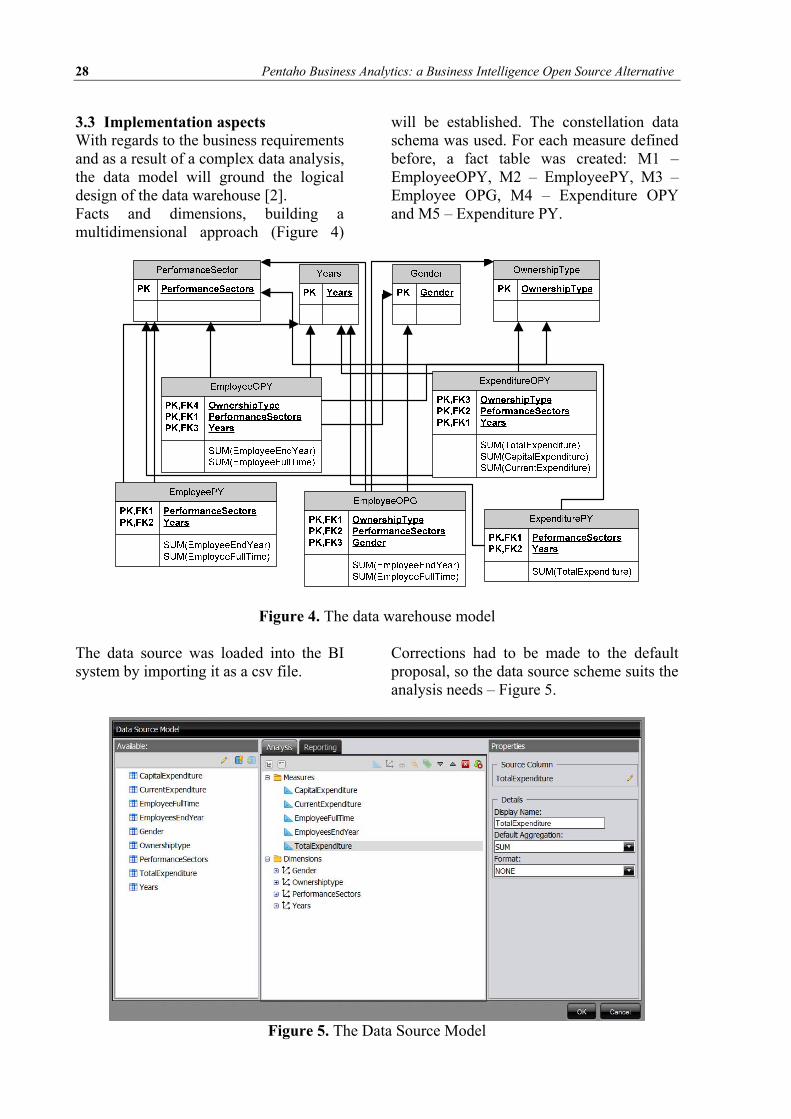
3.3 Implementation aspects With regards to the business requirements and as a result of a complex data analysis, the data model will ground the logical design of the data warehouse [2]. Facts and dimensions, building a multidimensional approach (Figure 4)
will be established. The constellation data schema was used. For each measure defined before, a fact table was created: M1 – EmployeeOPY, M2 – EmployeePY, M3 – Employee OPG, M4 – Expenditure OPY and M5 – Expenditure PY.
Figure 4. The data warehouse model
The data source was loaded into the BI system by importing it as a csv file.
Corrections had to be made to the default proposal, so the data source scheme suits the analysis needs – Figure 5.
Figure 5. The Data Source Model
Database Systems Journal vol. III, no. 3/2012 29
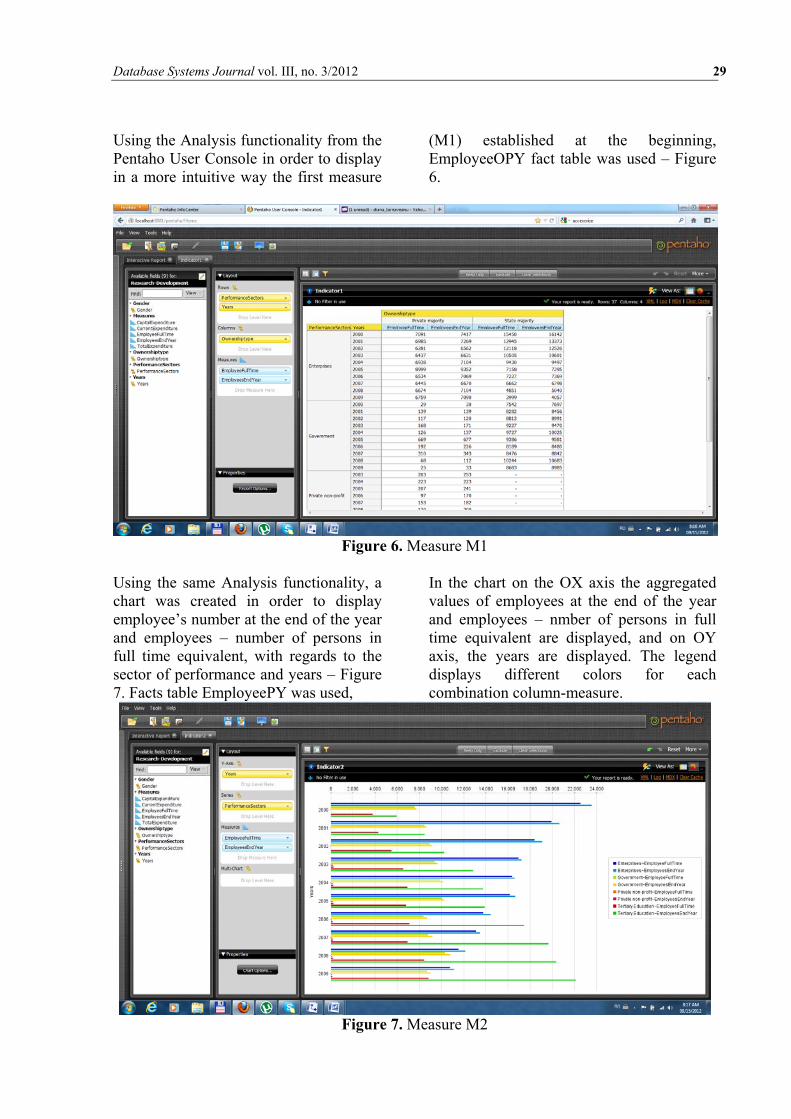
Using the Analysis functionality from the Pentaho User Console in order to display in a more intuitive way the first measure
(M1) established at the beginning, EmployeeOPY fact table was used – Figure 6.
Figure 6. Measure M1
Using the same Analysis functionality, a chart was created in order to display employee’s number at the end of the year and employees – number of persons in full time equivalent, with regards to the sector of performance and years – Figure 7. Facts table EmployeePY was used,
In the chart on the OX axis the aggregated values of employees at the end of the year and employees – nmber of persons in full time equivalent are displayed, and on OY axis, the years are displayed. The legend displays different colors for each combination column-measure.
Figure 7. Measure M2

30 Pentaho Business Analytics: a Business Intelligence Open Source Alternative
The Report functionality was used in order to create a report that displays employees number at the end of the year and employees – number of persons in full time equivalent, with regards to the ownership type, sectors of performance and gender – Figure 8. Facts table
EmployeeOPG was used, considering ownership type as a group, performance sectors and gender – as columns and employees at the end of the year and employees number of persons in full time equivalent as measure. A filter was applier, so that only year 2009 is displayed.
Figure 8. Measure M3
Dashboards increase the analytical power of the visualization by allowing multiple perspectives on the dataset in the same location. Several content types are available: Charts, Data Tables, URLs, and Files created before using the Analysis or Report features. A template with 4 visualizations was chosen. When creating a dashboard, the
Data Table content type allows a tabular representation of a database query in a dashboard. It also allows the manipulation of the data, directly from the dashboard. The first box, from up left corner, corresponds to the measure M4, ExpenditureOPY fact table being used. The result can be seen in Figure 9.

Database Systems Journal vol. III, no. 3/2012 31
Figure 9. The data table for M4 For the top right-hand side – a chart-type visualization was chosen, in order to display measure M5, using ExpenditurePY fact table. The Chart Designer allows creating bar, pie, line, dial, and area charts that can be added to a dashboard. When building a chart, a data source has to be selected, then a query built on that data source. The selected columns for the query were
performance sectors and years, and for the aggregation function, SUM, applied to the field total expenditure. Performance sectors dimension was chosen as a series column, years as a category columns and total expenditure dimension as values column. Total expenditure (lei thou current prices) is displayed, with regards to sectors of performance and years – Figure 10.
Figure 10. Measure M5
32 Pentaho Business Analytics: a Business Intelligence Open Source Alternative
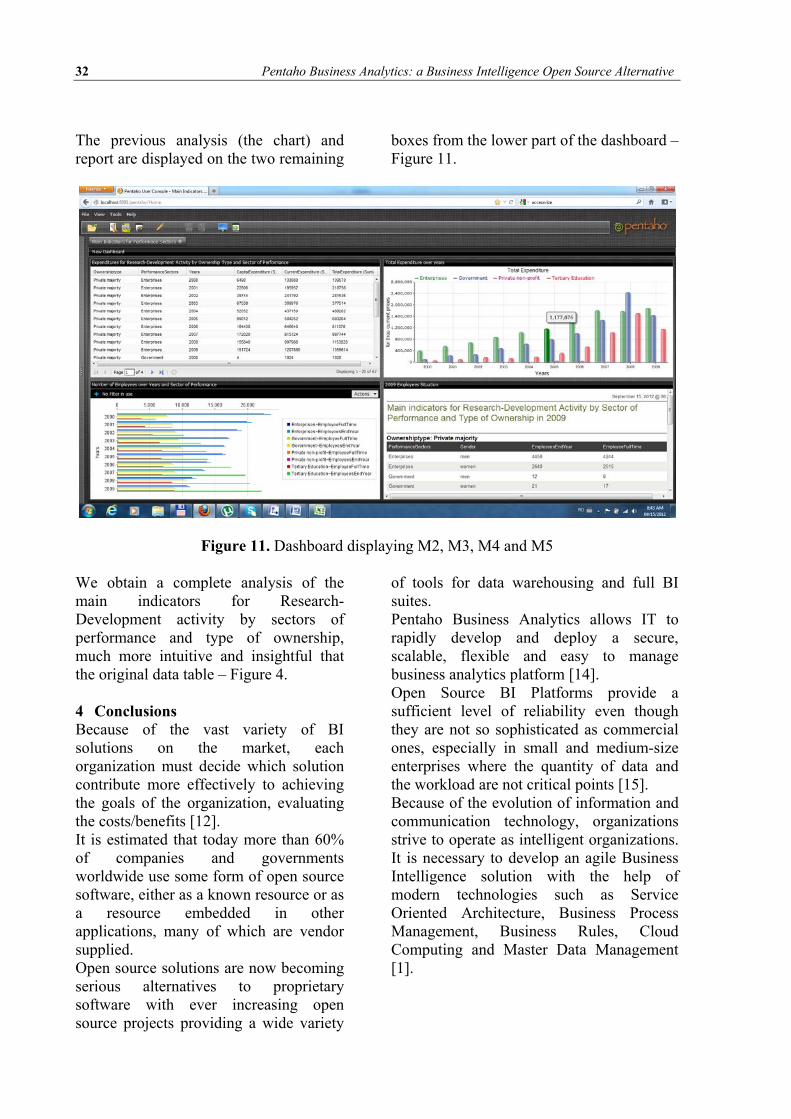
The previous analysis (the chart) and report are displayed on the two remaining
boxes from the lower part of the dashboard – Figure 11.
Figure 11. Dashboard displaying M2, M3, M4 and M5 We obtain a complete analysis of the main indicators for Research-Development activity by sectors of performance and type of ownership, much more intuitive and insightful that the original data table – Figure 4. 4 Conclusions Because of the vast variety of BI solutions on the market, each organization must decide which solution contribute more effectively to achieving the goals of the organization, evaluating the costs/benefits [12]. It is estimated that today more than 60% of companies and governments worldwide use some form of open source software, either as a known resource or as a resource embedded in other applications, many of which are vendor supplied. Open source solutions are now becoming serious alternatives to proprietary software with ever increasing open source projects providing a wide variety
of tools for data warehousing and full BI suites. Pentaho Business Analytics allows IT to rapidly develop and deploy a secure, scalable, flexible and easy to manage business analytics platform [14]. Open Source BI Platforms provide a sufficient level of reliability even though they are not so sophisticated as commercial ones, especially in small and medium-size enterprises where the quantity of data and the workload are not critical points [15]. Because of the evolution of information and communication technology, organizations strive to operate as intelligent organizations. It is necessary to develop an agile Business Intelligence solution with the help of modern technologies such as Service Oriented Architecture, Business Process Management, Business Rules, Cloud Computing and Master Data Management [1].

Database Systems Journal vol. III, no. 3/2012 33
References [1] M. Mircea, B. Ghilic-Micu, M.
Stoica, ”An Agile Architecture Framework that Leverages the Strengths of Business Intelligence, Decision Management and Service Orientation”, Business Intelligence - Solution for Business Development, ISBN: 978-953-51-0019-5, InTech, Available from: http://www.intechopen.com/books/business-intelligence-solution-for-business-development/an-agile-architecture-framework-that-leverages-the-strengths-of-business-intelligence-decision-manag
[2] D. Târnăveanu, M. Muntean, ”Free Business Intelligence – An Easy and Reliable Alternative”, Mathematical Models & Methods in Applied Sciences, WSEAS Press, pp. 158-164, ISBN 978-1-61804-098-5, available at SSRN: http://ssrn.com/abstract=2143945
[3] A.R. Bologa, R. Bologa, ”Business Intelligence using Software Agents”, Database Systems Journal, vol.II, no.4/2011, available at http://dbjournal.ro/archive/6/4_Bologa.pdf
[4] M. Muntean, D. Târnăveanu, A. Paul, ”BI Approach for Business Performance”, Proceedings of the 5th WSEAS International Conference on Economy and Management Transformation (Volume II), Timişoara, 2010, pp. 792-797, available at http://papers.ssrn.com/sol3/papers.cfm?abstract_id=1732190
[5] M. Muntean, ”Business Intelligence Approaches”, Published in: Mathematical Models & Methods in Applied Sciences, Vol. I, WSEAS Press, (10. June 2012): pp. 192-196
[6] M. Muntean, L.G. Cabau, ”Business Intelligence Approach In A Business Performance Context”, Online at http://mpra.ub.uni-muenchen.de/29914/, MPRA Paper
No. 29914, posted 28. March 2011 / 19:42
[7] M.C. Voicu, ”Algorithms used to obtain aggregated value sets from relational databases”, 9th WSEAS Int. Conf. on MATHEMATICS & COMPUTERS IN BUSINESS AND ECONOMICS (MCBE '08), Bucharest, 2008, pp.209-221, available at http://www.wseas.us/e-library/conferences/2008/bucharest/mcbe/34mcbe.pdf
[8] M. Voicu, G. Mircea, ”Constructing and Exploiting Hypercubes in order to Obtain Aggregated Values”, WSEAS Transactions on Information Science and Applications, Issue 10, Volume 3, October 2006, pp. 2008-2015
[9] M. Muntean., C. Brândaş, ”Business Intelligence Support Systems and Infrastructures”, Economy Informatics, 2007, No. 7, pp. 100-104, 2007, available at SSRN: http://ssrn.com/abstract=1082465
[10] A. Butuza, I. Hauer, C. Muntean, A. Popa, ”Increasing the Business Performance using Business Intelligence”, Analele Universităţii “Eftimie Murgu” Reşiţa, anul XVIII, nr.3, 2011, pp. 67-72, available at http://anale-ing.uem.ro/2011/C9.pdf
[11] M. Mircea, A.I. Andreescu, ”Agile Development for Service Oriented Business Intelligence Solutions”, Database Systems Journal, vol.II, no.1/2011, available at http://dbjournal.ro/archive/3/5_Mircea_Andreescu.pdf
[12] B. Ghilic-Micu, M. Mircea, M. Stoica, ”The Audit of Business Intelligence Solutions”, Informatica Economică vol. 14, no. 1/2010, available at http://revistaie.ase.ro/content/53/07%20Ghilic,%20Mircea,%20Stoica.pdf
[13] G. Gligor, S. Teodoru, ”Oracle Exalytics for Speed-f-thought Analytics ”, Database Systems Journal, vol.II, no.4/2011, available at http://dbjournal.ro/archive/6/1_Gligor_Teodoru.pdf
[14] http://www.pentaho.com/

34 Pentaho Business Analytics: a Business Intelligence Open Source Alternative
[15] M. Golfarelli, ”Open Source BI Platforms: a Functional and Architectural Comparison”, Proceeding DaWaK '09 Proceedings of the 11th International Conference on Data Warehousing and Knowledge Discovery, pages 287 - 297, available at
http://bias.csr.unibo.it/golfarelli/papers/DAWAK09%20-%20Golfarelli.pdf [16]http://www.insse.ro/cms/files/Anuar%20statistic/13/13%20Stiinta,%20tehnologie%20si%20inovare_ro.pdf
Diana TÂRNĂVEANU has graduated the Faculty of Mathematics from the West University
of Timişoara in 1995. She holds a PhD diploma in Management from 2008. Currently she is lecturer of Economic Informatics within the Department of Business Information Systems at Faculty of Economics and Business Administration from the West University of Timişoara. She is teaching advances in database management systems, business intelligence and decision support systems. She is the author of more than 10 books and over 35 journal articles in the field of Knowledge Management, Decision Support Systems, Collaborative Systems and Business Intelligence.