Pension Trust, Insurance Trust, and Legacy Fund Trust, Insurance Trust, and Legacy Fund ......
63
NDSIB Fee Study: Fiscal Year 2016 Pension Trust, Insurance Trust, and Legacy Fund November 2016 Paul Erlendson Senior Vice President Alex Browning Vice President Andrea Biel Assistant Vice President
Transcript of Pension Trust, Insurance Trust, and Legacy Fund Trust, Insurance Trust, and Legacy Fund ......

NDSIB Fee Study:
Fiscal Year 2016
Pension Trust, Insurance Trust,
and Legacy Fund
November 2016
Paul Erlendson
Senior Vice President
Alex Browning
Vice President
Andrea Biel
Assistant Vice President

1 NDSIB Fee Analysis – FY 2016 Knowledge. Experience. Integrity.
Summary Notes and Comments
● All market values and fee data are as of the fiscal year ending June 30, 2016.
● Investment managers employ three primary fee calculation methods to charge for their services;
– AUM Based Fees: fees are calculated as a percentage of assets under management
– Performance Based Fees: fees are calculated on outperformance relative to a pre-specified benchmark during
a contracted measurement period
– Hybrid Fees: A combination of a low AUM based fee and a performance based fee schedule
● Regardless of the method used by a particular manager, Callan calculated fees as a percentage of assets under
management for each manager for the purposes of comparison.
● In many instances, fees paid by the individual trusts benefit from fee schedules that account for the aggregate
level of assets invested with a particular manager or in a specific strategy.
● Fee universes used in the study reflect either:
– Actual Fees paid by Callan clients in similar mandates,
– Published Fees calculated using a universe of manager fee schedules for similar mandates, or;
– An Average of Actual & Published Fee universes. This method was employed where the Actual Fee universe
was smaller than 10.
● All fee universes are explicitly noted beneath each chart where “n=” will denote the applicable sample size.
● Greater detail on fee measurements and data are available on the last page of the report.
NDSIB – Pension Trust, Insurance Trust, and Legacy Fund

Guide to Charts and Tables

3 NDSIB Fee Analysis – FY 2016 Knowledge. Experience. Integrity.
Short Term Fixed Income
● Short Term Fixed Income managers invest in bonds that have short maturity dates.
● North Dakota’s average account size for FY 2016: $253mm.
● Red circle represents NDSIB Insurance Trust’s asset based weighted average short-term fixed income mgmt.
fee: 0.14%.
● Green boxes and diamond represent the 75th, Median, and 25th fee percentiles for the fee universe.
● Fee universe was constructed using Callan’s 2014 Investment Management Fee Survey for mandate sizes
greater than $200mm.
Insurance Trust
0.08% 0.11% 0.14% 0.17% 0.20%
Short Term Fixed Income Fees
n = 38, Actual Fee Universe
Median
Percentile
Industry Fee
NDSIB Weighted
Average Fee (Asset
Based Fee Strategies
Only)
75th and 25th
Percentile
Industry Fee
This is NDSIB’s
Weighted Average Fee
75th
Percentile
25th
Percentile

4 NDSIB Fee Analysis – FY 2016 Knowledge. Experience. Integrity.
Investment Strategies – Short Term Fixed Income & Cash
● All managers for this asset class fall into the asset based fee category.
● Fees for cash management are typically below 20 basis points (0.20%). Fees paid by the North Dakota State
Investment Board’s Insurance Trust cash and short-term fixed income management are well within industry
norms.
● Note that the Legacy Fund cash allocation is included in the Insurance Trust Cash Account
Insurance Trust
AUM Based Fee Strategies Fee %
JPM Short Term 0.11%
Babson Short Term 0.17%
Weighted Average AUM Based Fee 0.14%
Industry Fee - 25th Percentile 0.19%
Industry Fee - Median 0.15%
Industry Fee - 75th Percentile 0.10%
Total Weighted Average Fee 0.14%
Short Term Fixed Income
AUM Based Fee Strategies Fee %
Northern Trust Cash Account 0.14%
Weighted Average AUM Based Fee 0.14%
Total Weighted Average Fee 0.14%
Cash & Equivalents
The table
summarizes the data
behind the chart
Sometimes, no
universe exists Fee
Distribution

5 NDSIB Fee Analysis – FY 2016 Knowledge. Experience. Integrity.
Domestic Large Cap Equity
● Domestic Large Cap Equity managers invest in large company stocks that are typically listed within the U.S.
● North Dakota’s average account size for FY 2016: $233mm.
● Red circle represents NDSIB Legacy Fund’s asset based weighted average large cap equity mgmt. fee: 0.25%.
● Yellow box represents total asset class weighted average fee (asset based & performance/hybrid fees) in FY
2016: 0.27%.
● Green boxes and diamond represent the 75th, Median, and 25th fee percentiles for the fee universe.
● Fee universe was constructed using Callan’s 2014 Investment Management Fee Survey for mandate sizes of
greater than $200mm.
Legacy Fund
n = 83, Actual Fee Universe
0.10% 0.15% 0.20% 0.25% 0.30% 0.35% 0.40%
Domestic Large Cap Fees
Median Strategy Fee
NDSIB Weighted
Average Fee (AUM Based
Fee Strategies Only)
75th and 25th Percentile
Strategy Fee
Total Asset Class
Weighted Average Fee (AUM, Performance, & Hybrid
Fee Strategies)
This is NDSIB’s
Weighted Average Fee
This is NDSIB’s Total
Weighted Average Fee

6 NDSIB Fee Analysis – FY 2016 Knowledge. Experience. Integrity.
Investment Strategies – Domestic Large Cap Equity
Legacy Fund
● Due to the fee structure of the funds in the Performance & Hybrid Fee Strategies category, the Total Weighted
Average Fees are not comparable to industry fees from Callan’s 2014 Investment Management Fee Survey.
– L.A. Capital Enhanced Index charges a base management fee on all assets under management. A
performance-based fee of 20% of returns in excess of the benchmark return is charged on approximately 40%
of the assets.
– Parametric Clifton Enhanced Index charges no base management fee. The manager is paid 35% of any
excess return above the benchmark. Fees are paid annually for performance through June 30.
AUM Based Fee Strategies Fee %
L.A. Capital Growth 0.21%
LSV Asset Management 0.29%
Weighted Average AUM Based Fee 0.25%
Industry Fee - 25th Percentile 0.35%
Industry Fee - Median 0.25%
Industry Fee - 75th Percentile 0.20%
Performance & Hybrid Fee Strategies Fee %
L.A. Capital Enhanced Index 0.33%
Parametric Clifton Enhanced S&P 500 0.26%
Total Weighted Average Fee 0.27%
Domestic Large Cap Equity
AUM Based Fees
Performance and Hybrid
Based Fees

7 NDSIB Fee Analysis – FY 2016 Knowledge. Experience. Integrity.
Global Equity
● Global equity managers invest in stocks traded in both U.S. and non-U.S. markets.
● North Dakota’s average account size for FY 2016: $326mm.
● Red circle represents NDSIB Pension Trust’s asset based weighted average global equity mgmt. fee: 0.64%.
● Yellow box represents total asset class weighted average fee (asset based & performance/hybrid fees) in FY
2016: 0.38%.
● Green boxes and diamond represent the 75th, Median, and 25th fee percentiles for the fee universe.
● Fee universe was constructed using Callan’s 2014 Investment Management Fee Survey for mandate sizes of
greater than $200mm.
Pension Trust
n = 37, Actual Fee Universe
Median Strategy Fee
NDSIB Weighted
Average Fee (AUM Based
Fee Strategies Only)
75th and 25th Percentile
Strategy Fee
Total Asset Class
Weighted Average Fee (AUM, Performance, & Hybrid
Fee Strategies)
0.20% 0.30% 0.40% 0.50% 0.60% 0.70%
Global Equity Fees
This tells us the size and type of the
sample universe used to compare fees

8 NDSIB Fee Analysis – FY 2016 Knowledge. Experience. Integrity.
Investment Strategies – Global Equity
● Due to the fee structure of the funds in the Performance & Hybrid Fee Strategies category, the Total Weighted
Average Fees are not comparable to industry fees from Callan’s 2014 Investment Management Fee Survey.
– LSV charges a flat fee of 0.10% on assets under management plus 25% of the net outperformance relative to
its benchmark with totals fees capped at 0.85%.
Pension Trust
AUM Based Fee Strategies Fee %
EPOCH Inv. Partners 0.64%
Weighted Average AUM Based Fee 0.64%
Industry Fee - 25th Percentile 0.47%
Industry Fee - Median 0.42%
Industry Fee - 75th Percentile 0.37%
Performance & Hybrid Fee Strategies Fee %
LSV Asset Management 0.18%
Total Weighted Average Fee 0.38%
Global Equity
The text provides more detail on how a
particular fee was calculated and or had
and effect on the total weighted average

Pension Trust

10 NDSIB Fee Analysis – FY 2016 Knowledge. Experience. Integrity.
Pension Trust
● Total Equity Manager fees paid represented a mix of asset-based and performance/hybrid fee strategies. In aggregate all equity strategy composites had fees equal to or below their respective medians. – Total Global Equity fees fell below their respective distribution median helped in part by performance/hybrid fee based strategies
– Total Domestic Large Cap Equity fees were equal to the fee distribution median with performance/hybrid fee based strategies displaying a wide range
– Total Small Cap Equity fees were close to the 75th percentile with asset-based fees falling closer to median
– Developed International Equity fees were well below the 75th percentile and represented only asset-based fee strategies
– Emerging Market Equity fees fell just below median and represented only asset-based fee strategies
● Total Fixed Income Manager fees paid represented a mix of asset-based and performance/hybrid fee strategies. In aggregate fees for Investment Grade, Below Investment Grade, and International Fixed Income displayed a broad range. – Total Investment Grade Fixed Income fees paid were above the 25th percentile, driven largely by performance/hybrid fee based strategies
– Total Below Investment Grade Fixed Income fees paid were above the 25th percentile, driven largely by performance/hybrid fee based strategies
– Total International Fixed Income fees paid were below median and represented only asset-based fee strategies
● Total Real Estate Manager fees paid represented a mix of asset-based and performance/hybrid fee strategies. Asset based fee strategies fell well below the 75th percentile with performance/hybrid fee strategies pushing the total fees paid just above the 25th percentile. – Due to the custom nature of non-core real estate strategies and their closed-end fund structures, there is no applicable manager fee
distribution and so it presents a skew to the asset-based fee universe comparison
● Total Real Assets represents a wide variety of inflation sensitive strategies ranging from Domestic Timber and Infrastructure to Asian Infrastructure. Due to the custom nature of these strategies no applicable manager fee distribution is available. – Fee structures do however appear to follow industry norms and standards
● Private Equity represents a variety of strategies and investment vehicles that cannot produce a reasonable industry fee universe for comparison. – Fee structures do however appear to follow industry norms and standards
NDSIB Fee Study Fiscal Year 2016 Executive Summary

11 NDSIB Fee Analysis – FY 2016 Knowledge. Experience. Integrity.
Global Equity
● Global equity managers invest in stocks traded in both U.S. and non-U.S. markets.
● North Dakota’s average account size for FY 2016: $326mm.
● Red circle represents NDSIB Pension Trust’s asset based weighted average global equity mgmt. fee: 0.64%.
● Yellow box represents total asset class weighted average fee (asset based & performance/hybrid fees) in FY
2016: 0.38%.
● Green boxes and diamond represent the 75th, Median, and 25th fee percentiles for the fee universe.
● Fee universe was constructed using Callan’s 2014 Investment Management Fee Survey for mandate sizes of
greater than $200mm.
Pension Trust
n = 37, Actual Fee Universe
Median Strategy Fee
NDSIB Weighted
Average Fee (AUM Based
Fee Strategies Only)
75th and 25th Percentile
Strategy Fee
Total Asset Class
Weighted Average Fee (AUM, Performance, & Hybrid
Fee Strategies)
0.20% 0.30% 0.40% 0.50% 0.60% 0.70%
Global Equity Fees

12 NDSIB Fee Analysis – FY 2016 Knowledge. Experience. Integrity.
Investment Strategies – Global Equity
● Due to the fee structure of the funds in the Performance & Hybrid Fee Strategies category, the Total Weighted
Average Fees are not comparable to industry fees from Callan’s 2014 Investment Management Fee Survey.
– LSV charges a flat fee of 0.10% on assets under management plus 25% of the net outperformance relative to
its benchmark with totals fees capped at 0.85%.
Pension Trust
AUM Based Fee Strategies Fee %
EPOCH Inv. Partners 0.64%
Weighted Average AUM Based Fee 0.64%
Industry Fee - 25th Percentile 0.47%
Industry Fee - Median 0.42%
Industry Fee - 75th Percentile 0.37%
Performance & Hybrid Fee Strategies Fee %
LSV Asset Management 0.18%
Total Weighted Average Fee 0.38%
Global Equity

13 NDSIB Fee Analysis – FY 2016 Knowledge. Experience. Integrity.
Domestic Large Cap Equity
● Domestic Large Cap Equity managers invest in large company stocks that are typically listed and traded within
the U.S.
● North Dakota’s average account size for FY 2016: $306mm.
● Red circle represents NDSIB Pension Trust’s asset based weighted average large cap equity mgmt. fee: 0.21%.
● Yellow box represents total asset class weighted average fee (asset based & performance/hybrid fees) in FY
2016: 0.25%.
● Green boxes and diamond represent the 75th, Median, and 25th fee percentiles for the fee universe.
● Fee universe was constructed using Callan’s 2014 Investment Management Fee Survey for mandate sizes of
greater than $200mm.
Pension Trust
n = 83, Actual Fee Universe
0.10% 0.15% 0.20% 0.25% 0.30% 0.35% 0.40%
Domestic Large Cap Fees
Median Strategy Fee
NDSIB Weighted
Average Fee (AUM Based
Fee Strategies Only)
75th and 25th Percentile
Strategy Fee
Total Asset Class
Weighted Average Fee (AUM, Performance, & Hybrid
Fee Strategies)

14 NDSIB Fee Analysis – FY 2016 Knowledge. Experience. Integrity.
Investment Strategies – Domestic Large Cap Equity
● Due to the fee structure of the funds in the Performance & Hybrid Fee Strategies category, the Total Weighted
Average Fees are not comparable to industry fees from Callan’s 2014 Investment Management Fee Survey.
– L.A. Capital Enhanced Index charges a base management fee on all assets under management. A
performance based fee of 20% of returns in excess of the benchmark is charged on approximately 40% of the
assets.
– Northern Trust Enhanced Index charges no base management fee. The only fee charged is 25% of the excess
return generated. Fees are calculated and paid quarterly.
– Parametric Clifton Enhanced Index charges no base management fee. The only fee charged is 35% of the
excess return generated. Fees are paid once a year for performance through June 30.
Pension Trust
AUM Based Fee Strategies Fee %
L.A. Capital Growth 0.21%
Weighted Average AUM Based Fee 0.21%
Industry Fee - 25th Percentile 0.35%
Industry Fee - Median 0.25%
Industry Fee - 75th Percentile 0.20%
Performance & Hybrid Fee Strategies Fee %
L.A. Capital Enhanced Index 0.53%
Northern Trust Enhanced S&P 500 0.00%
Parametric Clifton Enhanced S&P 500 0.22%
Total Weighted Average Fee 0.25%
Domestic Large Cap Equity

15 NDSIB Fee Analysis – FY 2016 Knowledge. Experience. Integrity.
Domestic Small Cap Equity
● Small Cap Equity managers invest in smaller company stocks that are typically listed and traded within the U.S.
● North Dakota’s average account size for FY 2016: $111mm.
● Red circle represents NDSIB Pension Trust’s asset based weighted average domestic small cap equity mgmt.
fee: 0.62%.
● Yellow box represents total asset class weighted average fee (asset based & performance/hybrid fees) in FY
2016: 0.56%.
● Green boxes and diamond represent the 75th, Median, and 25th fee percentiles for the fee universe.
● Fee universe was constructed using Callan’s 2014 Investment Management Fee Survey for mandate sizes
between $100mm and $200mm.
Pension Trust
n = 29, Actual Fee Universe
0.45% 0.50% 0.55% 0.60% 0.65% 0.70% 0.75% 0.80%
Domestic Small Cap Fees
Median Strategy Fee
NDSIB Weighted
Average Fee (AUM Based
Fee Strategies Only)
75th and 25th Percentile
Strategy Fee
Total Asset Class
Weighted Average Fee (AUM, Performance, & Hybrid
Fee Strategies)

16 NDSIB Fee Analysis – FY 2016 Knowledge. Experience. Integrity.
Investment Strategies – Domestic Small Cap Equity
● Due to the fee structure of the funds in the Performance & Hybrid Fee Strategies category, the Total Weighted
Average Fees are not comparable to industry fees from Callan’s 2014 Investment Management Fee Survey.
– Parametric Clifton Enhanced Small Cap charges no base management fee. The only fee charged is 35% of the
excess return generated over the index. Fees are paid once a year for performance through June 30.
● Note that the Callan Diversified Alpha Group Trust was terminated in March 2016 and the proceeds were used to
fund Atlanta Capital in April 2016.
Pension Trust
AUM Based Fee Strategies Fee %
Callan Diversified Alpha Group Trust 0.43%
Atlanta Capital 0.18%
Weighted Average AUM Based Fee 0.62%
Industry Fee - 25th Percentile 0.73%
Industry Fee - Median 0.64%
Industry Fee - 75th Percentile 0.54%
Performance & Hybrid Fee Strategies Fee %
Parametric Clifton Enhanced Small Cap 0.50%
Total Weighted Average Fee 0.56%
Domestic Small Cap Equity

17 NDSIB Fee Analysis – FY 2016 Knowledge. Experience. Integrity.
Developed International Equity
● Developed International Equity managers invest in stocks that trade and gain exposure to developed markets
and economies outside of the U.S.
● North Dakota’s average account size for FY 2016: $122mm.
● Red circle represents NDSIB Pension Trust’s asset based weighted average developed international equity
mgmt. fee: 0.35%.
● Green boxes and diamond represent the 75th, Median, and 25th fee percentiles for the fee universe.
● Fee universe was constructed using Callan’s 2014 Investment Management Fee Survey for mandate sizes
between $100mm and $200mm.
Pension Trust
n = 16, Actual Fee Universe
0.20% 0.25% 0.30% 0.35% 0.40% 0.45% 0.50% 0.55% 0.60% 0.65%
Developed International Equity Fees
Median
Percentile
Industry Fee
NDSIB Weighted
Average Fee (Asset
Based Fee Strategies
Only)
75th and 25th
Percentile
Industry Fee

18 NDSIB Fee Analysis – FY 2016 Knowledge. Experience. Integrity.
Investment Strategies – Developed International Equity
● All managers for this asset class fall into the asset based fee category.
● Note that Capital Guardian Trust was terminated in May 2016 and the proceeds were used to fund
William Blair in June 2016
Pension Trust
AUM Based Fee Strategies Fee %
Capital Guardian Trust 0.50%
DFA International Small Cap Value 0.66%
Northern Trust World ex-US 0.03%
Wellington Intl SC Opp 0.85%
William Blair 0.03%
Weighted Average AUM Based Fee 0.35%
Industry Fee - 25th Percentile 0.60%
Industry Fee - Median 0.51%
Industry Fee - 75th Percentile 0.44%
Total Weighted Average Fee 0.35%
Developed International Equity

19 NDSIB Fee Analysis – FY 2016 Knowledge. Experience. Integrity.
Emerging Markets Equity
● Emerging Markets Equity managers invest in stocks that gain exposure to emerging market economies.
● North Dakota’s average account size: $80mm.
● Red circle represents NDSIB Pension Trust’s asset based weighted average emerging markets equity mgmt. fee:
0.82%.
● Green boxes and diamond represent the 75th, Median, and 25th fee percentiles for the fee universe.
● Fee universe was constructed using Callan’s 2014 Investment Management Fee Survey for mandate sizes
between $75mm and $100mm.
Pension Trust
n = 59, Average of Actual Fee Universe (n=3) & Published Fee Universe (n=56)
0.40% 0.50% 0.60% 0.70% 0.80% 0.90% 1.00%
Emerging Markets Equity Fees
Median
Percentile
Industry Fee
NDSIB Weighted
Average Fee (Asset
Based Fee Strategies
Only)
75th and 25th
Percentile
Industry Fee

20 NDSIB Fee Analysis – FY 2016 Knowledge. Experience. Integrity.
Investment Strategies – Emerging Markets Equity
● All managers for this asset class fall into the asset based fee category.
Pension Trust
AUM Based Fee Strategies Fee %
DFA Emerging 0.62%
Axiom 0.88%
Weighted Average AUM Based Fee 0.82%
Industry Fee - 25th Percentile 0.94%
Industry Fee - Median 0.89%
Industry Fee - 75th Percentile 0.66%
Total Weighted Average Fee 0.82%
Emerging Markets Equity

21 NDSIB Fee Analysis – FY 2016 Knowledge. Experience. Integrity.
Investment Grade Fixed Income
● Investment Grade Fixed Income managers invest in bonds and other debt instruments that are rated “investment
grade” by rating agencies and/or investment analysts.
● North Dakota’s average account size for FY 2016: $108mm.
● Red circle represents NDSIB Pension Trust’s asset based weighted average investment grade fixed income
mgmt. fee: 0.15%.
● Yellow box represents total asset class weighted average fee (asset based & performance/hybrid fees) in FY
2016: 0.39%
● Green boxes and diamond represent the 75th, Median, and 25th fee percentiles for the fee universe.
● Fee universe was constructed using Callan’s 2014 Investment Management Fee Survey for mandate sizes
between $100mm and $200mm.
Pension Trust
n = 43, Average of Actual Fee Universe (n=7) & Published Fee Universe (n=36)
0.13% 0.18% 0.23% 0.28% 0.33% 0.38% 0.43%
Investment Grade Fixed Income Fees
Median Strategy Fee
NDSIB Weighted
Average Fee (AUM Based
Fee Strategies Only)
75th and 25th Percentile
Strategy Fee
Total Asset Class
Weighted Average Fee (AUM, Performance, & Hybrid
Fee Strategies)

22 NDSIB Fee Analysis – FY 2016 Knowledge. Experience. Integrity.
Investment Strategies – Investment Grade Fixed Income
● Declaration Total Return charges an AUM Based Fee of 0.60%. 1/12 of the AUM Based fee is charged monthly.
However, fees charged on amounts in excess of $75mm are rebated back to the Pension Trust on a quarterly
basis. This rebate process is a specially negotiated arrangement made necessary by the partnership structure.
● Due to the fee structure of the funds in the Performance & Hybrid Fee Strategies category, the Total Weighted
Average Fees are not comparable to industry fees from Callan’s 2014 Investment Management Fee Survey.
– PIMCO DiSCO II charges a fee of 0.75% based on assets under management plus a performance fee. The
performance fee is 15% of the excess return above a variable hurdle rate.
Pension Trust
AUM Based Fee Strategies Fee %
SSgA Long U.S. Treasury Index 0.04%
JP Morgan MBS 0.21%
PIMCO MBS 0.17%
PIMCO Unconstrained 0.10%
Declaration Total Return 0.46%
Weighted Average AUM Based Fee 0.20%
Industry Fee - 25th Percentile 0.27%
Industry Fee - Median 0.25%
Industry Fee - 75th Percentile 0.24%
Performance & Hybrid Fee Strategies Fee %
PIMCO DiSCO II 1.46%
Total Weighted Average Fee 0.39%
Investment Grade Fixed Income
23 NDSIB Fee Analysis – FY 2016 Knowledge. Experience. Integrity.
Below Investment Grade Fixed Income
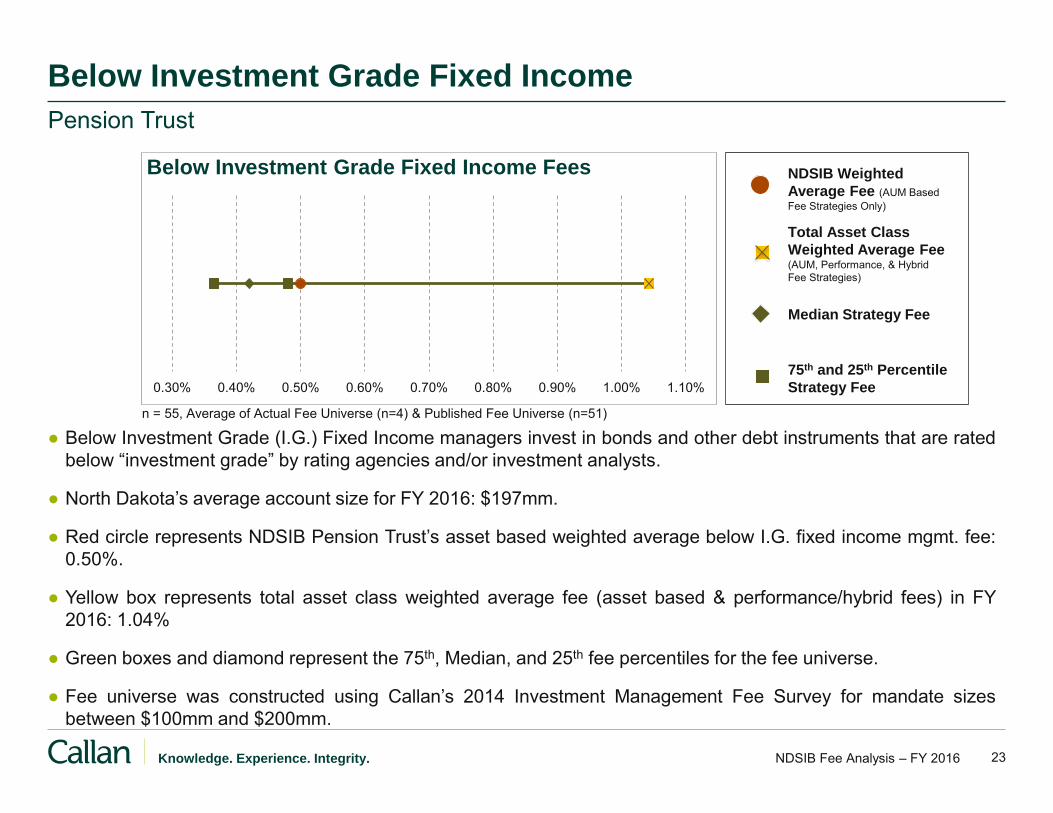
● Below Investment Grade (I.G.) Fixed Income managers invest in bonds and other debt instruments that are rated
below “investment grade” by rating agencies and/or investment analysts.
● North Dakota’s average account size for FY 2016: $197mm.
● Red circle represents NDSIB Pension Trust’s asset based weighted average below I.G. fixed income mgmt. fee:
0.50%.
● Yellow box represents total asset class weighted average fee (asset based & performance/hybrid fees) in FY
2016: 1.04%
● Green boxes and diamond represent the 75th, Median, and 25th fee percentiles for the fee universe.
● Fee universe was constructed using Callan’s 2014 Investment Management Fee Survey for mandate sizes
between $100mm and $200mm.
Pension Trust
n = 55, Average of Actual Fee Universe (n=4) & Published Fee Universe (n=51)
0.30% 0.40% 0.50% 0.60% 0.70% 0.80% 0.90% 1.00% 1.10%
Below Investment Grade Fixed Income Fees
Median Strategy Fee
NDSIB Weighted
Average Fee (AUM Based
Fee Strategies Only)
75th and 25th Percentile
Strategy Fee
Total Asset Class
Weighted Average Fee (AUM, Performance, & Hybrid
Fee Strategies)

24 NDSIB Fee Analysis – FY 2016 Knowledge. Experience. Integrity.
Investment Strategies – Below Investment Grade Fixed Income
● Due to the fee structure of the funds in the Performance & Hybrid Fee Strategies category, the Total Weighted
Average Fees are not comparable to industry fees from Callan’s 2014 Investment Management Fee Survey.
– Both Goldman Sachs investment products charge a management fee of 1.5% based on the original
commitment plus a performance-based fee. No performance fee was charged for the 2006 Offshore fund.
– PIMCO Bravo Fund II charges a fee of 1.45% based on assets under management plus a performance fee.
The performance fee is 20% of excess returns over a “preferred” return of 8%.
Pension Trust
AUM Based Fee Strategies Fee %
Loomis Sayles 0.50%
Weighted Average AUM Based Fee 0.50%
Industry Fee - 25th Percentile 0.48%
Industry Fee - Median 0.42%
Industry Fee - 75th Percentile 0.37%
Performance & Hybrid Fee Strategies Fee %
Goldman Sachs 2006 Offshore 1.27%
Goldman Sachs V Offshore 8.13%
PIMCO Bravo Fund II 3.05%
Total Weighted Average Fee 1.04%
Below Investment Grade Fixed Income

25 NDSIB Fee Analysis – FY 2016 Knowledge. Experience. Integrity.
International Fixed Income
● International Fixed Income managers invest in bonds and other debt instruments that gain exposure to foreign
entities and currencies that typically trade outside the U.S.
● North Dakota’s average account size for FY 2016: $118mm.
● Red circle represents NDSIB Pension Trust’s asset based weighted average international fixed income mgmt.
fee: 0.35%.
● Green boxes and diamond represent the 75th, Median, and 25th fee percentiles for the fee universe.
● Fee universe was constructed using published active management fee schedules from Callan’s International
Fixed Income Peer Group, using a mandate size between $100mm and $200mm.
Pension Trust
n = 81, Published Fee Universe
0.30% 0.33% 0.35% 0.38% 0.40% 0.43% 0.45% 0.48% 0.50%
International Fixed Income Fees
Median
Percentile
Industry Fee
NDSIB Weighted
Average Fee (Asset
Based Fee Strategies
Only)
75th and 25th
Percentile
Industry Fee

26 NDSIB Fee Analysis – FY 2016 Knowledge. Experience. Integrity.
Investment Strategies – International Fixed Income
Pension Trust
● All managers for this asset class fall into the asset based fee category.
AUM Based Fee Strategies Fee %
Brandywine 0.38%
UBS Global Asset Management 0.32%
Weighted Average AUM Based Fee 0.35%
Industry Fee - 25th Percentile 0.50%
Industry Fee - Median 0.38%
Industry Fee - 75th Percentile 0.31%
Total Weighted Average Fee 0.35%
International Fixed Income

27 NDSIB Fee Analysis – FY 2016 Knowledge. Experience. Integrity.
Real Estate
● Real Estate managers invest directly in real properties (e.g. offices, multi-family, retail, and other physical
properties) and securities that gain access to such economic interests.
● North Dakota’s average account size: $195mm.
● Red circle represents NDSIB Pension Trust’s asset based weighted average real estate mgmt. fee: 0.62%.
● Yellow box represents total asset class weighted average fee (asset based & performance/hybrid fees) in FY
2016: 0.96%.
● Green boxes and diamond represent the 75th, Median, and 25th fee percentiles for the fee universe.
● Fee universe was constructed using published fee schedules from Callan’s Real Estate Manager Peer Group,
using a mandate size between $100mm and $200mm.
Pension Trust
n = 29, Published Fee Universe
0.60% 0.65% 0.70% 0.75% 0.80% 0.85% 0.90% 0.95% 1.00%
Real Estate Fees
Median Strategy Fee
NDSIB Weighted
Average Fee (AUM Based
Fee Strategies Only)
75th and 25th Percentile
Strategy Fee
Total Asset Class
Weighted Average Fee (AUM, Performance, & Hybrid
Fee Strategies)

28 NDSIB Fee Analysis – FY 2016 Knowledge. Experience. Integrity.
Investment Strategies – Real Estate
● Due to the fee structure of the funds in the Performance & Hybrid Fee Strategies category, the Total Weighted
Average Fees are not comparable to industry fees from Callan’s 2014 Investment Management Fee Survey.
– Invesco Real Estate Fund II, Invesco Real Estate Fund III, Invesco Asia RE Feeder Fund, Invesco Asia RE
Fund III, and Invesco Valued Added Fund IV each charge a base management fee on assets and charges a
performance fee of 20% for performance exceeding a “preferred” return set by each fund.
– The JP Morgan Greater China Fund and JP Morgan Greater European Opportunity Fund each charge a base
management fee on assets and then charges a sliding scale performance fee for performance exceeding a
series of “preferred” returns set by each fund.
– The JP Morgan Alternative Fund is currently being liquidated. The manager is not presently charging a fee to
manage this fund during liquidation.
Pension Trust
AUM Based Fee Strategies Fee %
INVESCO Core Real Estate 0.34%
JP Morgan Special & Strategic 0.95%
Weighted Average AUM Based Fee 0.62%
Industry Fee - 25th Percentile 0.93%
Industry Fee - Median 0.86%
Industry Fee - 75th Percentile 0.80%
Real Estate
Performance & Hybrid Fee Strategies Fee %
INVESCO Real Estate Fund II 0.50%
INVESCO Real Estate Fund III 4.45%
INVESCO Asia RE Feeder 2.48%
INVESCO Asia RE Fund III 0.99%
INVESCO Value Added Fund IV 2.74%
J.P. Morgan Alternative Property Fd. 0.00%
JP Morgan Greater China Fund 0.73%
JP Morgan Greater European Opp 0.63%
Real Estate
Total Weighted Average Fee 0.96%

29 NDSIB Fee Analysis – FY 2016 Knowledge. Experience. Integrity.
Investment Strategies – Real Assets
● Due to the highly varied and customized approach of strategies in these asset classes, Callan cannot produce
reasonable industry fee universes for comparison.
– TIR Teredo and Springbank charge a base management fee on assets and charge a performance fee for
performance exceeding a “preferred” return set by each fund.
– The total asset class weighted average fee for Timber for FY 2016 was -1.31%. The negative fee represents a
rebate of incentive fees from the Springbank portfolio as a result of a miscalculation of prior period incentive
fees.
– The Grosvenor Infrastructure Fund I and II charge a base management fee on assets and charge a
performance fee for performance exceeding a “preferred” return set by each fund.
– JP Morgan Asian Infrastructure and Infrastructure Investment Funds charge a base management fee on assets
and charge a performance fee for performance exceeding a “preferred” return set by each fund.
Pension Trust
Real Assets
Timber Fee %
TIR - Teredo 0.58%
TIR - Springbank -1.96%
Weighted Average Timber Fee -1.31%
Infrastructure Fee %
JP Morgan Asian Infrastructure 1.55%
JP Morgan Infrastructure Inv. Fund 0.90%
Grosvenor Infrastructure Fund I 0.97%
Grosvenor Infrastructure Fund II 2.96%
Weighted Average Infrastructure Fee 1.05%
Total Weighted Average Fee 0.05%

30 NDSIB Fee Analysis – FY 2016 Knowledge. Experience. Integrity.
Investment Strategies – Private Equity
● Due to the highly varied and customized approach of Private Equity strategies, Callan cannot produce a
reasonable industry fee universe for comparison.
● At the end of fiscal year 2016 private equity accounted for 3.37% of Total Fund assets.
● Total asset class weighted average fee for FY 2016: 1.80%
● Similar to the fiscal 2014 fee study, the management fees for NDSIB’s private equity portfolio are at levels for
similar strategies and are in line with industry norms.
Pension Trust

31 NDSIB Fee Analysis – FY 2016 Knowledge. Experience. Integrity.
Investment Strategies – Cash
● The manager for this asset class fall into the asset based fee category.
● Fees for cash management are typically below 20 basis points (0.20%). Fees paid by the North Dakota State
Investment Board’s Pension Trust cash management are well within industry norms.
Pension Trust
Cash
Northern Trust Cash 0.11%

Insurance Trust

33 NDSIB Fee Analysis – FY 2016 Knowledge. Experience. Integrity.
Insurance Trust
● Total Equity Manager fees paid represented a mix of asset-based and performance/hybrid fee strategies. In
aggregate all equity strategy composites had fees below their respective 75th percentiles.
– Total Domestic Large Cap Equity fees were well below the 75th percentile
– Total Small Cap Equity fees were well below the 75th percentile with asset-based fees even lower
– Total Developed International Equity fees were well below the 75th percentile and represented only asset-based fee strategies
● Total Domestic Fixed Income Manager fees paid represented a mix of asset-based and performance/hybrid fee
strategies.
– Total Domestic Fixed Income fees paid were above the 25th percentile, driven largely by performance/hybrid fee based strategies
while total asset based fee strategies were well below the 75th percentile
● Diversified Real Assets Manager fees paid represented a mix of asset-based and performance/hybrid fee
strategies spanning public and private markets. Asset based fee strategies fell below the 75th percentile with
performance/hybrid fee strategies pushing the total fees paid well above the 25th percentile.
– Due to the custom nature of non-core public strategies and their closed-end fund structures, there is no applicable manager fee
distribution and so it presents a skew to the asset-based fee universe for the comparison
● Total Real Estate manager fees paid represented asset based fee strategies only.
– Total Real Estate manager fees paid were well below the 75th percentile
● Short-term Fixed Income manager fees paid represented asset based fee strategies only.
– Fees paid fell below the strategy universe median
NDSIB Fee Study Fiscal Year 2016 Executive Summary

34 NDSIB Fee Analysis – FY 2016 Knowledge. Experience. Integrity.
Domestic Large Cap Equity
● Large Cap Equity managers invest in large company stocks that are typically listed within the U.S.
● North Dakota’s average account size for FY 2016: $68mm.
● Red circle represents NDSIB Insurance Trust’s asset based weighted average large cap equity mgmt. fee:
0.26%.
● Yellow box represents total asset class weighted average fee (asset based & performance/hybrid fees) in FY
2016: 0.28%.
● Green boxes and diamond represent the 75th, Median, and 25th fee percentiles for the fee universe.
● Fee universe was constructed using Callan’s 2014 Investment Management Fee Survey for mandate sizes
between $50mm and $75mm.
Insurance Trust
n = 347, Average of Actual Fee Universe (n=7) & Published Fee Universe (n=340)
0.10% 0.20% 0.30% 0.40% 0.50% 0.60% 0.70%
Domestic Large Cap Fees
Median Strategy Fee
NDSIB Weighted
Average Fee (AUM Based
Fee Strategies Only)
75th and 25th Percentile
Strategy Fee
Total Asset Class
Weighted Average Fee (AUM, Performance, & Hybrid
Fee Strategies)

35 NDSIB Fee Analysis – FY 2016 Knowledge. Experience. Integrity.
Investment Strategies – Domestic Large Cap Equity
● Due to the fee structure of the funds in the Performance & Hybrid Fee Strategies category, the Total Weighted
Average Fees are not comparable to industry fees from Callan’s 2014 Investment Management Fee Survey.
– L.A. Capital Enhanced Index charges a base management fee on all assets under management. A
performance-based fee of 20% of returns in excess of the benchmark return is charged on approximately 40%
of the assets.
– Parametric Clifton Enhanced Index charges no base management fee. The manager is paid 35% of any
excess return above the benchmark. Fees are paid annually for performance through June 30.
Insurance Trust
AUM Based Fee Strategies Fee %
L.A. Capital Growth 0.21%
LSV Asset Management 0.30%
Weighted Average AUM Based Fee 0.26%
Industry Fee - 25th Percentile 0.65%
Industry Fee - Median 0.51%
Industry Fee - 75th Percentile 0.44%
Performance & Hybrid Fee Strategies Fee %
L.A. Capital Enhanced Index 0.43%
Parametric Clifton Enhanced S&P 500 0.20%
Total Weighted Average Fee 0.28%
Domestic Large Cap Equity
36 NDSIB Fee Analysis – FY 2016 Knowledge. Experience. Integrity.
Domestic Small Cap Equity
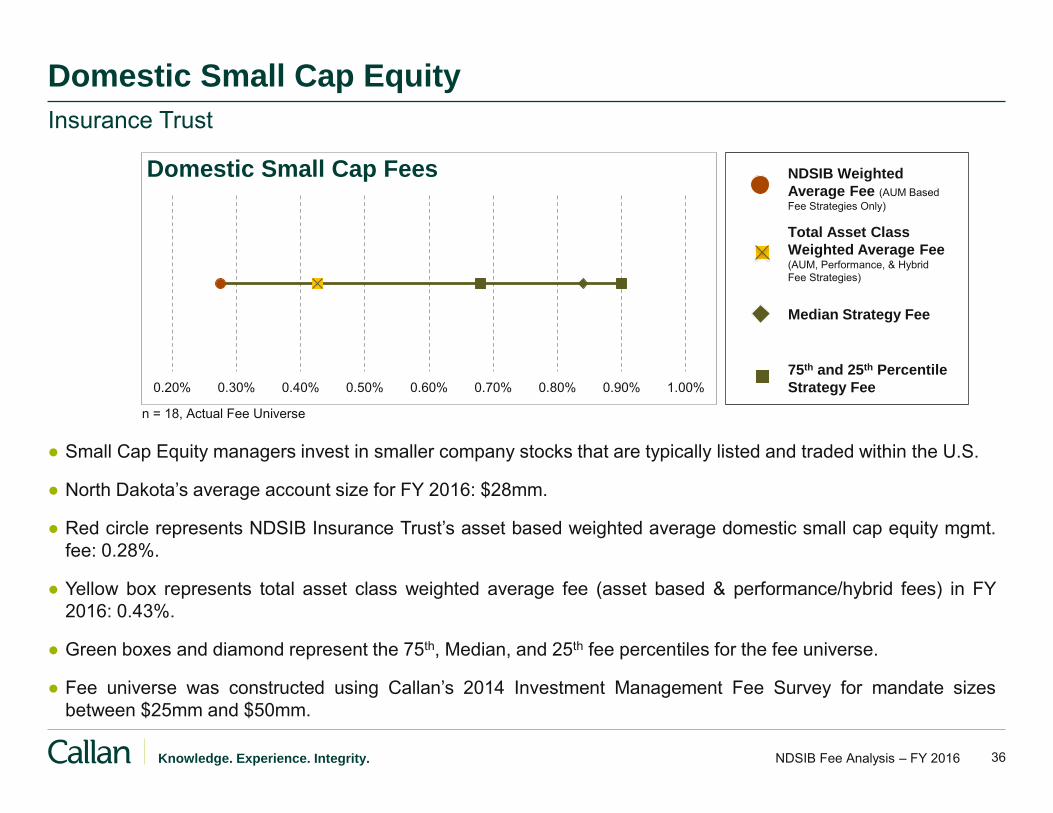
● Small Cap Equity managers invest in smaller company stocks that are typically listed and traded within the U.S.
● North Dakota’s average account size for FY 2016: $28mm.
● Red circle represents NDSIB Insurance Trust’s asset based weighted average domestic small cap equity mgmt.
fee: 0.28%.
● Yellow box represents total asset class weighted average fee (asset based & performance/hybrid fees) in FY
2016: 0.43%.
● Green boxes and diamond represent the 75th, Median, and 25th fee percentiles for the fee universe.
● Fee universe was constructed using Callan’s 2014 Investment Management Fee Survey for mandate sizes
between $25mm and $50mm.
Insurance Trust
n = 18, Actual Fee Universe
0.20% 0.30% 0.40% 0.50% 0.60% 0.70% 0.80% 0.90% 1.00%
Domestic Small Cap Fees
Median Strategy Fee
NDSIB Weighted
Average Fee (AUM Based
Fee Strategies Only)
75th and 25th Percentile
Strategy Fee
Total Asset Class
Weighted Average Fee (AUM, Performance, & Hybrid
Fee Strategies)

37 NDSIB Fee Analysis – FY 2016 Knowledge. Experience. Integrity.
Investment Strategies – Domestic Small Cap Equity
● Due to the fee structure of the funds in the Performance & Hybrid Fee Strategies category, the Total Weighted
Average Fees are not comparable to industry fees from Callan’s 2014 Investment Management Fee Survey.
– Parametric Clifton Small Cap Enhanced Index charges no base management fee. The only fee charged is 35%
of the excess return generated over the benchmark. Fees are paid once a year for performance through June
30.
Insurance Trust
AUM Based Fee Strategies Fee %
PIMCO (Research Affiliates) 0.28%
Weighted Average AUM Based Fee 0.28%
Industry Fee - 25th Percentile 0.90%
Industry Fee - Median 0.84%
Industry Fee - 75th Percentile 0.68%
Performance & Hybrid Fee Strategies Fee %
Parametric Clifton Enhanced Index 0.51%
Total Weighted Average Fee 0.43%
Domestic Small Cap Equity

38 NDSIB Fee Analysis – FY 2016 Knowledge. Experience. Integrity.
Developed International Equity
● Developed International Equity managers invest in stocks that trade and gain exposure to developed markets
and economies outside of the U.S.
● North Dakota’s average account size for FY 2016: $41mm.
● Red circle represents NDSIB Insurance Trust’s asset based weighted average developed int’l equity mgmt. fee:
0.45%.
● Green boxes and diamond represent the 75th, Median, and 25th fee percentiles for the fee universe.
● Fee universe was constructed using Callan’s 2014 Investment Management Fee Survey for mandate sizes
between $25mm and $50mm.
Insurance Trust
n = 122, Average of Actual Fee Universe (n=6) & Published Fee Universe (n=116)
0.20% 0.30% 0.40% 0.50% 0.60% 0.70%
International Equity Fees
Median
Percentile
Industry Fee
NDSIB Weighted
Average Fee (Asset
Based Fee Strategies
Only)
75th and 25th
Percentile
Industry Fee

39 NDSIB Fee Analysis – FY 2016 Knowledge. Experience. Integrity.
Investment Strategies – Developed International Equity
Insurance Trust
● All managers for this asset class fall into the asset based fee category.
● Note that Capital Guardian Trust was terminated in May 2016 and the proceeds were used to fund William Blair
in June 2016.
AUM Based Fee Strategies Fee %
Capital Guardian 0.59%
DFA Int'l Small Cap 0.65%
LSV Asset Management 0.39%
Vanguard Int'l Explorer Fund 0.35%
William Blair 0.04%
Weighted Average AUM Based Fee 0.45%
Industry Fee - 25th Percentile 0.66%
Industry Fee - Median 0.63%
Industry Fee - 75th Percentile 0.58%
Total Weighted Average Fee 0.45%
International Equity

40 NDSIB Fee Analysis – FY 2016 Knowledge. Experience. Integrity.
Domestic Fixed Income
● Domestic Fixed Income managers invest in bonds and other debt instruments.
● North Dakota’s average account size for FY 2016: $184mm.
● Red circle represents NDSIB Insurance Trust’s asset based weighted average domestic fixed income mgmt. fee:
0.18%.
● Yellow box represents total asset class weighted average fee (asset based & performance/hybrid fees) in FY
2016: 0.40%.
● Green boxes and diamond represent the 75th, Median, and 25th fee percentiles for the fee universe.
● Fee universe was constructed using Callan’s 2014 Investment Management Fee Survey for mandate sizes
between $100mm and $200mm.
Insurance Trust
n = 43, Average of Actual Fee Universe (n=7) & Published Fee Universe (n=36)
0.15% 0.20% 0.25% 0.30% 0.35% 0.40% 0.45%
Domestic Fixed Income Fees
Median Strategy Fee
NDSIB Weighted
Average Fee (AUM Based
Fee Strategies Only)
75th and 25th Percentile
Strategy Fee
Total Asset Class
Weighted Average Fee (AUM, Performance, & Hybrid
Fee Strategies)

41 NDSIB Fee Analysis – FY 2016 Knowledge. Experience. Integrity.
Investment Strategies – Domestic Fixed Income
● Due to the fee structure of the funds in the Performance & Hybrid Fee Strategies category, the Total Weighted
Average Fees are not comparable to industry fees from Callan’s 2014 Investment Management Fee Survey.
– PIMCO DiSCO II charges a fee of 0.75% based on assets under management plus a performance fee. The
performance fee is 15% of the excess return above a variable hurdle rate.
– PIMCO Bravo Fund II charges a fee of 1.45% based on assets under management plus a performance fee.
The performance fee is 20% of excess returns over a “preferred” return of 8%.
– The Legacy Fund participates in the two PIMCO Funds within the Insurance Trust.
Insurance Trust
AUM Based Fee Strategies Fee %
Declaration of Total Return 0.46%
Prudential 0.27%
SSgA U.S. Govt Credit Bond Index 0.03%
Wells Capital 0.18%
Western Asset Management 0.14%
Weighted Average AUM Based Fee 0.18%
Industry Fee - 25th Percentile 0.27%
Industry Fee - Median 0.25%
Industry Fee - 75th Percentile 0.24%
Performance & Hybrid Fee Strategies Fee %
PIMCO DiSCO II 1.46%
PIMCO Bravo II 3.05%
Total Weighted Average Fee 0.40%
Domestic Fixed Income

42 NDSIB Fee Analysis – FY 2016 Knowledge. Experience. Integrity.
Diversified Real Assets
● Diversified Real Assets managers invest in assets that are expected to perform well during periods of inflation.
● North Dakota’s average account size: $110mm.
● Red circle represents NDSIB Insurance Trust’s asset based weighted average domestic fixed income mgmt. fee:
0.14%.
● Yellow box represents total asset class weighted average fee (asset based & performance/hybrid fees) in FY
2016: 0.57%.
● Green boxes and diamond represent the 75th, Median, and 25th fee percentiles for the fee universe.
● Fee universe was constructed using Callan’s 2014 Investment Management Fee Survey for mandate sizes
between $100mm and $200mm.
Insurance Trust
n = 11, Actual Fee Universe
0.12% 0.20% 0.28% 0.36% 0.44% 0.52% 0.60%
Diversified Real Assets Fees
Median Strategy Fee
NDSIB Weighted
Average Fee (AUM Based
Fee Strategies Only)
75th and 25th Percentile
Strategy Fee
Total Asset Class
Weighted Average Fee (AUM, Performance, & Hybrid
Fee Strategies)

43 NDSIB Fee Analysis – FY 2016 Knowledge. Experience. Integrity.
Investment Strategies – Diversified Real Assets
● Due to the fee structure of the funds in the Performance & Hybrid Fee Strategies category, the Total Weighted
Average Fees are not comparable to industry fees from Callan’s 2014 Investment Management Fee Survey.
– JP Morgan Infrastructure Fund charges a base management fee on assets and charges a performance fee for
performance exceeding a “preferred” return set by the fund.
– Grosvenor Infrastructure Fund I charges a base management fee on assets and charges a performance fee for
performance exceeding a “preferred” return set by the fund.
– TIR Easter Timber Opportunities Fund charges a base management fee on assets and charges a performance
fee for performance exceeding a “preferred” return set by the fund.
Insurance Trust
AUM Based Fee Strategies Fee %
Western Asset Management 0.14%
Weighted Average AUM Based Fee 0.14%
Industry Fee - 25th Percentile 0.23%
Industry Fee - Median 0.19%
Industry Fee - 75th Percentile 0.16%
Performance & Hybrid Fee Strategies Fee %
JP Morgan Infrastructure 0.90%
Grosvenor Infrastructure Fund I 0.97%
TIR - Eastern Timber Opportunities 0.82%
Total Weighted Average Fee 0.57%
Diversified Real Assets

44 NDSIB Fee Analysis – FY 2016 Knowledge. Experience. Integrity.
Real Estate
● Real Estate managers invest directly in real properties (e.g. offices, multi-family, retail, and other physical
properties) and securities that gain access to such economic interests.
● North Dakota’s average account size: $63mm.
● Red circle represents NDSIB Insurance Trust’s asset based weighted average real estate mgmt. fee: 0.72%.
● Green boxes and diamond represent the 75th, Median, and 25th fee percentiles for the fee universe.
● Fee universe was constructed using published fee schedules from Callan’s Real Estate Manager Peer Group,
using a mandate size between $50mm and $75mm.
Insurance Trust
n = 29, Published Fee Universe
0.70% 0.75% 0.80% 0.85% 0.90% 0.95%
Real Estate Fees
Median
Percentile
Industry Fee
NDSIB Weighted
Average Fee (Asset
Based Fee Strategies
Only)
75th and 25th
Percentile
Industry Fee

45 NDSIB Fee Analysis – FY 2016 Knowledge. Experience. Integrity.
Investment Strategies – Real Estate
Insurance Trust
● All managers for this asset class fall into the asset based fee category.
AUM Based Fee Strategies Fee %
Invesco Core Real Estate 0.34%
JP Morgan Real Estate 1.05%
Weighted Average AUM Based Fee 0.72%
Industry Fee - 25th Percentile 0.95%
Industry Fee - Median 0.95%
Industry Fee - 75th Percentile 0.85%
Total Weighted Average Fee 0.72%
Real Estate

46 NDSIB Fee Analysis – FY 2016 Knowledge. Experience. Integrity.
Short Term Fixed Income
● Short Term Fixed Income managers invest in bonds that have short maturity dates.
● North Dakota’s average account size for FY 2016: $253mm.
● Red circle represents NDSIB Insurance Trust’s asset based weighted average short-term fixed income mgmt.
fee: 0.14%.
● Green boxes and diamond represent the 75th, Median, and 25th fee percentiles for the fee universe.
● Fee universe was constructed using Callan’s 2014 Investment Management Fee Survey for mandate sizes
greater than $200mm.
Insurance Trust
0.08% 0.11% 0.14% 0.17% 0.20%
Short Term Fixed Income Fees
n = 38, Actual Fee Universe
Median
Percentile
Industry Fee
NDSIB Weighted
Average Fee (Asset
Based Fee Strategies
Only)
75th and 25th
Percentile
Industry Fee

47 NDSIB Fee Analysis – FY 2016 Knowledge. Experience. Integrity.
Investment Strategies – Short Term Fixed Income & Cash
● All managers for this asset class fall into the asset based fee category.
● Fees for cash management are typically below 20 basis points (0.20%). Fees paid by the North Dakota State
Investment Board’s Insurance Trust cash and short-term fixed income management are well within industry
norms.
● Note that the Legacy Fund cash allocation is included in the Insurance Trust Cash Account.
Insurance Trust
AUM Based Fee Strategies Fee %
JPM Short Term 0.11%
Babson Short Term 0.17%
Weighted Average AUM Based Fee 0.14%
Industry Fee - 25th Percentile 0.19%
Industry Fee - Median 0.15%
Industry Fee - 75th Percentile 0.10%
Total Weighted Average Fee 0.14%
Short Term Fixed Income
AUM Based Fee Strategies Fee %
Northern Trust Cash Account 0.14%
Weighted Average AUM Based Fee 0.14%
Total Weighted Average Fee 0.14%
Cash & Equivalents

Legacy Fund

49 NDSIB Fee Analysis – FY 2016 Knowledge. Experience. Integrity.
Legacy Trust
● Total Equity Manager fees paid represented a mix of asset-based and performance/hybrid fee strategies.
– Total Domestic Large Cap Equity fees were just above median being pushed up slightly by performance based fee strategies
– Total Small Cap Equity fees were well below the 75th percentile with asset-based fee strategies lower than performance/hybrid
based fee strategies
– Developed International Equity fees were below the 75th percentile and represented only asset-based fee strategies
● Total Domestic Fixed Income Manager fees paid represented asset based fee strategies only.
– Total Domestic Fixed Income fees paid were below median but above the 75th percentile
● Diversified Real Assets Manager fees paid represented a mix of asset-based and performance/hybrid fee
strategies spanning public and private markets. Asset based fee strategies fell below median with
performance/hybrid fee strategies pushing the total fees paid well above the 25th percentile.
– Due to the custom nature of the private strategies and their closed-end fund structures, there is no applicable manager fee
distribution and so it presents a skew to the asset-based fee universe for the comparison
● Total Real Estate manager fees paid represented asset based fee strategies only.
– Total Real Estate manager fees paid were well below the 75th percentile
NDSIB Fee Study Fiscal Year 2016 Executive Summary

50 NDSIB Fee Analysis – FY 2016 Knowledge. Experience. Integrity.
Domestic Large Cap Equity
● Domestic Large Cap Equity managers invest in large company stocks that are typically listed within the U.S.
● North Dakota’s average account size for FY 2016: $233mm.
● Red circle represents NDSIB Legacy Fund’s asset based weighted average large cap equity mgmt. fee: 0.25%.
● Yellow box represents total asset class weighted average fee (asset based & performance/hybrid fees) in FY
2016: 0.27%.
● Green boxes and diamond represent the 75th, Median, and 25th fee percentiles for the fee universe.
● Fee universe was constructed using Callan’s 2014 Investment Management Fee Survey for mandate sizes of
greater than $200mm.
Legacy Fund
n = 83, Actual Fee Universe
0.10% 0.15% 0.20% 0.25% 0.30% 0.35% 0.40%
Domestic Large Cap Fees
Median Strategy Fee
NDSIB Weighted
Average Fee (AUM Based
Fee Strategies Only)
75th and 25th Percentile
Strategy Fee
Total Asset Class
Weighted Average Fee (AUM, Performance, & Hybrid
Fee Strategies)

51 NDSIB Fee Analysis – FY 2016 Knowledge. Experience. Integrity.
Investment Strategies – Domestic Large Cap Equity
Legacy Fund
● Due to the fee structure of the funds in the Performance & Hybrid Fee Strategies category, the Total Weighted
Average Fees are not comparable to industry fees from Callan’s 2014 Investment Management Fee Survey.
– L.A. Capital Enhanced Index charges a base management fee on all assets under management. A
performance-based fee of 20% of returns in excess of the benchmark return is charged on approximately 40%
of the assets.
– Parametric Clifton Enhanced Index charges no base management fee. The manager is paid 35% of any
excess return above the benchmark. Fees are paid annually for performance through June 30.
AUM Based Fee Strategies Fee %
L.A. Capital Growth 0.21%
LSV Asset Management 0.29%
Weighted Average AUM Based Fee 0.25%
Industry Fee - 25th Percentile 0.35%
Industry Fee - Median 0.25%
Industry Fee - 75th Percentile 0.20%
Performance & Hybrid Fee Strategies Fee %
L.A. Capital Enhanced Index 0.33%
Parametric Clifton Enhanced S&P 500 0.26%
Total Weighted Average Fee 0.27%
Domestic Large Cap Equity

52 NDSIB Fee Analysis – FY 2016 Knowledge. Experience. Integrity.
Domestic Small Cap Equity
● Small Cap Equity managers invest in smaller company stocks that are typically listed and traded within the U.S.
● North Dakota’s average account size for FY 2016: $117mm.
● Red circle represents NDSIB Legacy Fund’s asset based weighted average domestic small cap equity mgmt.
fee: 0.27%.
● Yellow box represents total asset class weighted average fee (asset based & performance/hybrid fees) in FY
2016: 0.43%.
● Green boxes and diamond represent the 75th, Median, and 25th fee percentiles for the fee universe.
● Fee universe was constructed using Callan’s 2014 Investment Management Fee Survey for mandate sizes
between $100mm and $200mm.
Legacy Fund
n = 29, Actual Fee Universe
0.20% 0.30% 0.40% 0.50% 0.60% 0.70% 0.80%
Domestic Small Cap Fees
Median Strategy Fee
NDSIB Weighted
Average Fee (AUM Based
Fee Strategies Only)
75th and 25th Percentile
Strategy Fee
Total Asset Class
Weighted Average Fee (AUM, Performance, & Hybrid
Fee Strategies)

53 NDSIB Fee Analysis – FY 2016 Knowledge. Experience. Integrity.
Investment Strategies – Domestic Small Cap Equity
Legacy Fund
● Due to the fee structure of the funds in the Performance & Hybrid Fee Strategies category, the Total Weighted
Average Fees are not comparable to industry fees from Callan’s 2014 Investment Management Fee Survey.
– Parametric Clifton Small Cap Enhanced Index charges no base management fee. The only fee charged is 35%
of the excess return generated over the benchmark. Fees are paid once a year for performance through June
30.
AUM Based Fee Strategies Fee %
PIMCO (Research Affiliates) 0.27%
Weighted Average AUM Based Fee 0.27%
Industry Fee - 25th Percentile 0.73%
Industry Fee - Median 0.64%
Industry Fee - 75th Percentile 0.54%
Performance & Hybrid Fee Strategies Fee %
Parametric Clifton Enhanced Index 0.55%
Total Weighted Average Fee 0.43%
Domestic Small Cap Equity

54 NDSIB Fee Analysis – FY 2016 Knowledge. Experience. Integrity.
Developed International Equity
● Developed International Equity managers invest in stocks that trade and gain exposure to developed markets
and economies outside of the U.S.
● North Dakota’s average account size for FY 2016: $176mm.
● Red circle represents NDSIB Legacy Fund’s asset based weighted average developed international equity mgmt.
fee: 0.40%.
● Green boxes and diamond represent the 75th, Median, and 25th fee percentiles for the fee universe.
● Fee universe was constructed using Callan’s 2014 Investment Management Fee Survey for mandate sizes
between $100mm and $200mm.
Legacy Fund
n = 16, Actual Fee Universe
0.20% 0.25% 0.30% 0.35% 0.40% 0.45% 0.50% 0.55% 0.60% 0.65%
International Equity Fees
Median
Percentile
Industry Fee
NDSIB Weighted
Average Fee (Asset
Based Fee Strategies
Only)
75th and 25th
Percentile
Industry Fee

55 NDSIB Fee Analysis – FY 2016 Knowledge. Experience. Integrity.
Investment Strategies – Developed International Equity
Legacy Fund
● All managers for this asset class fall into the asset based fee category.
● Note that Capital Guardian Trust was terminated in May 2016 and the proceeds were used to fund William Blair
in June 2016.
AUM Based Fee Strategies Fee %
Capital Guardian 0.45%
DFA Int'l Small Cap 0.65%
LSV Asset Management 0.38%
Vanguard Int'l Explorer Fund 0.35%
William Blair 0.04%
Weighted Average AUM Based Fee 0.40%
Industry Fee - 25th Percentile 0.60%
Industry Fee - Median 0.51%
Industry Fee - 75th Percentile 0.44%
Total Weighted Average Fee 0.40%
International Equity
56 NDSIB Fee Analysis – FY 2016 Knowledge. Experience. Integrity.
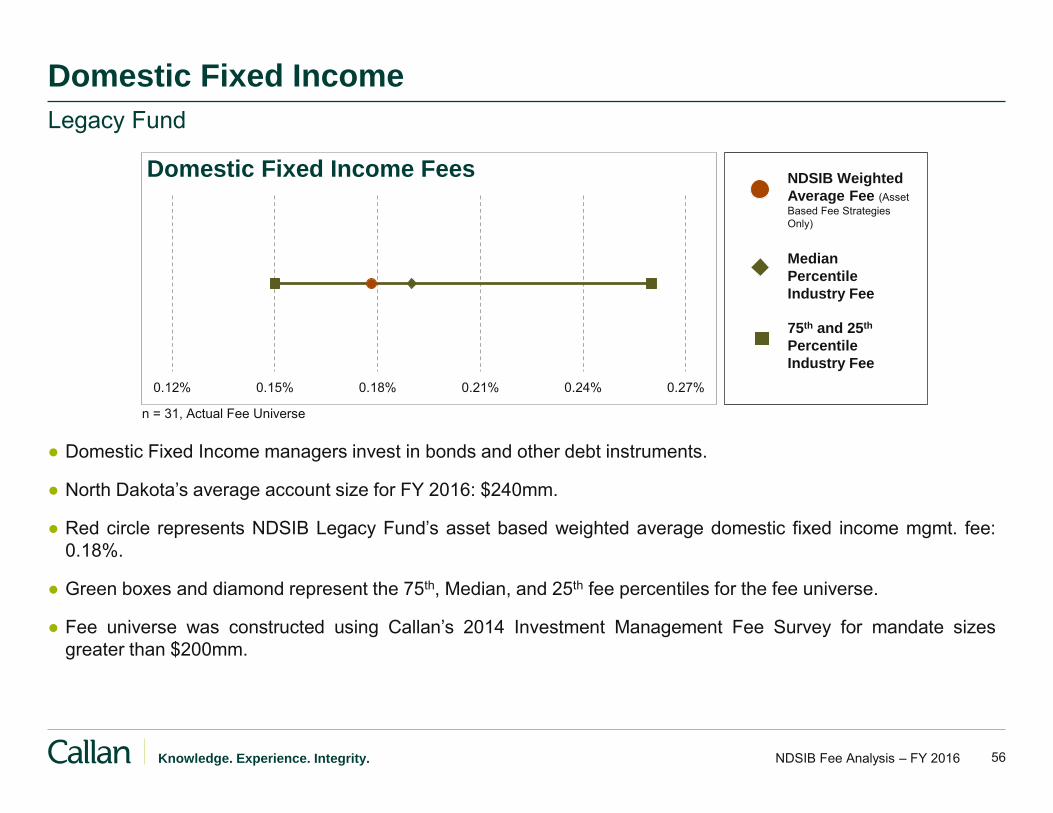
Domestic Fixed Income
● Domestic Fixed Income managers invest in bonds and other debt instruments.
● North Dakota’s average account size for FY 2016: $240mm.
● Red circle represents NDSIB Legacy Fund’s asset based weighted average domestic fixed income mgmt. fee:
0.18%.
● Green boxes and diamond represent the 75th, Median, and 25th fee percentiles for the fee universe.
● Fee universe was constructed using Callan’s 2014 Investment Management Fee Survey for mandate sizes
greater than $200mm.
Legacy Fund
0.12% 0.15% 0.18% 0.21% 0.24% 0.27%
Domestic Fixed Income Fees
n = 31, Actual Fee Universe
Median
Percentile
Industry Fee
NDSIB Weighted
Average Fee (Asset
Based Fee Strategies
Only)
75th and 25th
Percentile
Industry Fee

57 NDSIB Fee Analysis – FY 2016 Knowledge. Experience. Integrity.
Investment Strategies – Domestic Fixed Income
Legacy Fund
● All managers for this asset class fall into the asset based fee category.
AUM Based Fee Strategies Fee %
Declaration of Total Return 0.45%
Prudential 0.27%
SSgA U.S. Govt Credit Bond Index 0.03%
Wells Capital 0.18%
Western Asset Management 0.14%
Weighted Average AUM Based Fee 0.18%
Industry Fee - 25th Percentile 0.26%
Industry Fee - Median 0.19%
Industry Fee - 75th Percentile 0.15%
Total Weighted Average Fee 0.18%
Domestic Fixed Income

58 NDSIB Fee Analysis – FY 2016 Knowledge. Experience. Integrity.
Diversified Real Assets
● Diversified Real Assets managers invest in assets that are expected to perform well during periods of inflation.
● North Dakota’s average account size: $263mm.
● Red circle represents NDSIB Legacy Fund’s asset based weighted average Diversified Real Assets mgmt. fee:
0.14%.
● Yellow box represents total asset class weighted average fee (asset based & performance/hybrid fees) in FY
2016: 0.41%.
● Green boxes and diamond represent the 75th, Median, and 25th fee percentiles for the fee universe.
● Fee universe was constructed using Callan’s 2014 Investment Management Fee Survey for mandate sizes
greater than $200mm.
Legacy Fund
n = 31, Actual Fee Universe
0.10% 0.18% 0.26% 0.34% 0.42%
Diversified Real Assets Fees
Median Strategy Fee
NDSIB Weighted
Average Fee (AUM Based
Fee Strategies Only)
75th and 25th Percentile
Strategy Fee
Total Asset Class
Weighted Average Fee (AUM, Performance, & Hybrid
Fee Strategies)

59 NDSIB Fee Analysis – FY 2016 Knowledge. Experience. Integrity.
Investment Strategies – Diversified Real Assets
Legacy Fund
● Due to the fee structure of the funds in the Performance & Hybrid Fee Strategies category, the Total Weighted
Average Fees are not comparable to industry fees from Callan’s 2014 Investment Management Fee Survey.
● The infrastructure universe is too small to make an appropriate comparison of fees.
– JP Morgan Infrastructure Fund charges a base management fee on assets and charges a performance fee for
performance exceeding a “preferred” return set by the fund.
– Grosvenor Infrastructure Fund II charges a base management fee on assets and charges a performance fee
for performance exceeding a “preferred” return set by the fund.
AUM Based Fee Strategies Fee %
Western Asset Management 0.14%
Weighted Average AUM Based Fee 0.14%
Industry Fee - 25th Percentile 0.19%
Industry Fee - Median 0.15%
Industry Fee - 75th Percentile 0.10%
Performance & Hybrid Fee Strategies Fee %
JP Morgan Infrastructure 0.90%
Grosvenor Infrastructure Fund II 2.96%
Total Weighted Average Fee 0.41%
Inflation Protected

60 NDSIB Fee Analysis – FY 2016 Knowledge. Experience. Integrity.
Real Estate
● Real Estate managers invest directly in real properties (e.g. offices, multi-family, retail, and other physical
properties) and securities that gain access to such economic interests.
● North Dakota’s average account size: $104mm.
● Red circle represents NDSIB Legacy Fund’s asset based weighted average real estate mgmt. fee: 0.65%.
● Green boxes and diamond represent the 75th, Median, and 25th fee percentiles for the fee universe.
● Fee universe was constructed using published fee schedules from Callan’s Real Estate Manager Peer Group,
using a mandate size between $100mm and $200mm.
Legacy Fund
0.60% 0.67% 0.74% 0.81% 0.88% 0.95%
Real Estate Fees
n = 29, Published Fee Universe
Median
Percentile
Industry Fee
NDSIB Weighted
Average Fee (Asset
Based Fee Strategies
Only)
75th and 25th
Percentile
Industry Fee

61 NDSIB Fee Analysis – FY 2016 Knowledge. Experience. Integrity.
Investment Strategies – Real Estate
Legacy Fund
● All managers for this asset class fall into the asset based fee category.
AUM Based Fee Strategies Fee %
Invesco Core Real Estate 0.34%
JP Morgan Real Estate 0.97%
Weighted Average AUM Based Fee 0.65%
Industry Fee - 25th Percentile 0.93%
Industry Fee - Median 0.86%
Industry Fee - 75th Percentile 0.80%
Total Weighted Average Fee 0.65%
Real Estate

62 NDSIB Fee Analysis – FY 2016 Knowledge. Experience. Integrity.
Notes and Comments Regarding Report Measurements
NDSIB – Pension Trust, Insurance Trust, and Legacy Fund
● All market values, fee data and other information is as of the fiscal year ending June 30, 2016.
● Fee data was provided by NDSIB; no audit of the fees paid by NDSIB was conducted.
● Average account sizes are measured by using the balances at quarter-end for each quarter in the fiscal year 2016.
In some cases, an account’s value changed significantly during the fiscal year due to external capital flows. In
those cases, reasonable adjustments were made to reflect the effect and timing of these cash flows.
● Fees charged by investment managers who did not have assets under management for the entire fiscal year are
included in this study for only the period during which that manager was utilized.
● Investment managers employ three primary fee calculation methods to charge for their services;
– AUM based fees: fees are calculated as a percentage of assets under management
– Performance based fees: fees are calculated based on the manager’s ability to outperform a pre-specified
benchmark during a contracted measurement period
– Hybrid fees: base management fees are calculated as a percentage of assets under management and a
performance fee is calculated based on the managers ability to outperform a pre-specified benchmark during a
contracted measurement period.
● Regardless of the method used by a particular manager, Callan has calculated fees as a percentage of assets
under management for each manager for the purposes of comparison.
● In many instances, fees paid by the individual trusts benefit from fee schedules that account for the aggregate
level of assets invested with a particular manager or in a specific strategy.
● Fee universes used in the study reflect either Actual Fees paid by Callan clients in similar mandates, fees
calculated using a universe of Published Fees representing manager fee schedules for similar mandates, or an
Average of Actual & Published Fee universes where the actual fee universe was smaller than 10. All fee
universes are explicitly noted beneath each chart where “n=” will denote the applicable sample size.