Pension Funding Status 2 - Montana Legislature Page Number 6 31 states were below the 80% funded...
16
9/28/2011 Page Number 1 Part I 1 Slide Number LFC brainstorming determined that there was significant interest in the Pension issue SAVA has studied – generally not from a financial perspective LFC Financial perspective 2 Slide Number
Transcript of Pension Funding Status 2 - Montana Legislature Page Number 6 31 states were below the 80% funded...

9/28/2011
Page Number 1
Part I
1Slide Number
LFC brainstorming determined that there gwas significant interest in the Pension issue
SAVA has studied – generally not from a financial perspective
LFC Financial perspective
2Slide Number

9/28/2011
Page Number 2
Financial Analysis Changes (September)y g ( p ) Allocation of liabilities (September) Assumptions regarding Return on Investment (September and December)
Financial weight of the liabilities (December) Legal limits (December) Legal limits (December) Montana comparison to other State and Local governments (March)
3Slide Number
In HB 122 many changes were implementedy g p One change was added in the Senate that affected early retirees Prior to the passage of HB 122, early retirees had a formula in statute for reducing benefits
Effective October 1, 2011, HB 122 changed from h f l b i ll l l d the formula to be an actuarially calculated amount
Impact concerned many over the summer and changed retirement decisions
4Slide Number

9/28/2011
Page Number 3
Megan Moore, Research Analyst, Legislative Services Division
5Slide Number
6Slide Number

9/28/2011
Page Number 4
employer contributions
investments$ $
$
$
$
$ $
$
$
$
$
$ $$
$
$
$$
$
Assets$
$
$
$
$
$ $
5
6
7
81
2
3
4
PENSION
FUND
employee contributions
$$$
$ $
benefits
expenses
7Slide Number
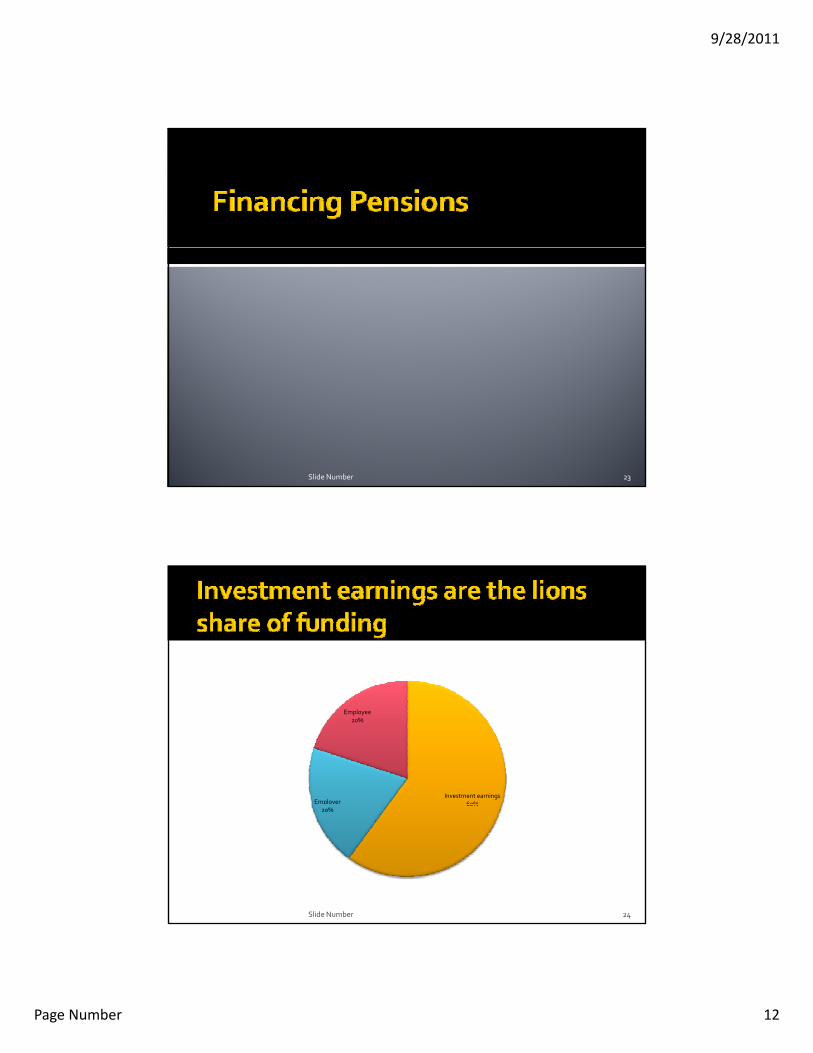
Revenues to the Spending from the system come from
Employers ~20%▪ Direct employers
▪ State contributions on behalf of employers
Employees ~ 20%
system go to
Retirees
Cost of managing the system
Pool of assets to draw fromp y
Investment earnings from the trust assets ~60%
from
8Slide Number

9/28/2011
Page Number 5
Investment earnings60%Employer
Employee20%
60%p y20%
9Slide Number
Size of the box = liabilitiesUN F nded (UAAL)
Funded (Assets Only)Amortized
(Contributions above normal cost)
UN Amortized
UN Funded (UAAL)
10Slide Number

9/28/2011
Page Number 6
31 states were below the 80% funded 3threshold for a well‐funded pension system
Montana is at 74% and paid 92% of the ARC in FY 2009
Lowest funded state is Illinois at 51% and paid 71% of the ARC71% of the ARC
Highest is New York at 101% and paid 100% of the ARC (note comparability is poor)
http://www.pewcenteronthestates.org/initiatives_detail.aspx?initiativeID=85899361051FY 2009 data
11Slide Number
Actuarial assumptionsUN Funded
pFunded Amortized UN Amortized
74% 26%74% 26%
12Slide Number
Source: Pew Center on the States: The Widening Gap, data from FY 2009Note: Due to different state choices, actuarial assumptions are not consistent.

9/28/2011
Page Number 7
Actuarial assumptionsUN Funded
pFunded Amortized UN Amortized
101% to 0% to
51% 49%
Source: Pew Center on the States: The Widening Gap, data from FY 2009Note: Due to different state choices, actuarial assumptions are not consistent.
13Slide Number
New York Times: no consensus on use of public pension actuarial methods methods
August 27, 2006 MARY WILLIAMS WALSH and MICHAEL COOPER
…The debate, being waged among actuaries, accountants and economists, is more than theoretical. Last week The New York Times reported that while officials usually describe New York City’s pension plans as close to fully funded an alternate calculation in the back of the plans’ funded, an alternate calculation in the back of the plans annual reports shows a $49 billion shortfall. If the alternate calculation has merit, the city will probably be forced to raise taxes or cut services at some point, to provide all the money promised to its retirees. …
14Slide Number

9/28/2011
Page Number 8
Reporting
Investors demanding more More Scrutiny of Pensions Disclosures: Mark R. Zehner, of the U S Securities and Exchange
gconsistent information from state and local governments
SECC has stated that if governments do not resolve this issue that it will
the U.S. Securities and Exchange Commission, warned that federal regulators have stepped up scrutiny of state and local governments’ disclosure of financial information –particularly pension liabilities – to investors in government bonds. Zehner cautioned against the use of legislative “gimmicks” that might obscure the full extent of pension obligations and their effects on state budgets. The SEC recently settled a security fraud this issue that it will.
GASB changes are the government accounting attempt to resolve issues.
recently settled a security fraud suit filed against for New Jersey for failing to fully disclose in bond offerings that its pension plans were underfunded. Pew Center on the Stateshttp://www.pewcenteronthestates.org/initiatives_detail.aspx?initiativeID=85899361051
15Slide Number
GASB and Rating Agencies revisit reporting and analysis of pensions
16Slide Number

9/28/2011
Page Number 9
Cindy Jorgenson, CPA; Deputy Financial‐Compliance Auditor; Legislative Audit DivisionAudit Division
17Slide Number
ACTUARIAL ‐CURRENT GASB EXPOSURE DRAFT
Varying assumptions make comparisons difficult
Intended to be used for funding
Maximum 30 year amortization periods for
Comparability is key Not intended to be used for
funding Accounting amortization
periods may be different and shorteramortization periods for
funding Liability not distributed to
employers
and shorter Distribution of liability to
all levels of government Will not take effect until FY
2014
18Slide Number
9/28/2011
Page Number 10
Rating Agencies are attempting to equalize with current information
19Slide Number
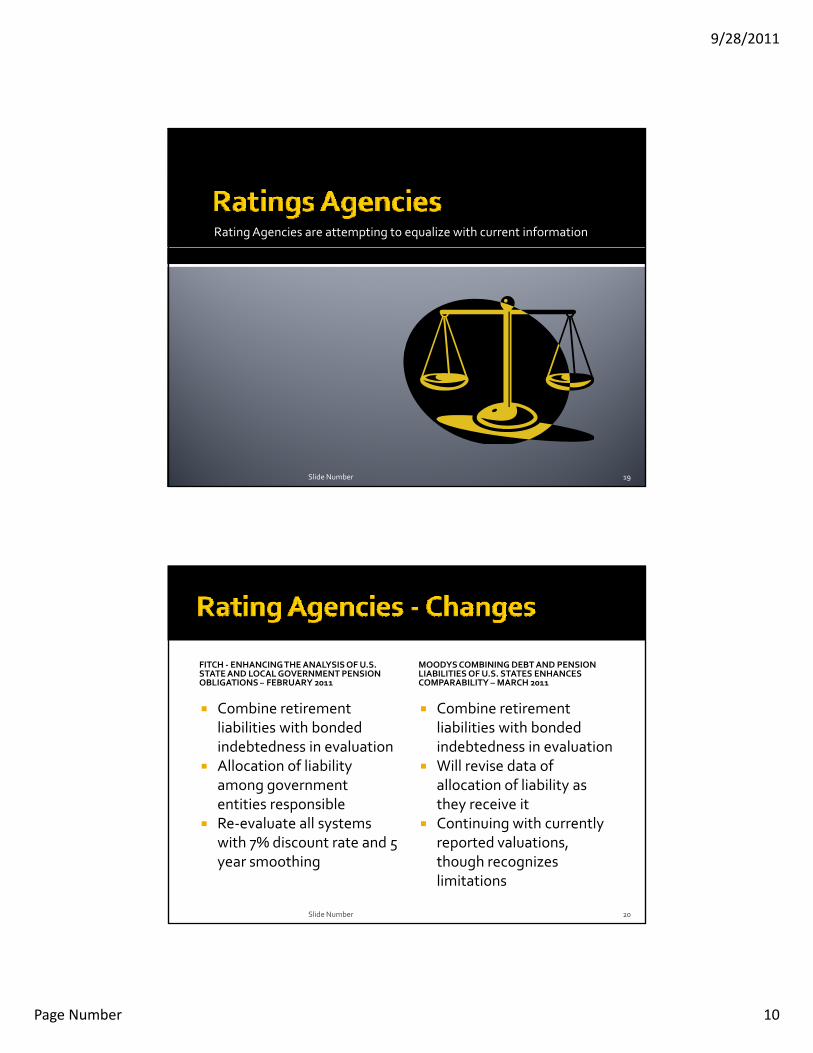
FITCH ‐ ENHANCING THE ANALYSIS OF U.S. STATE AND LOCAL GOVERNMENT PENSION OBLIGATIONS – FEBRUARY 2011
MOODYSCOMBINING DEBT AND PENSION LIABILITIES OF U.S. STATES ENHANCES COMPARABILITY – MARCH 2011OBLIGATIONS FEBRUARY 2011
Combine retirement liabilities with bonded indebtedness in evaluation
Allocation of liability among government entities responsible
COMPARABILITY MARCH 2011
Combine retirement liabilities with bonded indebtedness in evaluation
Will revise data of allocation of liability as they receive itentities responsible
Re‐evaluate all systems with 7% discount rate and 5 year smoothing
they receive it Continuing with currently
reported valuations, though recognizes limitations
20Slide Number

9/28/2011
Page Number 11
CURRENT ‐ 2009 FITCH ‐ PROPOSED
PERS – 83.5%
TRS ‐ 66.2%
New York Employees –101 0%
PERS – 72.3%
TRS – 61.7%
New York Employees –92 9%101.0%
West Virginia Teachers –41.3%
92.9%
West Virginia Teachers –32.9%
21Slide Number
All changes appear to be a work in progressg pp p g All seem to be moving closer to private accounting of pension liabilities
While it is important to pay attention to the potential to affect of these changes, do not worry too much about the details as they are worry too much about the details as they are continuing to change
Slide Number 22
9/28/2011
Page Number 12
23Slide Number
Investment earnings60%Employer
Employee20%
60%p y20%
24Slide Number
9/28/2011
Page Number 13
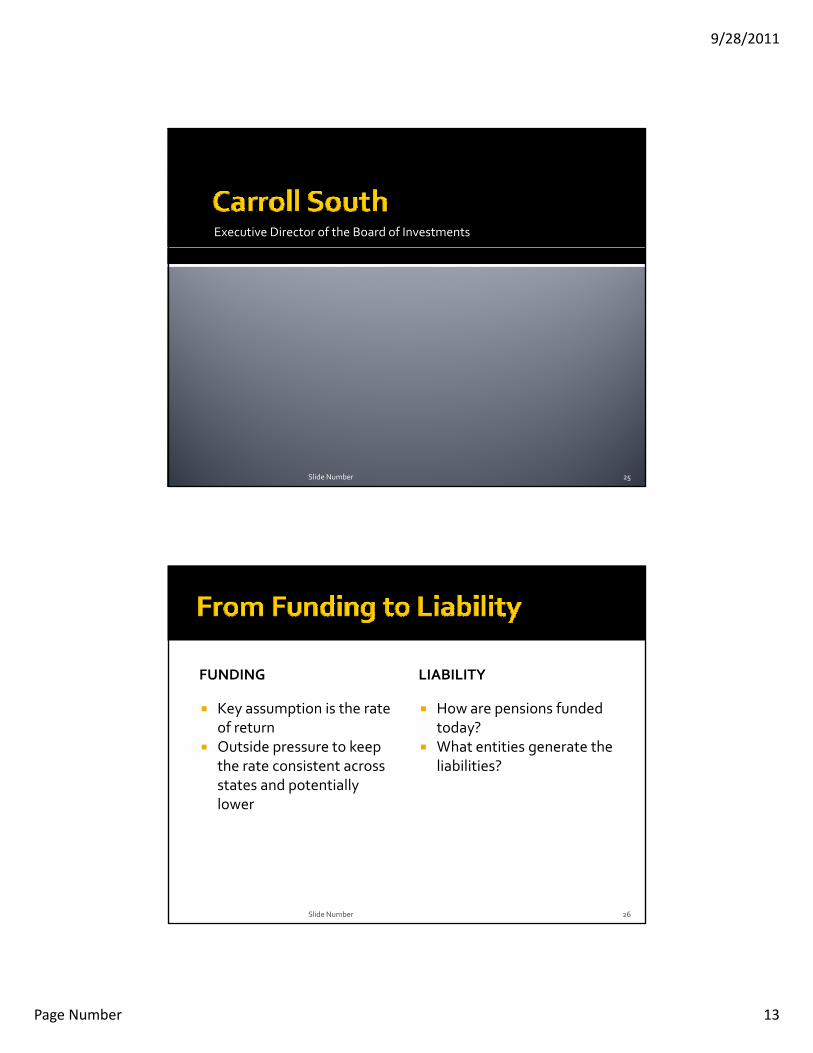
Executive Director of the Board of Investments
25Slide Number
FUNDING LIABILITY
Key assumption is the rate of return
Outside pressure to keep the rate consistent across states and potentially lower
How are pensions funded today?
What entities generate the liabilities?
lower
26Slide Number

9/28/2011
Page Number 14
Stephanie Morrison, PhD; Fiscal Analyst; Legislative Fiscal Division
27Slide Number
Wages
FY 2010 Wages of Active Members of State Retirement System Schools comprise
41% of the wages of
28Slide Number
Community Colleges
0%City6%
County9%
Fire2%
Police2%
State31%
University6%
41% of the wages of state and local employment
Total Local share is 63%
Schools & Coops41%
Sheriffs3%
Total State share is 37%

9/28/2011
Page Number 15
FY 2010 Funding f S R i
Implied Unfunded Liabilityf S R i
Local37%
of State Retirement Systems
State28%
of State Retirement Systems
State63%
Local72%
29Slide Number
LFD Assumptions During Session
Assumptions used during session result in the following
f fallocations of funding.
The assumptions were based on an increase in employer contributions only with current laws governing funding.
There were no shifts of funding between state and local except the GTB component of K‐12.
Local*, 47%
State Other, 29%
These assumptions would require significant property tax increases.
*Note: the Local share includes 10% of the costs funded with federal funds in school districts.
General Fund, 24%
30Slide Number

9/28/2011
Page Number 16
Revenues
Employer: taxes/spending reductions
▪ State
▪ Local
▪ State on behalf of local
Employee: contributions or benefitsEmployee: contributions or benefits
Earnings: limits of the market
Spending: Retiree benefits
31Slide Number
December Meeting: if possible Update on Actuarial Analysis Update on Actuarial Analysis Perspective on the rate of return Allocation of liability as a portion of balance sheet state and local ARC shortfall relative to annual spending for state and local Local property tax implications Legal status: can the state shift the liability to employees/retirees? Additional direction from the LFC
March Meeting Follow up Comparisons to other states funding status What other states have done Additional direction from the LFC
32Slide Number