Pennsylvania Energy Impacts Assessment
47
Pennsylvan ia Energy I mpacts Assessment Report 1: Marcellus Shale Natural Gas and Wind
-
Upload
document-library -
Category
Documents
-
view
220 -
download
0
Transcript of Pennsylvania Energy Impacts Assessment

8/8/2019 Pennsylvania Energy Impacts Assessment
http://slidepdf.com/reader/full/pennsylvania-energy-impacts-assessment 1/47
Pennsylvania Energy Impacts Assessment
Report 1: Marcellus Shale Natural Gas and Wind

8/8/2019 Pennsylvania Energy Impacts Assessment
http://slidepdf.com/reader/full/pennsylvania-energy-impacts-assessment 2/47
1
Pennsylvania Energy Impacts Assessment Report 1: Marcellus Shale Natural Gas and Wind
November 15, 2010
Author and Team Leader: Nels Johnson 1
Assessment Team: Tamara Gagnolet 1, Rachel Ralls 1, Ephraim Zimmerman 2, Brad Eichelberger 2,
Chris Tracey2
, Ginny Kreitler3
, Stephanie Orndorff 3
, Jim Tomlinson3
, Scott Bearer1
, and SarahSargent 3
The Nature Conservancy gratefully acknowledges generous financial support for thisassessment from the Heinz Endowments, the R.K. Mellon Foundation, and the William PennFoundation.
1. The Nature Conservancy – Pennsylvania Chapter2. Western Pennsylvania Conservancy – Pennsylvania Natural Heritage Program3. Audubon Pennsylvania
Cover photos: Marcellus gas drilling rig in Lycoming County © Tamara Gagnolet / TNC; wind turbine in TiogaCounty © Nels Johnson / TNC; log pile © TNC; electric transmission lines in Clinton County © George C. Gress /TNC
8/8/2019 Pennsylvania Energy Impacts Assessment
http://slidepdf.com/reader/full/pennsylvania-energy-impacts-assessment 3/47
2
Table of ContentsExecutive Summary .....................................................................................................................3
Marcellus Shale Natural Gas ........................................................................................................8
What is Marcellus Shale Natural Gas? ............................................................................................................. 8
Current and Projected Marcellus Shale Natural Gas Development ............. ............. ............. ............. ............ ... 9
Conservation Impacts of Marcellus Shale Natural Gas Development ............ ............. ............ .............. ........... 18
Key Findings .................................................................................................................................................. 29
Additional Information .................................................................................................................................. 30
Wind .........................................................................................................................................31
What is Wind Energy? ................................................................................................................................... 31
Current and Projected Wind Energy Development ........................................................................................ 32 Conservation Impacts of Wind Energy Development ..................................................................................... 38
Key Findings .................................................................................................................................................. 44
Additional Information .................................................................................................................................. 45
8/8/2019 Pennsylvania Energy Impacts Assessment
http://slidepdf.com/reader/full/pennsylvania-energy-impacts-assessment 4/47
3
Executive Summary
Within a few weeks during the summer of 2000,
eight towers rose two hundred feet above anagricultural field on a low ridge top along thePennsylvania Turnpike. Not long after, large bladesbegan sweeping the Somerset County sky asPennsylvania’s first in dustrial wind facility went online. Several years later and an hour drive to thewest, an unusual natural gas well was drilled over amile down and pumped full of water. That well inWashington County yielded a surprising amount of gas flowing from fractures in a shale formation thatgeologists had long suspected held plenty of gas buthas been too expensive to develop. Meanwhile, aCanadian company bought a small sawmill inMifflintown and started producing wood pellets for
stoves, boilers, and electric plants. It soon became one of the region’s largest producers of wood biomass energysupplies. In the decade since, these three new energy technologies have expanded rapidly across the state. By theend of this year, 500 wind turbines will be turning on Pennsylvania ridgelines, nearly 1,800 Marcellus natural gaswells will be scattered across rolling fields and forests, and over 50 facilities will be producing wood pellets orburning wood for energy. Thousands of miles of pipelines andpowerlines already crisscross the state to get energy supplies tomajor markets in the Northeast.
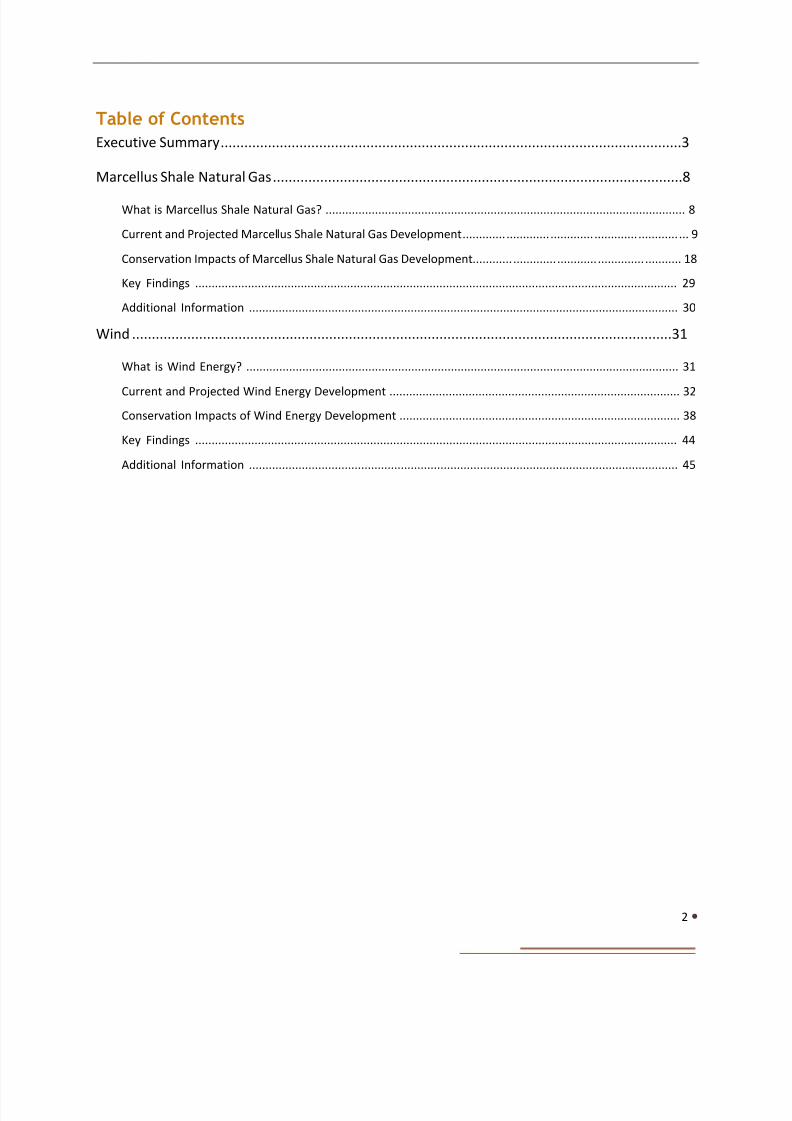
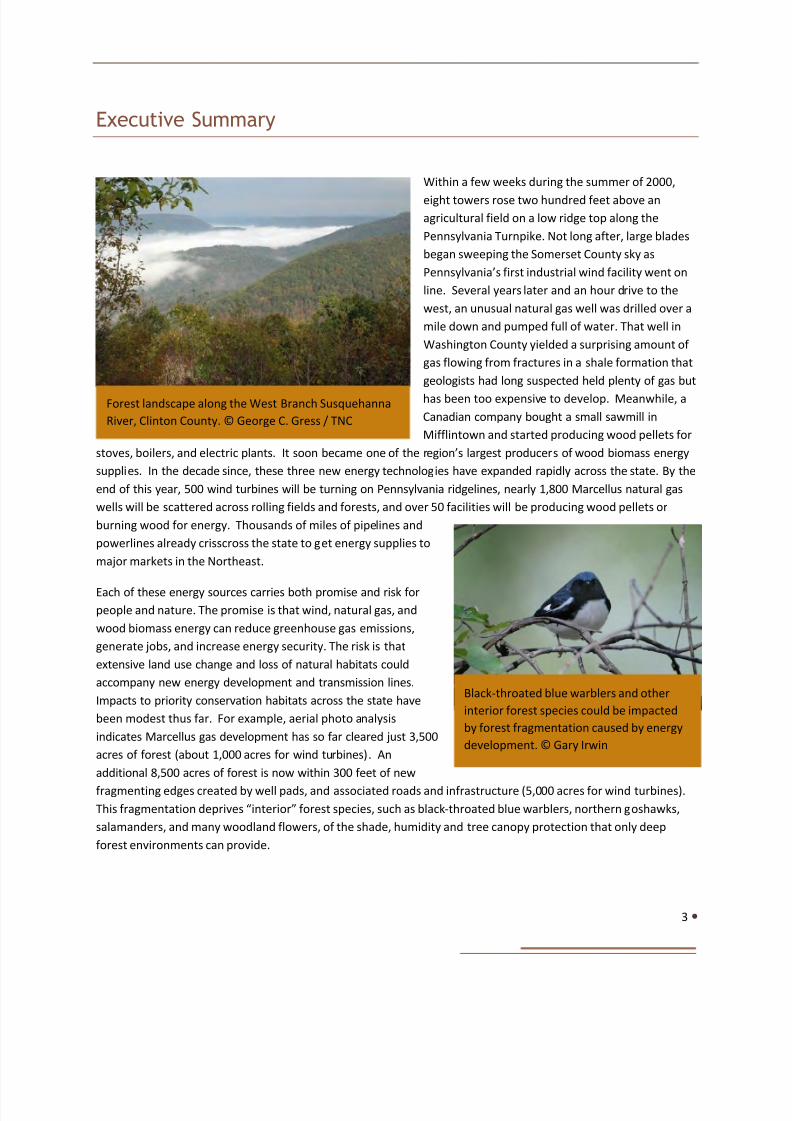
Each of these energy sources carries both promise and risk forpeople and nature. The promise is that wind, natural gas, andwood biomass energy can reduce greenhouse gas emissions,generate jobs, and increase energy security. The risk is thatextensive land use change and loss of natural habitats couldaccompany new energy development and transmission lines.Impacts to priority conservation habitats across the state havebeen modest thus far. For example, aerial photo analysisindicates Marcellus gas development has so far cleared just 3,500acres of forest (about 1,000 acres for wind turbines). Anadditional 8,500 acres of forest is now within 300 feet of newfragmenting edges created by well pads, and associated roads and infrastructure (5,000 acres for wind turbines).This fragmentation deprives “interior” forest species, such as black -throated blue warblers, northern goshawks,salamanders, and many woodland flowers, of the shade, humidity and tree canopy protection that only deepforest environments can provide.
Black-throated blue warblers and otherinterior forest species could be impactedby forest fragmentation caused by energydevelopment. © Gary Irwin
Forest landscape along the West Branch SusquehannaRiver, Clinton County. © George C. Gress / TNC

8/8/2019 Pennsylvania Energy Impacts Assessment
http://slidepdf.com/reader/full/pennsylvania-energy-impacts-assessment 5/47
4
By all accounts, each of these energy types is likely togrow substantially in Pennsylvania during the next twodecades. The Marcellus shale formation, whichunderlies two-thirds of the state, is now believed to beone of the largest unconventional shale gas reserves inthe world. The Pennsylvania Alternative EnergyPortfolio Standards Act of 2004, along with state andfederal incentives, will likely boost expansion of wind,wood biomass, and other alternative energy types overthe next two decades. But, how much of each energytype might be developed? What transmissioninfrastructure will be needed to get more electricpower and natural gas to consumers? And, where arethese energy types most likely to be developed? Howdoes the likely scale and location of future energy development overlap with priority conservation areas? The
Pennsylvania Energy Impacts Assessment seeks answers to these questions so that conservationists can work moreeffectively with energy companies and government agencies to avoid, minimize or mitigate habitat impacts in thefuture.
Assessment Goal: Develop credible energy development projections and assess how they might affect highpriority conservation areas across Pennsylvania . Marcellus natural gas, wind, wood biomass, and associatedelectric and gas transmission lines were chosen as the focus since these energy types have the most potential tocause land-use change in the state over the next two decades. The conservation impacts focus is on forest,freshwater, and rare species habitats. The assessment does not address other potential environmental impacts,including water withdrawal, water quality, air quality and migratory pathways for birds and bats. The assessmentalso does not address a range of other social, economic, and climate characteristics of these energy types.
Key Assumptions: Any assessment of future trends must include certain assumptions. Among the most importantassumptions of the Pennsylvania Energy Impacts Assessment are the following:
A 20-year time period is used to assess potential cumulative habitat impacts from energy development;
Given uncertainties about how energy prices could change, it was assumed that prices and capitalinvestment (and policy and social conditions) will be sufficient to promote steady development growth foreach energy type during the next two decades;
Given uncertainty about how technology changes could affect spatial footprints, it was assumed thatspatial footprints per well pad, turbine, and mile of transmission line will not change significantly duringthe next two decades;
Given the proprietary nature of data on leases, Marcellus Shale porosity, fine resolution wind power, etc.,all projections are based on publicly available information;
It was assumed that recent trends and patterns of energy development will continue for the next twodecades absent significant changes in government policies and industry practices;
Nine Mile Run Creek in PA’s North Central Highlands© George C. Gress / TNC.

8/8/2019 Pennsylvania Energy Impacts Assessment
http://slidepdf.com/reader/full/pennsylvania-energy-impacts-assessment 6/47
5
Energy projections contained in this assessment are informed scenarios – not predictions – for how much energydevelopment might take place and where it is more and less probable. Projected impacts, however, are based onmeasurements of actual spatial footprints measured for hundreds of well pads and wind turbines.
Analytical Steps: Key analytical steps for the Pennsylvania Energy Assessment included:
1) Data collection – Over 50 spatial data layers on energy resources, development permits, road andtransmission infrastructure, physical features, and conservation priorities were compiled for theassessment;
2) Spatial footprint analysis – Spatial footprints for Marcellus gas well and wind turbine pads, associatedroads, associated pipelines, associated electric transmission lines, and associated other clearings ( e.g ., gascontainment pits, equipment staging areas, electrical substations) were digitized using aerial photos of sites before and after construction;
3) Scale projections – Low, medium, and high scenarios for how much Marcellus Shale natural gas, wind,wood biomass, and transmission line development might occur were based as much as possible onexisting projections and data from credible sources.
4) Geographic projections – Projections of where new Marcellus natural gas and wind energy development ismore and less likely to occur were based on modeling the probability of a map pixel’s land -use change toenergy production based on sets of drivers and constraints developed for each energy type. Geographicprojections for wood biomass and energy transmission were not modeled due to a lack of data.Conclusions about regional patterns of wood biomass and transmission development and potentialconservation impacts will be presented in Report 2 of the Pennsylvania Energy Impacts Assessment.
5) Conservation impacts analysis – The potential impacts of future energy development were assessed forforest and freshwater habitats across the state. In addition, sites recognized as important for species of conservation concern were assessed. Conservation datasets for these assessments included, amongothers, large forest patches from The Nature Conservancy and the Western Pennsylvania Conservancy,
habitat areas for rare species from the Pennsylvania Natural Heritage Program, densities for interiorforest nesting bird species from the 2 nd Pennsylvania Breeding Bird Atlas, and intact watersheds for nativebrook trout populations from the Eastern Brook Trout Joint Venture.
6) Review – A dozen energy experts in government, industry, and research organizations provided technicalreview of the energy projections.
Energy Projections: The Pennsylvania Energy Impacts Assessment developed low, medium and high scenarios forthe amount of energy development that might take place in Pennsylvania by 2030. The projections include:
Marcellus Shale – Sixty thousand wells could be drilled on between 6,000 and 15,000 new well pads(there are currently about 1,000) , depending on how many wells are placed on each pad. Gas
develo pment will occur in at least half of the state’s counties, with the densest development likely in 15counties in southwest, north central, and northeast Pennsylvania.
Wind – Between 750 and 2,900 additional wind turbines could be built (there are currently about 500),depending on the wind share of electric generation by 2030. Most turbines would be built along theAllegheny Front in western Pennsylvania and on high Appalachian ridgetops in the central andnortheastern parts of the state.
8/8/2019 Pennsylvania Energy Impacts Assessment
http://slidepdf.com/reader/full/pennsylvania-energy-impacts-assessment 7/47
8/8/2019 Pennsylvania Energy Impacts Assessment
http://slidepdf.com/reader/full/pennsylvania-energy-impacts-assessment 8/47
7
and EV streams are in steep terrain, rigorous sediment controls, and possibly additional setbackmeasures, are needed to help conserve these sensitive habitats.
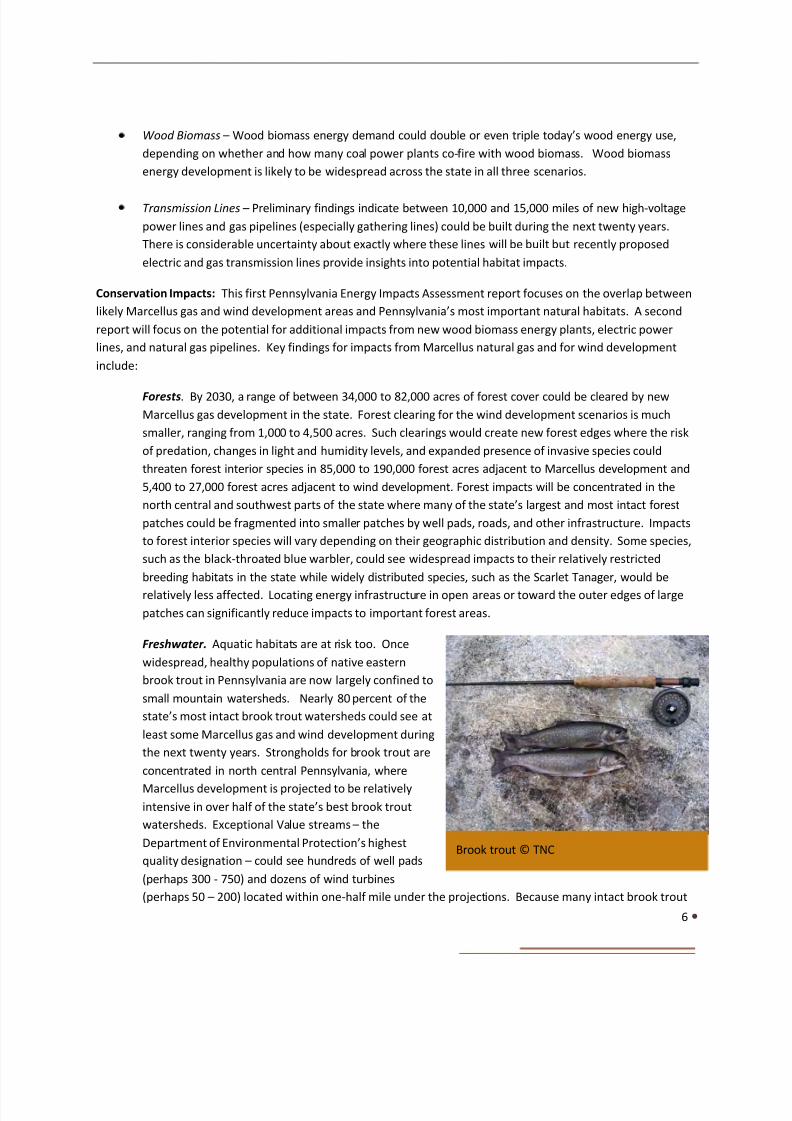
Rare Species . Nearly 40 percent of Pennsylvania’s globally rare and Pennsylvania threatened species canbe found in areas with high potential for Marcellus gas development. These species tend to be associatedwith riparian areas, streams, and wetlands, while others are concentrated in unusually diverse areas suchas the Youghiogheny Gorge. A handful of rare species have most or all of their known locations in highpotential areas for Marcellus gas development. For example, three-fourths of all known snow trilliumpopulations are in high potential Marcellus development areas as are all known populations for the greensalamander. A much smaller number of known locations for globally and state rare species overlap withhigh potential wind development sites and they tend to be associated with rocky outcrops and ridgetopbarrens habitats. Species with the greatest overlaps include timber rattlesnakes, Allegheny woodrats, andnorthern long-eared Myotis bats. More intensive surveys for globally rare and state critically endangeredspecies in high potential Marcellus and wind development areas could help to minimize impacts beforedevelopment begins. The Pennsylvania Game Commission is working with wind companies and otherresearchers to assess impacts to migratory pathways for birds and bats.
Recreation. Extensive overlaps are projected between Marcellus development and state forests, stateparks, and state game lands. Just over ten percent of Pennsylvania’s public lands are legally protectedfrom gas development, most of it within State Wild and Natural Areas or in state parks where theCommonwealth owns the mineral rights. The state does not own mineral rights for 80% of State Park andState Game Lands, nearly 700,000 acres of State Forests have already been leased, and only about300,000 acres of the remaining State Forest Lands are legally off-limits to future leases. Projectionsindicate between 900 and 2,200 well pads could be developed across all state lands, with most going onState Forest Lands, followed by State Game Lands, and State Parks. Wind development was not projectedon state lands, though some facilities are projected near highly visited sites, including natural vistas.
Clearly, the heart of some of Pennsylvania’s best natural habitats lie directly in the path of future energydevelopment. Integrating information on conservation priorities into energy planning, operations, and policy byenergy companies and government agencies sooner rather than later could dramatically reduce these impacts.Many factors – including energy prices, economic benefits, greenhouse gas reductions, and energy independence – will go into final decisions about where and how to proceed with energy development. Information aboutPennsylvania’s most important natural habitats should be an important part of the calculus about trade -offs andoptimization as energy development proceeds. Would Pennsylvania’s conservation pione ers, including GiffordPinchot, Maurice Goddard, and Rachel Carson, expect anything less?
8/8/2019 Pennsylvania Energy Impacts Assessment
http://slidepdf.com/reader/full/pennsylvania-energy-impacts-assessment 9/47
8
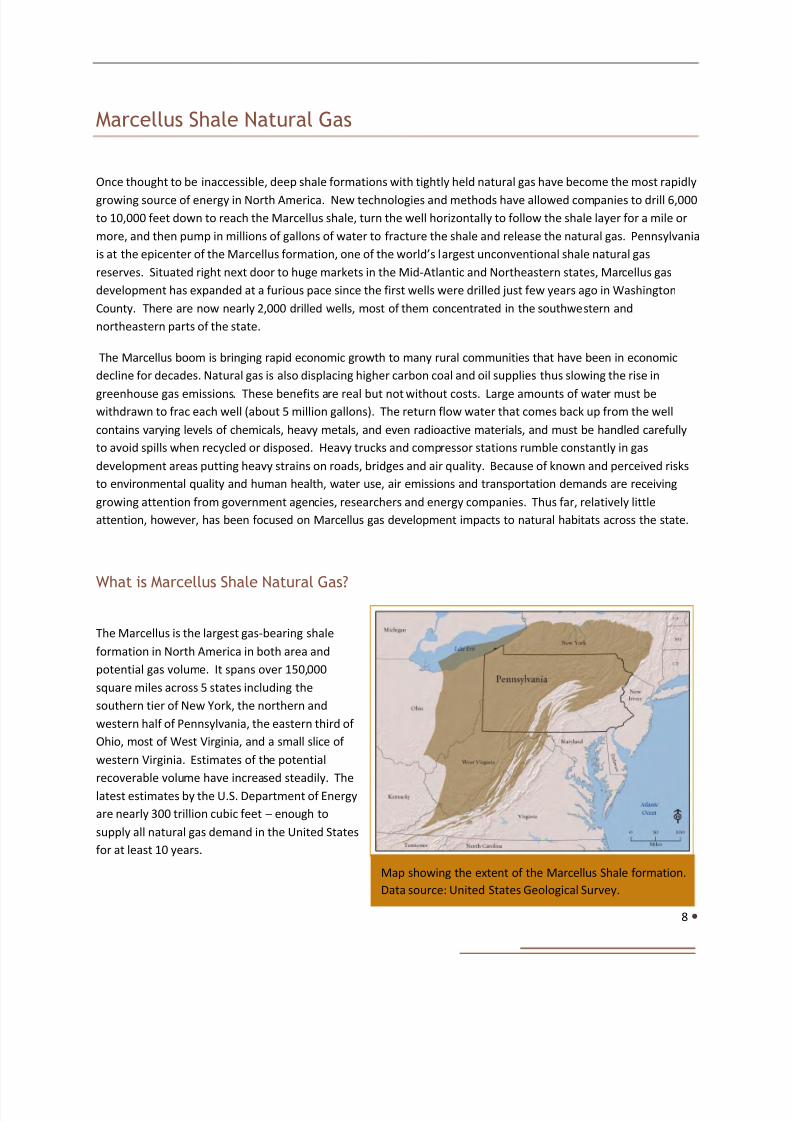
Map showing the extent of the Marcellus Shale formation.Data source: United States Geological Survey.
Marcellus Shale Natural Gas
Once thought to be inaccessible, deep shale formations with tightly held natural gas have become the most rapidly
growing source of energy in North America. New technologies and methods have allowed companies to drill 6,000to 10,000 feet down to reach the Marcellus shale, turn the well horizontally to follow the shale layer for a mile ormore, and then pump in millions of gallons of water to fracture the shale and release the natural gas. Pennsylvaniais at the epicenter of the Marcellus formation, one of the world’s largest unconventional shale natural gasreserves. Situated right next door to huge markets in the Mid-Atlantic and Northeastern states, Marcellus gasdevelopment has expanded at a furious pace since the first wells were drilled just few years ago in WashingtonCounty. There are now nearly 2,000 drilled wells, most of them concentrated in the southwestern andnortheastern parts of the state.
The Marcellus boom is bringing rapid economic growth to many rural communities that have been in economicdecline for decades. Natural gas is also displacing higher carbon coal and oil supplies thus slowing the rise in
greenhouse gas emissions. These benefits are real but not without costs. Large amounts of water must bewithdrawn to frac each well (about 5 million gallons). The return flow water that comes back up from the wellcontains varying levels of chemicals, heavy metals, and even radioactive materials, and must be handled carefullyto avoid spills when recycled or disposed. Heavy trucks and compressor stations rumble constantly in gasdevelopment areas putting heavy strains on roads, bridges and air quality. Because of known and perceived risksto environmental quality and human health, water use, air emissions and transportation demands are receivinggrowing attention from government agencies, researchers and energy companies. Thus far, relatively littleattention, however, has been focused on Marcellus gas development impacts to natural habitats across the state.
What is Marcellus Shale Natural Gas?
The Marcellus is the largest gas-bearing shaleformation in North America in both area andpotential gas volume. It spans over 150,000square miles across 5 states including thesouthern tier of New York, the northern andwestern half of Pennsylvania, the eastern third of Ohio, most of West Virginia, and a small slice of western Virginia. Estimates of the potentialrecoverable volume have increased steadily. Thelatest estimates by the U.S. Department of Energyare nearly 300 trillion cubic feet – enough tosupply all natural gas demand in the United Statesfor at least 10 years.

8/8/2019 Pennsylvania Energy Impacts Assessment
http://slidepdf.com/reader/full/pennsylvania-energy-impacts-assessment 10/47
9
Agriculture49%
ExistingCleared
5%
ForestEdge22%
Forest24%
Landscape Context of AssessedMarcellus Shale Well Pads
Geologists have long known the Marcellus formation is an organically-rich shale with potentially large amounts of natural gas, but it was too deep, too thin, and too dense to exploit. In 2005, Range Resources drilled the firstproduction Marcellus well using horizontal drilling and hydraulic fracturing methods. The horizontal drilling isnecessary because the shale is typically thin and vertical wells will only intercept a small part of the formation.Hydraulic fracturing (or “fracing”) is a process that uses large volumes of water, sand, lubricants, and otherchemicals to create small fissures in the shale rock. Hydro-fracing is necessary to release the gas which is tightlyheld in the dense black shale. These methods, first perfected for deep shale gas in the Barnett formation of Texas,unlocked the tremendous gas reserves in the Marcellus and other “unconventional” shale formations previouslythought to be out of economic reach.
In contrast to shallow gas deposits in western Pennsylvania, the Marcellus is developed with multiple horizontalwells that can reach out 5,000 feet or more from one well pad. Everything about Marcellus development is biggerthan conventional shallow gas plays. The well pads are more expansive (averaging just over 3 acres compared to asmall fraction of an acre), the water used to frac wells is much greater (5 million gallons versus a hundredthousand gallons ), and the supporting infrastructure is much larger in scale (24” diameter pipelines to gather gasfrom wells versus 2” or 4” pipelines in shallow field s). Individual wells are also vastly more productive (5 – 10million cubic feet per day versus less than 100,000 cubic feet in peak early production). While the larger pad,greater water use, and more extensive infrastructure pose more challenges for conservation than shallow gas, thearea “drained” by wells on each Marcellus pad is much larger than from shallow gas pads (500 -1,000 acres versus10-80 acres) since there are typically multiple lateral wells on a Marcellus pad versus a single vertical well on ashallow gas pad. The lateral reach of Marcellus wells means there is more flexibility in where pads andinfrastructure can be placed relative to shallow gas. This increased flexibility in placing Marcellus infrastructurecan be used to avoid or minimize impacts to natural habitats in comparison to more densely-spaced shallow gasfields.
Current and Projected Marcellus Shale Natural Gas Development
Projections of future Marcellus gas developmentimpacts depend on robust spatial measurementsfor existing Marcellus well pads and infrastructure.We compared aerial photos of PennsylvaniaDepartment of Environmental Protection (DEP)Marcellus well permit locations taken before andafter development and precisely documented the
spatial foot print of 242 Marcellus well pads(totaling 435 drilling permits) in Pennsylvaniavisible in 2008 aerial imagery from the NationalAgriculture Imagery Program. The groundexcavated for wells and associated infrastructureis the most obvious spatial impact.

8/8/2019 Pennsylvania Energy Impacts Assessment
http://slidepdf.com/reader/full/pennsylvania-energy-impacts-assessment 11/47
10
For each well site, the area for the well pad, new or expanded roads, gathering pipelines, and waterimpoundments were digitized and measured.
Well pads occupy 3.1 acres onaverage while the associatedinfrastructure (roads, waterimpoundments, pipelines)takes up an additional 5.7acres, or a total of nearly 9acres per well pad.
Adjacent lands can also beimpacted, even if they are notdirectly cleared. This is mostnotable in forest settingswhere clearings fragmentcontiguous forest patches,
Average Spatial Disturbance for Marcellus ShaleWell Pads in Forested Context (acres)
Forest cleared for Marcellus Shale well pad 3.1
8.8 Forest cleared for associated infrastructure
(roads, pipelines, water impoundments, etc.)
5.7
Indirect forest impact from new edges 21.2
TOTAL DIRECT AND INDIRECT IMPACTS 30
Aerial photos before and after development of a Marcellus gas well pad site in Susquehanna County, PA. Toassess the impacts of this type of energy development, we have digitized the spatial footprint of 376 gas well
pad sites and associated infrastructure.

8/8/2019 Pennsylvania Energy Impacts Assessment
http://slidepdf.com/reader/full/pennsylvania-energy-impacts-assessment 12/47
11
create new edges, and change habitat conditions for sensitive wildlife and plant species that depend on “interior”forest conditions.
Forest ecologists call this the “edge effect.” While the effect is so mewhat different for each species, research hasshown measurable impacts often extend at least 330 feet (100 meters) forest adjacent to an edge. Interior forestspecies avoid edges for different reasons. Black-throated blue warblers and other interior forest nesting birds, forexample, avoid areas near edges because of the increased risk of predation. Tree frogs, flying squirrels and certainwoodland flowers are sensitive to forest fragmentation because of changes in canopy cover, humidity and lightlevels. Some species, especially common species such as whitetail deer and cowbirds, are attracted to forest edges
– often resulting in increased competition, predation, parasitism, and herbivory. Invasive plant species, such astree of heaven, stilt grass, and Japanese barberry, often thrive on forest edges and can displace native forestspecies. As large forest patches become progressively cut into smaller patches, populations of forest interiorspecies decline.
To assess the potential interior forest habitat impact, we created a 100 meter buffer into forest patches from newedges created by well pad and associated infrastructure development. For those well sites developed in forest
areas or along forest edges (about half of assessed sites), an average of 21 acres of interior forest habitat was lost.
The number of Marcellus wells drilled in Pennsylvania during the next two decades will expand steadily. Just howmany wells are drilled will be driven by various factors including natural gas prices, technological improvements,human resources, regulatory changes in Pennsylvania and beyond (e.g., end of New York drilling moratorium), andsocial preferences. Assessing how these factors will change over the next two decades is very difficult; therefore
Interior forest habitat before and after development of a Marcellus gas well
pad site in Elk County, PA.

8/8/2019 Pennsylvania Energy Impacts Assessment
http://slidepdf.com/reader/full/pennsylvania-energy-impacts-assessment 13/47
12
our projections assume economic, policy, and social conditions remain stable enough to promote steady expansionof Marcellus gas development in the state. The first key variable in our projection is the number of drilling rigs thatwill be operating in Pennsylvania. By October 2010, the industry had moved just over 100 rigs into Pennsylvania todrill Marcellus wells according to the Baker-Hughes weekly rig count. Given the high productivity of the Marcellusand its proximity to major northeastern markets, most industry observers expect this number to continue growingsteadily. The number of horizontal drill rigs operating in the Barnett Shale has peaked at about 200, but the
We project 60,000 Marcellus wells will be drilled during the next twenty years based on companyinvestor presentations and academic assessments of gas development potential. Depending on howmany wells on average are placed on the same pad site (see illustration below), we project between7,000 and 16,000 new well pad sites will be developed in Pennsylvania by 2030.

8/8/2019 Pennsylvania Energy Impacts Assessment
http://slidepdf.com/reader/full/pennsylvania-energy-impacts-assessment 14/47
13
Marcellus Shale is much larger and could reach 300 rigs in Pennsylvania alone. We chose a conservative estimateof 250 maximum horizontal drill rigs for each scale projection scenario. Assuming that each rig can drill one wellper month, 3,000 wells are estimated to be drilled annually. At that rate, 60,000 new wells would be drilled by theyear 2030.
The second key variable, especially for determining land-use and habitat impacts, is the number of wells on eachpad. Because each horizontal well can drain gas from 80 to 170 acres (depending on the lateral well length), morewells per pad translates to less disturbance and infrastructure on the landscape. It’s technically possible to put adozen or more Marcellus wells on one pad So far, the average in Pennsylvania is two wells per pad as companiesquickly move on to drill other leases to test productivity and to secure as many potentially productive leases aspossible (leases typically expire after 5 years if there is no drilling activity). In many cases, the gas company willreturn to these pads later and drill additional wells. The low scenario (6,000 well pads) assumes that each pad onaverage will have ten wells. Because many leases are irregularly shaped, in mixed ownership, or the topographyand geology impose constraints, it is unlikely this scenario will develop. It would take relatively consolidatedleaseholds and few logistical constraints for this scenario to occur. The medium scenario for well pads assumes 6wells on average will be drilled from each pad, or 10,000 well pads across the state. Industry staff generally agreethat six is the most likely number of wells they will be developing per pad for most of their leaseholds, at leastwhere lease patterns facilitate drilling units of 600 acres or larger. The high scenario assumes each pad will have 4wells drilled on average, or 15,000 well pads across the state. This scenario is more likely if there is relatively littleconsolidation of lease holds between companies in the next several years.
The number of well pads is less important than where they are located, at least from a habitat conservationperspective. To understand which areas within Pennsylvania’s Marcellus formation are more and less likely to bedeveloped, we used a machine-based learning modeling approach known as maximum entropy (Maxent 3.3.3a,Princeton University). Maximum entropy was used to find relationships between 1,461 existing and permitted wellpad locations and variables that might be relevant to a company’s decision to drill a Marcellus well. Such variableswere chosen based on data availability and included Marcellus Shale depth, thickness and thermal maturity as well
as percent slope, distance to pipelines, and distance to roads. The model produces a raster surface that representsthe probability of an area to potentially support future gas well development. An additional 487 existing andpermitted wells were used to test the validity of the model’s probability surface and the model was found to be80% accurate in predicting existing and permitted wells from randomly sampled undeveloped areas. The resultingprobability map indicates wide variation across the Marcellus formation in terms of the likelihood of future gaswell development.
To get a better sense of where gas development is most likely, we searched for the highest probability areas wherewell pads in each scenario might be located. The probability raster was re -sampled to a resolution that reflects theminimum separation distance between well pads for each of the three impact scenarios (low – 5,217 ft; medium – 4,134 ft; high – 3,346 ft). The minimum separation distance represents the drainage area for gas extraction and is
dependent upon the number of wells per pad, which differs among the three impact scenarios. Using this method,each pixel of the raster represents the combined area of a well pad plus the minimum separation distance. Thehighest probable pixels were then selected until the threshold for each impact scenario was reached (low – 6,000well pads; medium – 10,000 well pads; high – 15,000 well pads). Areas incompatible for future gas exploration(existing drilled Marcellus Shale wells, Wild and Natural Areas, and water bodies) were excluded from beingselected as probable pixels. The highest probable pixels were then converted into points for map display purposes.

8/8/2019 Pennsylvania Energy Impacts Assessment
http://slidepdf.com/reader/full/pennsylvania-energy-impacts-assessment 15/47
14
While the geographic area with projected well pads expands from low to high scenarios, the overall geographicpattern is not cumulative due to the differences in minimum separation distance between the three scenarios.Overall, hotspots for future gas development can be seen in half a dozen counties in southwestern Pennsylvaniaand half a dozen counties in north central and northeastern parts of the state.
These geographic projections of future Marcellus gas development are spatial representations of possiblescenarios. They are not predictions. We faced several constraints in developing the geographic scenarios:
We do not have access to proprietary seismic and test well geologic data that natural gas companieshave. Shale porosity, for example, is a key factor but there are no publicly available data for this.
We do not have the detailed location of gas company leases. Each company is looking for the highestprobability locations across their lease holds while our model looks for the highest probability sites acrossthe entire Marcellus formation in the state. Because there have only been a few Marcellus test wells andpermits in the Delaware watershed, we believe the projections for new well pads are probablysignificantly underestimated in Wayne County.
Still, we believe the overall geographic patterns in the projected gas development locations are relatively robustfor several reasons. We used nearly 1,500 existing drilled or permitted well pads to build the model and nearly 500additional drilled and permitted well pads to validate the model. This is typically a sufficient sample size forbuilding predictive models. Additionally, reviews from industry, academic, and government agency reviewersindicate our methods and results are generally sound. Some reviewers expect future well pad locations to bemore geographically expansive than our current projections indicate, especially in the Delaware watershed whereonly a few Marcellus test wells and permits have been issued. Our projections for Wayne County, for example, arelikely underestimating future development potential.

8/8/2019 Pennsylvania Energy Impacts Assessment
http://slidepdf.com/reader/full/pennsylvania-energy-impacts-assessment 16/47
0 Map showing projected location of 10,000 new Marcellus Shale natural gas pads across Pennsylvania (medium development scenario).

8/8/2019 Pennsylvania Energy Impacts Assessment
http://slidepdf.com/reader/full/pennsylvania-energy-impacts-assessment 17/47
16
Map showing projected location of new Marcellus well pads in southern Susquehanna Countyunder the medium development scenario.
Map showing projected location of new Marcellus well pads in southwestern Pennsylvania underthe medium development scenario.

8/8/2019 Pennsylvania Energy Impacts Assessment
http://slidepdf.com/reader/full/pennsylvania-energy-impacts-assessment 18/47
17
Map showing projected location of 15,000 new Marcellus well pads across Pennsylvania (highdevelopment scenario).
Map showing projected location of 6,000 new Marcellus well pads across Pennsylvania (lowdevelopment scenario).

8/8/2019 Pennsylvania Energy Impacts Assessment
http://slidepdf.com/reader/full/pennsylvania-energy-impacts-assessment 19/47
18
Conservation Impacts of Marcellus Shale Natural Gas Development
What is the overlap of the areas with the highest probability of future Marcellus gas development and those areasknown to have high conservation values? To answer this question, we intersected the projected Marcellus well
pads with areas previously identified and mapped as having high conservation values. We looked at severalexamples from four categories of conservation value, including:
Forest habitats
Freshwater habitats
Species of conservation concernOutdoor recreation
Substantial areas of overlap are indicated between likely future Marcellus development areas and Pennsylva nia’smost important forest, freshwater, sensitive species habitats, and outdoor recreation sites.
FORESTS
Forests are Pennsylvania’s most extensive natural habitat type. Once covering at least 95 percent of the state’sland area, forests were whittled away for agriculture, charcoal for iron smelting, and lumber until only a third of the state’s forests remained. Forests have rebounded steadily to cover about 60 percent of the state, though atrend toward increasing net loss of forest has emerged during the past decade. Pennsylvania is famous worldwidefor its outstanding cherry, oak, and maple hardwoods, and forests provide livelihoods for many thousands of Pennsylvanians in the forest products and tourism industries. They also contribute enormously to the quality of life for all Pennsylvanians by filtering contaminants from water and air, reducing the severity of floods,sequestering carbon dioxide emissions that would otherwise warm the planet, and providing a scenic backdrop torecreational pursuits.
A majority of projected well locations are found in a forest setting for all three scenarios (64% in each case). Thelow scenario would see 3,845 well pads in forest areas. With an average cleared forest average of 8.8 acres perpad (including roads and other infrastructure), the total forest clearing would be approximately 33,800 acres.Indirect impacts to adjacent forest interior habitats would total an additional 81,500 acres. Forest impacts fromthe medium scenario (6,350 projected wells in forest locations) would be 56,000 cleared forest acres and anadditional 135,000 acres of adjacent forest interior habitat impacts. For the high scenario (9,448 forest well pads),approximately 83,000 acres would be cleared and an additional 200,300 acres of forest interior habitats affectedby new adjacent clearings. While the high Marcellus scenario would result in a loss of less than one percent of thestate’s total forest acreage, areas with intensive Marcellus gas development could see a loss of 2 -3 percent of local

8/8/2019 Pennsylvania Energy Impacts Assessment
http://slidepdf.com/reader/full/pennsylvania-energy-impacts-assessment 20/47
19
forest habitats. Some part of the cleared forest area will become reforested after drilling is completed, but therehas not been enough time to establish a trend since the Marcellus development started. Large contiguous forestpatches are especially valuable because they us sustain wide-ranging forest species, such as northern goshawk andprovide more habitat for forest interior species. They are also more resistant to the spread of invasive species,suffer less tree damage from wind and ice storms, and provide more ecosystem services – from carbon storage towater filtration – than small patches. The Nature Conservancy and the Western Pennsylvania Conservancy’s ForestConservation Analysis mapped nearly 25,000 forest patches in the state greater than 100 acres. Patches at least1,000 acres in size are about a tenth of the total (2,700) and patches at least 5,000 acres are rare (only 316patches). In contrast to overall forest loss, projected Marcellus gas development scenarios indicate a morepronounced impact on large forest patches. For example, 40 percent of patches greater than 5,000 acres areprojected to have at least one well pad and associated infrastructure located in them in the medium scenario
compared to just over 20 percent for patches > 1,000 acres. Most affected large patches have multiple projectedwell pads (as many as 29). The projections indicate larger patches are likely to be more vulnerable, with over athird projected to have at least one new well pad and road. Many affected large patches have multiple projectedwell pads (as many as 17 for patches). While one or two well pads and associated infrastructure may notfragment the large patch into smaller patches, each additional well pad increases the likelihood that the largepatch will become several smaller patches with a substantially reduced forest interior habitat area.
Map showing number of probable Marcellus well pads in forest patches greater than 1,000 acres acrossPennsylvania.

8/8/2019 Pennsylvania Energy Impacts Assessment
http://slidepdf.com/reader/full/pennsylvania-energy-impacts-assessment 21/47
20
Bird species that nest in close canopy forest environments are often referred to as “forest interior” species. The
Carnegie Museum of Natural History, Powdermill Nature Reserve and the Pennsylvania Game Commission recentlycompleted Pennsylvania’s Second Breeding Bird Atlas project. As part of the project, trained ornithologistsconducted point count using standardized protocols at 39,000 sites between 2004-2009. The result is an incredibly
detailed data base that provides the most accurate information on thedistribution and density of breeding birds available anywhere in theUnited States. Density data for several forest interior nesting specieswere mapped and intersected with the projected Marcellus gas well padlocations. The resulting maps show the estimated reduction in habitatfor that species in each Marcellus gas probability pixel (including bothcleared forest and adjacent edge effects). Scarlet Tanagers are one of the most widespread forest interior nesting bird in the state. Since theyare so widespread, a majority of their range in the state is outside of themost likely Marcellus development areas. In some locations, scarlettanager populations could decline by as much as 23 percent in theMedium Scenario. Black-throated blue warblers are more narrowlydistributed in Pennsylvania favoring mature northern hardwood andconiferous forests with a dense understory, frequently in mountainterrain. Since most of their breeding range in Pennsylvania overlaps with
likely Marcellus development areas, a higher proportion of their habitat could be affected.
Map showing projected number of well pads in forest patches greater than 1,000 acres under the mediumdevelopment scenario in Potter, Cameron, McKean and Forest Counties.
Scarlet tanager © U.S. Fish andWildlife Service

8/8/2019 Pennsylvania Energy Impacts Assessment
http://slidepdf.com/reader/full/pennsylvania-energy-impacts-assessment 22/47
21
Map showing estimated percent loss of habitat for Scarlet Tanagers under medium scenario.
Map showing estimated percent loss of habitat for Black-Throated Blue Warblers under mediumscenario.

8/8/2019 Pennsylvania Energy Impacts Assessment
http://slidepdf.com/reader/full/pennsylvania-energy-impacts-assessment 23/47
22
FRESHWATER
Home to three great river systems and one of the Great Lakes, Pennsylvania’s fresh water resources are vital notonly to the Commonwealth but to much of the eastern United States. The Ohio River basin contains the richestfresh water ecosystems in North America. In Pennsylvania, French Creek and parts of the Upper Allegheny Rivercontain some of the most intact aquatic ecosystems in the entire basin. The Susquehanna River is the source of more than half the fresh water that enters the Chesapeake Bay, and most of the water that flows down theSusquehanna River originates in tributary headwaters across a wide swath of central Pennsylvania. FormingPennsylvania’s eastern boundary, the Delaware River is the longest undammed river in the eastern United States,one of the last strongholds for Atlantic coast migratory fish, and provides the drinking water source for nearly 20million Americans living in Pennsylvania, New York, and New Jersey. Because of their importance to human healthand livelihoods, the potential of Marcellus gas development to affect water flows and quality have receivedgrowing attention from regulatory agencies, natural gas companies, and environmental groups.
The intersection of gas development with sensitive watersheds has received less attention. High Quality andExceptional Value (EV) watersheds have been designated by the Pennsylvania Department of Environmental
Map showing current number of Marcellus well pads in intact and predicted intact brook troutwatersheds. Data source: Eastern Brook Trout Joint Venture.

8/8/2019 Pennsylvania Energy Impacts Assessment
http://slidepdf.com/reader/full/pennsylvania-energy-impacts-assessment 24/47
23
Protection across the state. Our projections indicate 28 percent of High Quality and 5 percent of ExceptionalValues streams have or will have Marcellus gas development during the next two decades presence of well pads inthese watersheds may not be a problem as long as spill containment measures and erosion and sedimentationregulations are strictly observed and enforced in these areas. More specifically, the projections indicate 3,581 wellpads could be located within ½ mile of a High Quality or Exceptional Values streams. Pads within close proximityto High Quality and especially Exceptional Value streams pose more risk than those at greater distances, as there isincreased risk for potential spills and uncontained sediments to find their way into streams.
Native brook trout are one of the most sensitive aquatic species in Pennsylvania watersheds. Brook trout favorcold, highly-oxygenated water and are unusually sensitive to warmer temperatures, sediments, and contaminants.Once widely distributed across Pennsylvania, healthy populations have retreated to a shrinking number of small
watersheds. Many of these watersheds overlap with the Marcellus shale formation. A large majority (113) of the138 intact or predicted intact native brook trout watersheds in Pennsylvania are projected to see at least someMarcellus gas development. Over half (74) are projected to host between 6 – 38 well pads, and the numberreaches as high as 64 pads for some intact brook trout watersheds in the high scenario. Rigorous sedimentcontrols and carefully designed stream crossings will be critical for brook trout survival in watersheds, especiallyupper watersheds, with intensive Marcellus development.
Map showing projected number of Marcellus well pads by 2030 in intact and predicted intact brook troutwatersheds under medium scenario. Data source: Eastern Brook Trout Joint Venture.

8/8/2019 Pennsylvania Energy Impacts Assessment
http://slidepdf.com/reader/full/pennsylvania-energy-impacts-assessment 25/47
24
RARE SPECIES
Of the approximately 100,000 species believed to occur inPennsylvania, just over 1 percent (1052) are tracked by ThePennsylvania Natural Heritage Program (PNHP). Due to lowpopulation sizes and immediate threats, these species are rare,declining or otherwise considered to be of conservation concern.PNHP records indicate that 329 tracked species have populationswithin pixels that have a relatively high modeled probability forMarcellus development. Nearly 40 percent (132) are considered tobe globally rare or critically endangered or imperiled in Pennsylvania.Many are found in riparian areas, streams, and wetlands, whileothers are clustered in unusually biologically diverse areas such asthe Youghiogheny Gorge. Some of these species may have only one,two or three populations left in the state. Two examples include thegreen salamander ( Aniedes aeneus) with all known populations inrelatively high probability Marcellus development pixels and snowtrillium ( Trillium nivale ) with 73 percent of known populations inrelatively high probability pixels. A well-managed screening system toidentify the presence of these species and their preferred habitats will be critical to their survival as energydevelopment expands across the state.
RECREATION
Pennsylvania has built one of the largest networks of public recreation lands in the eastern United States, butmuch of it could see Marcellus and other natural gas development in coming decades. Of the 4.5 million acres of state and federal lands in the state, we estimate as little as 500,000 acres are permanently protected from surface
mineral development, including gas drilling. State and federal agencies do not own mineral rights under at least2.2 million acres. Most other areas where the state does own mineral rights can be leased, such as the estimated700,000 acres previously leased for gas development on state forest lands. Severe budget pressures will likely totempt the legislature to lease additional lands in the future. Our projections excluded state Wild and NaturalAreas, National Park lands, and Congressionally-designated Wilderness Areas but otherwise assumed that highprobability Marcellus gas pixels on public lands could be developed. The low scenario projects 897 pad locationson State Forest and State Game Lands which expands to 1,438 well pads in the medium scenario and 2,096 pads inthe high scenario. The focal area below illustrates what the overlap of future gas development and conservationlands could look like in the medium scenario for the southern Laurel Highlands. It projects 7 well pads in theportion of Forbes State Forest visible in the focal area above, 13 pads on State Game Lands 51, and 3 on StateGame Lands 111.
Green salamander © Pennsylvania Fishand Boat Commission

8/8/2019 Pennsylvania Energy Impacts Assessment
http://slidepdf.com/reader/full/pennsylvania-energy-impacts-assessment 26/47
25
Pennsylvania’s state park system, recognized as one of the best in the nation, illustrates the challenge of protecting recreational values in areas of intensive Marcellus development. While the DCNR has a long standing
policy of not extracting natural resources in state parks, it does not own the mineral rights under an estimated 80percent of the system’s 283,000 acres. Our projections indicate Marcellus well pads could be located in between 9and 22 state parks.
AVOIDING FOREST IMPACTS IN THE LAUREL HIGHLANDS
The projected potential impacts of Marcellus gas energy development assume recent patterns of development willcontinue. Given the relativelylarge areas drained byMarcellus gas pads(depending on the laterallength and number of wellsper pad), there is flexibility inhow they are placed. Thisallows us potentially tooptimize between energyproduction and conservationoutcomes. To look at how
conservation impacts could be minimized, we examined how projected Marcellus gas pads could be relocated to
Projected Well Pads on State Lands (Medium Scenario)
DCNR State Forests 1,002
DCNR State Parks 41
State Game Lands 436
Total State Lands 1,479
Map showing projected Marcellus well pads under the medium scenario on public andprivate conservation lands in the Laurel Highlands.

8/8/2019 Pennsylvania Energy Impacts Assessment
http://slidepdf.com/reader/full/pennsylvania-energy-impacts-assessment 27/47
26
avoid forest patches in the Southern Laurel Highlands in Fayette and Somerset counties. This area is importantbecause it represents a unique ecological region with a large amount of state land as well as private farmland andforest land. The area is also facing great pressure to develop the Marcellus Gas resource. The focus area includedapproximately 350 square miles and included Chestnut Ridge on its western border and Laurel Ridge on its east.Within the area, there are two state parks (Ohiopyle State Park and Laurel Hill State Park), two State Game Lands(SGL 51, SGL 111), and state forest land (Forbes State Forest).
The Medium Scenario projected 127 well pads in the focus area. Fourteen well pads were projected in agriculturalfields, 33 were in edge habitat (within 100 m of the forest edge), 11 fell within existing cleared areas (e.g. stripmines), and 69 were in forest. There were five pads on Ohiopyle State Park, and 13 within a mile of its boundary.Laurel Ridge State Park contained two pads. Forbes State Forest had seven modeled pads. State Game Lands 111
had 3 pads, and SGL 51 had 13. It was not clear if DCNR State Parks Bureau or the Game Commission control thesub-surface mineral rights beneath the 23 modeled pads. Given that 80 percent of mineral rights are severed onState Park and State Game Lands (and close to 100 percent in western parts of the state), we have assumed thatdrilling could happen at those projected locations.
To assess additional impacts beyond the well pad itself, we placed a new and/or improved road from the projectedpad to the nearest existing road (ESRI Roads Layer). We placed new roads along existing trails, paths and openingswhenever detectable on aerial photo imagery (used Bing Maps and 2005-2006 PA Map imagery), avoidingwetlands, steep slopes, cliffs, rock outcrops, and buildings, and where possible, rivers, streams, and forest patches.The projected pads and roads required clearing 400 acres of forest.
Can a modest shift in the location of well pads reduce impacts to forest patches and conservation lands? Toreduce the impacts to forest habitats, the wells were relocated to nearby existing anthropogenic openings, oldfields, or agricultural fields. Attempts were made to maintain the 4,200 foot (1,260 m) distance between modeledwells. If nearby open areas did not exist, the locations of the well pads were moved toward the edges of forestpatches to minimize impacts to forest interior habitats. A set of rules was developed and followed to minimize
bias, including:
1. Modeled well pads were not relocated if they occurred in old fields or agricultural fields.2. Modeled well pads that occurred in forest or edge habitat were moved but well pads were placed in the
same general areas as the modeled well pad;3. Attempts were made to avoid placing relocated well pads any closer that the minimum distance between
pads, as specified by the medium scenario (1260 m )4. Agriculture, cleared land (e.g., former strip mines), or otherwise opened land cover was favored over
forest or edges for relocating well pads;5. If the well pad could not be placed in an open area, forest edges were favored over deep interior forest;6. Residential areas were avoided. Relocated well pads were placed at least 500 feet (150 m) from homes;7. Wetlands, water, steep slopes, cliffs, rock outcrops, creeks and rivers, buildings and manicured lawns
were avoided;8. Relocated well pads were only placed in areas with similar to those that supported modeled pads.9. Relocated well pads often were connected to roads using existing trails, paths and openings whenever
detectable on aerial photo imagery (used Bing Maps and 2005-2006 PA Map imagery);10. The same number of relocated well pads were placed on state lands and Western Pennsylvania
Conservancy lands as they were in the modeled output;11. When the modeled well pad occurred within a forest patch with no nearby alternative locations (due to
proximity of other wells or environmental constraints), the projected well pad was not relocated.

8/8/2019 Pennsylvania Energy Impacts Assessment
http://slidepdf.com/reader/full/pennsylvania-energy-impacts-assessment 28/47
27
400
4,138
244
2,830
0
500
1000
1500
2000
2500
3000
3500
4000
4500
Direct Impacts Indirect Impacts
A c r e s
Total Forested Acres Converted
ModeledWell/Road
Locations
RelocatedWell/RoadLocations
The relocated wells and roads did not eliminate forest impacts in this heavily forested landscape, but therewas a significant reduction. Total forest loss declined almost 40% while impacts to interior forest habitatsadjacent to new clearings declined by a third.

8/8/2019 Pennsylvania Energy Impacts Assessment
http://slidepdf.com/reader/full/pennsylvania-energy-impacts-assessment 29/47
28
Relocated well pads (on the right) reduced forest clearing and forest interior habitat impactsby 40 % and 33% respectively compared to the projected well pads (on the left).
Location of 127 projected Marcellus well pads and new roads in the study area in thesouthern Laurel Highlands.
8/8/2019 Pennsylvania Energy Impacts Assessment
http://slidepdf.com/reader/full/pennsylvania-energy-impacts-assessment 30/47
29
Key Findings
Key findings from the Pennsylvania Energy Impacts Assessment for Marcellus Shale natural gas include:
About 60,000 new Marcellus wells are projected by 2030 in Pennsylvania with a range of 6,000 to 15,000well pads, depending on the number of wells per pad;
Wells are likely to be developed in at least 30 counties, with the greatest number concentrated in 15southwestern, north central, and northeastern counties;
Nearly two thirds of well pads are projected to be in forest areas, with forest clearing projected to rangebetween 34,000 and 83,000 acres depending on the number of number of well pads that are developed.An additional range of 80,000 to 200,000 acres of forest interior habitat impacts are projected due to newforest edges created by well pads and associated infrastructure (roads, water impoundments);
On a statewide basis, the projected forest clearing from well pad development would affect less than onepercent of the state’s forests, but forest clearing and fragmentation could be much more pronounced inareas with intensive Marcellus development;
Approximately one third of Pennsylvania’s largest forest patches (>5,000 acres) are projected to have arange of between 1 and 17 well pads in the medium scenario;
Impacts on forest interior breeding bird habitats vary with the range and population densities of thespecies. The widely-distributed scarlet tanager would see relatively modest impacts to its statewidepopulation while black-throated blue warblers, with a Pennsylvania range that largely overlaps withMarcellus development area, could see more significant population impacts;
Watersheds with healthy eastern brook trout populations substantially overlap with projected Marcellusdevelopment sites. The state’s watersheds ranked as “intact” by the Eastern Brook Trout Joint Ventureare concentrated in north central Pennsylvania, where most of these small watersheds are projected tohave between two and three dozen well pads;
Nearly a third of the species tracked by the Pennsylvania Natural Heritage Program are found in areasprojected to have a high probability of Marcellus well development, with 132 considered to be globallyrare or critically endangered or imperiled in Pennsylvania. Several of these species have all or most of their known populations in Pennsylvania in high probability Marcellus gas development areas.
Marcellus gas development is projected to be extensive across Pennsylvania’s 4.5 million acres of publiclands, including State Parks, State Forests, and State Game Lands. Just over 10 percent of these lands are
legally protected from surface development.
Integration of conservation features into the planning and development of Marcellus gas well fields cansignificantly reduce impacts. For example, relocating projected wells to open areas or toward the edge of large forest patches in high probability gas development pixels in the southern Laurel Highlands reducesforest clearing by 40 percent and forest interior impacts by over a third.

8/8/2019 Pennsylvania Energy Impacts Assessment
http://slidepdf.com/reader/full/pennsylvania-energy-impacts-assessment 31/47
30
Additional Information
Geologic information on the Marcellus shale formation in Pennsylvania:
http://www.dcnr.state.pa.us/topogeo/oilandgas/marcellus_shale.aspx
Estimates of Marcellus shale formation gas reserves:http://geology.com/articles/marcellus-shale.shtml
Baker-Hughes weekly oil and gas rig counthttp://gis.bakerhughesdirect.com/Reports/StandardReport.aspx
Pennsylvania Department of Environmental Protection, Permit and Rig Activity Report: http://www.dep.state.pa.us/dep/deputate/minres/oilgas/RIG10.htm
Copeland, H. E., K.E. Doherty, D.E. Naugle, A. Pocewicz, and J. M. Kiesecker. 2009. Mapping Oil and GasDevelopment Potential in the US Intermountain West and Estimating Impacts to Species:http://www.plosone.org/article/info%3Adoi%2F10.1371%2Fjournal.pone.0007400
Overview of forest fragmentation impacts on forest interior nesting species:http://www.state.nj.us/dep/fgw/neomigr.htm
Overview of Pennsylvania High Quality and Exceptional Value Streams:http://www.dcnr.state.pa.us/wlhabitat/aquatic/streamdist.aspx
Pennsylvania Department of Environmental Protection, Chapter 93 Water Quality Standards, ExceptionalValue and High Quality Streams: data downloaded from Pennsylvania Spatial Data Access :http:/ /www.pasda.psu.edu
Eastern Brook Trout Joint Venture intact brook trout watersheds:http://128.118.47.58/EBTJV/ebtjv2.html
Overview of Carnegie Museum of Natural History, Powdermill Nature Reserve, and the PennsylvaniaGame Commissio n’s 2 nd Pennsylvania Breeding Bird Atlas Project:http://www.carnegiemnh.org/powdermill/atlas/2pbba.html
Pennsylvania Natural Heritage Program, including lists of globally rare and state endangered andimperiled species: http://www.naturalheritage.state.pa.us/
U.S. Department of Agriculture, Natural Resources Conservation Service, National Agriculture ImageryProgram: http://datagateway.nrcs.usda.gov/GDGOrder.aspx
DigitalGlobe, GlobeXplorer, ImageConnect Version 3.1: http:/ /www.digitalglobe.com
8/8/2019 Pennsylvania Energy Impacts Assessment
http://slidepdf.com/reader/full/pennsylvania-energy-impacts-assessment 32/47
31
Wind
Wind has become one of the coun try’s fastest growing sources of renewable energy. Pennsylvania is a leader in
the industry as host to several wind company manufacturing plants and corporate headquarters. Wind energydevelopment has been spurred by its potential to reduce carbon emissions, promote new manufacturing jobs, andincrease energy independence. Technological advances have expanded the size and efficiency of wind turbinesduring the past decade. This, together with state and federal incentive programs, has facilitated winddevelopment in Pennsylvania, which otherwise ranks relatively low among states for its potential wind generationcapacity. The eight turbines installed next to the Pennsylvania Turnpike in Somerset County a decade ago havegrown to nearly 500 turbines, with more permitted for construction (AWEA, 2010). Topography is a key factor inaverage wind speeds across Pennsylvania, so nearly all turbines have been built on mountain ridgelines or on topof high elevation plateaus.
Wind energy has become the most symbolic icon of the shift toward a low carbon economy. With no air
emissions or water consumption, it is one of the cleanest renewable energy types. Communities across the statebenefit economically as rural landowners lease their properties, skilled jobs are created to manufacture turbines,and workers are hired to install and maintain turbines. Wind development has faced controversy in some areasfrom neighboring landowners and those worried about impacts to migrating birds and bats. The wind industry,government agencies, and independent researchers have invested considerable effort in trying to betterunderstand impacts on birds and bats. For example, 26 wind development companies have signed a cooperativeagreement with the Pennsylvania Game Commission to conduct bird, bat and animal surveys using specifiedprotocols in proposed development areas. Among other findings have been the discovery of the Pennsylvania’ssecond largest Indiana bat maternal colony and a variety of previously undocumented foraging and roostinglocations for the state’s two rarest bats (Indiana and eastern small -footed). Less understood are the potentialhabitat impacts of wind development in the northeastern United States. This assessment, therefore, focuses on
impacts to forest and stream habitats and selected species of conservation concern that may be vulnerable todevelopment of ridgetop habitats.
What is Wind Energy?
Wind mills have powered grain processing and water pumping in agriculture around the world – most famously inthe Netherlands – for centuries. The first modern wind facilities to generate electricity were built in California inthe early 1980s. Rated at less than 0.5 MW capacity per turbine, the towers were only 50 feet tall. These facilitieswere poorly designed and generated considerable controversy because they caused significant mortalities tomigrating hawks and eagles. Wind energy development did not expand appreciably until the late 1990s whennewer turbine designs and federal energy incentives stimulated the development of new facilities. These turbineswere rated at 1.0 or 1.5 MW capacity and reached about 200 feet high at the tip of their rotor. Since the powerproduced by a wind turbine is proportional to the cube of the blade size and how high in the air it is; turbine size,height and power ratings have expanded steadily. The largest turbines installed in Pennsylvania are now rated at

8/8/2019 Pennsylvania Energy Impacts Assessment
http://slidepdf.com/reader/full/pennsylvania-energy-impacts-assessment 33/47
32
2.5 MW (the average was 1.8 MW in 2009) and reach over 400 feet to the tip of the rotor at the apex of itsrotation.
Location is everything for wind development in the northeastern United States. Unlike the vast windswept plainsin the Midwest and the intermountain West, high wind speeds in the Northeast are primarily confined to mountainridgetops, plateau escarpments, and the Atlantic and Great Lake shorelines. Areas that have a wind power classrating of 3 or more (300 watts per m 2) are potentially feasible for wind power development. Wind companies willlease areas that seem to have the most favorable characteristics including wind class, flat pad sites, proximity totransmission lines, and proximity to existing highways. Before development, a wind development company willtypically place an anemometer tower on potential development sites to improve knowledge about wind power atthe site during a year or longer monitoring period. The turbines are mounted on pads at least 800 feet apart withan access road between towers. The average size of wind facilities has been growing steadily since the first eightwere established in 2000. The two largest facilities are now between 75 and 100 turbines.
Several steps have been taken to address potential conflicts between wind development and wildlife inPennsylvania. The Pennsylvania Game Commission (PGC) has a voluntary agreement in place with most wind
companies active in the state to screen proposed facilities for possible impacts to birds and bats and migratorypathways. Participating wind companies carry out pre-construction monitoring for birds and bats. If possibleconflicts are identified, PGC works with wind companies to avoid or minimize impacts and to continue monitoringpost construction in some cases. Second, the Pennsylvania Wind and Wildlife Collaborative (PWWC) wasestablished in 2005 with a stat e goal to develop a set of “Pennsylvania -specific principles, policies and bestmanagement practices, guidelines and tools to assess risks to habitat and wildlife, and to mitigate for the impact of that development.” Several studies on wildlife and habita t issues have been commissioned, though guidelines andBest Management Practices (BMPs) have not been released.
Current and Projected Wind Energy Development
We documented the spatialfoot print of 319 windturbines at 12 wind facilitiesacross the state bycomparing aerial photostaken before and afterdevelopment. Turbine pads,roads, and other newclearings were digitized for
all 12 facilities visible in2008 images from the
Map showing 12 windfacilities included in thespatial footprint analysis.
8/8/2019 Pennsylvania Energy Impacts Assessment
http://slidepdf.com/reader/full/pennsylvania-energy-impacts-assessment 34/47
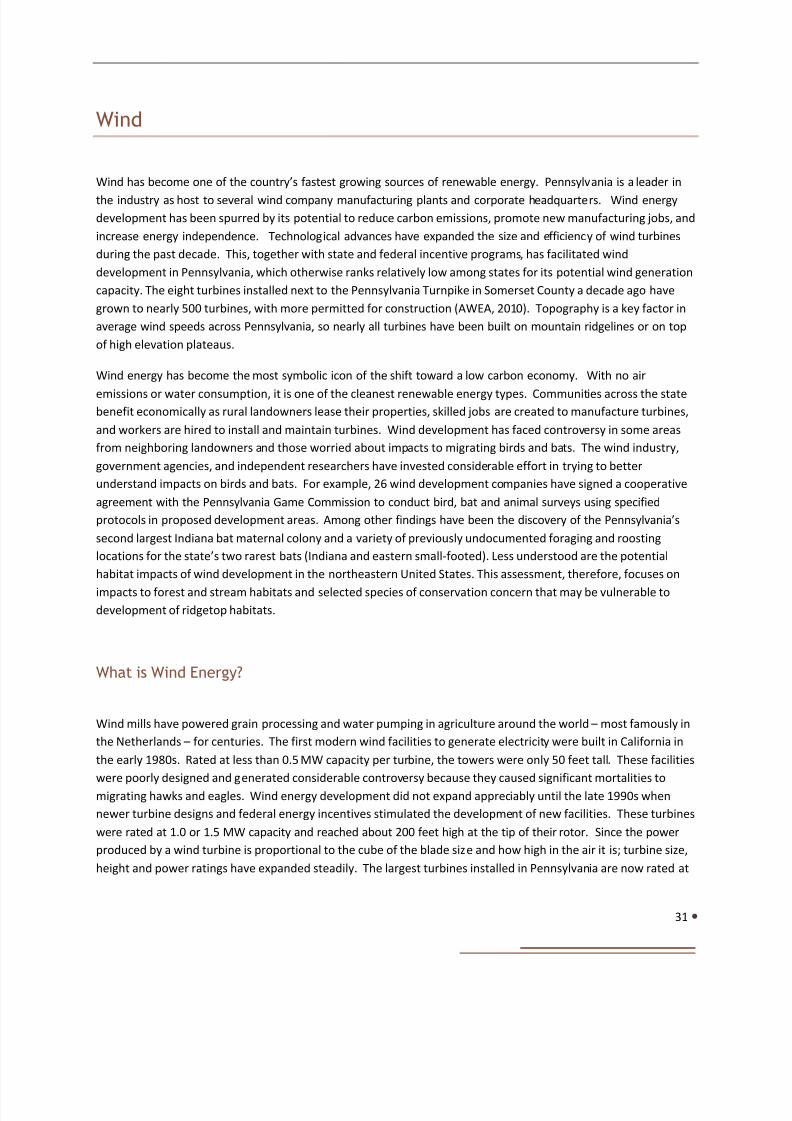
33
National Agriculture Imagery Program. The ground excavated for turbines, roads, and associated infrastructure(e.g., clearings forconstruction staging areas orelectrical sub-stations) is themost obvious spatial impact.For each turbine site, thearea for the turbine pad, newroads, staging areas, and sub-stations were digitized andmeasured. Turbine padsoccupy 1.4 acres on averagewhile the associatedinfrastructure (roads, stagingareas and substations) takesup 0.5 acres, or a total of 1.9
acres of spatial impact per wind turbine.
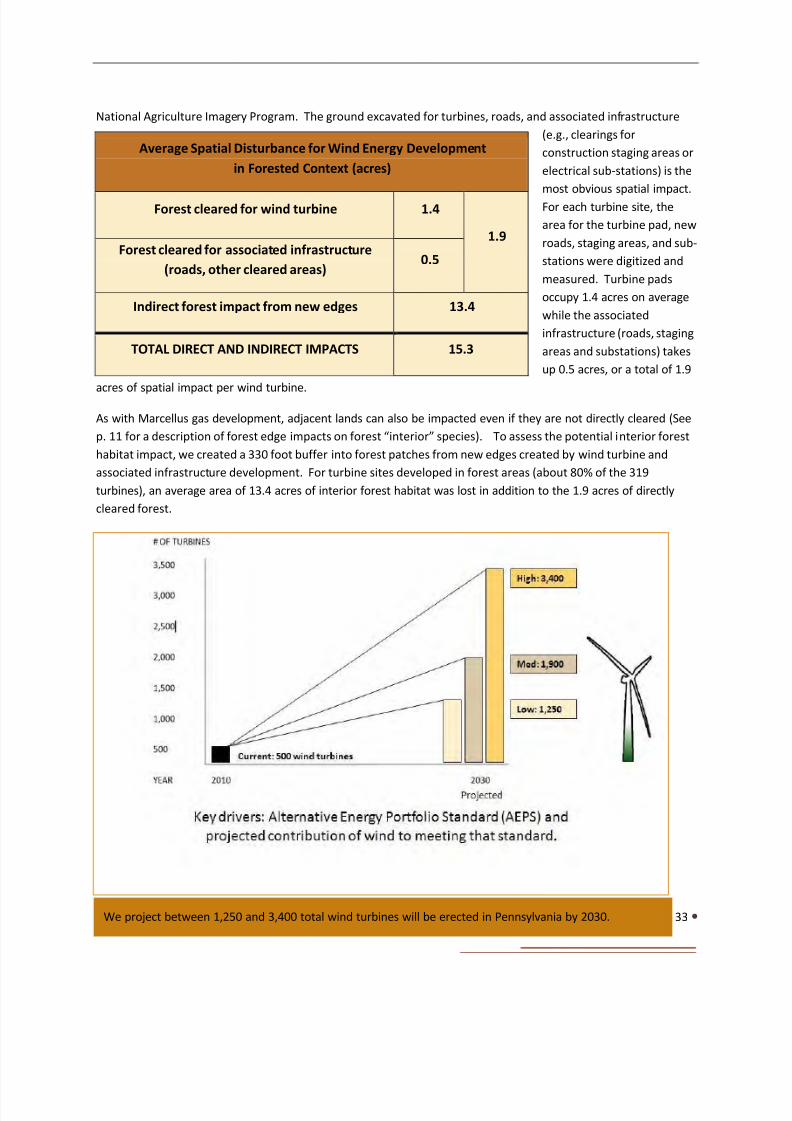
As with Marcellus gas development, adjacent lands can also be impacted even if they are not directly cleared (Seep. 11 for a description of forest edge impacts on forest “interior” species). To assess the potential interior foresthabitat impact, we created a 330 foot buffer into forest patches from new edges created by wind turbine andassociated infrastructure development. For turbine sites developed in forest areas (about 80% of the 319turbines), an average area of 13.4 acres of interior forest habitat was lost in addition to the 1.9 acres of directlycleared forest.
Average Spatial Disturbance for Wind Energy Developmentin Forested Context (acres)
Forest cleared for wind turbine 1.4
1.9 Forest cleared for associated infrastructure
(roads, other cleared areas) 0.5
Indirect forest impact from new edges 13.4
TOTAL DIRECT AND INDIRECT IMPACTS 15.3
We project between 1,250 and 3,400 total wind turbines will be erected in Pennsylvania by 2030.

8/8/2019 Pennsylvania Energy Impacts Assessment
http://slidepdf.com/reader/full/pennsylvania-energy-impacts-assessment 35/47
34
The number of wind turbines built in Pennsylvania will certainly expand during the next two decades. Variousfactors will drive exactly how many turbines are ultimately built including electricity prices, state and federalincentives, technological improvements, energy and climate policy, regulatory changes, and social preferences.Our projections assume economic, policy, and social conditions will remain favorable enough to promote steadyexpansion of wind development in the state since we cannot reasonably forecast energy prices, technologicaldevelopments, and policy conditions. The key driver in our low scenario is that companies will use wind energy tomeet 70 percent of the current Alternative Energy Portfolio Standard (AEPS) Tier 1 standard (8 percent of electricgeneration). This projection indicates an additional 750 turbines (2 MW average) will be added to the 500 turbinescurrently operating. The key driver in our medium scenario is that utilities will use wind energy to meet 70 percentof an expanded AEPS 15% Tier 1 standard, as proposed in recent draft legislation. That scenario would add 1,400new turbines to those already built. The high scenario used in this assessment is based on the 20% wind powerelectric generation scenario used by the National Renewable Energy Laboratory in the Eastern Wind IntegrationStudy (EWITS). This scenario would require 2,900 additional turbines.
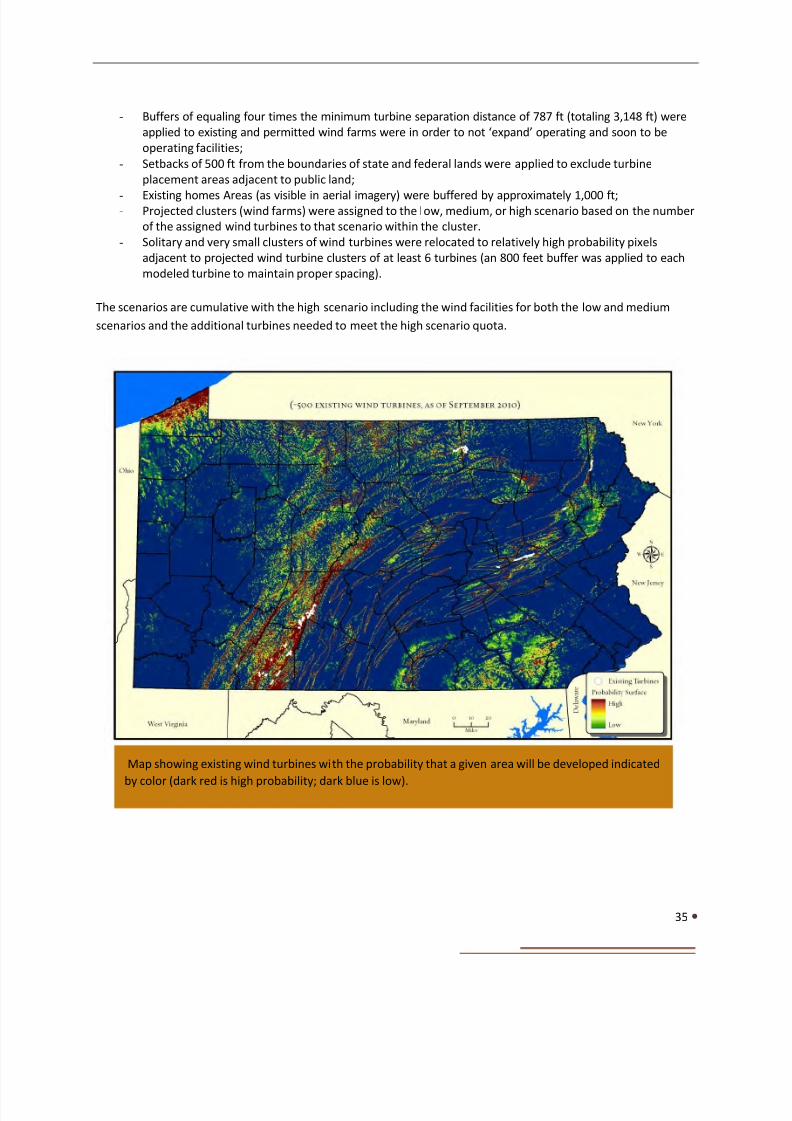
Where are those new turbines in each scenario more and less likely to go? To start, we created a probabilitysurface by looking at a range of variables that might be relevant to a company’s decision to develop a wind facilitywith wind turbines that have already been built. We used the maximum entropy modeling approach used todevelop the Marcellus gas probability surface (see p. 13) and built the model using 580 existing and permittedwind turbines. Variables that potentially drive wind energy development were chosen based on data availabilityand included wind power (W/m 2), distance to transmission lines, percent slope, distance to roads, and land cover.An additional 193 existing and permitted wind turbines were used to test the validity of the model’s probabil itysurface and the model was found to be 95.8% accurate in predicting existing and permitted turbines fromrandomly sampled undeveloped areas. The resulting probability map indicates many long, narrow high probabilitysites along ridge tops, and several wider areas on high plateaus and along the Lake Erie coastline.
To get a better sense of where wind development is more likely, we searched for the highest probability areaswhere wind turbine pads in each scenario might be located. The probability raster was re-sampled to 60 meter
resolution (0.89 acres) to reflect the actual geographic footprint of wind turbines based on aerial photoassessment. We selected the highest available probability pixel for each scenario and then buffered that pixel by aminimum separation distance of 800 feet (240 meters – the site distance between turbines) between existingturbines before selecting the next highest available probability pixel. The highest probable pixels were thenselected until the threshold for each impact scenario was reached (low – 700 turbines; medium – 1,200 turbines;high – 2,700 turbines). Areas incompatible for wind energy development (existing wind turbines, Wild and NaturalAreas, and water bodies) were excluded from being selected as probable pixels. The highest probable pixels werethen converted into points for map display purposes.
The resulting projected turbine locations occur in strings, groups, and widely scattered single or very small clusters(2-5) of turbines, mostly in southwest, north central and northeastern parts of Pennsylvania.
Wind turbines, however, are almost always located in clusters rather than widely separated locations for individualturbines. In order to represent viable wind farms, we selected clusters of pixels with high probability to representprobable farms based on the results of the model. The following steps were applied to standardize the selectionprocess:
- All selected wind facilities had to be anchored by at least 6 projected wind turbine sites selected by themodel
8/8/2019 Pennsylvania Energy Impacts Assessment
http://slidepdf.com/reader/full/pennsylvania-energy-impacts-assessment 36/47
35
- Buffers of equaling four times the minimum turbine separation distance of 787 ft (totaling 3,148 ft) wereapplied to existing and permitted wind farms were in order to not ‘expand’ operating and soon to beoperating facilities;
- Setbacks of 500 ft from the boundaries of state and federal lands were applied to exclude turbineplacement areas adjacent to public land;
- Existing homes Areas (as visible in aerial imagery) were buffered by approximately 1,000 ft;- Projected clusters (wind farms) were assigned to the low, medium, or high scenario based on the numberof the assigned wind turbines to that scenario within the cluster.
- Solitary and very small clusters of wind turbines were relocated to relatively high probability pixelsadjacent to projected wind turbine clusters of at least 6 turbines (an 800 feet buffer was applied to eachmodeled turbine to maintain proper spacing).
The scenarios are cumulative with the high scenario including the wind facilities for both the low and mediumscenarios and the additional turbines needed to meet the high scenario quota.
Map showing existing wind turbines with the probability that a given area will be developed indicated
by color (dark red is high probability; dark blue is low).

8/8/2019 Pennsylvania Energy Impacts Assessment
http://slidepdf.com/reader/full/pennsylvania-energy-impacts-assessment 37/47
36
Map showing 1,400 new wind turbines projected by 2030 under the medium development scenario.

8/8/2019 Pennsylvania Energy Impacts Assessment
http://slidepdf.com/reader/full/pennsylvania-energy-impacts-assessment 38/47
37
Map showing 750 new wind turbines projected by 2030 under the low development scenario.
Map showing 2,900 new wind turbines projected by 2030 under the high development scenario.
8/8/2019 Pennsylvania Energy Impacts Assessment
http://slidepdf.com/reader/full/pennsylvania-energy-impacts-assessment 39/47
38
These geographic projections of future wind energy development are spatial representations of possible scenarios.They are not predictions. We faced several constraints in developing the geographic scenarios:
We do not have the detailed wind power data that wind companies have developed through anemometer
tower monitoring.We do not have the detailed location of wind energy leases.
Still, we believe the overall geographic patterns in the projected wind development locations are relatively robustfor several reasons. We used over 500 existing or permitted wind turbines to build the model and nearly 200additional existing and permitted wind turbine sites were used to validate the model. This is typically a sufficientsample size for building predictive models. They are also consistent with Black and Veatch (2010) projectedlocations for wind facilities under a 15% renewable energy portfolio standard.
Conservation Impacts of Wind Energy Development
What is the overlap of the areas with the highest probability of future wind energy development and those areasknown to have high conservation values? To answer this question, we intersected the projected wind energyfacilities with high conservation value areas. We looked at several examples from four categories of conservationvalue, including:
Forest habitats
Freshwater habitats
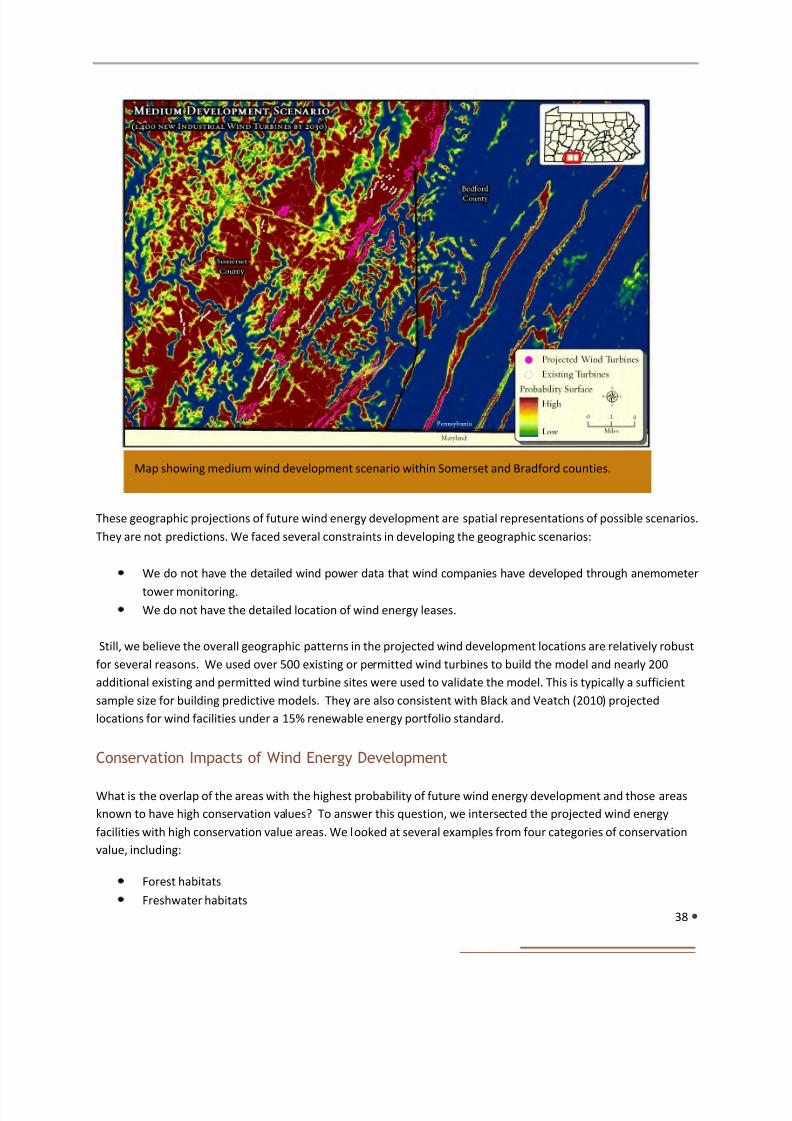
Map showing medium wind development scenario within Somerset and Bradford counties.

8/8/2019 Pennsylvania Energy Impacts Assessment
http://slidepdf.com/reader/full/pennsylvania-energy-impacts-assessment 40/47
39
Species of conservation concern
Outdoor recreation
Areas of overlap between likely future wind development areas and priority conservation areas in Pennsylvania aresubstantially less than the conservation area overlap with likely future Marcellus development areas, largelybecause the projected foot print will be much smaller.
Forests
A large majority of projected wind turbines are found in forest patches, about 80 percent for each of the scenarios.The low scenario would see 600 new wind turbines in forest areas. With a cleared forest average of 1.9 acres perturbine (including roads and other infrastructure), the total forest loss would be a modest 1,140 acres. Indirectimpacts to adjacent forest interior habitats would total an additional 7,920 acres. Forest impacts from the mediumscenario (1,120 projected new turbines in forest locations) would be 2,128 cleared forest acres and an additional15,840 acres of adjacent forest interior habitat impacts. For the high scenario (2,320 new turbines in forest areas)4,408 acres would be cleared and an additional 30,624 acres of forest interior habitats would be affected by new
adjacent clearings. On a statewide basis, the projected forest losses and accompanying interior forest habitatimpacts will be minor given the Pennsylvania’s 16 million acres of forest. Locally, these impacts could b esignificant for individual large forest patches where wind development takes place.
All forests have conservation value, but large contiguous forest patches are especially valuable because theysustain wide-ranging forest species, such as northern goshawk, than small patches. They are also more resistant tothe spread of invasive species, can better withstand damage from wind and ice storms, and provide moreecosystem services – from carbon sequestration to water filtration – than small patches. The Nature Conservancyand the Western Pennsylvania Conservancy’s Forest Conservation Analysis mapped nearly 25,000 forest patches inthe state greater than 100 acres. Patches at least 1,000 acres in size are about a tenth of the total (2,700). Themedium projected wind development scenarios indicate 73 patches (3%) greater than 1,000 acres in size are
projected to have at least one wind turbine and associated infrastructure. Patches at least 5,000 acres in size arerelatively rare (only 316 patches). The medium wind scenario indicates about 21 (7%) of these patches could beaffected by future wind turbine development. Most affected large patches have multiple projected wind turbines(as many as 36). Typically, a large patch is split by wind development into two or three smaller patches due thelinear pattern of development. Projected gas well pads, by contrast, are more likely to fragment a large patch intomultiple smaller patches.
Forest interior bird species could be affected by the clearing of forest and adjacent edge effects that wind turbinefacilities create in a forest context. We used data from the 2 nd Breeding Bird Atlas Project (see p. 20) to assess thepotential impact on forest interior species. The resulting maps show the estimated reduction in habitat for thatspecies in each high wind development gas probability pixel (including both cleared forest and adjacent edgeeffects). Scarlet Tanagers are perhaps the most widespread forest interior nesting bird in the state. Since they areso widespread, the vast majority of their range in the state is outside of the most likely wind development areas.Scarlet Tanager populations could decline by an insignificant amount due to habitat losses projected in themedium scenario. Black-throated blue warblers are more narrowly distributed in Pennsylvania favoring maturenorthern hardwood and coniferous forests with a thick understory, frequently in mountain terrain. Likewise,population declines would also be extremely small for Black-throated blue warblers under the medium scenario.

8/8/2019 Pennsylvania Energy Impacts Assessment
http://slidepdf.com/reader/full/pennsylvania-energy-impacts-assessment 41/47
40
Map showing estimated percent loss of habitat for Black-Throated Blue Warblers under themedium wind scenario.
Map showing estimated percent loss of habitat for Scarlet Tanagers under the medium windscenario.

8/8/2019 Pennsylvania Energy Impacts Assessment
http://slidepdf.com/reader/full/pennsylvania-energy-impacts-assessment 42/47
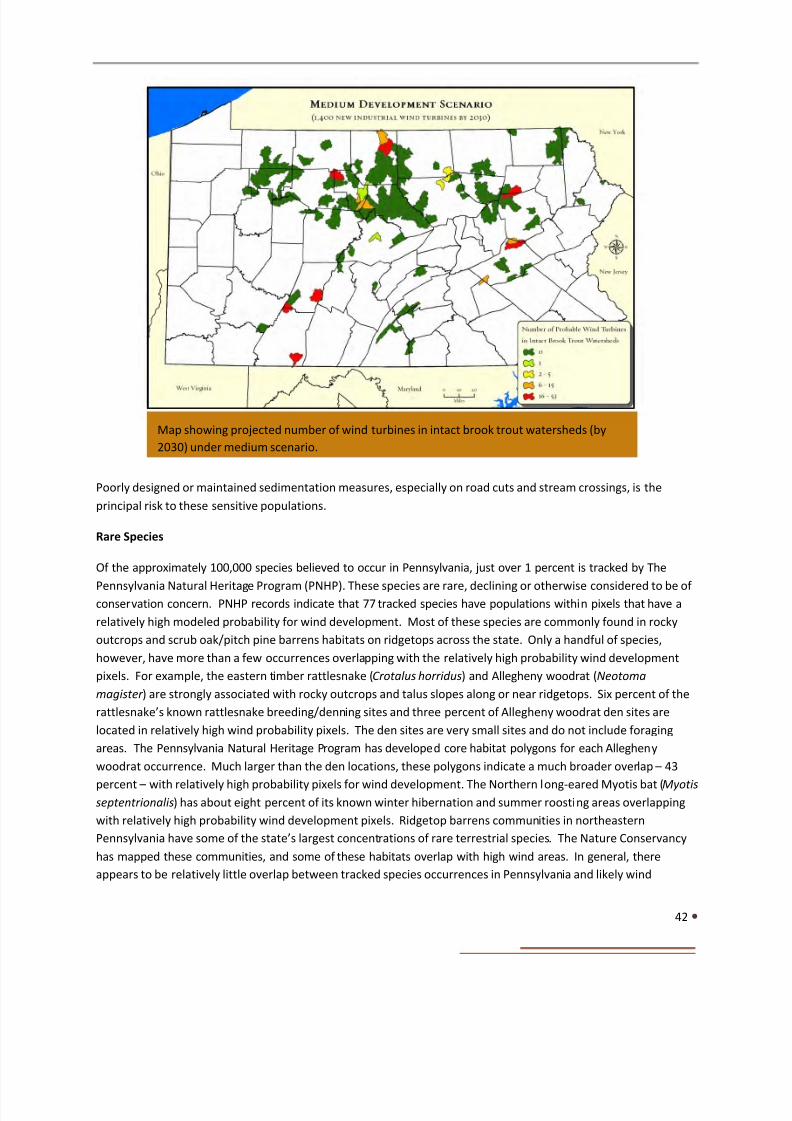
8/8/2019 Pennsylvania Energy Impacts Assessment
http://slidepdf.com/reader/full/pennsylvania-energy-impacts-assessment 43/47
42
Poorly designed or maintained sedimentation measures, especially on road cuts and stream crossings, is theprincipal risk to these sensitive populations.
Rare Species
Of the approximately 100,000 species believed to occur in Pennsylvania, just over 1 percent is tracked by The
Pennsylvania Natural Heritage Program (PNHP). These species are rare, declining or otherwise considered to be of conservation concern. PNHP records indicate that 77 tracked species have populations within pixels that have arelatively high modeled probability for wind development. Most of these species are commonly found in rockyoutcrops and scrub oak/pitch pine barrens habitats on ridgetops across the state. Only a handful of species,however, have more than a few occurrences overlapping with the relatively high probability wind developmentpixels. For example, the eastern timber rattlesnake ( Crotalus horridus ) and Allegheny woodrat ( Neotomamagister ) are strongly associated with rocky outcrops and talus slopes along or near ridgetops. Six percent of therattlesnake’s known rattlesnake breeding/denning sites and three percent of Allegheny woodrat den sites arelocated in relatively high wind probability pixels. The den sites are very small sites and do not include foragingareas. The Pennsylvania Natural Heritage Program has developed core habitat polygons for each Alleghenywoodrat occurrence. Much larger than the den locations, these polygons indicate a much broader overlap – 43
percent – with relatively high probability pixels for wind development. The Northern long-eared Myotis bat ( Myotisseptentrionalis ) has about eight percent of its known winter hibernation and summer roosting areas overlappingwith relatively high probability wind development pixels. Ridgetop barrens communities in northeasternPennsylvania have some of the state’s largest concentrations of rare terrestrial species. The Nature Conservancyhas mapped these communities, and some of these habitats overlap with high wind areas. In general, thereappears to be relatively little overlap between tracked species occurrences in Pennsylvania and likely wind
Map showing projected number of wind turbines in intact brook trout watersheds (by2030) under medium scenario.

8/8/2019 Pennsylvania Energy Impacts Assessment
http://slidepdf.com/reader/full/pennsylvania-energy-impacts-assessment 44/47
43
development sites. For a handful of species, there is enough overlap to indicate the importance of surveys early inthe project planning stage to identify the presence of rare species and their core habitats.
We have not addressed the potential impact of these scenarios on bird migration patterns and bat foragingpopulations. For more information on wind development impacts on bird and bat species, please see links to thePennsylvania Game Commission, U.S. Fish and Wildlife Service, American Wind and Wildlife Institute, and BatConservation International.
Recreation
Wind development has not occurred on any state or federal lands in Pennsylvania to date. Since our projectionsassume there will not be a significant change in state land leasing policies for wind development, we have notprojected new wind turbines in State Parks, State Forests or State Game Lands. Our projections, however, doindicate that wind turbines will be located in close proximity (sometimes as close as 500 feet) to many state lands.They are likely to be highly visible in some heavily visited areas, such as Blue Knob State Park in Bedford County,where natural landscape vistas are a prime attraction.

8/8/2019 Pennsylvania Energy Impacts Assessment
http://slidepdf.com/reader/full/pennsylvania-energy-impacts-assessment 45/47
44
Key Findings
Key findings from the Pennsylvania Energy Impacts Assessment include:
Projections of between 750 and 2,900 new wind turbines developed on ridgetops and high plateaus by2030, depending on the size of the Pennsylvania Alternative Energy Portfolio standard. There arecurrently an estimated 500 wind turbines built in the state.
Wind turbine facilities are likely to be develo ped in half of the state’s counties, especially along theAllegheny front in western Pennsylvania and on high Central Appalachian ridges in central andnortheastern parts of the state;
Nearly eighty percent of turbine locations are projected to be in forest areas, with forest clearingprojected to range between 1,140 and 4,400 acres depending on the number of turbines developed. Anadditional range of 7,900 to 30,600 acres of forest interior habitat impacts are projected due to newedges created by turbine pads and roads;
On a statewide basis, the projected forest clearing from turbine development is relatively minor, thoughsome of the state’s largest forest patches (>5,000 acres) could be fragmented into smaller patches byprojected wind turbine development;
Impacts on forest interior breeding bird habitats appear to be limited, largely because the overallfootprint for the projected wind turbine facilities is small in comparison to the typical breeding range of these species in Pennsylvania. The study did not assess impacts to migratory pathways for birds orforaging bats.
Relatively few watersheds ranked as “intact” by the Eastern Brook Trout Joint Venture are affected byprojected wind turbine development. Several intact watersheds, however, could see several dozen wind
turbines. In a number of cases, these small watersheds are projected to see significant Marcellus gasdevelopment as well. Given the cumulative impact of these activities, rigorously designed and monitoredsediment control measures will be needed to protect sensitive brook trout populations.
A relatively small handful of rare species occurrences tracked by the Pennsylvania Natural HeritageProgram are found in areas with high probability for wind development. These species tend to beassociated with rocky outcrops and barrens communities typically found on ridge tops, including theAllegheny wood rat, the eastern timber rattlesnake, and the northern long-eared Myotis bat.
Wind development is not projected to occur on Pennsylva nia’s public lands. Existing and projected windturbines, however, will be close to some of Pennsylvania’s most heavily visited outdoor recreation areaswhere scenic natural vistas are a major attraction.
8/8/2019 Pennsylvania Energy Impacts Assessment
http://slidepdf.com/reader/full/pennsylvania-energy-impacts-assessment 46/47
45
Additional Information
American Wind Energy Association (2010). U.S. Wind Projects Database.http://www.awea.org/la_usprojects.cfm
Black and Veatch (2010) Study for the Community Foundation for the Alleghenies: Assessment of a 15Percent Pennsylvania Alternative Energy Portfolio Standard: http://www.cfalleghenies.org/pdf/aepss.pdf
Federal Aviation Administration (FAA) permits for wind turbines:https://oeaaa.faa.gov/oeaaa/external/public/publicAction.jsp?action=showCaseDownloadForm
Federal Aviation Administration (FAA), Obstruction Evaluation / Airport Airspace Analysis (OE/AAA):https://oeaaa.faa.gov/oeaaa/external/public/publicAction.jsp?action=showCaseDownloadForm
Pennsylvania Wind Farms and Wildlife Collaborative: http://www.dcnr.state.pa.us/wind/index.aspx
PA Game Commission (2007) Wind Energy Voluntary Cooperative Agreement and First Annual Report forthe Wind Energy Voluntary Cooperative Agreement:http://www.portal.state.pa.us/portal/server.pt?open=514&objID=613068&mode=2
Pennsylvania Department of Environmental Protection, Chapter 93 Water Quality Standards, ExceptionalValue and High Quality Streams: data downloaded from Pennsylvania Spatial Data Access :(www.pasda.psu.edu )
U.S. Department of Energy TrueWind 80 Meter Wind Resource Maps:http://www.windpoweringamerica.gov/wind_maps.asp
U.S. Fish and Wildlife Service Wind Turbine Advisory Committee:http://www.fws.gov/habitatconservation/windpower/wind_turbine_advisory_committee.html
U.S. Environmental Protection Agency summary of forest fragmentation effects:http://cfpub.epa.gov/eroe/index.cfm?fuseaction=detail.viewInd&lv=list.listByAlpha&r=219658&subtop=210
Overview of forest fragmentation impacts on forest interior nesting species:http://www.state.nj.us/dep/fgw/neomigr.htm
Overview of Pennsylvania High Quality and Exceptional Value Streams:http://www.dcnr.state.pa.us/wlhabitat/aquatic/streamdist.aspx
Eastern Brook Trout Joint Venture intact brook trout watersheds:http://128.118.47.58/EBTJV/ebtjv2.html

8/8/2019 Pennsylvania Energy Impacts Assessment
http://slidepdf.com/reader/full/pennsylvania-energy-impacts-assessment 47/47
Overview of Carnegie Museum of Natural History, Powdermill Nature Reserve, and the PennsylvaniaGame Commission’s 2 nd Pennsylvania Breeding Bird Atlas Project:http://www.carnegiemnh.org/powdermill/atlas/2pbba.html
Pennsylvania Natural Heritage Program, including lists of globally rare and state endangered andimperiled species: http://www.naturalheritage.state.pa.us/
U.S. Department of Agriculture, Natural Resources Conservation Service, National Agriculture ImageryProgram: http://datagateway.nrcs.usda.gov/GDGOrder.aspx