PENNSYLVANIA COMPENSATION RATING … pennsylvania compensation rating bureau (pcrb) analysis of...
25
1 PENNSYLVANIA COMPENSATION RATING BUREAU (PCRB) ANALYSIS OF EXPERIENCE UNDER THE PENNSYLVANIA CONSTRUCTION CLASSIFICATION PREMIUM ADJUSTMENT PROGRAM (PCCPAP) The PCCPAP program responds to wage differentials within the construction industry, providing a program of premium credits to higher-wage employers. These credits are offset by loadings applied to construction classifications reflecting the portion of employers participating in the program and the average premium credit obtained by those participating businesses, thus maintaining the required premium level in each classification. The table of qualifying wages applicable to the PCCPAP is regularly amended based on actual changes to statewide average wage levels, with such filings subject to review and approval by the Insurance Department and most recently updated effective October 1, 2017. The PCRB has compiled and reviewed aggregate statistical data for the above-referenced program. This data covers Policy Years 1994 (Exhibit I) through 2013 (Exhibit XX). Also shown is the total of those years (Exhibit XXI). Exhibits I through XXI each present 16 statistics (described in the Appendix below) separately for each of the following three groups of policies: 1. Construction classification experience for policies eligible for participation in the PCCPAP during the indicated 12-month experience period (Column (1)). This is, in effect, all experience reported under Pennsylvania’s 600 series of classification codes. Policies including construction classifications may also include other classifications outside the construction (or 600) series. Experience for such non-construction classifications has been excluded from Exhibits I through XXI. 2. Construction classification experience for policies eligible for, and participating in, the PCCPAP during the indicated 12-month experience period (Column (2)). 3. Construction classification experience for policies eligible for, but not participating in, the PCCPAP during the indicated 12-month experience period (Column (3)). The following summary observations are based on a review of the attached Exhibits I through XXI: • Indicated PCCPAP credits vary considerably from year to year, ranging from an indicated credit of 13.3 percent for 2001 to an indicated debit of 35.8 percent in 2010. 2001 and 2004 were the only years for which the indicated credit exceeded the actual credit given. For fifteen of the twenty years shown, reported experience indicates a debit or surcharge adjustment for PCCPAP participating risks. For the period 1994 through 2013, in total, a debit of 3.6 percent was indicated for PCCPAP participating risks.
Transcript of PENNSYLVANIA COMPENSATION RATING … pennsylvania compensation rating bureau (pcrb) analysis of...
1
PENNSYLVANIA COMPENSATION RATING BUREAU (PCRB)
ANALYSIS OF EXPERIENCE UNDER THE PENNSYLVANIA CONSTRUCTION CLASSIFICATION PREMIUM ADJUSTMENT PROGRAM
(PCCPAP)
The PCCPAP program responds to wage differentials within the construction industry, providing a program of premium credits to higher-wage employers. These credits are offset by loadings applied to construction classifications reflecting the portion of employers participating in the program and the average premium credit obtained by those participating businesses, thus maintaining the required premium level in each classification. The table of qualifying wages applicable to the PCCPAP is regularly amended based on actual changes to statewide average wage levels, with such filings subject to review and approval by the Insurance Department and most recently updated effective October 1, 2017. The PCRB has compiled and reviewed aggregate statistical data for the above-referenced program. This data covers Policy Years 1994 (Exhibit I) through 2013 (Exhibit XX). Also shown is the total of those years (Exhibit XXI). Exhibits I through XXI each present 16 statistics (described in the Appendix below) separately for each of the following three groups of policies:
1. Construction classification experience for policies eligible for participation in the PCCPAP during the indicated 12-month experience period (Column (1)). This is, in effect, all experience reported under Pennsylvania’s 600 series of classification codes. Policies including construction classifications may also include other classifications outside the construction (or 600) series. Experience for such non-construction classifications has been excluded from Exhibits I through XXI.
2. Construction classification experience for policies eligible for, and participating in, the
PCCPAP during the indicated 12-month experience period (Column (2)).
3. Construction classification experience for policies eligible for, but not participating in, the PCCPAP during the indicated 12-month experience period (Column (3)).
The following summary observations are based on a review of the attached Exhibits I through XXI:
• Indicated PCCPAP credits vary considerably from year to year, ranging from an indicated credit of 13.3 percent for 2001 to an indicated debit of 35.8 percent in 2010. 2001 and 2004 were the only years for which the indicated credit exceeded the actual credit given. For fifteen of the twenty years shown, reported experience indicates a debit or surcharge adjustment for PCCPAP participating risks. For the period 1994 through 2013, in total, a debit of 3.6 percent was indicated for PCCPAP participating risks.
2
• For Policy Year 2013, 8.5 percent of eligible risks participated in the PCCPAP program. The portion of eligible risks participating had been relatively stable since 1997 but has declined in Policy Years 2008 through 2013. The premium for participating risks represented 17.1 percent of total premium on eligible risks in 2013. Compared with Policy Years 2003 through 2007, which had been relatively stable, the portion of premium for participating risks has generally declined in Policy Years 2008 through 2013.
• Average PCCPAP credits given to participating risks have been relatively consistent
during the period 1994 through 2013. The credit shown for 2013, 14.1 percent, is down from 2012, which was 14.5 percent. PCCPAP credits have averaged 12.6 percent over the period included in the study.
• In each year, claim frequency has been consistently better for participating PCCPAP
risks than for non-participating risks.
• Claim severity has been higher for participating PCCPAP risks in each year shown, with the extent of those observed differences varying significantly from year to year.
• The fact that the indicated PCCPAP credits for participating employers are smaller than
those actually granted does not mean that the employers in question should have paid higher workers’ compensation premium than they, in fact, did. The comparisons done in Exhibits I through XXI are based on PCRB loss costs only. Actual workers compensation premium paid by both participating and non-participating employers in those years were affected by many pricing parameters, programs and considerations not reflected in those loss costs. Such additional pricing factors would include, but not be limited to, individual insurers’ respective loss cost multipliers, schedule rating credits or debits, dividend plans, retrospective rating plans and sub-classifications.
3
APPENDIX Described below are the 16 statistics used in the PCCPAP analysis shown in the attached Exhibits I through XXI:
(1) Number of Policies: The number of policies issued to the groups of employers variously described in each column of Exhibits I through XXI. Note that some Pennsylvania employers may not have a workers compensation policy (i.e., self-insureds or those not subject to mandatory coverage), and some insured employers may change insurers and, thus, may have different policies in effect during a given year(s).
(2) Standard Premium: This is premium at PCRB loss cost level, absent both the
tabular PCCPAP credit and the adjustment to experience modifications made where applicable for those policies. The current PCCPAP load on manual rates is omitted from this calculation.
(3) Average Premium: Computed by dividing total standard premium by the number
of policies reported.
(4) PCCPAP Net Credits: These are the total amount of premium credits given under PCCPAP to participating employers included in each column of Exhibits I through XXI.
(5) Net Premium: The standard premium less any applicable PCCPAP credits. For
non-participating employers, net premium and standard premium are equal because no PCCPAP credits were applied.
(6) Number of Indemnity Claims: The number of indemnity claims reported on the
policies variously described in each column of Exhibits I through XXI. Indemnity claims are cases involving some wage loss or other form of benefit payable to the worker or their dependents in addition to any applicable treatment costs.
(7) Number of Total Claims: The total number of claims reported on the policies
variously described in each column of Exhibits I through XXI. These counts include indemnity claims and medical only claims, those cases involving only payment of medical treatment costs.
(8) Indemnity Claim Frequency: The number of indemnity claims reported per
$1,000 of standard premiums in each group of policies presented in Exhibits I through XXI.
(9) Total Claim Frequency: The number of total claims reported per $1,000 of
standard premium in each group of policies presented in Exhibits I through XXI. Total claim frequency is shown bold-faced and underlined, as this statistic is one of the key bases of comparison between employer groups used in the PCRB’s review of the PCCPAP.
4
(10) Incurred Losses: The reported dollar value of losses incurred on the various groups of policies presented on Exhibits I through XXI for indemnity and medical only claims.
(11) Average Claim: Total incurred losses divided by the total number of claims.
Average claim amounts are shown bold-faced and underlined, as this statistic is another of the key bases of comparison between employer groups used in the PCRB’s review of the PCCPAP.
(12) Loss Ratio: The total incurred losses divided by the net premium for each group
of policies presented on Exhibits I through XXI. Loss ratios are shown bold-faced and underlined, as this statistic is the third key basis of comparison between employer groups used in the PCRB’s review of the PCCPAP.
The last four experience statistics are computed only for Column (2) in each exhibit, which is the only column exclusively comprised of participants in the PCCPAP. These statistics are described below:
(13) Net Premium to Balance PCCPAP and Non-PCCPAP Loss Ratios: This is the amount of net premium which would produce the same loss ratio for the PCCPAP participants studied in each exhibit’s Column (2) as was reported for all non-participating employers.
(14) Indicated PCCPAP Credits to Balance: This is the difference between standard
premium for the PCCPAP participants studied in each exhibit’s Column (2) and the balancing net premium computed in Item (13).
(15) Average PCCPAP Credit Factor: This is the average ratio of PCCPAP credits
actually granted to standard premium for the PCCPAP participants studied in each exhibit’s Column (2). This average PCCPAP credit is shown bold-faced and underlined, as this statistic is a key measure of the operation of the PCCPAP.
(16) Indicated PCCPAP Credit Factor: This is the average PCCPAP credit ratio that
would have resulted in the balancing PCCPAP credits computed in Item (14). This indicated PCCPAP credit is shown bold-faced and underlined, as this statistic is a key measure of the operation of the PCCPAP, especially for purposes of comparison to the actual average PCCPAP credit shown in Item (15).

Exhibit I
PENNSYLVANIA CONSTRUCTION CLASSIFICATION PREMIUM ADJUSTMENT PROGRAM (PCCPAP) ANALYSISPCCPAP CREDIT (1/1/94 - 12/31/94)
(1) (2) (3)Total PCCPAP Non-PCCPAP
Statistic All Policies Participating Policies Policies
(1) Number of Policies 38,080 5,045 33,035
(2) Standard Premium $473,605,382 $164,473,482 $309,131,900
(3) Average Premium $12,437 $32,601 $9,358(2)/(1)
(4) PCCPAP Net Credits $19,845,867 $19,845,867 $0
(5) Net Premium $453,759,515 $144,627,615 $309,131,900(2) - (4)
(6) # of Indemnity Claims 7,517 2,286 5,231
(7) # of Total Claims 32,414 10,023 22,391
(8) Indemnity Claim Frequency 0.0159 0.0139 0.0169(6)/{(2)/1,000}
(9) Total Claim Frequency 0.0684 0.0609 0.0724(7)/{(2)/1,000}
(10) Incurred Losses $181,287,763 $66,543,934 $114,743,829
(11) Average Claim $5,593 $6,639 $5,125(10)/(7)
(12) Loss Ratio 40.0% 46.0% 37.1%(10)/(5)
(13) Net Premium to Balance PCCPAP & Non-PCCPAP LRs: $179,322,649Col(2)Line(5)*Col(2)Line(12)/Col(3)Line(12)
(14) Indicated PCCPAP Credits to Balance -$14,849,167(2)-(13)
(15) Average PCCPAP Credit Factor 0.1207(4)/(2)
(16) Indicated PCCPAP Credit Factor -0.0903(14)/(2)

Exhibit II
PENNSYLVANIA CONSTRUCTION CLASSIFICATION PREMIUM ADJUSTMENT PROGRAM (PCCPAP) ANALYSISPCCPAP CREDIT (1/1/95 - 12/31/95)
(1) (2) (3)Total PCCPAP Non-PCCPAP
Statistic All Policies Participating Policies Policies
(1) Number of Policies 38,133 5,181 32,952
(2) Standard Premium $444,657,344 $146,925,337 $297,732,007
(3) Average Premium $11,661 $28,358 $9,035(2)/(1)
(4) PCCPAP Net Credits $17,477,791 $17,477,791 $0
(5) Net Premium $427,179,553 $129,447,546 $297,732,007(2) - (4)
(6) # of Indemnity Claims 6,623 1,873 4,750
(7) # of Total Claims 28,855 8,649 20,206
(8) Indemnity Claim Frequency 0.0149 0.0127 0.0160(6)/{(2)/1,000}
(9) Total Claim Frequency 0.0649 0.0589 0.0679(7)/{(2)/1,000}
(10) Incurred Losses $172,349,854 $52,627,524 $119,722,330
(11) Average Claim $5,973 $6,085 $5,925(10)/(7)
(12) Loss Ratio 40.3% 40.7% 40.2%(10)/(5)
(13) Net Premium to Balance PCCPAP & Non-PCCPAP LRs: $131,057,590Col(2)Line(5)*Col(2)Line(12)/Col(3)Line(12)
(14) Indicated PCCPAP Credits to Balance $15,867,747(2)-(13)
(15) Average PCCPAP Credit Factor 0.1190(4)/(2)
(16) Indicated PCCPAP Credit Factor 0.1080(14)/(2)

Exhibit III
PENNSYLVANIA CONSTRUCTION CLASSIFICATION PREMIUM ADJUSTMENT PROGRAM (PCCPAP) ANALYSISPCCPAP CREDIT (1/1/96 - 12/31/96)
(1) (2) (3)Total PCCPAP Non-PCCPAP
Statistic All Policies Participating Policies Policies
(1) Number of Policies 38,936 4,714 34,222
(2) Standard Premium $442,542,189 $138,562,374 $303,979,815
(3) Average Premium $11,366 $29,394 $8,883(2)/(1)
(4) PCCPAP Net Credits $15,492,741 $15,492,741 $0
(5) Net Premium $427,049,448 $123,069,633 $303,979,815(2) - (4)
(6) # of Indemnity Claims 6,815 1,822 4,993
(7) # of Total Claims 29,843 8,299 21,544
(8) Indemnity Claim Frequency 0.0154 0.0131 0.0164(6)/{(2)/1,000}
(9) Total Claim Frequency 0.0674 0.0599 0.0709(7)/{(2)/1,000}
(10) Incurred Losses $172,485,699 $59,386,787 $113,098,912
(11) Average Claim $5,780 $7,156 $5,250(10)/(7)
(12) Loss Ratio 40.4% 48.3% 37.2%(10)/(5)
(13) Net Premium to Balance PCCPAP & Non-PCCPAP LRs: $159,792,023Col(2)Line(5)*Col(2)Line(12)/Col(3)Line(12)
(14) Indicated PCCPAP Credits to Balance -$21,229,649(2)-(13)
(15) Average PCCPAP Credit Factor 0.1118(4)/(2)
(16) Indicated PCCPAP Credit Factor -0.1532(14)/(2)
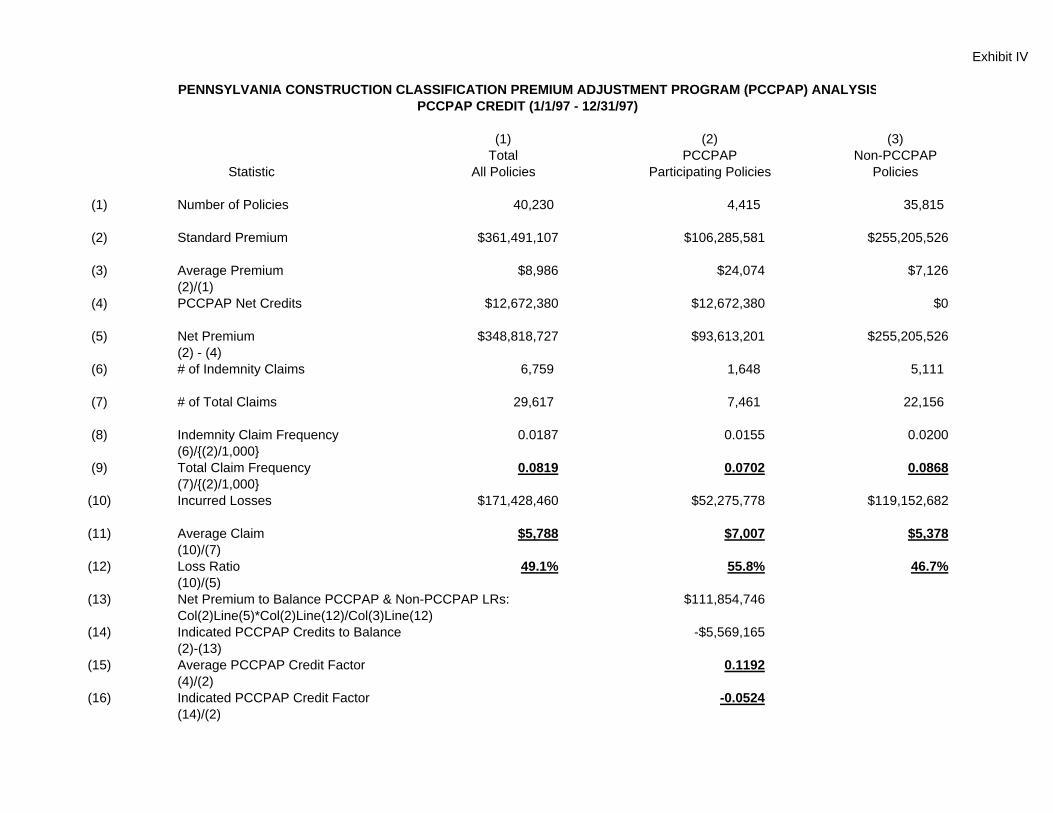
Exhibit IV
PENNSYLVANIA CONSTRUCTION CLASSIFICATION PREMIUM ADJUSTMENT PROGRAM (PCCPAP) ANALYSISPCCPAP CREDIT (1/1/97 - 12/31/97)
(1) (2) (3)Total PCCPAP Non-PCCPAP
Statistic All Policies Participating Policies Policies
(1) Number of Policies 40,230 4,415 35,815
(2) Standard Premium $361,491,107 $106,285,581 $255,205,526
(3) Average Premium $8,986 $24,074 $7,126(2)/(1)
(4) PCCPAP Net Credits $12,672,380 $12,672,380 $0
(5) Net Premium $348,818,727 $93,613,201 $255,205,526(2) - (4)
(6) # of Indemnity Claims 6,759 1,648 5,111
(7) # of Total Claims 29,617 7,461 22,156
(8) Indemnity Claim Frequency 0.0187 0.0155 0.0200(6)/{(2)/1,000}
(9) Total Claim Frequency 0.0819 0.0702 0.0868(7)/{(2)/1,000}
(10) Incurred Losses $171,428,460 $52,275,778 $119,152,682
(11) Average Claim $5,788 $7,007 $5,378(10)/(7)
(12) Loss Ratio 49.1% 55.8% 46.7%(10)/(5)
(13) Net Premium to Balance PCCPAP & Non-PCCPAP LRs: $111,854,746Col(2)Line(5)*Col(2)Line(12)/Col(3)Line(12)
(14) Indicated PCCPAP Credits to Balance -$5,569,165(2)-(13)
(15) Average PCCPAP Credit Factor 0.1192(4)/(2)
(16) Indicated PCCPAP Credit Factor -0.0524(14)/(2)
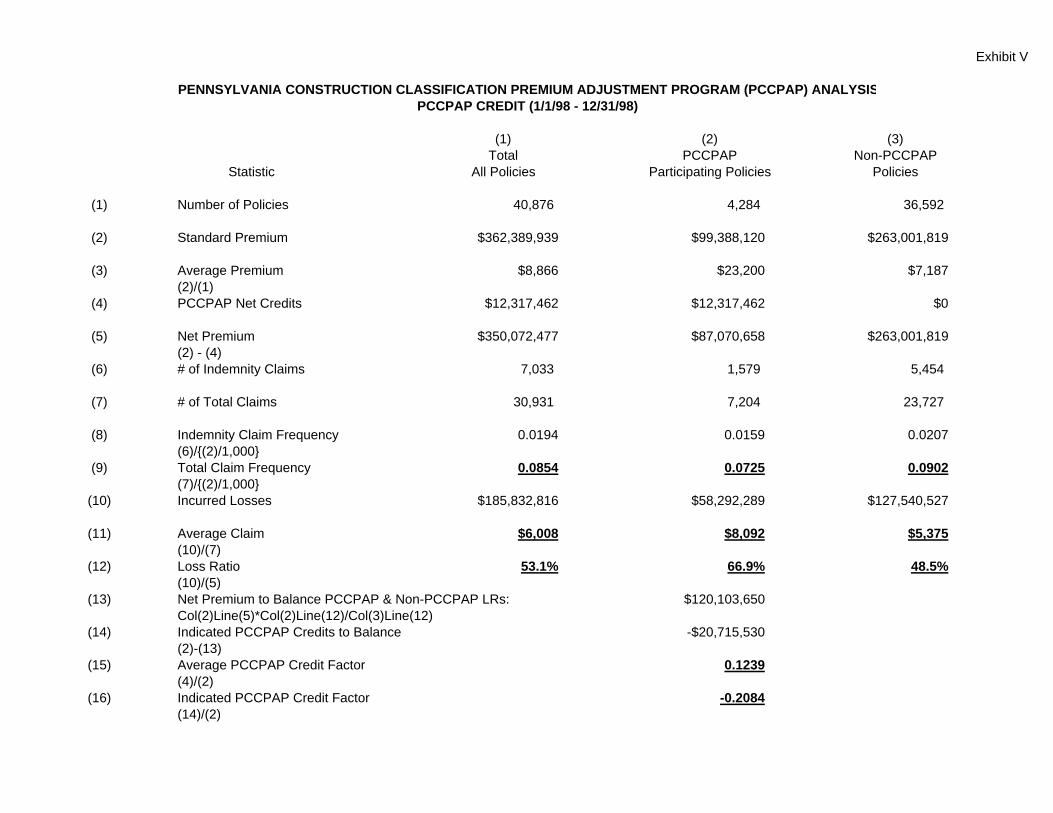
Exhibit V
PENNSYLVANIA CONSTRUCTION CLASSIFICATION PREMIUM ADJUSTMENT PROGRAM (PCCPAP) ANALYSISPCCPAP CREDIT (1/1/98 - 12/31/98)
(1) (2) (3)Total PCCPAP Non-PCCPAP
Statistic All Policies Participating Policies Policies
(1) Number of Policies 40,876 4,284 36,592
(2) Standard Premium $362,389,939 $99,388,120 $263,001,819
(3) Average Premium $8,866 $23,200 $7,187(2)/(1)
(4) PCCPAP Net Credits $12,317,462 $12,317,462 $0
(5) Net Premium $350,072,477 $87,070,658 $263,001,819(2) - (4)
(6) # of Indemnity Claims 7,033 1,579 5,454
(7) # of Total Claims 30,931 7,204 23,727
(8) Indemnity Claim Frequency 0.0194 0.0159 0.0207(6)/{(2)/1,000}
(9) Total Claim Frequency 0.0854 0.0725 0.0902(7)/{(2)/1,000}
(10) Incurred Losses $185,832,816 $58,292,289 $127,540,527
(11) Average Claim $6,008 $8,092 $5,375(10)/(7)
(12) Loss Ratio 53.1% 66.9% 48.5%(10)/(5)
(13) Net Premium to Balance PCCPAP & Non-PCCPAP LRs: $120,103,650Col(2)Line(5)*Col(2)Line(12)/Col(3)Line(12)
(14) Indicated PCCPAP Credits to Balance -$20,715,530(2)-(13)
(15) Average PCCPAP Credit Factor 0.1239(4)/(2)
(16) Indicated PCCPAP Credit Factor -0.2084(14)/(2)
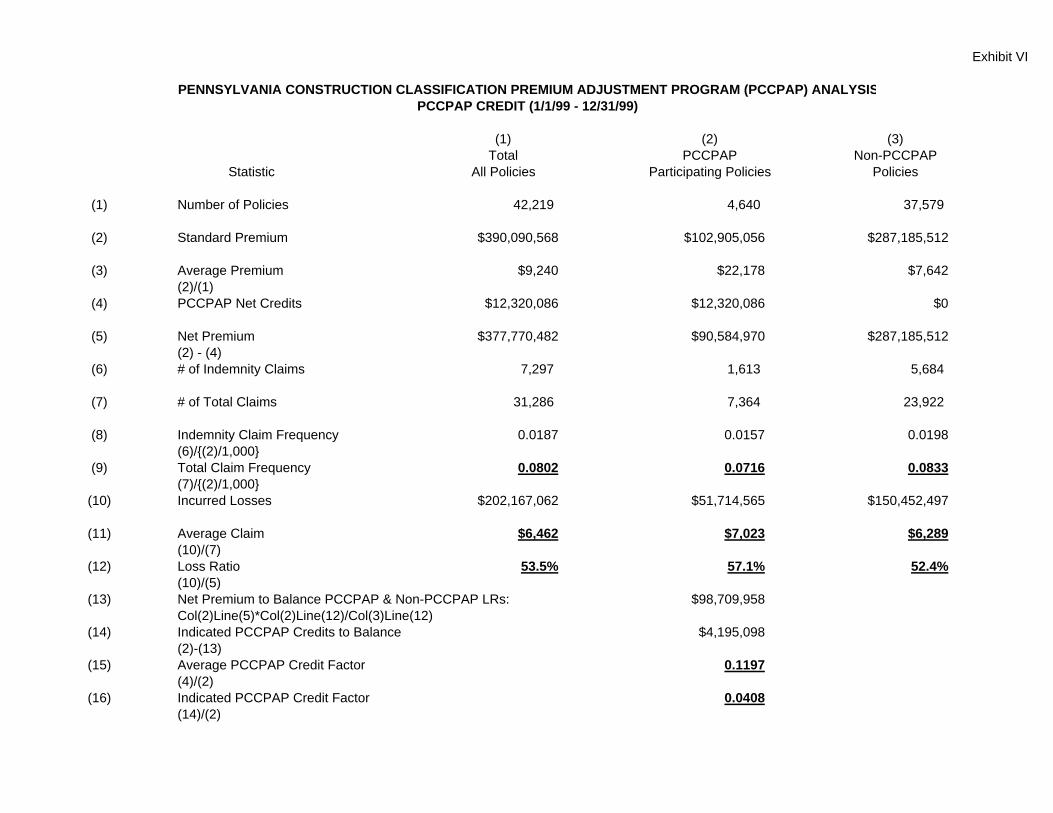
Exhibit VI
PENNSYLVANIA CONSTRUCTION CLASSIFICATION PREMIUM ADJUSTMENT PROGRAM (PCCPAP) ANALYSISPCCPAP CREDIT (1/1/99 - 12/31/99)
(1) (2) (3)Total PCCPAP Non-PCCPAP
Statistic All Policies Participating Policies Policies
(1) Number of Policies 42,219 4,640 37,579
(2) Standard Premium $390,090,568 $102,905,056 $287,185,512
(3) Average Premium $9,240 $22,178 $7,642(2)/(1)
(4) PCCPAP Net Credits $12,320,086 $12,320,086 $0
(5) Net Premium $377,770,482 $90,584,970 $287,185,512(2) - (4)
(6) # of Indemnity Claims 7,297 1,613 5,684
(7) # of Total Claims 31,286 7,364 23,922
(8) Indemnity Claim Frequency 0.0187 0.0157 0.0198(6)/{(2)/1,000}
(9) Total Claim Frequency 0.0802 0.0716 0.0833(7)/{(2)/1,000}
(10) Incurred Losses $202,167,062 $51,714,565 $150,452,497
(11) Average Claim $6,462 $7,023 $6,289(10)/(7)
(12) Loss Ratio 53.5% 57.1% 52.4%(10)/(5)
(13) Net Premium to Balance PCCPAP & Non-PCCPAP LRs: $98,709,958Col(2)Line(5)*Col(2)Line(12)/Col(3)Line(12)
(14) Indicated PCCPAP Credits to Balance $4,195,098(2)-(13)
(15) Average PCCPAP Credit Factor 0.1197(4)/(2)
(16) Indicated PCCPAP Credit Factor 0.0408(14)/(2)

Exhibit VII
PENNSYLVANIA CONSTRUCTION CLASSIFICATION PREMIUM ADJUSTMENT PROGRAM (PCCPAP) ANALYSISPCCPAP CREDIT (1/1/00 - 12/31/00)
(1) (2) (3)Total PCCPAP Non-PCCPAP
Statistic All Policies Participating Policies Policies
(1) Number of Policies 42,594 4,745 37,849
(2) Standard Premium $409,483,315 $108,720,154 $300,763,161
(3) Average Premium $9,614 $22,913 $7,946(2)/(1)
(4) PCCPAP Net Credits $12,792,240 $12,792,240 $0
(5) Net Premium $396,691,075 $95,927,914 $300,763,161(2) - (4)
(6) # of Indemnity Claims 7,320 1,626 5,694
(7) # of Total Claims 30,516 7,001 23,515
(8) Indemnity Claim Frequency 0.0179 0.0150 0.0189(6)/{(2)/1,000}
(9) Total Claim Frequency 0.0745 0.0644 0.0782(7)/{(2)/1,000}
(10) Incurred Losses $213,462,229 $58,635,076 $154,827,153
(11) Average Claim $6,995 $8,375 $6,584(10)/(7)
(12) Loss Ratio 53.8% 61.1% 51.5%(10)/(5)
(13) Net Premium to Balance PCCPAP & Non-PCCPAP LRs: $113,809,622Col(2)Line(5)*Col(2)Line(12)/Col(3)Line(12)
(14) Indicated PCCPAP Credits to Balance -$5,089,468(2)-(13)
(15) Average PCCPAP Credit Factor 0.1177(4)/(2)
(16) Indicated PCCPAP Credit Factor -0.0468(14)/(2)

Exhibit VIII
PENNSYLVANIA CONSTRUCTION CLASSIFICATION PREMIUM ADJUSTMENT PROGRAM (PCCPAP) ANALYSISPCCPAP CREDIT (1/1/01 - 12/31/01)
(1) (2) (3)Total PCCPAP Non-PCCPAP
Statistic All Policies Participating Policies Policies
(1) Number of Policies 42,125 4,683 37,442
(2) Standard Premium $426,028,522 $108,785,202 $317,243,320
(3) Average Premium $10,113 $23,230 $8,473(2)/(1)
(4) PCCPAP Net Credits $12,318,481 $12,318,481 $0
(5) Net Premium $413,710,041 $96,466,721 $317,243,320(2) - (4)
(6) # of Indemnity Claims 7,083 1,523 5,560
(7) # of Total Claims 29,019 6,366 22,653
(8) Indemnity Claim Frequency 0.0166 0.0140 0.0175(6)/{(2)/1,000}
(9) Total Claim Frequency 0.0681 0.0585 0.0714(7)/{(2)/1,000}
(10) Incurred Losses $221,403,375 $50,766,944 $170,636,431
(11) Average Claim $7,630 $7,975 $7,533(10)/(7)
(12) Loss Ratio 53.5% 52.6% 53.8%(10)/(5)
(13) Net Premium to Balance PCCPAP & Non-PCCPAP LRs: $94,315,047Col(2)Line(5)*Col(2)Line(12)/Col(3)Line(12)
(14) Indicated PCCPAP Credits to Balance $14,470,155(2)-(13)
(15) Average PCCPAP Credit Factor 0.1132(4)/(2)
(16) Indicated PCCPAP Credit Factor 0.1330(14)/(2)

Exhibit IX
PENNSYLVANIA CONSTRUCTION CLASSIFICATION PREMIUM ADJUSTMENT PROGRAM (PCCPAP) ANALYSISPCCPAP CREDIT (1/1/02 - 12/31/02)
(1) (2) (3)Total PCCPAP Non-PCCPAP
Statistic All Policies Participating Policies Policies
(1) Number of Policies 42,369 4,970 37,399
(2) Standard Premium $445,253,179 $107,021,932 $338,231,247
(3) Average Premium $10,509 $21,534 $9,044(2)/(1)
(4) PCCPAP Net Credits $11,809,171 $11,809,171 $0
(5) Net Premium $433,444,008 $95,212,761 $338,231,247(2) - (4)
(6) # of Indemnity Claims 6,507 1,415 5,092
(7) # of Total Claims 26,769 5,740 21,029
(8) Indemnity Claim Frequency 0.0146 0.0132 0.0151(6)/{(2)/1,000}
(9) Total Claim Frequency 0.0601 0.0536 0.0622(7)/{(2)/1,000}
(10) Incurred Losses $221,964,801 $54,605,351 $167,359,450
(11) Average Claim $8,292 $9,513 $7,959(10)/(7)
(12) Loss Ratio 51.2% 57.4% 49.5%(10)/(5)
(13) Net Premium to Balance PCCPAP & Non-PCCPAP LRs: $110,408,333Col(2)Line(5)*Col(2)Line(12)/Col(3)Line(12)
(14) Indicated PCCPAP Credits to Balance -$3,386,401(2)-(13)
(15) Average PCCPAP Credit Factor 0.1103(4)/(2)
(16) Indicated PCCPAP Credit Factor -0.0316(14)/(2)

Exhibit X
PENNSYLVANIA CONSTRUCTION CLASSIFICATION PREMIUM ADJUSTMENT PROGRAM (PCCPAP) ANALYSISPCCPAP CREDIT (1/1/03 - 12/31/03)
(1) (2) (3)Total PCCPAP Non-PCCPAP
Statistic All Policies Participating Policies Policies
(1) Number of Policies 42,331 4,831 37,500
(2) Standard Premium $434,246,324 $101,257,999 $332,988,325
(3) Average Premium $10,258 $20,960 $8,880(2)/(1)
(4) PCCPAP Net Credits $10,635,701 $10,635,701 $0
(5) Net Premium $423,610,623 $90,622,298 $332,988,325(2) - (4)
(6) # of Indemnity Claims 6,265 1,164 5,101
(7) # of Total Claims 25,597 4,966 20,631
(8) Indemnity Claim Frequency 0.0144 0.0115 0.0153(6)/{(2)/1,000}
(9) Total Claim Frequency 0.0589 0.0490 0.0620(7)/{(2)/1,000}
(10) Incurred Losses $223,903,813 $48,613,252 $175,290,561
(11) Average Claim $8,747 $9,789 $8,496(10)/(7)
(12) Loss Ratio 52.9% 53.6% 52.6%(10)/(5)
(13) Net Premium to Balance PCCPAP & Non-PCCPAP LRs: $92,345,155Col(2)Line(5)*Col(2)Line(12)/Col(3)Line(12)
(14) Indicated PCCPAP Credits to Balance $8,912,844(2)-(13)
(15) Average PCCPAP Credit Factor 0.1050(4)/(2)
(16) Indicated PCCPAP Credit Factor 0.0880(14)/(2)
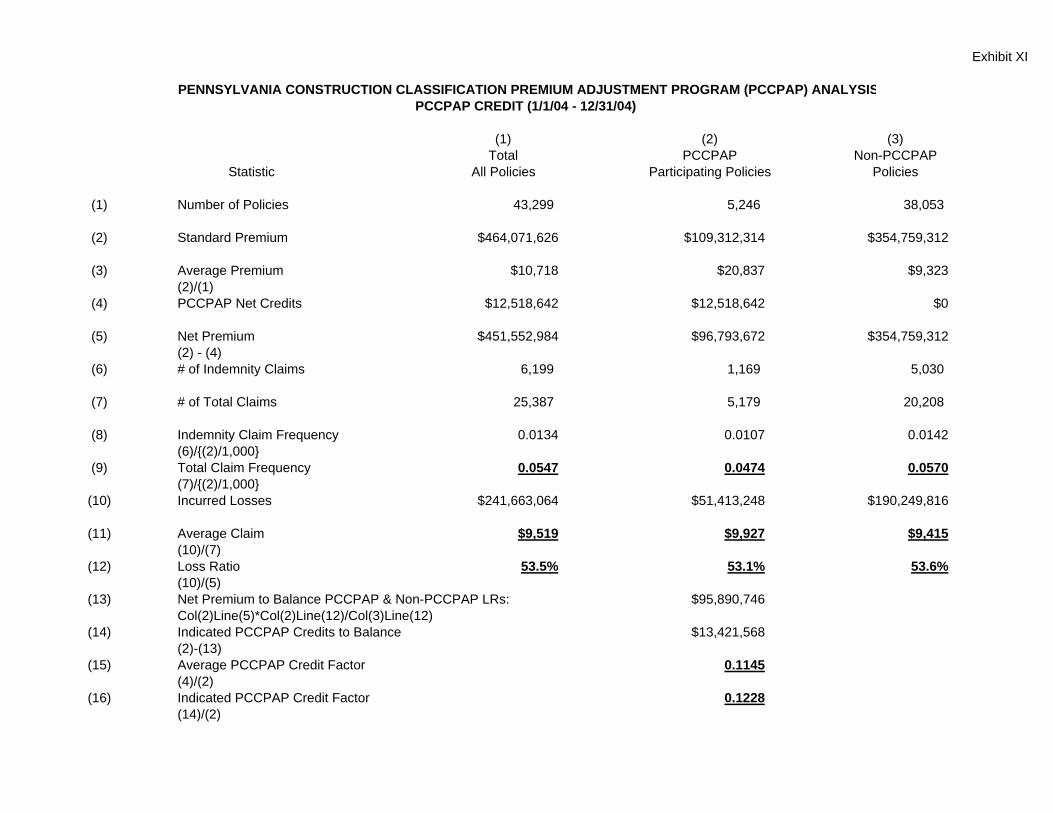
Exhibit XI
PENNSYLVANIA CONSTRUCTION CLASSIFICATION PREMIUM ADJUSTMENT PROGRAM (PCCPAP) ANALYSISPCCPAP CREDIT (1/1/04 - 12/31/04)
(1) (2) (3)Total PCCPAP Non-PCCPAP
Statistic All Policies Participating Policies Policies
(1) Number of Policies 43,299 5,246 38,053
(2) Standard Premium $464,071,626 $109,312,314 $354,759,312
(3) Average Premium $10,718 $20,837 $9,323(2)/(1)
(4) PCCPAP Net Credits $12,518,642 $12,518,642 $0
(5) Net Premium $451,552,984 $96,793,672 $354,759,312(2) - (4)
(6) # of Indemnity Claims 6,199 1,169 5,030
(7) # of Total Claims 25,387 5,179 20,208
(8) Indemnity Claim Frequency 0.0134 0.0107 0.0142(6)/{(2)/1,000}
(9) Total Claim Frequency 0.0547 0.0474 0.0570(7)/{(2)/1,000}
(10) Incurred Losses $241,663,064 $51,413,248 $190,249,816
(11) Average Claim $9,519 $9,927 $9,415(10)/(7)
(12) Loss Ratio 53.5% 53.1% 53.6%(10)/(5)
(13) Net Premium to Balance PCCPAP & Non-PCCPAP LRs: $95,890,746Col(2)Line(5)*Col(2)Line(12)/Col(3)Line(12)
(14) Indicated PCCPAP Credits to Balance $13,421,568(2)-(13)
(15) Average PCCPAP Credit Factor 0.1145(4)/(2)
(16) Indicated PCCPAP Credit Factor 0.1228(14)/(2)

Exhibit XII
PENNSYLVANIA CONSTRUCTION CLASSIFICATION PREMIUM ADJUSTMENT PROGRAM (PCCPAP) ANALYSISPCCPAP CREDIT (1/1/05 - 12/31/05)
(1) (2) (3)Total PCCPAP Non-PCCPAP
Statistic All Policies Participating Policies Policies
(1) Number of Policies 42,891 5,155 37,736
(2) Standard Premium $502,647,888 $120,578,769 $382,069,119
(3) Average Premium $11,719 $23,391 $10,125(2)/(1)
(4) PCCPAP Net Credits $16,203,266 $16,203,266 $0
(5) Net Premium $486,444,622 $104,375,503 $382,069,119(2) - (4)
(6) # of Indemnity Claims 6,241 1,299 4,942
(7) # of Total Claims 26,084 5,496 20,588
(8) Indemnity Claim Frequency 0.0124 0.0108 0.0129(6)/{(2)/1,000}
(9) Total Claim Frequency 0.0519 0.0456 0.0539(7)/{(2)/1,000}
(10) Incurred Losses $251,965,352 $62,088,397 $189,876,955
(11) Average Claim $9,660 $11,297 $9,223(10)/(7)
(12) Loss Ratio 51.8% 59.5% 49.7%(10)/(5)
(13) Net Premium to Balance PCCPAP & Non-PCCPAP LRs: $124,956,588Col(2)Line(5)*Col(2)Line(12)/Col(3)Line(12)
(14) Indicated PCCPAP Credits to Balance -$4,377,819(2)-(13)
(15) Average PCCPAP Credit Factor 0.1344(4)/(2)
(16) Indicated PCCPAP Credit Factor -0.0363(14)/(2)

Exhibit XIII
PENNSYLVANIA CONSTRUCTION CLASSIFICATION PREMIUM ADJUSTMENT PROGRAM (PCCPAP) ANALYSISPCCPAP CREDIT (1/1/06 - 12/31/06)
(1) (2) (3)Total PCCPAP Non-PCCPAP
Statistic All Policies Participating Policies Policies
(1) Number of Policies 42,758 4,645 38,113
(2) Standard Premium $509,922,625 $116,682,747 $393,239,878
(3) Average Premium $11,926 $25,120 $10,318(2)/(1)
(4) PCCPAP Net Credits $16,687,358 $16,687,358 $0
(5) Net Premium $493,235,267 $99,995,389 $393,239,878(2) - (4)
(6) # of Indemnity Claims 5,969 1,228 4,741
(7) # of Total Claims 24,677 5,095 19,582
(8) Indemnity Claim Frequency 0.0117 0.0105 0.0121(6)/{(2)/1,000}
(9) Total Claim Frequency 0.0484 0.0437 0.0498(7)/{(2)/1,000}
(10) Incurred Losses $256,536,447 $58,829,457 $197,706,990
(11) Average Claim $10,396 $11,547 $10,096(10)/(7)
(12) Loss Ratio 52.0% 58.8% 50.3%(10)/(5)
(13) Net Premium to Balance PCCPAP & Non-PCCPAP LRs: $116,893,218Col(2)Line(5)*Col(2)Line(12)/Col(3)Line(12)
(14) Indicated PCCPAP Credits to Balance -$210,471(2)-(13)
(15) Average PCCPAP Credit Factor 0.1430(4)/(2)
(16) Indicated PCCPAP Credit Factor -0.0018(14)/(2)

Exhibit XIV
PENNSYLVANIA CONSTRUCTION CLASSIFICATION PREMIUM ADJUSTMENT PROGRAM (PCCPAP) ANALYSISPCCPAP CREDIT (1/1/07 - 12/31/07)
(1) (2) (3)Total PCCPAP Non-PCCPAP
Statistic All Policies Participating Policies Policies
(1) Number of Policies 43,366 4,755 38,611
(2) Standard Premium $522,636,205 $122,348,265 $400,287,940
(3) Average Premium $12,052 $25,730 $10,367(2)/(1)
(4) PCCPAP Net Credits $18,107,601 $18,107,601 $0
(5) Net Premium $504,528,604 $104,240,664 $400,287,940(2) - (4)
(6) # of Indemnity Claims 5,847 1,222 4,625
(7) # of Total Claims 23,790 4,997 18,793
(8) Indemnity Claim Frequency 0.0112 0.0100 0.0116(6)/{(2)/1,000}
(9) Total Claim Frequency 0.0455 0.0408 0.0469(7)/{(2)/1,000}
(10) Incurred Losses $289,784,423 $70,113,399 $219,671,024
(11) Average Claim $12,181 $14,031 $11,689(10)/(7)
(12) Loss Ratio 57.4% 67.3% 54.9%(10)/(5)
(13) Net Premium to Balance PCCPAP & Non-PCCPAP LRs: $127,785,003Col(2)Line(5)*Col(2)Line(12)/Col(3)Line(12)
(14) Indicated PCCPAP Credits to Balance -$5,436,738(2)-(13)
(15) Average PCCPAP Credit Factor 0.1480(4)/(2)
(16) Indicated PCCPAP Credit Factor -0.0444(14)/(2)

Exhibit XV
PENNSYLVANIA CONSTRUCTION CLASSIFICATION PREMIUM ADJUSTMENT PROGRAM (PCCPAP) ANALYSISPCCPAP CREDIT (1/1/08 - 12/31/08)
(1) (2) (3)Total PCCPAP Non-PCCPAP
Statistic All Policies Participating Policies Policies
(1) Number of Policies 43,148 4,502 38,646
(2) Standard Premium $466,095,275 $100,719,586 $365,375,689
(3) Average Premium $10,802 $22,372 $9,454(2)/(1)
(4) PCCPAP Net Credits $13,559,371 $13,559,371 $0
(5) Net Premium $452,535,904 $87,160,215 $365,375,689(2) - (4)
(6) # of Indemnity Claims 4,808 923 3,885
(7) # of Total Claims 19,586 3,894 15,692
(8) Indemnity Claim Frequency 0.0103 0.0092 0.0106(6)/{(2)/1,000}
(9) Total Claim Frequency 0.0420 0.0387 0.0429(7)/{(2)/1,000}
(10) Incurred Losses $239,720,646 $55,144,317 $184,576,329
(11) Average Claim $12,239 $14,161 $11,762(10)/(7)
(12) Loss Ratio 53.0% 63.3% 50.5%(10)/(5)
(13) Net Premium to Balance PCCPAP & Non-PCCPAP LRs: $109,252,309Col(2)Line(5)*Col(2)Line(12)/Col(3)Line(12)
(14) Indicated PCCPAP Credits to Balance -$8,532,723(2)-(13)
(15) Average PCCPAP Credit Factor 0.1346(4)/(2)
(16) Indicated PCCPAP Credit Factor -0.0847(14)/(2)

Exhibit XVI
PENNSYLVANIA CONSTRUCTION CLASSIFICATION PREMIUM ADJUSTMENT PROGRAM (PCCPAP) ANALYSISPCCPAP CREDIT (1/1/09 - 12/31/09)
(1) (2) (3)Total PCCPAP Non-PCCPAP
Statistic All Policies Participating Policies Policies
(1) Number of Policies 41,099 4,000 37,099
(2) Standard Premium $401,626,564 $78,317,642 $323,308,922
(3) Average Premium $9,772 $19,579 $8,715(2)/(1)
(4) PCCPAP Net Credits $10,843,150 $10,843,150 $0
(5) Net Premium $390,783,414 $67,474,492 $323,308,922(2) - (4)
(6) # of Indemnity Claims 4,173 742 3,431
(7) # of Total Claims 16,322 2,899 13,423
(8) Indemnity Claim Frequency 0.0104 0.0095 0.0106(6)/{(2)/1,000}
(9) Total Claim Frequency 0.0406 0.0370 0.0415(7)/{(2)/1,000}
(10) Incurred Losses $229,024,473 $53,059,966 $175,964,507
(11) Average Claim $14,032 $18,303 $13,109(10)/(7)
(12) Loss Ratio 58.6% 78.6% 54.4%(10)/(5)
(13) Net Premium to Balance PCCPAP & Non-PCCPAP LRs: $97,490,718Col(2)Line(5)*Col(2)Line(12)/Col(3)Line(12)
(14) Indicated PCCPAP Credits to Balance -$19,173,076(2)-(13)
(15) Average PCCPAP Credit Factor 0.1385(4)/(2)
(16) Indicated PCCPAP Credit Factor -0.2448(14)/(2)

Exhibit XVII
PENNSYLVANIA CONSTRUCTION CLASSIFICATION PREMIUM ADJUSTMENT PROGRAM (PCCPAP) ANALYSISPCCPAP CREDIT (1/1/10 - 12/31/10)
(1) (2) (3)Total PCCPAP Non-PCCPAP
Statistic All Policies Participating Policies Policies
(1) Number of Policies 37,725 3,419 34,306
(2) Standard Premium $458,410,868 $83,362,092 $375,048,776
(3) Average Premium $12,151 $24,382 $10,932(2)/(1)
(4) PCCPAP Net Credits $11,467,911 $11,467,911 $0
(5) Net Premium $446,942,957 $71,894,181 $375,048,776(2) - (4)
(6) # of Indemnity Claims 4,292 714 3,578
(7) # of Total Claims 17,005 2,785 14,220
(8) Indemnity Claim Frequency 0.0094 0.0086 0.0095(6)/{(2)/1,000}
(9) Total Claim Frequency 0.0371 0.0334 0.0379(7)/{(2)/1,000}
(10) Incurred Losses $239,855,403 $55,608,590 $184,246,813
(11) Average Claim $14,105 $19,967 $12,957(10)/(7)
(12) Loss Ratio 53.7% 77.3% 49.1%(10)/(5)
(13) Net Premium to Balance PCCPAP & Non-PCCPAP LRs: $113,185,747Col(2)Line(5)*Col(2)Line(12)/Col(3)Line(12)
(14) Indicated PCCPAP Credits to Balance -$29,823,655(2)-(13)
(15) Average PCCPAP Credit Factor 0.1376(4)/(2)
(16) Indicated PCCPAP Credit Factor -0.3578(14)/(2)

Exhibit XVIII
PENNSYLVANIA CONSTRUCTION CLASSIFICATION PREMIUM ADJUSTMENT PROGRAM (PCCPAP) ANALYSISPCCPAP CREDIT (1/1/11 - 12/31/11)
(1) (2) (3)Total PCCPAP Non-PCCPAP
Statistic All Policies Participating Policies Policies
(1) Number of Policies 37,502 3,382 34,120
(2) Standard Premium $511,391,578 $87,210,104 $424,181,474
(3) Average Premium $13,636 $25,787 $12,432(2)/(1)
(4) PCCPAP Net Credits $12,104,321 $12,104,321 $0
(5) Net Premium $499,287,257 $75,105,783 $424,181,474(2) - (4)
(6) # of Indemnity Claims 4,389 742 3,647
(7) # of Total Claims 16,906 2,805 14,101
(8) Indemnity Claim Frequency 0.0086 0.0085 0.0086(6)/{(2)/1,000}
(9) Total Claim Frequency 0.0331 0.0322 0.0332(7)/{(2)/1,000}
(10) Incurred Losses $260,078,716 $48,793,732 $211,284,984
(11) Average Claim $15,384 $17,395 $14,984(10)/(7)
(12) Loss Ratio 52.1% 65.0% 49.8%(10)/(5)
(13) Net Premium to Balance PCCPAP & Non-PCCPAP LRs: $98,029,636Col(2)Line(5)*Col(2)Line(12)/Col(3)Line(12)
(14) Indicated PCCPAP Credits to Balance -$10,819,532(2)-(13)
(15) Average PCCPAP Credit Factor 0.1388(4)/(2)
(16) Indicated PCCPAP Credit Factor -0.1241(14)/(2)

Exhibit XIX
PENNSYLVANIA CONSTRUCTION CLASSIFICATION PREMIUM ADJUSTMENT PROGRAM (PCCPAP) ANALYSISPCCPAP CREDIT (1/1/12 - 12/31/12)
(1) (2) (3)Total PCCPAP Non-PCCPAP
Statistic All Policies Participating Policies Policies
(1) Number of Policies 37,154 3,249 33,905
(2) Standard Premium $460,191,311 $80,320,596 $379,870,715
(3) Average Premium $12,386 $24,722 $11,204(2)/(1)
(4) PCCPAP Net Credits $11,641,713 $11,641,713 $0
(5) Net Premium $448,549,598 $68,678,883 $379,870,715(2) - (4)
(6) # of Indemnity Claims 3,896 650 3,246
(7) # of Total Claims 14,793 2,576 12,217
(8) Indemnity Claim Frequency 0.0085 0.0081 0.0085(6)/{(2)/1,000}
(9) Total Claim Frequency 0.0321 0.0321 0.0322(7)/{(2)/1,000}
(10) Incurred Losses $253,739,589 $50,438,155 $203,301,434
(11) Average Claim $17,153 $19,580 $16,641(10)/(7)
(12) Loss Ratio 56.6% 73.4% 53.5%(10)/(5)
(13) Net Premium to Balance PCCPAP & Non-PCCPAP LRs: $94,224,860Col(2)Line(5)*Col(2)Line(12)/Col(3)Line(12)
(14) Indicated PCCPAP Credits to Balance -$13,904,264(2)-(13)
(15) Average PCCPAP Credit Factor 0.1449(4)/(2)
(16) Indicated PCCPAP Credit Factor -0.1731(14)/(2)

Exhibit XX
PENNSYLVANIA CONSTRUCTION CLASSIFICATION PREMIUM ADJUSTMENT PROGRAM (PCCPAP) ANALYSISPCCPAP CREDIT (1/1/13 - 12/31/13)
(1) (2) (3)Total PCCPAP Non-PCCPAP
Statistic All Policies Participating Policies Policies
(1) Number of Policies 37,061 3,135 33,926
(2) Standard Premium $452,456,856 $77,277,472 $375,179,384
(3) Average Premium $12,208 $24,650 $11,059(2)/(1)
(4) PCCPAP Net Credits $10,930,686 $10,930,686 $0
(5) Net Premium $441,526,170 $66,346,786 $375,179,384(2) - (4)
(6) # of Indemnity Claims 3,856 572 3,284
(7) # of Total Claims 14,536 2,259 12,277
(8) Indemnity Claim Frequency 0.0085 0.0074 0.0088(6)/{(2)/1,000}
(9) Total Claim Frequency 0.0321 0.0292 0.0327(7)/{(2)/1,000}
(10) Incurred Losses $242,930,213 $51,582,832 $191,347,381
(11) Average Claim $16,712 $22,834 $15,586(10)/(7)
(12) Loss Ratio 55.0% 77.7% 51.0%(10)/(5)
(13) Net Premium to Balance PCCPAP & Non-PCCPAP LRs: $101,081,280Col(2)Line(5)*Col(2)Line(12)/Col(3)Line(12)
(14) Indicated PCCPAP Credits to Balance -$23,803,808(2)-(13)
(15) Average PCCPAP Credit Factor 0.1414(4)/(2)
(16) Indicated PCCPAP Credit Factor -0.3080(14)/(2)
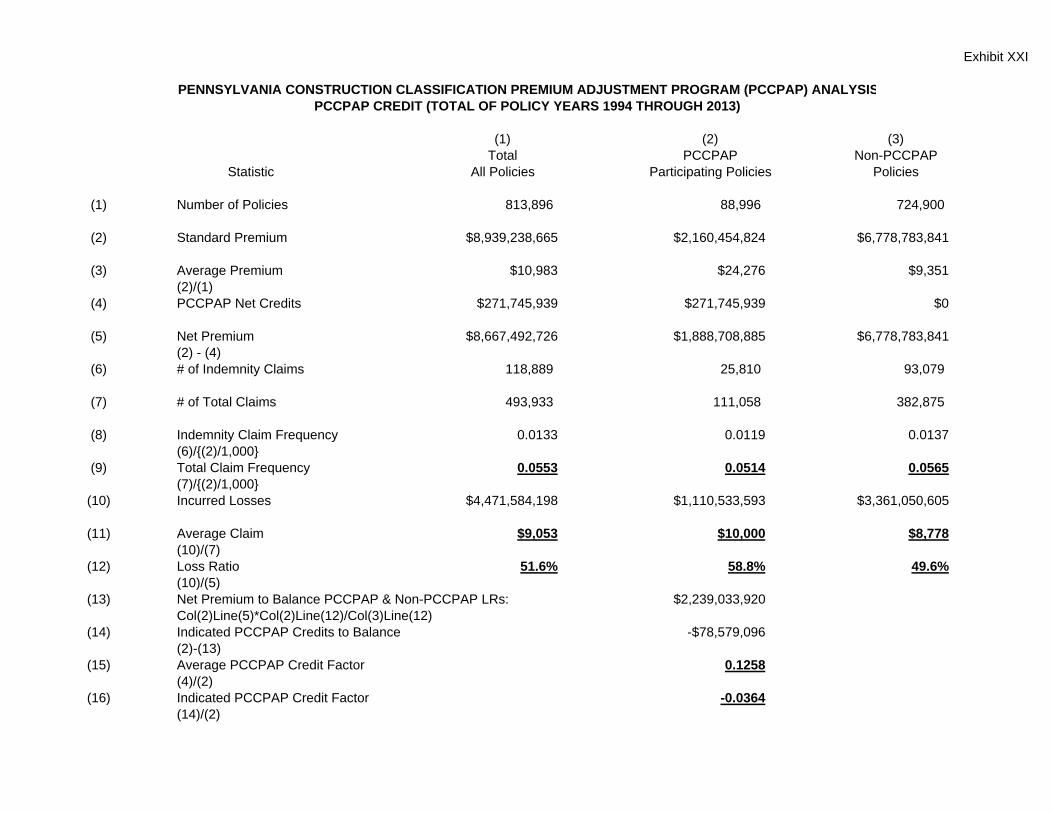
Exhibit XXI
PENNSYLVANIA CONSTRUCTION CLASSIFICATION PREMIUM ADJUSTMENT PROGRAM (PCCPAP) ANALYSISPCCPAP CREDIT (TOTAL OF POLICY YEARS 1994 THROUGH 2013)
(1) (2) (3)Total PCCPAP Non-PCCPAP
Statistic All Policies Participating Policies Policies
(1) Number of Policies 813,896 88,996 724,900
(2) Standard Premium $8,939,238,665 $2,160,454,824 $6,778,783,841
(3) Average Premium $10,983 $24,276 $9,351(2)/(1)
(4) PCCPAP Net Credits $271,745,939 $271,745,939 $0
(5) Net Premium $8,667,492,726 $1,888,708,885 $6,778,783,841(2) - (4)
(6) # of Indemnity Claims 118,889 25,810 93,079
(7) # of Total Claims 493,933 111,058 382,875
(8) Indemnity Claim Frequency 0.0133 0.0119 0.0137(6)/{(2)/1,000}
(9) Total Claim Frequency 0.0553 0.0514 0.0565(7)/{(2)/1,000}
(10) Incurred Losses $4,471,584,198 $1,110,533,593 $3,361,050,605
(11) Average Claim $9,053 $10,000 $8,778(10)/(7)
(12) Loss Ratio 51.6% 58.8% 49.6%(10)/(5)
(13) Net Premium to Balance PCCPAP & Non-PCCPAP LRs: $2,239,033,920Col(2)Line(5)*Col(2)Line(12)/Col(3)Line(12)
(14) Indicated PCCPAP Credits to Balance -$78,579,096(2)-(13)
(15) Average PCCPAP Credit Factor 0.1258(4)/(2)
(16) Indicated PCCPAP Credit Factor -0.0364(14)/(2)