PENGARUH METODE PEMBELAJARAN FULLDAYSCHOOL …
20
98 PENGARUH METODE PEMBELAJARAN FULLDAYSCHOOL TERHADAP MOTIVASI BELAJAR KELAS XI DENGAN EMOTIONAL INTELLIGENCE SEBAGAI VARIABEL MODERATOR The Influence of Full Day School Learning Methods on Student Motivation in Grade XI of SMA Negeri 1 Plemahan, Kediri with Emotional Intelligence as a Moderator Variable Oky Urtya Dani 1 1 Master Study Program of Human Resource Development, Postgraduate School of Universitas Airlangga, e-mail: [email protected] Windijarto 2 2 Faculty of Economy and Business Universitas Airlangga *e-mail: [email protected] Pinky Saptandari 3 3 Faculty of Social Sciences and Political Sciences, Universitas Airlangga *e-mail: [email protected] Abstract In the teaching and learning process, motivation plays a huge role in learning achievement. Emotional Intelligence can also influence the learning achievement. The purpose of this research is to test and analyze the effect of full-day school learning methods on the learning motivation of class XI students of SMA Negeri 1 Plemahan, Kediri with emotional intelligence as a moderator variable. This research involved 160 respondents with quantitative approach methods. The data obtained will be analyzed using multiple linear analysis techniques. The result of this study indicates that there is an effect of full-day school learning methods on student motivation with a significance value of 0,000 <0.10. Furthermore, the multiple linear regression analysis with emotional intelligence as a moderator variable showed that the emotional intelligence variable succeeded in moderating the effect of full-day school learning methods on student motivation with a significance value of 0.005 <0.05. Keywords: Emotional Intelligence, Full Day School, Learning Motivation Abstrak Dalam proses belajar mengajar, motivasi memainkan peran besar dalam prestasi belajar. Siswa yang memiliki motivasi tinggi akan memiliki banyak energi untuk belajar. Siswa yang tidak memiliki motivasi belajar dalam diri mereka sendiri cenderung malas dan tidak memiliki semangat belajar sehingga dapat mempengaruhi prestasi belajar mereka. Tujuan dari penelitian ini adalah untuk menguji dan menganalisis pengaruh metode pembelajaran sekolah sehari penuh p ada motivasi belajar siswa kelas XI SMA Negeri 1 Plemahan, Kediri dengan kecerdasan emosi sebagai variabel moderator. Penelitian ini melibatkan 160 responden dengan metode pendekatan kuantitatif. Data yang diperoleh akan dianalisis menggunakan teknik analisis linier berganda. Hasil penelitian ini menunjukkan bahwa ada pengaruh metode pembelajaran sekolah sehari penuh pada motivasi siswa dengan nilai signifikansi 0,000 <0,10. Selanjutnya, analisis regresi linier berganda dengan kecerdasan emosi sebagai variabel moderator menunjukkan bahwa variabel Sekolah Pascasarjana Universitas Airlangga Jalan Airlangga No. 4-6, Surabaya - 60286 Telp. : (031) 5041566, 5041536 Email : [email protected] Website : https://e-journal.unair.ac.id/ADJ
Transcript of PENGARUH METODE PEMBELAJARAN FULLDAYSCHOOL …

98
PENGARUH METODE PEMBELAJARAN FULLDAYSCHOOL
TERHADAP MOTIVASI BELAJAR KELAS XI DENGAN
EMOTIONAL INTELLIGENCE SEBAGAI VARIABEL
MODERATOR
The Influence of Full Day School Learning Methods on Student
Motivation in Grade XI of SMA Negeri 1 Plemahan, Kediri with
Emotional Intelligence as a Moderator Variable
Oky Urtya Dani1
1Master Study Program of Human Resource Development, Postgraduate School of Universitas
Airlangga, e-mail: [email protected]
Windijarto2
2Faculty of Economy and Business Universitas
Airlangga
*e-mail:
Pinky Saptandari3
3Faculty of Social Sciences and Political Sciences, Universitas
Airlangga *e-mail:
Abstract In the teaching and learning process, motivation plays a huge role in learning achievement. Emotional
Intelligence can also influence the learning achievement. The purpose of this research is to test and analyze
the effect of full-day school learning methods on the learning motivation of class XI students of SMA
Negeri 1 Plemahan, Kediri with emotional intelligence as a moderator variable. This research involved 160
respondents with quantitative approach methods. The data obtained will be analyzed using multiple linear
analysis techniques. The result of this study indicates that there is an effect of full-day school learning
methods on student motivation with a significance value of 0,000 <0.10. Furthermore, the multiple linear
regression analysis with emotional intelligence as a moderator variable showed that the emotional
intelligence variable succeeded in moderating the effect of full-day school learning methods on student motivation with a significance value of 0.005 <0.05.
Keywords: Emotional Intelligence, Full Day School, Learning Motivation
Abstrak Dalam proses belajar mengajar, motivasi memainkan peran besar dalam prestasi belajar. Siswa yang
memiliki motivasi tinggi akan memiliki banyak energi untuk belajar. Siswa yang tidak memiliki motivasi
belajar dalam diri mereka sendiri cenderung malas dan tidak memiliki semangat belajar sehingga dapat
mempengaruhi prestasi belajar mereka. Tujuan dari penelitian ini adalah untuk menguji dan menganalisis
pengaruh metode pembelajaran sekolah sehari penuh p ada motivasi belajar siswa kelas XI SMA Negeri 1
Plemahan, Kediri dengan kecerdasan emosi sebagai variabel moderator. Penelitian ini melibatkan 160 responden dengan metode pendekatan kuantitatif. Data yang diperoleh akan dianalisis menggunakan teknik
analisis linier berganda. Hasil penelitian ini menunjukkan bahwa ada pengaruh metode pembelajaran
sekolah sehari penuh pada motivasi siswa dengan nilai signifikansi 0,000 <0,10. Selanjutnya, analisis regresi
linier berganda dengan kecerdasan emosi sebagai variabel moderator menunjukkan bahwa variabel
Sekolah Pascasarjana Universitas Airlangga
Jalan Airlangga No. 4-6, Surabaya - 60286 Telp. : (031) 5041566, 5041536
Email : [email protected]
Website : https://e-journal.unair.ac.id/ADJ
99
kecerdasan emosional berhasil memoderasi pengaruh metode pembelajaran sekolah sehari penuh pada
motivasi siswa dengan nilai signifikansi 0,005 <0,05.
Kata kunci: Emotional Intelligence, Full Day School, Motivasi Belajar
INTRODUCTION
Learning methods in Indonesia have undergone several developments, the latest one which is full-day
school. Full-day school is a learning system where students come to school from morning to evening to study
and socialize (Miller, 2005:1). Learning motivation can arise due to intrinsic and extrinsic factors (Mubeen &
Reid, 2006). The intrinsic factor comes from within oneself, while the extrinsic factor comes from outside
the student. Extrinsic factors include factors related to the school environment and social factors, for example
are community and family environment.
Education can be defined as activities undertaken to obtain changes in knowledge, abilities, and attitudes
from individuals, groups or communities (Kevin Carmody & Zane Berge, 2005: 3). SMA Negeri 1 Plemahan is
one of the schools that has implemented a full-day school policy since the Minister of Education and Culture,
Muhadjir Effendi issued a decision on full-day school policy in
2017. The implementation of the policy aims to improve indicators of good quality education, include
student’s learning motivation.
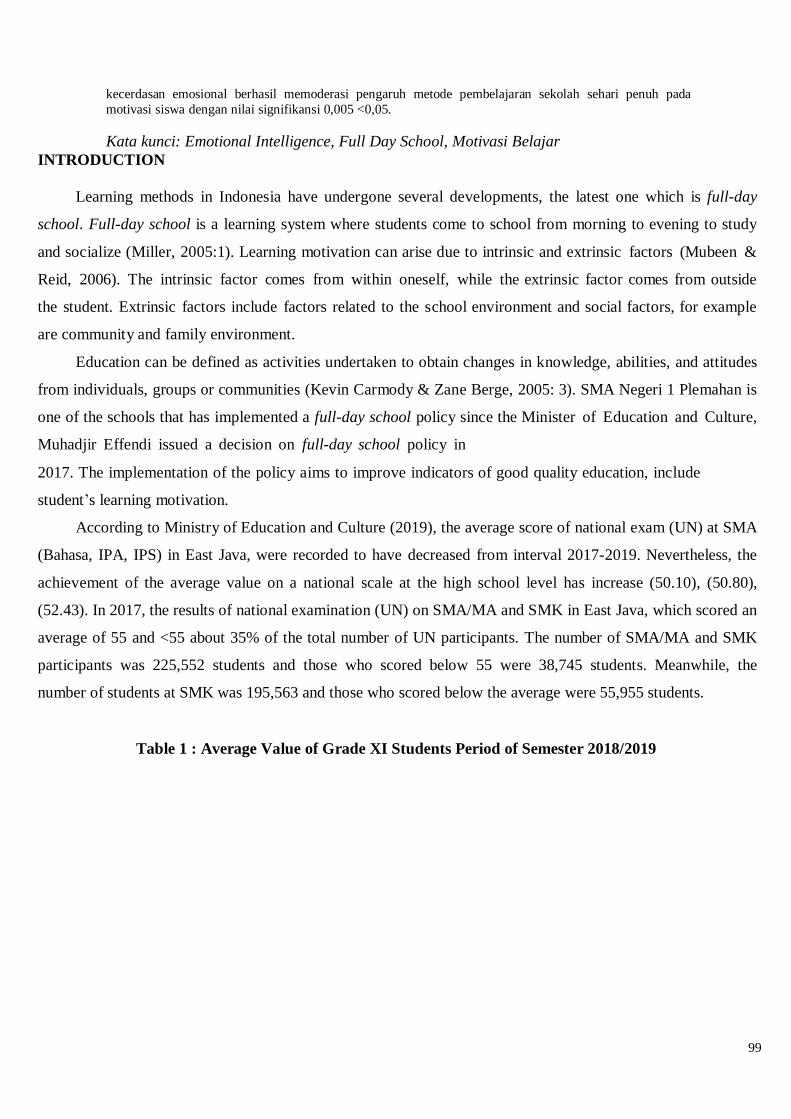
According to Ministry of Education and Culture (2019), the average score of national exam (UN) at SMA
(Bahasa, IPA, IPS) in East Java, were recorded to have decreased from interval 2017-2019. Nevertheless, the
achievement of the average value on a national scale at the high school level has increase (50.10), (50.80),
(52.43). In 2017, the results of national examination (UN) on SMA/MA and SMK in East Java, which scored an
average of 55 and <55 about 35% of the total number of UN participants. The number of SMA/MA and SMK
participants was 225,552 students and those who scored below 55 were 38,745 students. Meanwhile, the
number of students at SMK was 195,563 and those who scored below the average were 55,955 students.
Table 1 : Average Value of Grade XI Students Period of Semester 2018/2019
100
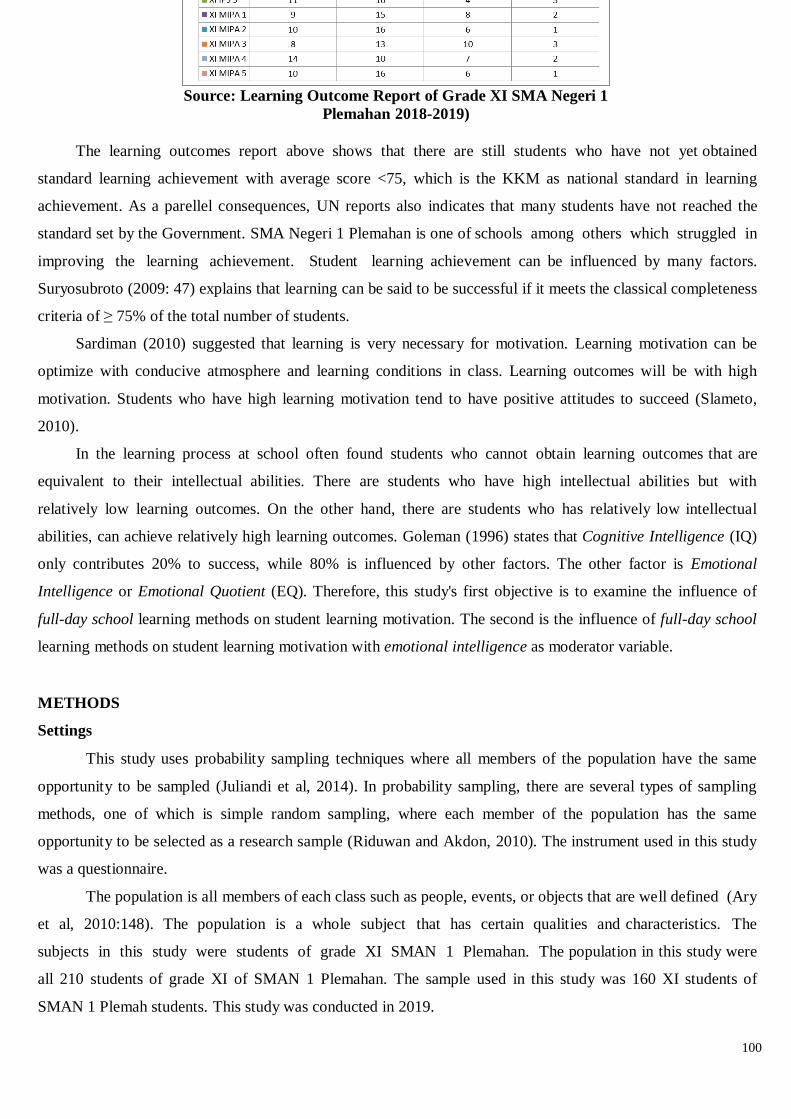
Source: Learning Outcome Report of Grade XI SMA Negeri 1
Plemahan 2018-2019)
The learning outcomes report above shows that there are still students who have not yet obtained
standard learning achievement with average score <75, which is the KKM as national standard in learning
achievement. As a parellel consequences, UN reports also indicates that many students have not reached the
standard set by the Government. SMA Negeri 1 Plemahan is one of schools among others which struggled in
improving the learning achievement. Student learning achievement can be influenced by many factors.
Suryosubroto (2009: 47) explains that learning can be said to be successful if it meets the classical completeness
criteria of ≥ 75% of the total number of students.
Sardiman (2010) suggested that learning is very necessary for motivation. Learning motivation can be
optimize with conducive atmosphere and learning conditions in class. Learning outcomes will be with high
motivation. Students who have high learning motivation tend to have positive attitudes to succeed (Slameto,
2010).
In the learning process at school often found students who cannot obtain learning outcomes that are
equivalent to their intellectual abilities. There are students who have high intellectual abilities but with
relatively low learning outcomes. On the other hand, there are students who has relatively low intellectual
abilities, can achieve relatively high learning outcomes. Goleman (1996) states that Cognitive Intelligence (IQ)
only contributes 20% to success, while 80% is influenced by other factors. The other factor is Emotional
Intelligence or Emotional Quotient (EQ). Therefore, this study's first objective is to examine the influence of
full-day school learning methods on student learning motivation. The second is the influence of full-day school
learning methods on student learning motivation with emotional intelligence as moderator variable.
METHODS
Settings
This study uses probability sampling techniques where all members of the population have the same
opportunity to be sampled (Juliandi et al, 2014). In probability sampling, there are several types of sampling
methods, one of which is simple random sampling, where each member of the population has the same
opportunity to be selected as a research sample (Riduwan and Akdon, 2010). The instrument used in this study
was a questionnaire.
The population is all members of each class such as people, events, or objects that are well defined (Ary
et al, 2010:148). The population is a whole subject that has certain qualities and characteristics. The
subjects in this study were students of grade XI SMAN 1 Plemahan. The population in this study were
all 210 students of grade XI of SMAN 1 Plemahan. The sample used in this study was 160 XI students of
SMAN 1 Plemah students. This study was conducted in 2019.

101
The sample is part of a population that has certain qualities and characteristics. According to Ary et al
(2010: 148), sample is part of a population. Sampling is the process of selecting a number of individuals to
study in such a way that the individual represents the large group from which they were selected (LR Gay,
1992:123). In choosing a sample, the sample must represent the population. After researchers identify the
population, the next step is to choose a sample.
Method
This type of research is quantitative research methods. In this study, the authors used quantitative
research methods. According to Creswell (1994), quantitative research is research that focuses on the basic
steps in a survey or experimental design. The study discusses in detail with a brief description of the population
and sample selection. Survey design can be in the form of a list of questions/statements that have been provided
to readers and designed according to the research design (Creswell, 1994).
In this study, researchers used instruments to collect data. The research instrument was a test.
Brown (2003: 384) states "tests are a method for measuring the ability or knowledge of people in a particular
domain". A good instrument must meet two important requirements, namely validity and reliability. According
to Brown (2003: 387), validity is a benchmark to find out the extent of the actual
test of the object being measured. The applied condition is that a questionnaire item is declared valid if the r-
value has a significant level of less than 5% (Silalahi, 2012). Brown (2003: 386) states "reliable tests
are consistent". The reliability test is used to measure the consistency of respondents
in answering the questionnaire. The variable is declared to be reliable if the Cronbach's alpha ( )
value is above 0.6.
This study uses a classic assumption test consisting of a normality test, multicollinearity test, and
heteroskedasticity test. The linear regression model used in this committee is a multiple linear regression
analysis models. Linear regression analysis model consisting of several independent variables and one
dependent variable is a multiple linear regression model (Faraway, 2002). Interaction Test (Moderated
Regression Analysis) is the application of multiple linear regression where the equation contains
interaction elements (multiplication of two / more independent variables). The coefficient of determination is
used to indicate the magnitude of the contribution of variable X to variable Y. The value of R2 or r ² is
between 0 and 1 which means that if R2 or r² = 1, it means that the independent variable can explain the
dependent variable 100% and the model approach used is right. F-test and T-test are used to test the
hypothesis in the research.

102
RESULT AND DISCUSSION
Multicollinearity Test
Detection of the presence or absence of multicollinearity is attempted by looking at the tolerance
value and the value of Variance Inflation Factor (VIF). If the VIF value is <10.00 and Tolerance is >0.10, then
the regression model is free from multicollinearity.
Table 2 : Result of Multicollinearity Test
(Model 1) Coefficientsa
Mod
el Correlati
ons
Collinearity
Statistics Zero-order Partial Par
t
Tolerance VI
F (Constant) 1
Full_Day_Scholl_X
,375
,375
,375
1,000
1,000
Table 3 : Result of Multicollinearity Test
(Model 2) Coefficientsa
Mod
el Sig
.
Correlati
ons
Collinearity
Statistics Zero-
order
Partial Par
t
Toleranc
e
VI
F (Constant)
1 Full_Day_Schol
l_X
Emotional_Intellig
ence_Z
,000
,000 ,375
,297
,282
,879
1,138 ,004 ,31
9 ,216
,200
,879
1,138
Table 4 : Result of Multicollinearity Test
(Model 3) Coefficientsa
Model Sig
.
Correlati
ons
Collinearity
Statistics Zero-
order
Partial Par
t
Toleranc
e
VI
F (Constant)
1 Full_Day_Scholl_X Emotional_Intelligence_Z
Mod_X*Z
,00
0
,507
,375
,051
,045
,393
2,544 ,803
,319
,019
,017
,475
2,104 ,005
,465
,213
,192
,239
4,183
(Source: Processed Data Results Using
SPSS, 2020)
Based on the assumption that if the Tolerance value >0.10 and VIF value <10.00 then there are no
symptoms of multicollinearity. Based on the tables above it is known that all VIF values are > 0.10 and the VIF
value indicates the value <10.00. It can be concluded that in this study the regression model 1,2,3 did not show
symptoms of multicollinearity.

103
Heteroscedasticity Test
The heteroscedasticity test aims to determine whether there are differences in variance from residual
observations to other observations in a regression model. Regression is said to be free from heteroskedasticity
and meets the assumptions test requirements if the residual transmit diagram does not form a particular
pattern. Here are the results of the heteroscedasticity test using the Scatterplot model :

104
Figure 1 : Scatterplot of Heteroscedasticity Test
(Model 1 )
Figure 2 : Scatterplot of Heteroscedasticity Test
(Model 2 )
Figure 3 : Scatterplot of Heteroscedasticity Test
(Model 3 ) (Source: Processed Data Results
Using SPSS, 2020)
Based on the assumption that the condition of a regression model is said to be free from heteroscedasticity
if the residual transmit diagram does not form a particular pattern. Figure 1,2,3 shows that patterns are formed
irregularly. It can be concluded that there is no heteroscedasticity and is feasible for testing the regression
model.
Autocorrelation Test
Autocorrelation can be detected by using the Durbin Watson test (DW-test). An observation is said to
have no autocorrelation if the Durbin Watson value is dU <DW <4-dU. Following are the Durbin Watson
values obtained from the regression model:

105
Table 5 : Result of Autocorelation Test
(Model 1) Model Summaryb
Model Change Statistics Durbin-Watson
df
1
df
2
Sig. F Change
1 1a 170 ,00
0
1,98
0
Table 6 : Result of Autocorelation Test
(Model 2) Model
Summaryb
Model Change Statistics Durbin-Watson
df
1
df
2
Sig. F Change
1 2a 169 ,00
0
2,01
9
Table 7 : Result of Autocorelation Test
(Model 3) Model
Summaryb
Model Change
Statistics
Durbin-Watson
df
1
df
2
Sig. F Change
1 3a 168 ,00
0
2,01
6 (Source: Processed Data Results Using
SPSS, 2020)
Based on the tables above, it is known that the Durbin-Watson (DW) value of the regression model is at
the dU and 4-dU intervals, so these results indicate no autocorrelation in the regression model, and therefore the
assumption of autocorrelation-free in the regression model is fulfilled.
Normality Data Test
The normality test is said normally if the significant value is >0.05. Meanwhile, if the significance value
is <0.05, the data is not normal. Tests conducted to see normality using the P-P plot / Scatterplot and
the Kolmogorov-Smirnov test. Here are the results of the normality test using Scatterplot :

106
Figure 4 : Result of Normality Data Test
(Model 1)

Table 15
107
Figure 5 : Result of Normality Data Test
(Model 2)
Figure 6 : Result of Normality Data Test
(Model 3)
(Source: Processed Data Results Using
SPSS, 2020)
Based on Figure 4,5,6 above shows if the residual transmit diagram has the same pattern of character and
does not show a certain pattern, so it can be concluded if in this study the data is normally distributed. Next, the
results of the normality test using the Kolmogorov-Smirnov test:
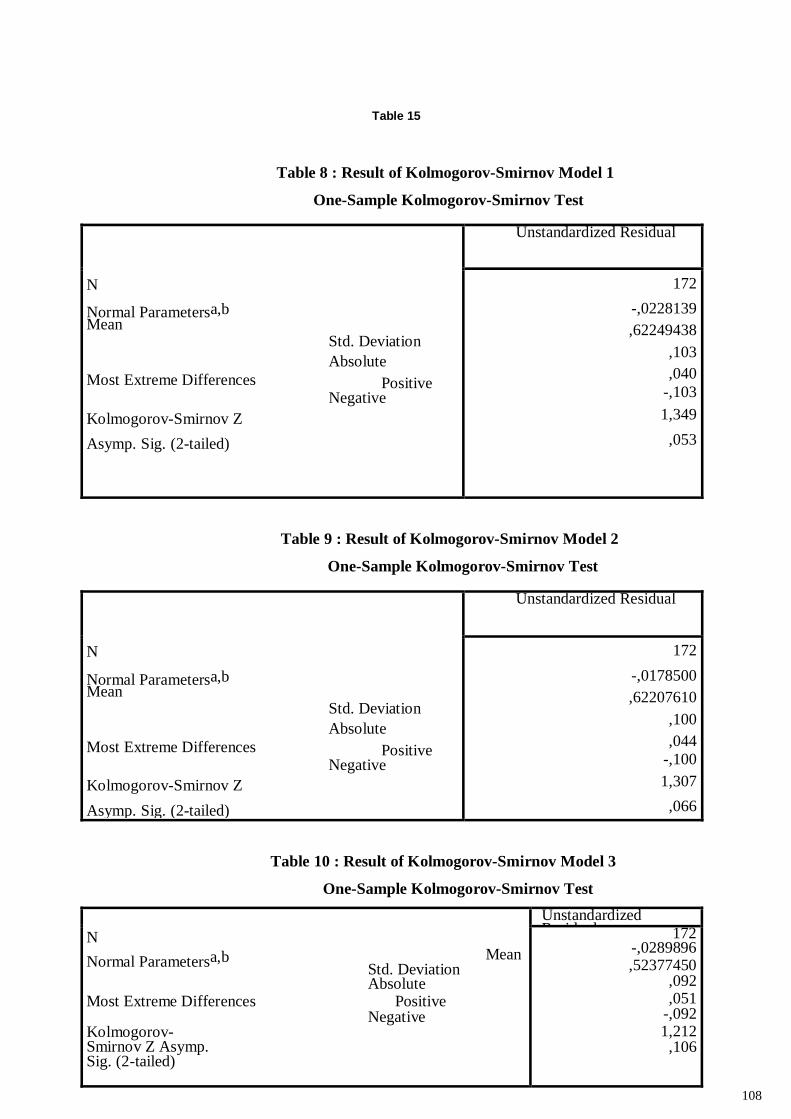
Table 15
108
Table 8 : Result of Kolmogorov-Smirnov Model 1
One-Sample Kolmogorov-Smirnov Test
Unstandardized Residual
N
Normal Parametersa,b Mean
Std. Deviation
Absolute
Most Extreme Differences Positive Negative
Kolmogorov-Smirnov Z Asymp. Sig. (2-tailed)
172
-,0228139
,62249438
,103
,040
-,103
1,349
,053
Table 9 : Result of Kolmogorov-Smirnov Model 2
One-Sample Kolmogorov-Smirnov Test
Unstandardized Residual
N
Normal Parametersa,b Mean
Std. Deviation
Absolute
Most Extreme Differences Positive Negative
Kolmogorov-Smirnov Z Asymp. Sig. (2-tailed)
172
-,0178500
,62207610
,100
,044
-,100
1,307
,066
Table 10 : Result of Kolmogorov-Smirnov Model 3
One-Sample Kolmogorov-Smirnov Test
Unstandardized Residual
N
Normal Parametersa,b Mean Std. Deviation Absolute
Most Extreme Differences Positive Negative
Kolmogorov-Smirnov Z Asymp. Sig. (2-tailed)
172 -,0289896 ,52377450
,092 ,051
-,092 1,212 ,106
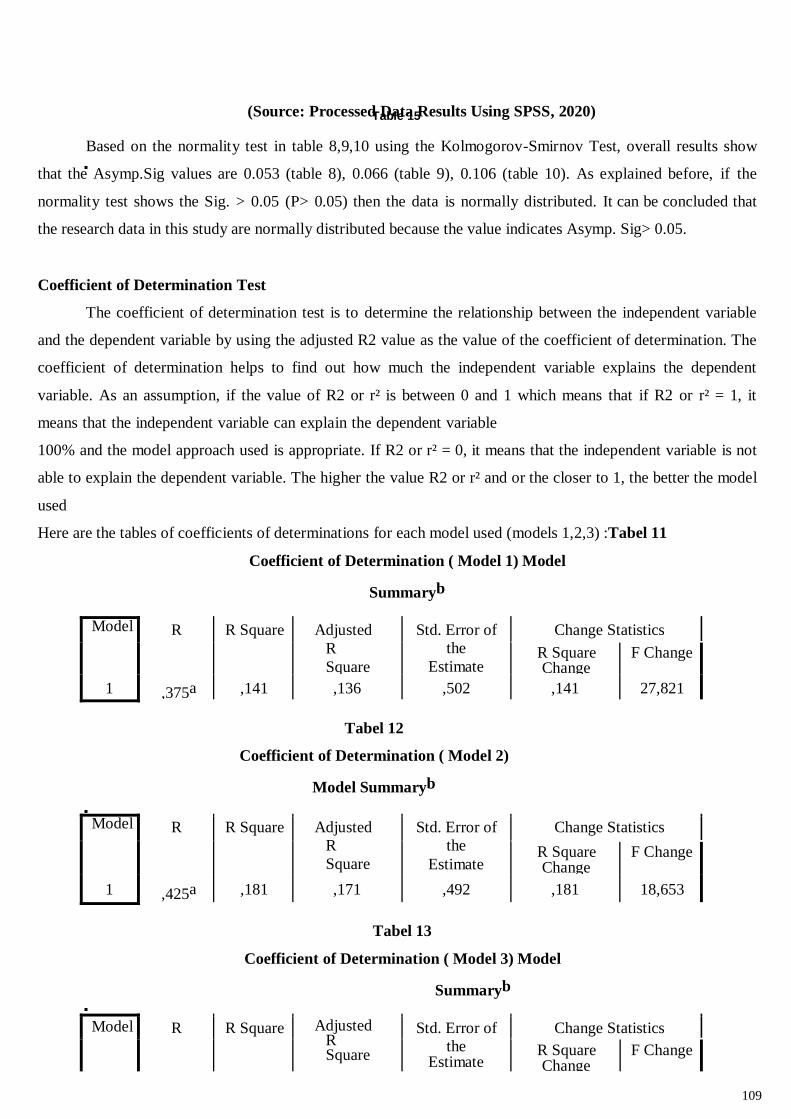
Table 15
109
(Source: Processed Data Results Using SPSS, 2020)
Based on the normality test in table 8,9,10 using the Kolmogorov-Smirnov Test, overall results show
that the Asymp.Sig values are 0.053 (table 8), 0.066 (table 9), 0.106 (table 10). As explained before, if the
normality test shows the Sig. > 0.05 (P> 0.05) then the data is normally distributed. It can be concluded that
the research data in this study are normally distributed because the value indicates Asymp. Sig> 0.05.
Coefficient of Determination Test
The coefficient of determination test is to determine the relationship between the independent variable
and the dependent variable by using the adjusted R2 value as the value of the coefficient of determination. The
coefficient of determination helps to find out how much the independent variable explains the dependent
variable. As an assumption, if the value of R2 or r² is between 0 and 1 which means that if R2 or r² = 1, it
means that the independent variable can explain the dependent variable
100% and the model approach used is appropriate. If R2 or r² = 0, it means that the independent variable is not
able to explain the dependent variable. The higher the value R2 or r² and or the closer to 1, the better the model
used
Here are the tables of coefficients of determinations for each model used (models 1,2,3) :Tabel 11
Coefficient of Determination ( Model 1) Model
Summaryb
Model R R Square Adjusted
R
Square
Std. Error of
the
Estimate
Change Statistics
R Square Change
F Change
1 ,375a ,141 ,136 ,502 ,141 27,821
Tabel 12
Coefficient of Determination ( Model 2)
Model Summaryb
Model R R Square Adjusted
R
Square
Std. Error of
the
Estimate
Change Statistics
R Square Change
F Change
1 ,425a ,181 ,171 ,492 ,181 18,653
Tabel 13
Coefficient of Determination ( Model 3) Model
Summaryb
Model R R Square Adjusted R Square
Std. Error of
the Estimate
Change Statistics
R Square Change
F Change

Table 15
110
1 ,467a ,218 ,204 ,482 ,218 15,598
(Source: Processed Data Results Using SPSS, 2020)
Based on table 11 (model 1), it can be seen that the value of R2 shows a value of 0.141. It means that the
independent variable simultaneously affects the dependent variable by 14.1% and the rest is explained by other
variables apart from this study. Table 12 (model 2) shows the value of R2 increased to 0.181 if compared to
model 1. The independent variable in this model simultaneously affected the dependent variable by 18.1%.
Table 13 (model 3) shows the value of R2 of 0.218. It means that the variable full-day school (X), emotional
intelligence (Z), and XZ interaction simultaneously affect the variable of student motivation (Y) by 21.8%,
which has increased by 3.7%.
Hypotetical Test
F-Test
F-Test is a statistical test used to test the magnitude of the influence of all the dependent variables in a
variety of independent variables. The suitability of the linear regression model between the dependent variables
(student learning motivation (Y)), independent variables (full-day school learning methods (X)), and
moderator variables (emotional intelligence (Z)) can be determined through the F-Test. Here are the results
of the F-Test before and after moderation :
Table
14
F-Test Result (Model 1) ANOVAa
Model
Sum of Squares Df Mean Square F Sig. Regression
1 Residual
Total
7,021 1 7,021 27,821 ,000b 42,903 170 ,252 49,924 171
a. Dependent Variable: Motivasi_Belajar_Y b. Predictors: (Constant), Full_Day_Scholl_X
F-Test Result (Model 2) ANOVAa
Model
Sum of Squares Df Mean Square F Sig. Regression
1 Residual
Total
9,028 2 4,514 18,653 ,000b
40,897 169 ,242 49,924 171
a. Dependent Variable: Motivasi_Belajar_Y b. Predictors: (Constant), Emotional_Intelligence_Z, Full_Day_Scholl_X
Table
16 F-Test Result
(Model 3)

Table 15
111
ANOVAa
Model
Sum of Squares df Mean Square F Sig. Regression
1 Residual
Total
10,876 3 3,625 15,598 ,000b 39,048 168 ,232 49,924 171
a. Dependent Variable: Motivasi_Belajar_Y
b. Predictors: (Constant), Mod_X*Z, Emotional_Intelligence_Z, Full_Day_Scholl_X
(Source: Processed Data Results Using SPSS, 2020)
Based on table 14(model 1), table 15 (model 2), table 16 (model 3), it can be seen that whether
moderation or moderated shows the same value that is equal to 0,000. If to the assumptions
:
1. H0: Full Day School Learning Method influences students' learning motivation with Emotional
Intelligence as a moderator variable.
2. H1: Full Day School Learning Method does not affect student learning motivation with
Emotional Intelligence as a moderator variable.
It can be concluded that there is a positive relationship direction where the significance value is
0,000 <0.05, then H0 is accepted and H1 is rejected. It means that the full-day school (X) learning method
with emotional intelligence (Z) simultaneously influences the variable of student motivation
(Y).
T-Test
The T-Test (test of significance of individual parameters) is used to test the effect of

Table 18
112
independent variables on the dependent variable partially. In this study, the T-Test was conducted to determine
whether each independent variable: Full Day School Learning Method (X) and Emotional Intelligence (Z) as a
moderator variable partially or individually influenced the Student Learning Motivation variable (Y).
Table 17
Significance of T-Test
(Model 1) Coefficientsa
Model Unstandardized
Coefficients
Standardize
d
Coefficients
t Sig
. B Std. Error Bet
a (Consta
nt) 1 Full_Day_Sch
ool_X
2,37
2
,24
2
9,790 ,00
0 ,388
,073
,375
5,275 ,000
Based on table 17 it can be seen that the value of the T-Test is 9,790 with a significance level of
0,000. As an assumption, if the T-test value is 0,000 <0.05, it can be concluded that the full-day school
learning method (X) has a positive effect on student learning motivation variables (Y).
Significance of T-Test
(Model 2) Coefficientsa
Model Unstandardized
Coefficients
Standardize
d
Coefficient
s
t Sig.
B Std. Error Bet
a (Constant)
1
Full_Day_Schol
l_X
Emotional_Intellig
ence_Z
1,68
0
,33
8
4,977 0,000 ,311
,077
,300
4,045 0,000 ,242
,084
,214
2,880 0,004
Based on table 18 it can be seen that the T-Test value of emotional intelligence and full-day school
variables is 2.880 with a significance level of 0.004. As an assumption, if the T -Test value is
0.004 <0.05, it can be concluded that the full-day school learning method (X) has a positive effect on student
learning motivation variables (Y) with emotional intelligence (Z) as moderator variables.
Table 19
Significance of T-Test
(Model 3) Coefficientsa
Mod
el Unstandardized
Coefficients
Standardize
d
Coefficient
s
t Sig
.
B Std. Error Bet
a
(Constant)
2,30
3
,39
8
5,790 0,000

Table 18
113
Model Unstandardized Coefficients
B Std. Error
(Constant) 2,372 ,242
Full_Day_Scholl_X ,388 ,073
1
Full_Day_Schol
l_X
Emotional_Intellig
ence_Z
Mod_X*Z
,07
5
,11
2
,07
2
,66
5
0,507 ,02
8
,11
2
,02
5
,25
0
0,803 ,07
8
,02
8
,39
4
2,820 0,005 (Source: Processed Data Results Using
SPSS, 2020)
Based on table 19, it can be seen that the T-Test value of emotional intelligence and full-day school
variables is 2.820 with a significance level of 0.005. As an assumption, if the T -Test value is
0.005 <0.05, it can be concluded that the full-day school learning method (X) has a positive effect on student
learning motivation variables (Y) with emotional intelligence (Z) as moderator variables.
Multiple Linear Regression Analysis
Multiple linear regression tests were conducted using the full-day school learning method variable
(X) as an independent variable and the emotional intelligence variable (Z) as a moderating variable to
student learning motivation (Y) as the dependent variable.
Description: Dependent Variable: Student Learning Motivation
Model 1: Full Day School Learning Methods
Model 2: Full Day School Learning Methods and Emotional Intelligence
Model 3: Full Day School Learning Methods, and XZ Interaction
Table
20
Coefficient of Regression
(Model 1)

114
Based on the results of multiple linear regression analysis, the Model 1 regression equation data is
obtained with the following formula:
Y = α + β1X + e
Y = 2,372 + 0,388X + e
Information :
Y = Student Learning Motivation
α = constant
β1,2,3 = coefficient of regression
X = Full Day School Learning Method
e = error factor
Based on table 20 above, it can be seen if the constant value of 2.337 indicates how much the value of
the student learning motivation variable (Y) as the dependent variable. The constant value above shows if the
independent variable and the dependent variable are equal to 0 (zero) or constant, then the variable of
student motivation will show a value of 0.242. The table above shows the coefficient of regression value of the
full-day school learning method (X) is 0.388. Considering the assumption that the other variables are constant,
thus, if there is an increase in the full-day school learning method (X) variable by 1 unit, then the student
motivation (Y) variable will increase by 0.388.
Table
21 Coefficient of Regression
(Model 2)
Model Unstandardized Coefficients
B Std. Error
(Constant)
Full_Day_Scholl 1 _X
Emotional_Intelli gence_Z
1,680 ,338
,311
,077
,242
,084
Based on the results of multiple linear regression analysis, the Model 2 regression equation data is
obtained with the following formula:
Y = α + β1X + β2Z + e Y = 1680 + 0.311X + 0.242Z + e
Information :
Y = Student Learning Motivation α = constant
β1,2,3 = coefficient of regression
X = Full Day School Learning Method
Z = Emotional Intelligence
e = error factor
Based on table 21 above, it can be seen if the constant value is 1.680. It means how much the value of
the student learning motivation variable (Y) as the dependent variable. The constant value above shows if the

115
independent variable and the dependent variable are equal to 0 (zero) or constant, then the student
motivation variable will show a value of 0.338. Next, the table above shows the coefficient of regression
value of the full-day school learning method (X) is 0.311. Based on the assumption that the other variables are
constant, thus, if there is an increase in the full-day school learning method (X) variable by 1 unit, then the
student motivation (Y) variable will increase by 0.311.ext, the coefficient of regression of the emotional
intelligence (Z) variable shows the value of 0.242. Based on the assumption that the other variables are
constant, thus, if there is an increase in the emotional intelligence variable (Z) by 1 unit, the student
motivation variable (Y) will increase by 0.242.
Table
22 Coefficient of Regression
(Model 3)
Model Unstandardized Coefficients
B Std. Error
(Constant)
Full_Day_Schol
l
1 _X Emotional_Intell
i gence_Z
Mod_X*
Z
2,303 ,398
,075
,112
,028
,112
,078 ,028 (Source: Processed Data Results Using SPSS, 2020)
Based on the results of multiple linear regression analysis, the Model 1 regression equation data is
obtained with the following formula:
Y = α + β1X + β2Z + β3XZ + e
Y = 2303 + 0.075X + 0.028Z + 0.078Z + e
Information :
Y = Student Learning Motivation
α = constant
β1,2,3 = coefficient of regression
X = Full Day School Learning Method
Z = Emotional Intelligence
X.Z = form of interaction between Full Day School and Emotional Intelligence
e = error factor
Based on table 5.22 above, it can be seen if the constant value of 2.303 shows how much the value of
the student learning motivation variable (Y) as the dependent variable. The constant value above shows if the
independent variable and the dependent variable are equal to 0 (zero) or constant, then the student
motivation variable will show a value of 0.398. The table above shows the coefficient of regression value of the
full-day school learning method (X) is 0.075. Based on the assumption that the other variables are constant,

116
thus, if there is an increase in the full-day school learning method (X) variable by 1 unit, then the student
motivation (Y) variable will increase by 0.075.
The emotional intelligence (Z) coefficient of regression shows a value of 0.028. Based on the
assumption that the other variables are constant, thus, if there is an increase in the emotional intelligence (Z)
variable by 1 unit, the student motivation (Y) variable will increase by 0.028. The next regression coefficient
value is the emotional intelligence (Z) and full-day school learning method (X) variable that is equal to 0.078.
as an assumption, if the other variables are constant, thus, if there is an increase in the emotional intelligence
(Z) and the full-day school learning method (X) variable by 1 unit, the student motivation (Y) variable will
increase by 0.078.
CONCLUSION
Based on the results of data analysis and discussion, it can be concluded that full-day school learning
methods influence student learning motivation with a positive relationship. Based on the results, it can be
assumed that the better the full-day school learning method, the higher the student's motivation, and vice versa.
Furthermore, the results of the F-Test also showed that the full-day school learning method variable and
emotional intelligence variable simultaneously influenced student motivation. Next, the result of the role of
emotional intelligence as a moderator variable shows a positive effect. Based on the results of the analysis and
discussion above, it can be concluded that there is an influence between the full-day school learning method and
emotional intelligence as a moderating variable on student learning motivation, with an effect of 21.8%.
ACKNOLEDGEMENT
The author conveys his deepest thanks to Allah SWT to His blessings and mercy. Parents who always
provide prayers and support. Next, Dr. Windijarto, SE., MBA as Advisor I and Dr. Pinky Saptandari Endang
Pratiwi, Dra., MA. as supervisor II who has provided guidance and advice until the completion of the thesis.
All lecturers of the Master of Human Resource Development who have allowed gaining useful knowledge, and
finally the friends of the PSDM Masters Study Program, especially class of 2016.
REFERENCES Ary, D., Jacobs, L., & Sorensen, C. (2010). Introduction to Research in Education. USA: Wadsworth
Brown, H. D. (2003). Language Assesment Principles and Classroom Practice. In Pearson Longman.
Carmody, Kevin, & Zane, B. (2005). Elemental Analysis of the Online Learning Experience. International
Journal of Education AND Development Using ICT, Vol. 1 No.3.
Creswell, J. W. (1994). Research Design: Qualitative and Quantitative Approach. California: Sage Publication.
Faraway, J. J. (2002). Practical Regression and Anova using R. Reproduction.
https://doi.org/10.1016/0360-

117
1315(91)90006-
D
Gay, L., & Diehl, P. (1992). Reserach Methods for Business and Management. New York: Macmillan
Publishing company. Goleman, D. (1996). Emotional Intelligence: Why Can It Matter More Than IQ for Character, Helath,
and Lifelong
Achievement? In BantamBooks. Juliandi, A., & Irfan. (2014). Metodologi Penelitian Kuantitatif Untuk ilmu-Ilmu Bisnis. Bandung:
Citapustaka Media
Perintis.
Miller. (2005). Full-Day or Half-Day Elementary. (htpp: //www.askeric.org): (Online), accessed on January 22,
2018. Ministry of Education and Culture. (2019). KEMENDIKBUD Data Statistics Publication. on January 6,
2018. At 20:15 WIB: http://publikasi.data.kemdikbud.go.id/uploadDir/isi_B5497FED-88A5-47CD-9492-78B703B41D28.pdf.
Mubeen, & Reid. (2006). The Measurement of Motivation With Science Students. 129-
144. Riduan, & Akdon. (2010). Rumus dan Data Dalam Analisis Data Statistika.
Bandung: Alfabeta. Sardiman, A. (2010). Interaction and Teaching and Learning
Motivation. Jakarta: Rajawali Press. Silalahi. (2012). Metode Penelitian Sosial.
Bandung: Refika Aditama.
Slameto (2010). Learning and Factors That Influence It. Jakarta: Rineka Cipta.
Suryosubroto. (2009). Teaching and Learning Process in School. Jakarta:
Rineke Cipta.