
PeneloPET, a Monte Carlo PET simulation tool based on …nuclear.fis.ucm.es/CDTEAM/articulos pdf/PDF...
20
IOP PUBLISHING PHYSICS IN MEDICINE AND BIOLOGY Phys. Med. Biol. 54 (2009) 1723–1742 doi:10.1088/0031-9155/54/6/021 PeneloPET, a Monte Carlo PET simulation tool based on PENELOPE: features and validation S Espa ˜ na 1 , J L Herraiz 1 , E Vicente 1,2 , J J Vaquero 3 , M Desco 3 and J M Udias 1 1 Grupo de F´ ısica Nuclear, Departmento de F´ ısica At´ omica, Molecular y Nuclear, Universidad Complutense de Madrid, Madrid, Spain 2 Instituto de Estructura de la Materia, Consejo Superior de Investigaciones Cient´ ıficas (CSIC), Madrid, Spain 3 Unidad de Medicina y Cirug´ ıa Experimental, Hospital General Universitario Gregorio Mara˜ n´ on, Madrid, Spain E-mail: jose@nuc2.fis.ucm.es Received 28 October 2008, in final form 31 January 2009 Published 25 February 2009 Online at stacks.iop.org/PMB/54/1723 Abstract Monte Carlo simulations play an important role in positron emission tomography (PET) imaging, as an essential tool for the research and development of new scanners and for advanced image reconstruction. PeneloPET, a PET-dedicated Monte Carlo tool, is presented and validated in this work. PeneloPET is based on PENELOPE, a Monte Carlo code for the simulation of the transport in matter of electrons, positrons and photons, with energies from a few hundred eV to 1 GeV. PENELOPE is robust, fast and very accurate, but it may be unfriendly to people not acquainted with the FORTRAN programming language. PeneloPET is an easy-to-use application which allows comprehensive simulations of PET systems within PENELOPE. Complex and realistic simulations can be set by modifying a few simple input text files. Different levels of output data are available for analysis, from sinogram and lines-of-response (LORs) histogramming to fully detailed list mode. These data can be further exploited with the preferred programming language, including ROOT. PeneloPET simulates PET systems based on crystal array blocks coupled to photodetectors and allows the user to define radioactive sources, detectors, shielding and other parts of the scanner. The acquisition chain is simulated in high level detail; for instance, the electronic processing can include pile-up rejection mechanisms and time stamping of events, if desired. This paper describes PeneloPET and shows the results of extensive validations and comparisons of simulations against real measurements from commercial acquisition systems. PeneloPET is being extensively employed to improve the image quality of commercial PET systems and for the development of new ones. 0031-9155/09/061723+20$30.00 © 2009 Institute of Physics and Engineering in Medicine Printed in the UK 1723
Transcript of PeneloPET, a Monte Carlo PET simulation tool based on …nuclear.fis.ucm.es/CDTEAM/articulos pdf/PDF...

IOP PUBLISHING PHYSICS IN MEDICINE AND BIOLOGY
Phys. Med. Biol. 54 (2009) 1723–1742 doi:10.1088/0031-9155/54/6/021
PeneloPET, a Monte Carlo PET simulation tool basedon PENELOPE: features and validation
S Espana1, J L Herraiz1, E Vicente1,2, J J Vaquero3, M Desco3
and J M Udias1
1 Grupo de Fısica Nuclear, Departmento de Fısica Atomica, Molecular y Nuclear, UniversidadComplutense de Madrid, Madrid, Spain2 Instituto de Estructura de la Materia, Consejo Superior de Investigaciones Cientıficas (CSIC),Madrid, Spain3 Unidad de Medicina y Cirugıa Experimental, Hospital General Universitario GregorioMaranon, Madrid, Spain
E-mail: [email protected]
Received 28 October 2008, in final form 31 January 2009Published 25 February 2009Online at stacks.iop.org/PMB/54/1723
Abstract
Monte Carlo simulations play an important role in positron emissiontomography (PET) imaging, as an essential tool for the research anddevelopment of new scanners and for advanced image reconstruction.PeneloPET, a PET-dedicated Monte Carlo tool, is presented and validatedin this work. PeneloPET is based on PENELOPE, a Monte Carlo code forthe simulation of the transport in matter of electrons, positrons and photons,with energies from a few hundred eV to 1 GeV. PENELOPE is robust, fastand very accurate, but it may be unfriendly to people not acquainted with theFORTRAN programming language. PeneloPET is an easy-to-use applicationwhich allows comprehensive simulations of PET systems within PENELOPE.Complex and realistic simulations can be set by modifying a few simple inputtext files. Different levels of output data are available for analysis, fromsinogram and lines-of-response (LORs) histogramming to fully detailed listmode. These data can be further exploited with the preferred programminglanguage, including ROOT. PeneloPET simulates PET systems based on crystalarray blocks coupled to photodetectors and allows the user to define radioactivesources, detectors, shielding and other parts of the scanner. The acquisitionchain is simulated in high level detail; for instance, the electronic processing caninclude pile-up rejection mechanisms and time stamping of events, if desired.This paper describes PeneloPET and shows the results of extensive validationsand comparisons of simulations against real measurements from commercialacquisition systems. PeneloPET is being extensively employed to improve theimage quality of commercial PET systems and for the development of newones.
0031-9155/09/061723+20$30.00 © 2009 Institute of Physics and Engineering in Medicine Printed in the UK 1723
1724 S Espana et al
1. Introduction
Monte Carlo simulations play an important role in positron emission tomography (PET)imaging, as an essential tool for the research and development of new scanners and foradvanced image reconstruction. The availability of powerful computers has encouraged theuse of PET-dedicated simulation codes in the last few years. Examples of areas that benefitfrom extensive simulations are the design of new PET scanners (Braem et al 2004, Heinrichset al 2003), the development and assessment of image reconstruction algorithms (Herraiz et al2006) and of correction techniques (Levin et al 1995), among other applications (Zaidi 2000,Ay and Zaidi 2006, Ortuno et al 2003, 2006, Torres-Espallardo et al 2008). Simulations makeit possible not only to refine the design parameters of PET scanners, but they also help toidentify bottlenecks regarding count rate, resolution, sensitivity, etc.
There are several Monte Carlo codes (for a short and recent review see Buvat and Lazaro(2006)) that simulate the transport of radiation through matter, e.g. GEANT4 (Agostinelli2003), MCNP (Briesmeister 1993), EGS4 (Kawrakow and Bielajew 1998) and PENELOPE(Baro et al 1995, Salvat et al 2003). Either based upon these codes or in tables of photoncross-sections, a number of tools for PET simulation have been developed, such as SIMSET(Harrison et al 2003), PETSIM (Thomson et al 1992) or Eidolon (Zaidi et al 1998), basedon MCNP, and GATE, based on GEANT4 (Jan et al 2004). Probably (Buvat and Lazaro2006), one of the most widely known is GATE which, being based in GEANT4, can include alarge variety of photon detectors and targets the large community of high energy and nuclearphysics users that have acquaintance with GEANT4. GEANT4 is powerful and flexibleenough to simulate PET scanners; however, its learning curve is both steep and long. Asuperficial knowledge of C++ is insufficient to optimally use GEANT4, and the installationprocess requires more than basic computer skills. This is why GATE was developed. GATEconsists of hundreds of classes that provide useful functionalities for PET simulations. NoC++ programming is involved and thus it is easier to learn and use, unless there is a need tocreate new classes to address specific problems.
We have chosen PENELOPE as the core of our PET simulation tool. PENELOPE isa Monte Carlo code for the simulation of the transport in matter of electrons, positrons andphotons with energies from a few hundred eV to 1 GeV. It is then less generally aimed asGEANT4, but it suits well PET needs, it is fast and robust, and it is extensively used forother medical physics applications, particularly for dosimetry and radiotherapy (Sempau andAndreo 2006, Panettieri et al 2007). PENELOPE is written in the FORTRAN programminglanguage.
1.1. Why another PET simulator?
The main purpose of our PET simulator is the optimization of the design of small animalPET scanners. Most often these scanners are made of multiple scintillator arrays read byAnger-like logic, arranged in complex geometries with millions of lines of response (LORs).In order to optimize the scanner design, many high-statistics simulations have to be madeand studied, each of them with different scanner settings, such as for instance geometry(scanner diameter, crystal size), materials (scintillator, shielding and other scatter elements),electronics (integration time, dead time, coincidence window, pile-up rejection), etc. Thus,it is desirable to have the fastest possible simulation tool, capable of running in parallel inclusters of computers, and able to provide an easy way of executing many simulation instanceswith small changes of the scanner definition. The ample variety of detector configurations

PeneloPET, a Monte Carlo PET simulation tool based on PENELOPE 1725
allowed by the combination GEANT/GATE is appealing, but it comes at the cost of increasedneed for computing resources (Buvat and Lazaro 2006).
The FORTRAN language is highly standardized and it is available for many computerarchitectures aimed to scientific computing, to which FORTRAN compilers have been adaptedand optimized for speed and accuracy. Written in FORTRAN, PENELOPE is bound tobe both fast and portable. On the other hand, while still widely used by physicists andmathematicians, FORTRAN is not the most popular programming language among youngresearchers and lacks the object-oriented structure that is appealing when writing modularcodes. On these grounds, we have developed PeneloPET, a FORTRAN package that allowsus to easily define complete simulations of PET systems within PENELOPE. PeneloPET iscapable of preparing sophisticated simulations just by editing a few simple input text files,without requiring knowledge of FORTRAN or any other programming language. Simulationsprepared with PeneloPET are straightforward to run in parallel using clusters of computers.
1.2. Introduction to PeneloPET
The basic components of a PeneloPET simulation are detector geometry and material definition(including non-detecting materials, like shielding), source definitions, non-active materials inthe field of view (FOV) of the scanner and electronic chain of detection. All these componentsare defined with parameters in the input files. Different levels of output data are available foranalysis, from sinogram and LORs histogramming to fully detailed list mode. These data canbe further exploited with the preferred programming language, including ROOT. The detailedlist mode generates a file with all the hits, single or coincidence events and the correspondinginformation about interaction coordinates, deposited energy in the detectors, and time andtype of coincidence: random, scatter, true, with pile-up, etc.
In this work we have performed several comparisons with another PET-dedicated code(GATE) and with studies obtained from four commercial PET scanners. The agreementbetween PeneloPET simulations and the results obtained in real scanners confirms PeneloPETas a powerful tool for PET research and development as well as for quality assessment of PETimages. PeneloPET is freely available and can be obtained by request from the authors. Thereader interested can visit http://nuclear.fis.ucm.es/penelopet for details.
2. PeneloPET features
2.1. Source code
Our goal with PeneloPET has been to develop an easy-to-use program that includes all thephysical and electronic processes involved in PET. PeneloPET requires a moderate timeinvestment for the preparation of the simulation setup and it runs very efficiently, withmodest computational burden compared to other PET simulation tools. It can be portedto any platform and operating system capable of compiling FORTRAN programs. We havetried PeneloPET under Windows, Linux/Unix and Mac OS X platforms and with differentFORTRAN compilers (gnu-g774, Absoft5, Intel6) without porting problems.
The source code consists of two main modules. The first one deals with the PENELOPEsimulations and the level of detail chosen for these, and takes care of the information aboutscanner detectors and materials, source and decay. This module includes the routines involved
4 http://www.gnu.org/software/fortran/fortran.html.5 http://www.absoft.com/Absoft%20Compilers.htm.6 http://www.intel.com/cd/software/products/asmo-na/eng/compilers.
1726 S Espana et al
in the distribution of isotopes and emission of particles generated in the decay processes aswell as their interactions.
The second module post-processes the decay and interaction data generated by the firstmodule. It takes into account, for instance, Anger logic for positioning the interaction insidethe crystal array, detector pile-up, energy resolution in the scintillator and aspects of theelectronics, such as coincidence time window, dead time, time resolution and integration time.No PENELOPE routines are generally involved in this second module. Energy windows canbe applied in this second module. Continuous or pixelated detectors can be managed by thissecond stage of the simulation package.
In order to run the simulations on clusters of computers, a simple and portable Python7
script is provided with the code. The use of Python enables one to run the script underWindows, Linux/Unix and Mac OS X. After configuring PeneloPET for the execution ofthe desired setup in a single CPU, the Python script launches the simulation on the numberof CPUs desired, with different random seeds, and takes care of the initial activity and theacquisition time for each sub-process, in order to simulate the same number of decay eventsas the equivalent single-CPU run. In this way, the simulation time is reduced proportionallyto the number of CPUs employed.
2.2. Input files
Four input files have to be prepared by the user in order to set up a simulation. The firstinput file (main.inp) contains the general parameters of the simulation, such as the acquisitionprotocol and acquisition time. It also selects the simulation of secondary particles, if desired,and controls whether the positron range and non-collinearity are taken into account. This filealso contains options for scanner rotation, energy and coincidence windows, contributions todead time, output format and type of study.
In the second file (scanner.inp), which contains the scanner definition, multiple rings andlayers of crystals can be specified. Although our main goal was to simulate pixelated detectorsfor high-resolution small animal PET imaging, PeneloPET is also suitable for continuousscintillator blocks or even detectors not based on scintillators (such as CZT or silicon strips)with small or no changes.
Non-radioactive materials other than the scintillator (already defined in the filescanner.inp), such as the surrounding materials and shielding, are defined in a third file(object.inp). The radioactive source is defined separately in a fourth input file (source.inp),which contains source geometry and information about activity and isotope. Keeping separateddefinitions for sources and materials simplifies the comparison of simulations of ideal sources,without scatter or attenuation, and more realistic sources. All the details about PeneloPETinput files and options can be found in the PeneloPET manual.8
Typical materials for crystals, shielding and phantoms are predefined in PeneloPET and,if necessary, new materials can be created in a straightforward way. The visualization toolsbuilt in PENELOPE (gview2d, gview3d (Salvat et al 2003)) are also available in PeneloPETto display and test geometries. This is especially useful during scanner design stages (seefigure 1).
Although the examples presented in this work deal with pre-clinical scanners, PeneloPETis also capable of simulating clinical PET scanners.
7 http://www.python.org/.8 http://nuclear.fis.ucm.es/penelopet/.

PeneloPET, a Monte Carlo PET simulation tool based on PENELOPE 1727
Figure 1. View of the SUINSA ARGUS (Wang et al 2006) scanner obtained with the gview3dapplication distributed with PENELOPE. An annulus phantom can also be observed, centered inthe FOV.
2.3. Output
Output files generated by PeneloPET can offer three different levels of detail. At the highestlevel, all the information about each interaction is recorded for further analysis. At theintermediate level, just the single events and the information needed for their analysis isrecorded. The possibility of pile-up and cross-talk is taken here into account. At the third,and lowest, level of detail, only coincidence events are recorded in a compact LIST mode.Information about pile-up, scatter, random and self-coincidence events obtained from thesimulation is also summarily available.
A coincidence event is labeled as pile-up when at least one of the single events hassuffered pulse pile-up. A coincidence is considered to be a scatter coincidence when at leastone of the photons that trigger the detectors has interacted before reaching the scintillator. Acoincidence is considered as a random one when the two photons in the coincidence pair comefrom two different, uncorrelated, annihilation process. A self-coincidence event may arisewhen the same photon, after scattering in a first detector, reaches a second detector. If theenergy deposited in each detector is above the detection threshold, it may trigger two singleevents and yield a self-coincidence. The remaining coincidences are considered as true events.
PeneloPET generates several output histograms that help to understand the results of thesimulations, such as for instance sinogram projections, LOR histogram, single and coincidencemaps and energy spectrum. In order to simplify the reconstruction of simulated data, the formatof the sinograms conforms to that expected by the STIR library.9
ROOT (Brun and Rademakers 1997) is an object-oriented data analysis framework thatprovides tools for the analysis of experimental data. PeneloPET LIST files can be convertedinto ROOT format. As an example, figure 2 shows a two-dimensional energy histogram of thesingle events that yield the coincidence events, which has been plotted with ROOT.
2.4. Geometry
The geometry of detectors and other materials of the scanner can be defined in the input filesby means of a few text lines. The scanner definition file (scanner.inp) contains the description
9 http://stir.sourceforge.net.

1728 S Espana et al
Figure 2. A two-dimensional energy histogram of single events belonging to the same coincidence,histogrammed with ROOT from the file generated with the ROOT-output option of PeneloPET.
of a multi-ring arrangement of rectangular prism-shaped detectors, often segmented into pixelcrystals and with one or more layers of scintillator in each detector. Several predefinedmaterials can be used in the detectors, and more materials can be defined by indicating theirenergy and time resolution and light pulse rise and fall time. Thus, the scanner definitionincludes the number of detectors per ring, number of rings, gap between adjacent rings,number of pixel crystals per detector, detector material, number of scintillation layers andmaterial for each, pitch size and ring size. Other structures can be defined (object.inp) tocomplete the geometry with shielding and other non-detecting materials.
If the user needs to simulate more complex geometries, the geometry file can be directlycreated employing PENELOPE geometry syntax. Detector blocks can be displaced fromtheir regular positions in order to build non-regular complex geometries or to introducemisalignments of detectors.
The distribution of radioactive sources used in the simulation is described in a third file(source.inp). It contains the shape, location, activity, radioactive isotope and restrictions inemission directions, if any.
2.5. Emission of annihilation photons
When annihilation photons are emitted, the direction of emission is randomly and isotropicallygenerated. For some simulations it may be useful to restrict the allowed solid angle for theemission of photons, thus increasing the time efficiency of the simulation. Limits and/orprivileged directions can be selected in the input files. PeneloPET automatically adjusts thesimulation results according to the solid angle restrictions incorporated.
2.6. Isotope and source selection
Another input file (isotope.inp) contains the definition of one or several isotopes, stating thehalf-life and a list of all emitted particles as the nuclide decays. For each particle in thelist, its type (electron, positron or photon), energy (Qβ, Eυ) and branching ratio are defined.Any mixture of sources with different isotopes and activities can be used as radioactive

PeneloPET, a Monte Carlo PET simulation tool based on PENELOPE 1729
Figure 3. Simulated positron spectra obtained with PeneloPET and employed in positron rangecalculations. From left to right, 18F, 68Ge/68Ga, dashed lines without Coulomb correction, solidlines with Coulomb correction. The horizontal axis represents the kinetic energy normalized tothe maximum value of each spectrum.
distribution. The isotopes most commonly used in PET are already defined and it is easyfor the user to define new ones if required. Time intervals between consecutive decays arerandomly generated following statistical distributions appropriate to initial activity and decaytime. Intrinsic activity of detectors can be included in the simulation by simply defining asource with the geometry and activity of the scintillator crystals.
2.7. Positron range
When a positron is generated in a decay process, it has a kinetic energy that depends on theenergy shared with the neutrino created in the same process. This yields a continuum energyspectrum distribution which is easily computed from theoretical grounds, either for allowedor superallowed transitions, and including the Coulomb correction factor (see for instanceequation (13) in Levin and Hoffman (1999)) after Richardson and Kurie (1936). In PETpositron range simulations, this latter Coulomb correction factor is often either neglected oronly treated with a non-relativistic approach. PeneloPET uses the exact expression for theCoulomb correction factor, which, albeit relatively close to one for light nuclei and positronemission, it may significantly distort the beta spectrum for medium to heavy nuclei, particularlyin the case of electron emission. Figure 3 shows the normalized positron spectra correspondingto 18F, and 68Ge/68Ga, with and without Coulomb correction.
PeneloPET offers two approaches for simulating the positron range. The first one tracksthe path and energy spectrum for each positron coming from the decay process. This leads toaccurate results, but at the expense of increased computation time. With the second approach,the profile of the positron range in water is generated from a detailed simulation (as describedfor the previous approach) only once, saving the resultant profile for later use in simulationsin which the positron annihilation point will be randomly generated from these pre-computedprofiles (Levin and Hoffman 1999, Harrison et al 1999). Positron range profiles for the β+
isotopes most widely used in PET are included with PeneloPET. Profiles for other isotopescan be added using tools provided with PeneloPET.

1730 S Espana et al
Figure 4. Histogram of time differences of the two single events in a coincidence pair. Thissimulation was performed using a rat-size phantom filled with 71 MBq of 18F for the ARGUSscanner. The vertical axis is in logarithmic scale.
2.8. Non-collinearity
When an annihilation process takes place with both positron and electron at rest, two photonsof about the same energy (511 keV) are produced. Because of energy and momentumconservation, both photons should be emitted along the same line but in opposite directions.However, annihilation usually takes places with thermal electrons which have a kinetic energyof a few eV, leading to a slight non-collinearity of the two emitted photons. This non-collinearity is modeled by a Gaussian distribution of 0.5 degrees FWHM (Harrison et al1999).
2.9. Energy and time resolution, crystal assignment, coincidence window
Energy resolution of the detector at 511 keV is specified by the user in the scanner.inp inputfile and it is linearly extrapolated for other energies. Detector time resolution is estimatedfrom time-blurring effects after a photon produces a trigger in a detector. Usual contributorsto this time blurring are electronic jitter and rise time of the light emitted by the crystaldetector. Furthermore, the simulations include the determination of the position of interactionby means of Anger-like center of gravity methods. To account for further blurring effects inthe interacting pixel assignment, Gaussian blurring can be added to the final pixel assignment.Since all the events are time stamped, software cuts (time coincidence windows) can beapplied to the listed events to select true coincidences. The list file generated by the simulationcontains detailed time information for the events, so histograms of time differences betweenthe two single events of a coincidence are easily created (see figure 4) and thus the efficiencyof time coincidence cuts or even the probability that a coincidence count comes from a trueor a random coincidence, given their time difference, can be readily estimated. The timeinformation for the recorded counts can also include the time path of the photons from thedecay point to the detectors, and thus time of flight (TOF) studies can be easily simulated. Theuser can arrange the simulated counts into TOF bins and use them in TOF reconstructions.

PeneloPET, a Monte Carlo PET simulation tool based on PENELOPE 1731
Figure 5. Energy spectrum for simulated acquisitions at different activity levels, with linear (toppanel) and log (bottom panel) scales. This simulation was performed for a rat-size phantom filledwith 18F in the ARGUS scanner. Counts at the right of the photopeak are due to detector pile-upevents, whose contribution is more conspicuous for larger activities. Pile-up events also fill in abit the region around the Compton edge.
2.10. Pulse pile-up
A pulse is generated when a photon deposits energy in a detector above a given threshold. Theshape and duration of this pulse are defined in the simulation. Due to the time response of thescintillator, an integration of the pulse during, typically, a hundred of nanoseconds is neededin order to measure the energy deposited by the photon and to localize the interaction. If anyother photon interacts with the same detector within this integration time, an overlap of bothpulses (detector pile-up) will result. Pile-up causes incorrect energy and crystal identification.The time response of the detectors and the acquisition electronics are taken into account inthe simulations, and PeneloPET can also simulate mechanisms for pulse pile-up rejection.Figure 5 shows the distortion of the energy spectrum due to pulse pile-up obtained fromPeneloPET simulations.
2.11. Dead time
Dead time occurs when new events take place while the acquisition chain is still busy analyzingprevious events. In general, there are several sources of dead time in PET detectors. Firstof all, in the detection process, a trigger is activated when the energy deposited by a photonin the detector exceeds certain energy threshold. When this happens, new events may notbe accepted during a certain amount of time. This constitutes the detector trigger (or singleevent) contribution to the total dead time of the scanner and it is usually small comparedto other contributors to dead time. Some scanners (e.g. CLEARPET) work in single-modeacquisition, that is, every single event identified is converted while coincidence sorting isperformed later. In this case, for every single event, additional dead time contributions shouldbe considered. These include for instance integration time, explained in previous subsection,and also conversion time, that is, the time required to complete the analog to digital conversion(ADC) of the detector signals and the subsequent transmission and storage of this digital
1732 S Espana et al
information in a computer. In single-mode acquisition scanners, there may be no furthercontribution to dead time due to the subsequent processing and sorting of coincidences, asthis can even be done off-line. On the opposite side, in many other scanners (e.g. VrPETor INVEON), the single events identified (i.e. free from detector trigger dead time) followfurther processing (including ADC) only if they lie within a certain time coincidence windowof another single event. This can be termed as coincidence-mode acquisition. In this case, themajor contribution to total scanner dead time originates in the processing (most importantlyADC) and sorting of the events identified as members of a coincidence pair, and it is this‘coincidence dead time’ the main contributor to the total dead time of the scanner. All thesesources and types of dead time can be simulated in PeneloPET as it considers trigger andcoincidences dead time, as well as integration time, separately in the main.inp file.
2.12. Constraints in energy and type of particle
PeneloPET offers all the possibilities of PENELOPE for introducing constraints in energy andkind of particle considered in the simulation (Baro et al 1995, Salvat et al 2003). Dependingon the purpose of the simulation, the user may choose to track all the photons, electrons andpositrons, including every secondary particle, or just some of them. It is also possible to trackonly the particles with energy above a certain threshold or to stop tracking a particle when itsenergy falls below a low energy threshold. Faster simulations can be performed by trackingonly the annihilation photons. This may constitute a good approximation as far as the meanfree path of secondary particles is short enough, as it is the case in medical imaging.
2.13. System response
Iterative reconstruction methods require knowledge of the system response matrix (SRM)(Herraiz et al 2006). The SRM is made up of elements representing the probability of detectingevents coming from a given voxel in a given LOR. PeneloPET includes the possibility ofbuilding the SRM for specific LORs. For this purpose, a point source of the selected isotope issimulated in different locations along the channel of response (CHOR), defined as the regionof the space associated with the LOR, in the sense that a source located anywhere insidethe CHOR has a non-negligible probability of producing coincidence events in the detectordefining the LOR (Herraiz et al 2006). Several parameters of the simulation can be tuned toestablish a tradeoff between speed and accuracy. The SRM can also be obtained for rotatingscanners, by calculating probabilities of detection for sinogram bins instead of LORs.
3. Validation of PeneloPET
This section presents and evaluates simulations generated by PeneloPET. First, a comparisonbetween results obtained with PeneloPET and those provided by the GATE simulation toolkitis shown. An axial sensitivity profile for a simple configuration based on the rPET (Vaqueroet al 2005) scanner was estimated from PeneloPET and GATE simulations. In the remainder ofthis section, we compare simulated measurements with real measurements for four commercialsmall-animal PET scanners: rPET (Vaquero et al 2005), ARGUS (Wang et al 2006), RaytestCLEARPET (Heinrichs et al 2003) and Siemens INVEON (McFarland et al 2007). Thereal measurements from ARGUS, CLEARPET and INVEON scanners were taken from Wanget al (2006), Sempere Roldan et al (2007) and Blake et al (2006), respectively. The simulationstried to reproduce as accurately as possible, with the information available to the authors, thegeometry and materials mentioned in said references.

PeneloPET, a Monte Carlo PET simulation tool based on PENELOPE 1733
Figure 6. Axial sensitivity profile of the rPET scanner obtained from simulations of a low activity18F point source. PeneloPET results agree with those obtained with GATE within error bars exceptfor the energy window with the lowest energy threshold, for which GATE sensitivities are largerthan PeneloPET ones by about 5%. The error bars are taken as ± the standard error obtained fromfour runs of the simulations with different random seeds.
3.1. SUINSA rPET
rPET (SUINSA Medical Systems, Vaquero et al 2005) is a rotating scanner consisting of fourPMT detector modules, each coupled to a single layer array of 30 × 30 MLS (Pepin et al2001) crystals. Pitch size is 1.6 mm, individual crystal length is 12 mm and the ring diameteris 16 cm. A point source has been simulated at several axial positions along the axis of theFOV. Figure 6 shows the ratio of detected coincidences to annihilations at the source for threedifferent energy windows. Source activity was kept low enough so that dead time, random andpile-up effects could be considered negligible. The simulation rates, measured as the numberof positron (e+) annihilations simulated per second using an Intel Xeon X5472 3.00 GHzquad-core processor, were 75 000 e+ s−1 and 12 000 e+ s−1, for PeneloPET and GATE codes,respectively. In both cases, only annihilation photons of 511 keV were simulated, no angularrestrictions were imposed and neither secondary particles nor x-rays were considered. Thesimulation rate depends strongly on the geometry of the scanner, shielding and surroundingmaterials included in the simulation. A similar simulation of the same source done for theother scanners studied in this work obtained 12 000 e+ s−1 for ARGUS, 12 000 e+ s−1 forCLEARPET and 17 000 e+ s−1 for INVEON, a much lower simulation rate than the oneobtained for rPET.
Regarding the accuracy of the results, there are small quantitative differences (about 5%)between the sensitivity predictions in the case of the 100–700 keV energy window. For theGATE simulations, the GEANT4 standard electromagnetic (EM) model was chosen. ThreeEM models are available in GEANT4, and thus also in GATE: the standard one, the lowenergy one and the same PENELOPE model that we employ in PeneloPET. It has been foundin several works that these three models produce slightly different predictions (Poon andVerhaegen 2005). Some authors (Chen et al 2006) have suggested that the PENELOPE modelmay be more adequate for Compton interactions, the low-energy model for Rayleigh scattering

1734 S Espana et al
Figure 7. Comparison of real and simulated sinograms of a water-filled cylinder plus an off-centered rod with 18F (250 μCi) for the rPET scanner. Radial profiles at two different angularpositions are presented in the right panel with both log (bottom part of the figure) and linear verticalscales. The two arrows in the sinogram of the left panel indicate where the radial profiles shown inthe right panel were taken. Simulated and real line profiles are scaled to coincide at their maximumvalues.
and the standard EM model of GEANT4 for photoelectric absorption of photons. One mustbe aware that we simulate the interaction of annihilation photons not only with biologicaltissue, but also with detector materials, such as scintillator and shielding. Thus, Compton andphotoelectric absorption of photons are equally relevant for our simulations. In any case, thedifferences between these three models are not large, except for the lowest energy photons,which are of little relevance for the results of PET simulations.
Additionally, real and simulated sinograms from a mouse phantom acquisition werecompared. The real acquisition was performed at Hospital General Universitario GregorioMaranon, in Madrid. The mouse phantom was made of a rod filled with 18F, 1 cm off-centeredin a water cylinder of 2.5 cm of diameter and 6 cm in length. For this comparison we showthe radial profiles of coincidences for two different angles. The initial activity was 250 μCiand no energy window was applied. Figure 7 shows that there is good agreement between realand simulated data in both peak and background areas.
3.2. SUINSA ARGUS
The ARGUS small-animal PET scanner (Wang et al 2006) consists of 36 PMT detectormodules, each coupled to a dual layer array of 13 × 13 LYSO + GSO scintillation crystals.Each pixel crystal has a cross-section of 1.45 × 1.45 mm2 separated by a white reflector0.1 mm thick. The resulting pitch size is 1.55 mm and the length of the LYSO and GSO layersis 7 mm and 8 mm, respectively. The 36 modules are arranged in two rings of 18 moduleseach, with a diameter of 11.8 cm. All the measurements described in this section are takenfrom Wang et al (2006) except the one regarding the annulus phantom, which was obtained atHospital General Universitario Gregorio Maranon, in Madrid.10
10 The Argus scanner is described in Vaquero et al (2004). eXplore VISTA is the commercial name given by GEHCto the original SUINSA product, the ARGUS PET. These two systems are identical except for the identification logoson the system cover. The measurement mentioned here has been done using an ARGUS SUINSA system.

PeneloPET, a Monte Carlo PET simulation tool based on PENELOPE 1735
(a) (b)
(c)
Figure 8. Comparison of the profiles of coincidence counts for crystals in the same axial rowfrom a 500 μCi 68Ge annulus. Different energy windows are shown: (a) 100–700 keV, (b) 250–700 keV and (c) 400–700 keV. Real (thick solid lines) and simulated (thin solid line) results fromPeneloPET are presented. Also, for the simulations, contribution of true, random and scattercounts, as well as counts that are affected by detector pile-up are displayed separately. The smallerror bars (visible only in the simulated profiles) indicate the expected statistical error. Real andsimulated line profiles are scaled to coincide at their maximum values.
For the first measurement, an annulus phantom made of epoxy containing 68Ge wasacquired. This annulus is normally employed to perform normalizations and calibrations ofthe scanner. It has an inner diameter of 6.92 cm, its walls are 2 mm thick and its total activityis about 500 μCi. Acquisitions were obtained with three energy windows (100–700 keV,250–700 keV and 400–700 keV). Figure 811 shows a comparison of count profiles resultingfrom all coincidence events coming from crystals in the same axial row, with the ones fromthe simulation. The overall shape of these profiles is well reproduced by the simulations.The discontinuity at the center of the profile is due to the gap between the two detector rings.Both real acquisition and simulations have a very large number of events, so that the statisticalerror is negligible. The ripple observed in the real profiles may be due to a non-uniform axialdistribution of shielding and other scanner materials, combined with edge effects of the PMTs,and with the unavoidable (although small) differences in the positions of the real crystals withrespect to their ideal locations. In the simulation, ideal geometries for the crystal arrays, PMTsand photocathodes, as well as shielding, have been employed. It is thus reasonable to expecta more uniform axial structure for the profile of simulated counts than that exhibited by an
11 In this work the term ‘statistical error’ denotes the variation in the measured magnitude induced by statisticalfluctuations, that is, a variation of ±√
N , with N being the number of counts accumulated for said measurement.

1736 S Espana et al
Figure 9. Axial sensitivity profile of the ARGUS scanner measured with a 18F point source shiftedin small steps along the central axis of the FOV, compared to PeneloPET simulations. Data arefrom Wang et al (2006). The simulations include inert material and shielding.
Table 1. Scatter fraction for the ARGUS scanner.
Mouse phantom Rat phantomEnergy window(keV) Real Simulated Real Simulated
100–700 33% 29% 48% 42%250–700 27% 27% 37% 38%400–700 19% 20% 29% 29%
actual machine. In any case, this ripple observed in the real acquisitions is about 5% and thedifference observed with the simulated results is of the same order.
We can notice a change in shape of the axial profiles according to the energy windowselected. From the simulations we can obtain separated contributions to the axial countprofiles from true, random and scatter counts, as well as from counts that are affected bypile-up. According to the simulations, we can attribute the largest contribution to this changein shape of the profiles to scatter counts. Further, there is a noticeable difference in the fractionof scatter coincidences registered with the 100–700 keV energy window, as compared to thenarrowest one (400–700 keV).
Table 1 presents the results for the scatter fraction, real and simulated with PeneloPET.Real values were taken from Wang et al (2006). Differences between real and simulatedvalues are below 5% for both the 250–700 and 400–700 keV energy windows. For the 100–700 keV energy window, the simulated values are systematically lower (by about 10%) thanthe real ones, most likely due to the fact that the simulations did not include secondary particleemissions, such as x-rays, that can contribute at low energies. The expected relative statisticalerror obtained from the simulations is ±5%.
Figure 9 shows the comparison of simulated axial sensitivity profiles against real datafrom the ARGUS scanner. The agreement of the simulations with the data is very good atthe center of the scanner (they agree within 5%), while there are somewhat larger differences(about 10%) in the relative minima of the sensitivity profile corresponding to the centers of

PeneloPET, a Monte Carlo PET simulation tool based on PENELOPE 1737
Figure 10. Radial resolution of the ARGUS scanner measured with a 22Na point source placed atdifferent radial positions in the central axial slice.
Table 2. Peaks of the NECR curve of a rat-size phantom for three energy windows, for the ARGUSscanner.
NECR (kcps) [activity (kBq/cc)] 100–700 keV 250–700 keV 400–700 keV
Real 120 [92] 140 [78] 145 [43]Simulated 125 [86] 130 [74] 150 [40]
each ring. Outside these two minima, the differences between simulations and real data arebelow 5%. Overall, the agreement between simulation and data is good.
Figure 10 presents a comparison of the radial resolution measured for a 22Na point sourceplaced at different radial distances from the scanner axis, for real and simulated data. Theresolution obtained from the simulation is in very good agreement with the experimental dataat the center of the FOV (CFOV), while for larger offsets small deviations (of no more than7%) can be observed.
Finally, simulations to obtain the noise equivalent count rate (NECR) for a rat-sizephantom have been performed. NECR peak values obtained from real data were taken fromWang et al (2006). NECR data simulated from PeneloPET were analyzed to find the positionof the NECR peak. Agreement of simulated and real NECR values simulated is good, asshown in table 2. Due to the fact that a finite number of steps are employed to find themaximum of the NECR curves, we estimate that these figures are affected by a relative errorlower than 5% in both position and value of the peak.
3.3. Raytest CLEARPET
The CLEARPET (Heinrichs et al 2003) scanner consists of 80 PMT detector modules, eachcoupled to a dual layer array of 8 × 8 LYSO + LuYAP scintillation crystals. Each pixel crystalhas a cross-section of 2 × 2 mm2 and there is a 0.3 mm thick reflector between them. Pitchsize is 2.3 mm and the length of both LYSO and LuYAP layers is 1 cm. The 80 modulesare arranged in four rings of 20 modules with a diameter of 13.5 cm. Every four contiguous

1738 S Espana et al
Figure 11. Axial sensitivity profile for the CLEARPET scanner. The figure shows measurementsand results from simulations for three different scanner configurations (12, 16, and 20 detectors perring) with a detector diameter of 13.5 cm. Real data are taken from Sempere Roldan et al (2007)and are represented with points.
modules in the axial direction form a cassette. Every second cassette is alternatively shiftedby ±9.2 mm in the axial direction.
The axial sensitivity profile for the CLEARPET scanner was simulated for configurationswith different number of detectors. Simulations of a 22Na point source placed at many positionsalong the axial direction are compared to real data taken for 18 positions. The sensitivitywas calculated as the ratio of the number of coincidence events measured inside the energywindow of 250–750 keV and the total number of decays occurred during the acquisition time.Figure 11 shows the results of this comparison. There is good agreement in the central regionof the axial profile, where simulation and data are within few percent of each other, and aworse agreement toward the edges of the axial FOV. This is most likely due to the fact that inthis case the simulation did not include any shielding materials. The shielding materials canincrease the number of events due to photons that first interact in the shielding and are thenback scattered into a detector.
3.4. Siemens INVEON
The INVEON (McFarland et al 2007) consists of 64 PMT detector modules, each coupledto a single layer array of 20 × 20 LSO scintillation crystals. Each crystal has a section of1.55 × 1.55 mm2 and are separated with a 0.05 mm thick reflector. Pitch size is 1.6 mm andthe length of LSO crystals is 1 cm. The 64 modules are arranged in four rings of 16 moduleswith a diameter of 16.1 cm.
An estimation of sensitivity of this scanner was made by means of a line source 14 cm longfilled with 1.3 MBq of 18F placed along the central axis of the scanner. The simulation includedall the materials in the line source in order to take into account attenuation effects at the source.The sensitivity obtained for the line source activity was converted to equivalent sensitivity fora centered point source, as explained in Kemp et al (2006). The sensitivity estimated fromreal measurements by Kemp et al (2006) was 52.0 cps kBq−1. The sensitivity estimated fromthe simulations was 52.7 cps kBq−1, in good agreement with the real measurements.
PeneloPET, a Monte Carlo PET simulation tool based on PENELOPE 1739
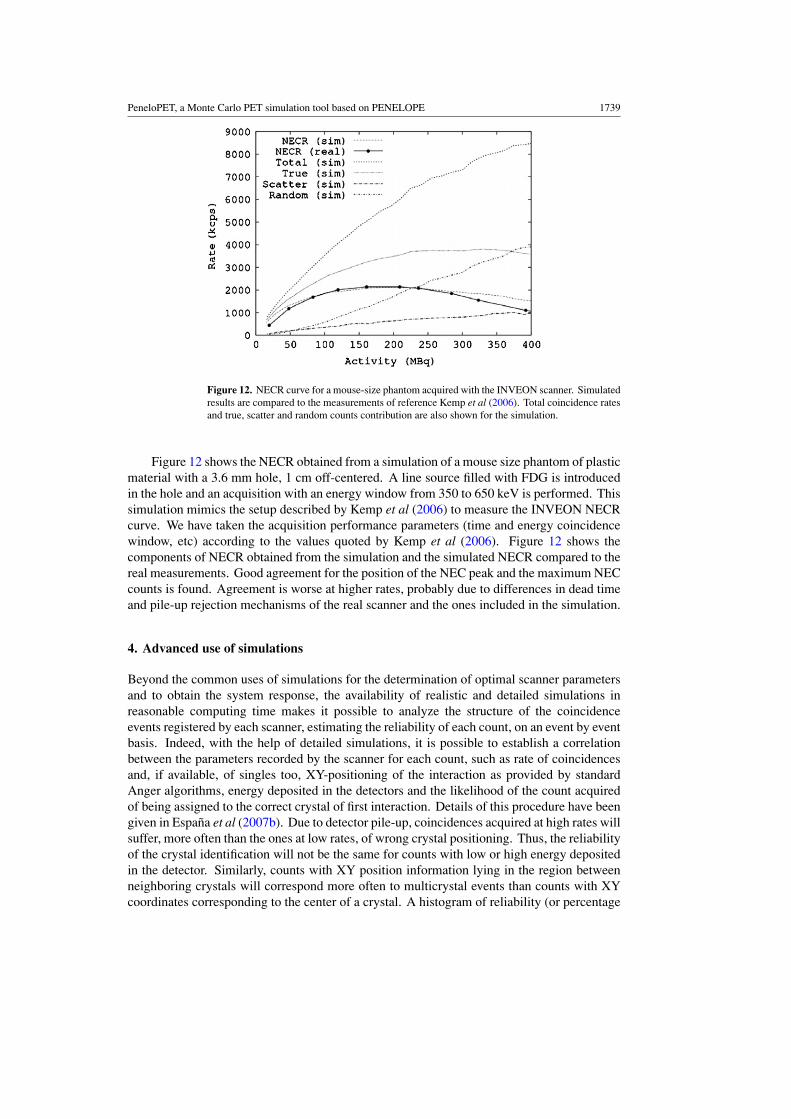
Figure 12. NECR curve for a mouse-size phantom acquired with the INVEON scanner. Simulatedresults are compared to the measurements of reference Kemp et al (2006). Total coincidence ratesand true, scatter and random counts contribution are also shown for the simulation.
Figure 12 shows the NECR obtained from a simulation of a mouse size phantom of plasticmaterial with a 3.6 mm hole, 1 cm off-centered. A line source filled with FDG is introducedin the hole and an acquisition with an energy window from 350 to 650 keV is performed. Thissimulation mimics the setup described by Kemp et al (2006) to measure the INVEON NECRcurve. We have taken the acquisition performance parameters (time and energy coincidencewindow, etc) according to the values quoted by Kemp et al (2006). Figure 12 shows thecomponents of NECR obtained from the simulation and the simulated NECR compared to thereal measurements. Good agreement for the position of the NEC peak and the maximum NECcounts is found. Agreement is worse at higher rates, probably due to differences in dead timeand pile-up rejection mechanisms of the real scanner and the ones included in the simulation.
4. Advanced use of simulations
Beyond the common uses of simulations for the determination of optimal scanner parametersand to obtain the system response, the availability of realistic and detailed simulations inreasonable computing time makes it possible to analyze the structure of the coincidenceevents registered by each scanner, estimating the reliability of each count, on an event by eventbasis. Indeed, with the help of detailed simulations, it is possible to establish a correlationbetween the parameters recorded by the scanner for each count, such as rate of coincidencesand, if available, of singles too, XY-positioning of the interaction as provided by standardAnger algorithms, energy deposited in the detectors and the likelihood of the count acquiredof being assigned to the correct crystal of first interaction. Details of this procedure have beengiven in Espana et al (2007b). Due to detector pile-up, coincidences acquired at high rates willsuffer, more often than the ones at low rates, of wrong crystal positioning. Thus, the reliabilityof the crystal identification will not be the same for counts with low or high energy depositedin the detector. Similarly, counts with XY position information lying in the region betweenneighboring crystals will correspond more often to multicrystal events than counts with XYcoordinates corresponding to the center of a crystal. A histogram of reliability (or percentage

1740 S Espana et al
Figure 13. Radial resolution versus absolute sensitivity at the CFOV (ACS) obtained from aPeneloPET simulation of the INVEON scanner (see the text). The curve spans different reliabilitythresholds for the counts included in the reconstruction.
of counts assigned to the crystal of first interaction) as a function of XY-positioninginformation, time difference of the event pairs, singles and coincidence rates, energy depositedin each detector and other variables recorded by the scanner, can be built from simulations.Advanced acquisition and reconstruction systems could decide to process (or not) each countdepending on the estimates of reliability. It could discard those counts whose reliability, forinstance, falls below a certain threshold. This implies a loss of sensitivity, but it increasesthe ratio of counts correctly assigned to the crystal of first interaction, thus yielding betterresolution. Simulations can be employed to produce diagrams of resolution versus sensitivityat the CFOV. Figure 13 shows a resolution versus sensitivity (the former estimated from FBPreconstructions of simulated acquisitions) curve for a point source in the center of the Inveonscanner. The curve is obtained changing the reliability threshold for the events accepted in thereconstruction. In one extreme, a very small threshold is employed so that essentially all eventsare accepted, in the high sensitivity (near 11%) end of the curve. In this case, simulationsshow that only 40% of the events are correctly assigned to the crystal of first interaction. Inthe other end of the curve, a very high reliability is required before accepting an event. Thistranslates into more than 95% of accepted events being correctly assigned to the crystal of firstinteraction. In this case, the resolution is much better, but at the expense of using less than30% of the counts. This causes the sensitivity to fall below 3%. The user could decide how toreconstruct a particular acquisition based on the resolution versus sensitivity trade-off of eachscanner.
5. Conclusions
In this work, we present PeneloPET, an easy-to-use package for PET simulations. For itsversatility, good simulation speed and easy-to-analyze outputs, PeneloPET is a useful toolfor scanner design, system response calculations, development of corrections methods andother applications. We have also compared simulations of PeneloPET to real measurementsfrom four different small-animal PET scanners. We have compared both integral or extensiveproperties of scanners, such as sensitivity, axial profile of counts, scatter fraction and NEC

PeneloPET, a Monte Carlo PET simulation tool based on PENELOPE 1741
rates, and intensive ones, namely sinogram profiles and spatial resolution, finding in generalgood agreement between simulated and real data. Simulations with PeneloPET differed fromthose of GATE by only a few percent and were considerably faster.
Acknowledgments
We acknowledge support from MEC (FPA2007-07393), CDTEAM (CENIT-Ingenio 2010)Ministerio de Industria, Spain, CPAN (Consolider-Ingenio 2010) CSPD-2007-00042 projectsand the RECAVA-RETIC network. Part of the computations of this work were done at the‘High Capacity Cluster for Physical Techniques’ of the Faculty for Physical Sciences of theUCM, funded in part by the UE under the FEDER program and in part by UCM. J L Herraizand E Vicente acknowledge support from UCM-FPU and CSIC-JAE pre-doctoral fellowships,respectively.
References
Agostinelli S 2003 GEANT4—a simulation toolkit Nucl. Instrum. Methods Phys. Res. A 506 250–303Ay M R and Zaidi H 2006 Assessment of errors caused by X-ray scatter and use of contrast medium when using
CT-based attenuation correction in PET Eur. J. Nucl. Med. Mol. Imaging 33 1301–13Baro J, Sempau J, Fernandez-Varea J M and Salvat F 1995 PENELOPE: an algorithm for Monte Carlo simulation
of the penetration and energy loss of electrons and positrons in matter Nucl. Instrum. Methods Phys. Res.B 100 31–46
Blake E, Pressley D R, Lenox M, Swann B K, Newport D F and Siegel S 2006 A data acquisition, event processingand coincidence determination module for a distributed parallel processing architecture for PET and SPECTimaging IEEE NSS MIC Conf. Rec. pp 2439–42
Braem A et al 2004 Feasibility of a novel design of high resolution parallax-free Compton enhanced PET scannerdedicated to brain research Phys. Med. Biol. 49 2547–62
Briesmeister J F 1993 MCNP 4. A Monte Carlo N-particle transport system Report LA-12625 Los Alamos NationalLaboratory
Brun B and Rademakers F 1997 ROOT—an object oriented data analysis framework Nucl. Instrum. Methods Phys.Res. A 389 81–6
Buvat I and Lazaro D 2006 Monte Carlo simulations in emission tomography and GATE: an overview Nucl. Instrum.Methods Phys. Res. A 569 323–29
Chen Y, Liu B, O’connor M, Didier C S and Glick S J 2006 Comparison of scatter/primary measurements withGATE simulations for X-ray spectra in cone beam CT mammography IEEE NSS MIC Conf. Rec. pp 3909–14
Espana S, Herraiz J L, Vicente E, Desco M, Vaquero J J and Udias J M 2007a Validation of PeneloPET against twosmall animal PET scanners IEEE NSS MIC Conf. Rec. pp 3640–43
Espana S, Herraiz J L, Vicente E, Herranz E, Vaquero J J, Desco M and Udias J M 2007b Improved image reconstructionin small animal PET using a priori estimates of single-pixel events IEEE NSS MIC Conf. Rec. pp 3876–80
Harrison R L, Dhavala S, Kumar P N and Shao Y 2003 Acceleration of SimSET photon history generator module ofa public domain simulation system for emission tomography IEEE NSS MIC Conf. Rec. pp 1835–8
Harrison R L, Kaplan M S, Vannoy S D and Lewellen T K 1999 Positron range and coincidence non-collinearity inSimSET IEEE NSS MIC Conf. Rec. pp 1265–8
Heinrichs U, Pietrzyk U and Ziemons K 2003 Design optimization of the PMT-ClearPET prototypes based onsimulation studies with GEANT3 IEEE Trans. Nucl. Sci. 50 1428–32
Herraiz J L, Espana S, Vaquero J J, Desco M and Udias J M 2006 FIRST: fast iterative reconstruction software for(PET) tomography Phys. Med. Biol. 51 4547–65
Jan S, Santin G, Strul D, Staelens S, Assie K, Autret D and Avner S 2004 GATE: a simulation toolkit for PET andSPECT Phys. Med. Biol. 49 4543–61
Kawrakow I and Bielajew A F 1998 On the condensed history technique for electron transport Nucl. Instrum. MethodsPhys. Res. B 142 253–80
Kemp B J, Lenox M, Newport D F, Siegel S and Nutt R 2006 Performance measurements of the Siemens Inveonsmall animal PET scanner IEEE NSS MIC Conf. poster presentation
Levin C S, Dahlbom M and Hoffman E J 1995 A Monte Carlo correction for the effect of Compton scattering in 3-DPET brain imaging IEEE Trans. Nucl. Sci. 42 1181–5

1742 S Espana et al
Levin C S and Hoffman E J 1999 Calculation of positron range and its effect on the fundamental limit of positronemission tomography system spatial resolution Phys. Med. Biol. 44 781–99
McFarland A R, Siegel S, Newport D F, Mintzer R, Atkins B and Lenox M 2007 Continuously sampled digital pulseprocessing for Inveon small animal PET scanner IEEE NSS MIC Conf. Rec. pp 4262–5
Ortuno J E, Guerra-Gutierrez P, Rubio J L, Kontaxakis G and Santos A 2006 3D-OSEM iterative image reconstructionfor high-resolution PET using precalculated system matrix Nucl. Instrum. Methods Phys. Res. A 569 440–4
Ortuno J E, Vaquero J J, Kontaxakis G, Desco M and Santos A 2003 Preliminary studies on the design and simulationof high resolution small animal PET scanners with octagonal geometry IEEE NSS MIC Conf. Rec. pp 2053–8
Panettieri V, Wennberg B, Gagliardi G, Duch M A, Ginjaume M and Lax I 2007 SBRT of lung tumours: Monte Carlosimulation with PENELOPE of dose distributions including respiratory motion and comparison with differenttreatment planning systems Phys. Med. Biol. 52 4265–81
Pepin C M, Berard P and Lecomte R 2001 Comparison of LSO, LGSO and MLS scintillators IEEE NSS MIC Conf.Rec. pp 124–8
Poon E and Verhaegen F 2005 Accuracy of the photon and electron physics in GEANT4 for radiotherapy applicationsMed. Phys. 32 1696–711
Richardson J R and Kurie F N D 1936 The rediations emitted from artificially produced radioactive substances. II.The gamma-rays from several elements Phys. Rev. 50 999–1006
Salvat F, Fernandez-Varea J M and Sempau J 2003 PENELOPE—a code system for Monte Carlo simulation ofelectron and photon transport NEA-OCDE
Sempau J and Andreo P 2006 Configuration of the electron transport algorithm of PENELOPE to simulate ionchambers Phys. Med. Biol. 51 3533–48
Sempere Roldan P, Canadas M, Dietzel O, Pautrot C, Sarasola I and Wagner A 2007 Performance evaluation ofraytest ClearPET, a PET scanner for small and medium size animals IEEE NSS MIC Conf. Rec. pp 2859–64
Thomson C J, Moreno-Cantu J and Picard Y 1992 PETSIM: Monte Carlo simulation of all sensitivity and resolutionparameters of cylindrical positron imaging systems Phys. Med. Biol. 37 731–49
Torres-Espallardo I, Rafecas M, Spanoudaki V, Mcelroy D E and Ziegler S I 2008 Effect of inter-crystal scatter onestimation methods for random coincidences and subsequent correction Phys. Med. Biol. 53 2391–411
Vaquero J J, Lage E, Ricon L, Abella M, Vicente E and Desco M 2005 rPET detectors design and data processingIEEE NSS MIC Conf. Rec. pp 2885–9
Vaquero J J, Pascau J, Molins A, Arco J M and Desco M 2004 Performance characteristics of the ARGUS-drT smallanimal PET scanner: preliminary results IEEE NSS MIC Conf. (Rome, Italy, 2004) (Book of Abstracts) p 148
Vilches M, Garcıa-Pareja S, Guerrero R, Anguiano M and Lallena A M 2007 Monte Carlo simulation of the electrontransport through thin slabs: a comparative study of PENELOPE, GEANT3, GEANT4, EGSnrc and MCNPXNucl. Instrum. Methods Phys. Res. B 254 219–30
Wang Y, Seidel J, Tsui B M W, Vaquero J J and Pomper M G 2006 Performance evaluation of the GE healthcareeXplore VISTA dual-ring small-animal PET scanner J. Nucl. Med. 47 1891–900
Zaidi H 2000 Comparative evaluation of scatter correction techniques in 3D positron emission tomography Eur. J.Nucl. Med. Mol. Imaging 27 1813–26
Zaidi H, Labbe C and Morel C 1998 Implementation of an environment for Monte Carlo simulation of fully 3-Dpositron tomography on a high-performance parallel platform Parallel Comput. 24 1523–6


