
PEMBUATAN, PEMBINAAN, PERLOMBONGAN & PENGKUARIAN, ELEKTRIK ... · ELEKTRIK DAN INDEKS PENGELUARAN...
42
PEMBUATAN, PEMBINAAN, PERLOMBONGAN & PENGKUARIAN, ELEKTRIK DAN INDEKS PENGELUARAN PERINDUSTRIAN MANUFACTURING, CONSTRUCTION, MINING & QUARRYING, ELECTRICITY AND INDEX OF INDUSTRIAL PRODUCTION
Transcript of PEMBUATAN, PEMBINAAN, PERLOMBONGAN & PENGKUARIAN, ELEKTRIK ... · ELEKTRIK DAN INDEKS PENGELUARAN...

PEMBUATAN, PEMBINAAN, PERLOMBONGAN & PENGKUARIAN,
ELEKTRIK DAN INDEKSPENGELUARAN PERINDUSTRIAN
MANUFACTURING, CONSTRUCTION, MINING & QUARRYING, ELECTRICITY
AND INDEX OF INDUSTRIALPRODUCTION
juta hektarmillion hectare

Industri Pembinaan 2012 berbanding dengan Banci 2010
Construction Industry 2012 compared with 2010 Census
+15.9%
+5.5%
Nilai DitambahValue Added
Bilangan PekerjaNumber of Employees
Gaji dan upah yang dibayarSalaries and wages paid RM22,434 juta
million
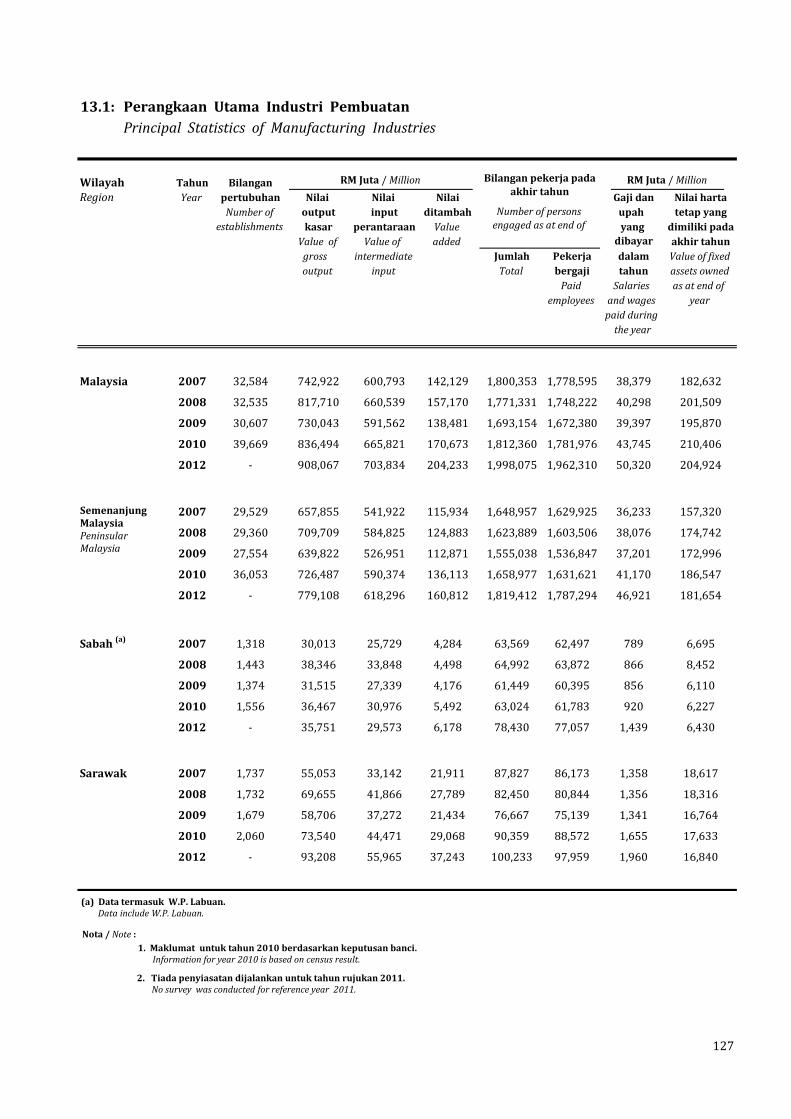
13.1: Perangkaan Utama Industri Pembuatan Principal Statistics of Manufacturing Industries
Wilayah Tahun BilanganRegion Year pertubuhan Nilai Nilai Nilai Gaji dan Nilai harta
Number of output input ditambah upah tetap yangestablishments kasar perantaraan Value yang dimiliki pada
Value of Value of added dibayar akhir tahungross intermediate Jumlah Pekerja dalam Value of fixedoutput input Total bergaji tahun assets owned
Paid Salaries as at end of employees and wages year
paid during the year
Malaysia 2007 32,584 742,922 600,793 142,129 1,800,353 1,778,595 38,379 182,632
2008 32,535 817,710 660,539 157,170 1,771,331 1,748,222 40,298 201,509
2009 30,607 730,043 591,562 138,481 1,693,154 1,672,380 39,397 195,870
2010 39,669 836,494 665,821 170,673 1,812,360 1,781,976 43,745 210,406
2012 - 908,067 703,834 204,233 1,998,075 1,962,310 50,320 204,924
2007 29,529 657,855 541,922 115,934 1,648,957 1,629,925 36,233 157,320
2008 29,360 709,709 584,825 124,883 1,623,889 1,603,506 38,076 174,742
2009 27,554 639,822 526,951 112,871 1,555,038 1,536,847 37,201 172,996
2010 36,053 726,487 590,374 136,113 1,658,977 1,631,621 41,170 186,547
2012 - 779,108 618,296 160,812 1,819,412 1,787,294 46,921 181,654
Sabah (a) 2007 1,318 30,013 25,729 4,284 63,569 62,497 789 6,695
2008 1,443 38,346 33,848 4,498 64,992 63,872 866 8,452
2009 1,374 31,515 27,339 4,176 61,449 60,395 856 6,110
2010 1,556 36,467 30,976 5,492 63,024 61,783 920 6,227
2012 - 35,751 29,573 6,178 78,430 77,057 1,439 6,430
Sarawak 2007 1,737 55,053 33,142 21,911 87,827 86,173 1,358 18,617
2008 1,732 69,655 41,866 27,789 82,450 80,844 1,356 18,316
2009 1,679 58,706 37,272 21,434 76,667 75,139 1,341 16,764
2010 2,060 73,540 44,471 29,068 90,359 88,572 1,655 17,633
2012 - 93,208 55,965 37,243 100,233 97,959 1,960 16,840
127
RM Juta / Million RM Juta / MillionBilangan pekerja pada akhir tahun
Number of persons engaged as at end of
Semenanjung Malaysia Peninsular Malaysia
Nota / Note :
(a) Data termasuk W.P. Labuan. Data include W.P. Labuan.
2. Tiada penyiasatan dijalankan untuk tahun rujukan 2011. No survey was conducted for reference year 2011.
1. Maklumat untuk tahun 2010 berdasarkan keputusan banci. Information for year 2010 is based on census result.
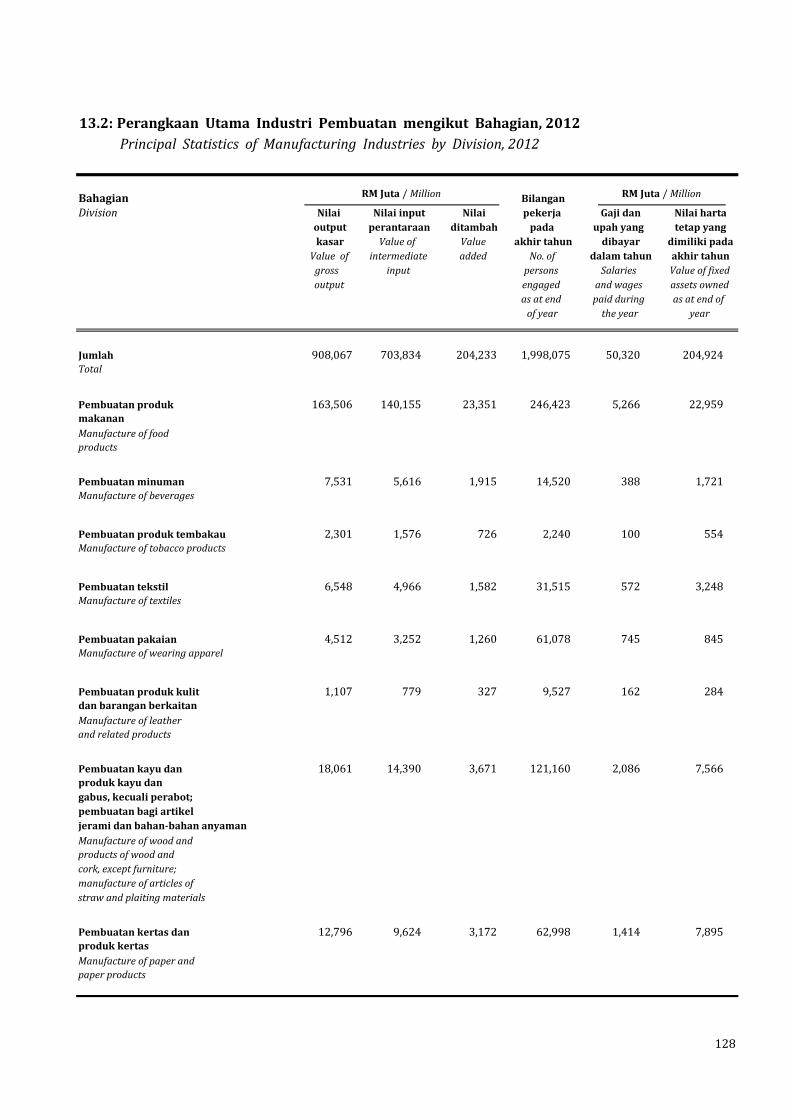
13.2: Perangkaan Utama Industri Pembuatan mengikut Bahagian, 2012 Principal Statistics of Manufacturing Industries by Division, 2012
Bahagian BilanganDivision Nilai Nilai input Nilai pekerja Gaji dan Nilai harta
output perantaraan ditambah pada upah yang tetap yangkasar Value of Value akhir tahun dibayar dimiliki pada
Value of intermediate added No. of dalam tahun akhir tahungross input persons Salaries Value of fixedoutput engaged and wages assets owned
as at end paid during as at end of of year the year year
Jumlah 908,067 703,834 204,233 1,998,075 50,320 204,924Total
Pembuatan produk 163,506 140,155 23,351 246,423 5,266 22,959makananManufacture of foodproducts
Pembuatan minuman 7,531 5,616 1,915 14,520 388 1,721Manufacture of beverages
Pembuatan produk tembakau 2,301 1,576 726 2,240 100 554Manufacture of tobacco products
Pembuatan tekstil 6,548 4,966 1,582 31,515 572 3,248Manufacture of textiles
Pembuatan pakaian 4,512 3,252 1,260 61,078 745 845Manufacture of wearing apparel
Pembuatan produk kulit 1,107 779 327 9,527 162 284dan barangan berkaitan Manufacture of leatherand related products
Pembuatan kayu dan 18,061 14,390 3,671 121,160 2,086 7,566produk kayu dangabus, kecuali perabot;pembuatan bagi artikeljerami dan bahan-bahan anyamanManufacture of wood andproducts of wood andcork, except furniture;manufacture of articles ofstraw and plaiting materials
Pembuatan kertas dan 12,796 9,624 3,172 62,998 1,414 7,895produk kertasManufacture of paper andpaper products
128
RM Juta / Million RM Juta / Million
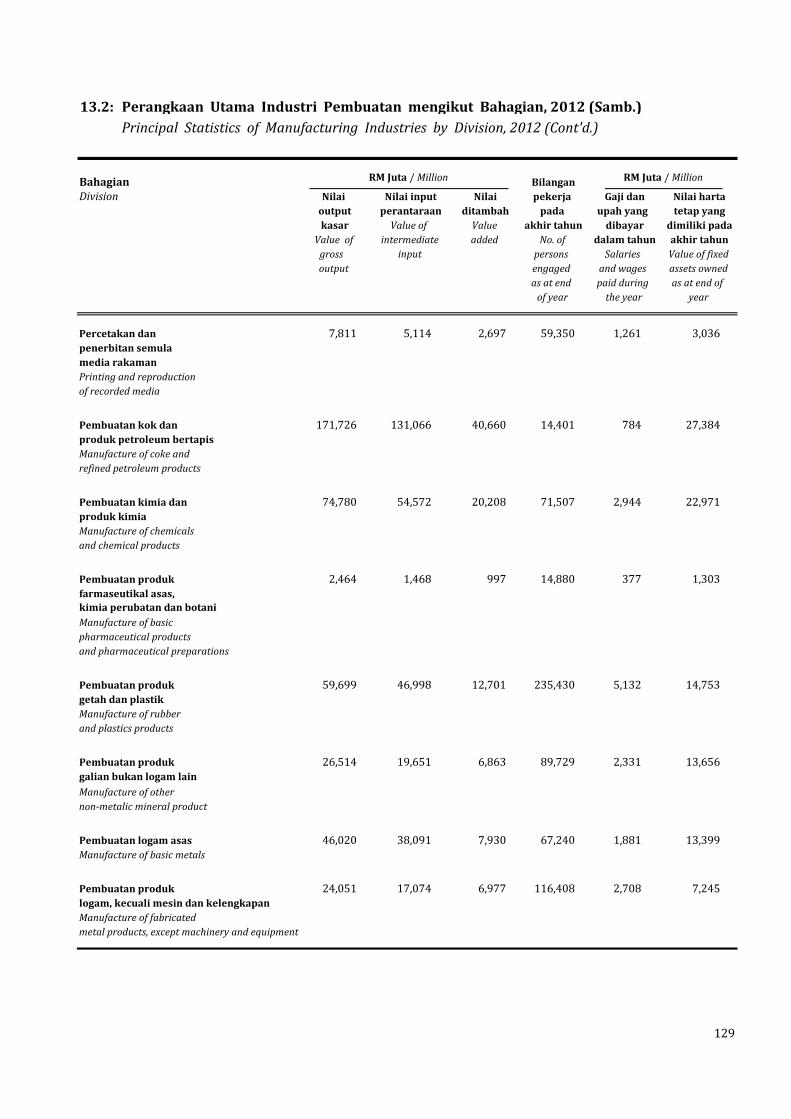
13.2: Perangkaan Utama Industri Pembuatan mengikut Bahagian, 2012 (Samb.) Principal Statistics of Manufacturing Industries by Division, 2012 (Cont'd.)
Bahagian BilanganDivision Nilai Nilai input Nilai pekerja Gaji dan Nilai harta
output perantaraan ditambah pada upah yang tetap yangkasar Value of Value akhir tahun dibayar dimiliki pada
Value of intermediate added No. of dalam tahun akhir tahungross input persons Salaries Value of fixedoutput engaged and wages assets owned
as at end paid during as at end of of year the year year
Percetakan dan 7,811 5,114 2,697 59,350 1,261 3,036penerbitan semulamedia rakamanPrinting and reproductionof recorded media
Pembuatan kok dan 171,726 131,066 40,660 14,401 784 27,384produk petroleum bertapisManufacture of coke andrefined petroleum products
Pembuatan kimia dan 74,780 54,572 20,208 71,507 2,944 22,971produk kimia Manufacture of chemicalsand chemical products
Pembuatan produk 2,464 1,468 997 14,880 377 1,303farmaseutikal asas,kimia perubatan dan botaniManufacture of basicpharmaceutical productsand pharmaceutical preparations
Pembuatan produk 59,699 46,998 12,701 235,430 5,132 14,753getah dan plastik Manufacture of rubberand plastics products
Pembuatan produk 26,514 19,651 6,863 89,729 2,331 13,656galian bukan logam lainManufacture of othernon-metalic mineral product
Pembuatan logam asas 46,020 38,091 7,930 67,240 1,881 13,399Manufacture of basic metals
Pembuatan produk 24,051 17,074 6,977 116,408 2,708 7,245logam, kecuali mesin dan kelengkapan Manufacture of fabricatedmetal products, except machinery and equipment
129
RM Juta / Million RM Juta / Million
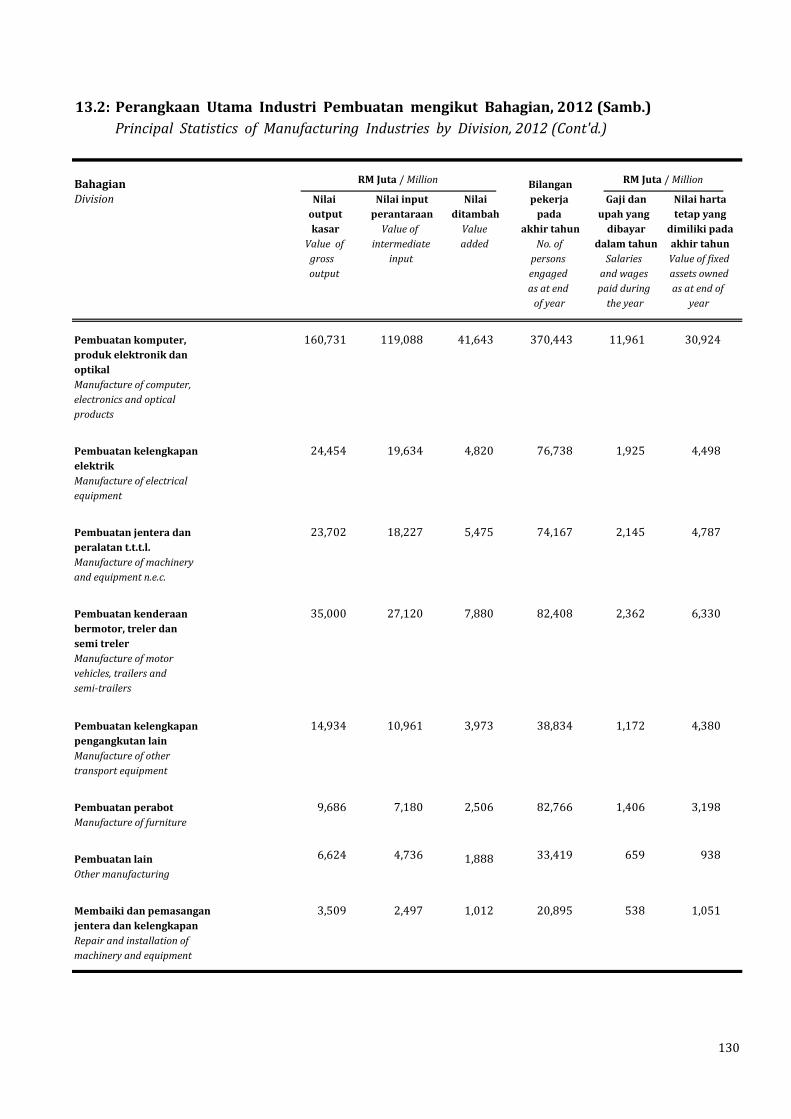
13.2: Perangkaan Utama Industri Pembuatan mengikut Bahagian, 2012 (Samb.) Principal Statistics of Manufacturing Industries by Division, 2012 (Cont'd.)
Bahagian BilanganDivision Nilai Nilai input Nilai pekerja Gaji dan Nilai harta
output perantaraan ditambah pada upah yang tetap yangkasar Value of Value akhir tahun dibayar dimiliki pada
Value of intermediate added No. of dalam tahun akhir tahungross input persons Salaries Value of fixedoutput engaged and wages assets owned
as at end paid during as at end of of year the year year
Pembuatan komputer, 160,731 119,088 41,643 370,443 11,961 30,924produk elektronik danoptikal Manufacture of computer,electronics and opticalproducts
Pembuatan kelengkapan 24,454 19,634 4,820 76,738 1,925 4,498elektrik Manufacture of electricalequipment
Pembuatan jentera dan 23,702 18,227 5,475 74,167 2,145 4,787peralatan t.t.t.l.Manufacture of machineryand equipment n.e.c.
Pembuatan kenderaan 35,000 27,120 7,880 82,408 2,362 6,330bermotor, treler dansemi treler Manufacture of motorvehicles, trailers andsemi-trailers
Pembuatan kelengkapan 14,934 10,961 3,973 38,834 1,172 4,380pengangkutan lain Manufacture of othertransport equipment
Pembuatan perabot 9,686 7,180 2,506 82,766 1,406 3,198Manufacture of furniture
Pembuatan lain 6,624 4,736 1,888 33,419 659 938Other manufacturing
Membaiki dan pemasangan 3,509 2,497 1,012 20,895 538 1,051jentera dan kelengkapanRepair and installation ofmachinery and equipment
130
RM Juta / Million RM Juta / Million
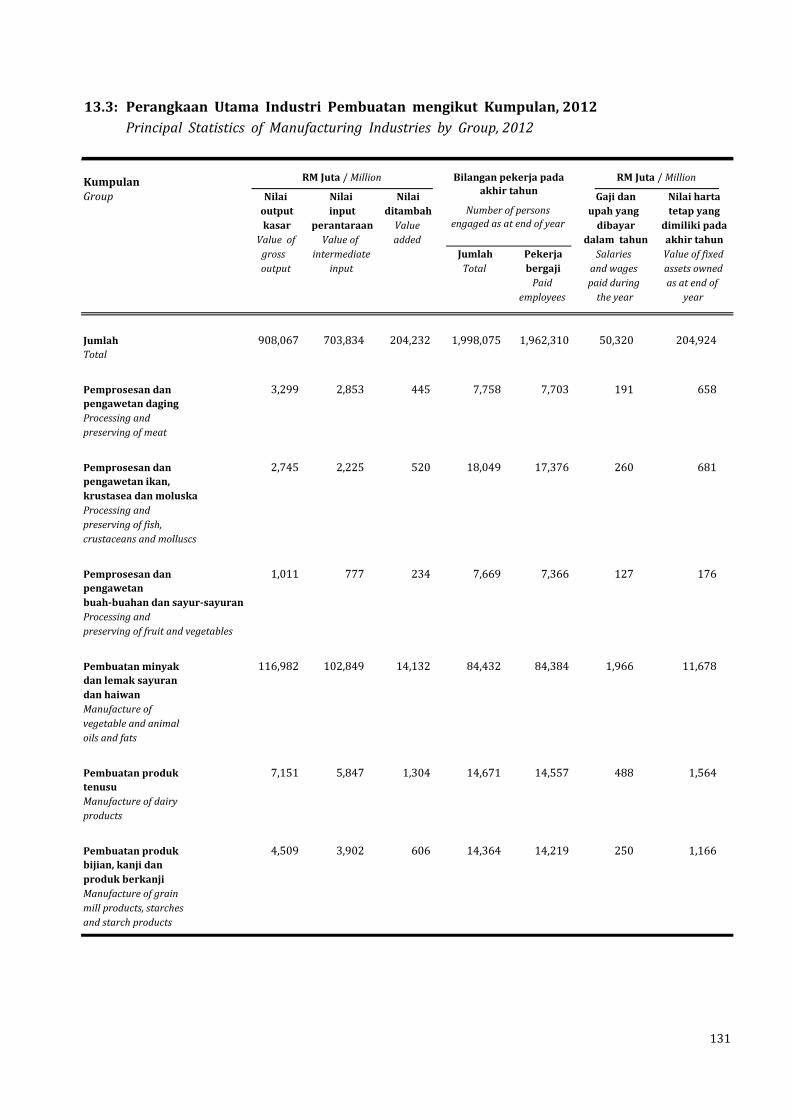
13.3: Perangkaan Utama Industri Pembuatan mengikut Kumpulan, 2012 Principal Statistics of Manufacturing Industries by Group, 2012
Kumpulan Group Nilai Nilai Nilai Gaji dan Nilai harta
output input ditambah upah yang tetap yangkasar perantaraan Value dibayar dimiliki pada
Value of Value of added dalam tahun akhir tahungross intermediate Jumlah Pekerja Salaries Value of fixedoutput input Total bergaji and wages assets owned
Paid paid during as at end of employees the year year
Jumlah 908,067 703,834 204,232 1,998,075 1,962,310 50,320 204,924Total
Pemprosesan dan 3,299 2,853 445 7,758 7,703 191 658pengawetan dagingProcessing andpreserving of meat
Pemprosesan dan 2,745 2,225 520 18,049 17,376 260 681pengawetan ikan,krustasea dan moluskaProcessing andpreserving of fish,crustaceans and molluscs
Pemprosesan dan 1,011 777 234 7,669 7,366 127 176pengawetanbuah-buahan dan sayur-sayuranProcessing andpreserving of fruit and vegetables
Pembuatan minyak 116,982 102,849 14,132 84,432 84,384 1,966 11,678dan lemak sayuran dan haiwanManufacture ofvegetable and animaloils and fats
Pembuatan produk 7,151 5,847 1,304 14,671 14,557 488 1,564tenusuManufacture of dairyproducts
Pembuatan produk 4,509 3,902 606 14,364 14,219 250 1,166bijian, kanji danproduk berkanjiManufacture of grainmill products, starchesand starch products
RM Juta / Million RM Juta / MillionBilangan pekerja pada akhir tahun
Number of persons engaged as at end of year
131

13.3: Perangkaan Utama Industri Pembuatan mengikut Kumpulan, 2012 (Samb.) Principal Statistics of Manufacturing Industries by Group, 2012 (Cont'd.)
Kumpulan Group Nilai Nilai Nilai Gaji dan Nilai harta
output input ditambah upah yang tetap yangkasar perantaraan Value dibayar dimiliki pada
Value of Value of added dalam tahun akhir tahungross intermediate Jumlah Pekerja Salaries Value of fixedoutput input Total bergaji and wages assets owned
Paid paid during as at end of employees the year year
Pembuatan produk 22,808 17,226 5,581 93,014 87,899 1,831 6,604makanan lainManufacture of otherfood products
Pembuatan makanan 5,002 4,474 528 6,466 6,463 153 433haiwan tersediaManufacture ofprepared animal feeds
Pembuatan minuman 7,531 5,616 1,915 14,520 14,249 388 1,721Manufacture ofbeverages
Pembuatan produk 2,301 1,576 726 2,240 2,204 100 554tembakauManufacture of tobaccoproducts
Pemintalan, 4,405 3,366 1,039 16,161 15,838 309 2,197penenunan danpenyiapan tekstilSpinning, weaving andfinishing of textiles
Pembuatan tekstil lain 2,144 1,600 544 15,354 14,596 263 1,051Manufacture of othertextiles
Pembuatan pakaian, 4,393 3,157 1,236 60,009 49,531 730 820kecuali pakaian berbuluManufacture of wearingapparel, except fur apparel
Pembuatan artikel bulu 16 14 2 258 254 2 2Manufacture of articles of fur
Pembuatan pakaian 103 80 22 811 795 14 23yang dikait dan dikrusyeManufacture of knittedand crocheted apparel
Bilangan pekerja pada akhir tahun
132
RM Juta / Million RM Juta / Million
Number of persons engaged as at end of year

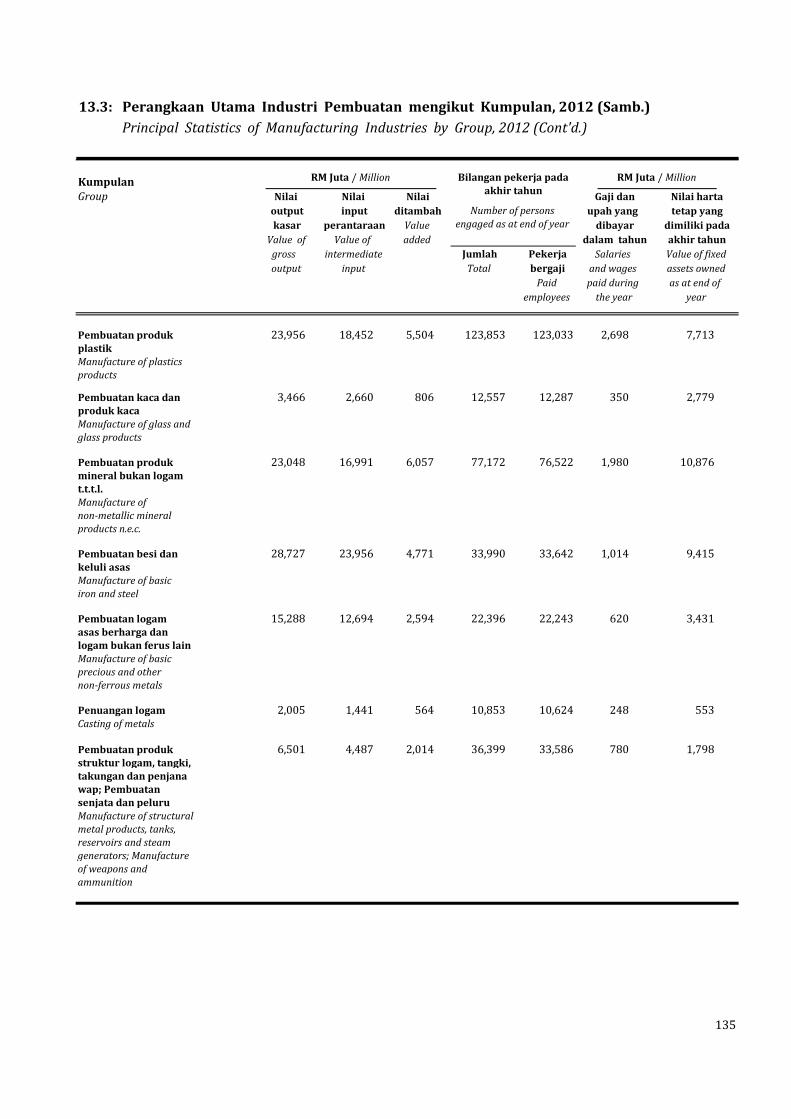
13.3: Perangkaan Utama Industri Pembuatan mengikut Kumpulan, 2012 (Samb.) Principal Statistics of Manufacturing Industries by Group, 2012 (Cont'd.)
Kumpulan Group Nilai Nilai Nilai Gaji dan Nilai harta
output input ditambah upah yang tetap yangkasar perantaraan Value dibayar dimiliki pada
Value of Value of added dalam tahun akhir tahungross intermediate Jumlah Pekerja Salaries Value of fixedoutput input Total bergaji and wages assets owned
Paid paid during as at end of employees the year year
Penyamakan dan 341 228 113 3,313 3,219 54 128pembersihan kulit;pembuatan bagasi,beg tangan, pelanadan abah-abah;pembersihan danpewarnaan buluTanning and dressingof leather; manufactureof luggage, handbags,saddlery and harness;dressing and dyeing of fur
Pembuatan kasut 766 551 214 6,214 5,926 108 155Manufacture of footwear
Pengilangan dan 5,167 4,214 953 41,740 41,404 709 1,677pengetaman kayuSawmilling and planningof wood
Pembuatan produk 12,894 10,176 2,718 79,420 78,686 1,377 5,889daripada kayu, gabus,jerami dan bahanjalinan lainManufacture of productsof wood, cork, straw andplaiting materials
Pembuatan kertas dan 12,796 9,624 3,172 62,998 62,672 1,414 7,895produk kertasManufacture of paperand paper products
Percetakan dan aktiviti 7,800 5,106 2,693 59,173 55,944 1,257 3,030perkhidmatanberkaitan percetakanPrinting and serviceactivities related toprinting
Bilangan pekerja pada akhir tahun
133
RM Juta / Million RM Juta / Million
Number of persons engaged as at end of year

13.3: Perangkaan Utama Industri Pembuatan mengikut Kumpulan, 2012 (Samb.) Principal Statistics of Manufacturing Industries by Group, 2012 (Cont'd.)
Kumpulan Group Nilai Nilai Nilai Gaji dan Nilai harta
output input ditambah upah yang tetap yangkasar perantaraan Value dibayar dimiliki pada
Value of Value of added dalam tahun akhir tahungross intermediate Jumlah Pekerja Salaries Value of fixedoutput input Total bergaji and wages assets owned
Paid paid during as at end of employees the year year
Penerbitan semula 12 8 4 177 177 3 6media rakamanReproduction ofrecorded media
Pembuatan produk 171,726 131,066 40,660 14,401 14,401 784 27,384petroleum bertapisManufacture of refinedpetroleum products
Pembuatan kimia asas, 59,990 43,348 16,642 38,293 38,230 1,837 19,732baja dan sebatiannitrogen, plastik dangetah sintetik dalambentuk primerManufacture of basicchemicals, fertilizer andnitrogen compounds,plastic and syntheticrubber in primary forms
Pembuatan produk 13,951 10,593 3,358 32,591 32,377 1,080 2,928kimia lainManufacture of otherchemical products
Pembuatan serat 839 632 207 623 623 28 312buatan manusiaManufacture ofman-made fibres
Pembuatan produk 2,464 1,468 997 14,880 14,804 377 1,303farmaseutikal, kimiaperubatan dan botaniManufacture ofpharmaceuticals,medicinal chemical andbotanical products
Pembuatan produk getah 35,743 28,545 7,197 111,577 111,454 2,434 7,040Manufacture of rubber products
Bilangan pekerja pada akhir tahun
134
RM Juta / Million RM Juta / Million
Number of persons engaged as at end of year
13.3: Perangkaan Utama Industri Pembuatan mengikut Kumpulan, 2012 (Samb.) Principal Statistics of Manufacturing Industries by Group, 2012 (Cont'd.)
Kumpulan Group Nilai Nilai Nilai Gaji dan Nilai harta
output input ditambah upah yang tetap yangkasar perantaraan Value dibayar dimiliki pada
Value of Value of added dalam tahun akhir tahungross intermediate Jumlah Pekerja Salaries Value of fixedoutput input Total bergaji and wages assets owned
Paid paid during as at end of employees the year year
Pembuatan produk 23,956 18,452 5,504 123,853 123,033 2,698 7,713plastikManufacture of plasticsproducts
Pembuatan kaca dan 3,466 2,660 806 12,557 12,287 350 2,779produk kacaManufacture of glass andglass products
Pembuatan produk 23,048 16,991 6,057 77,172 76,522 1,980 10,876mineral bukan logamt.t.t.l.Manufacture ofnon-metallic mineralproducts n.e.c.
Pembuatan besi dan 28,727 23,956 4,771 33,990 33,642 1,014 9,415keluli asasManufacture of basiciron and steel
Pembuatan logam 15,288 12,694 2,594 22,396 22,243 620 3,431asas berharga danlogam bukan ferus lainManufacture of basicprecious and othernon-ferrous metals
Penuangan logam 2,005 1,441 564 10,853 10,624 248 553Casting of metals
Pembuatan produk 6,501 4,487 2,014 36,399 33,586 780 1,798struktur logam, tangki,takungan dan penjanawap; Pembuatansenjata dan peluruManufacture of structuralmetal products, tanks,reservoirs and steamgenerators; Manufactureof weapons andammunition
Bilangan pekerja pada akhir tahun
135
RM Juta / Million RM Juta / Million
Number of persons engaged as at end of year

13.3: Perangkaan Utama Industri Pembuatan mengikut Kumpulan, 2012 (Samb.) Principal Statistics of Manufacturing Industries by Group, 2012 (Cont'd.)
Kumpulan Group Nilai Nilai Nilai Gaji dan Nilai harta
output input ditambah upah yang tetap yangkasar perantaraan Value dibayar dimiliki pada
Value of Value of added dalam tahun akhir tahungross intermediate Jumlah Pekerja Salaries Value of fixedoutput input Total bergaji and wages assets owned
Paid paid during as at end of employees the year year
Pembuatan lain-lain 17,550 12,588 4,962 80,009 78,758 1,929 5,446produk yang direkadaripada logam;aktiviti perkhidmatankerja logamManufacture of otherfabricated metalproducts; metal workingservice activities
Pembuatan 83,339 59,302 24,037 199,238 199,206 6,874 20,816komponen danpapan elektronikManufacture ofelectronic componentsand boards
Pembuatan komputer 32,827 24,556 8,271 72,567 72,566 1,802 5,109dan kelengkapanperantiManufacture ofcomputers andperipheral equipment
Pembuatan peralatan 10,338 7,965 2,373 24,330 24,327 745 550komunikasiManufacture ofcommunicationequipment
Pembuatan elektronik 26,832 21,637 5,195 38,753 38,753 1,671 2,350penggunaManufacture ofconsumer electronics
Bilangan pekerja pada akhir tahun
136
RM Juta / Million RM Juta / Million
Number of persons engaged as at end of year

13.3: Perangkaan Utama Industri Pembuatan mengikut Kumpulan, 2012 (Samb.) Principal Statistics of Manufacturing Industries by Group, 2012 (Cont'd.)
Kumpulan Group Nilai Nilai Nilai Gaji dan Nilai harta
output input ditambah upah yang tetap yangkasar perantaraan Value dibayar dimiliki pada
Value of Value of added dalam tahun akhir tahungross intermediate Jumlah Pekerja Salaries Value of fixedoutput input Total bergaji and wages assets owned
Paid paid during as at end of employees the year year
Pembuatan 2,721 2,128 594 12,053 12,050 295 805kelengkapanmengukur, menguji,mengemudi (memanduarah) dan kawalan;jam tangan dan jamManufacture ofmeasuring, testing,navigating and controlequipment; watchesand clocks
Pembuatan peralatan 1,694 922 772 10,299 10,297 297 802penyinaran,perubatan elektrodan elektroterapeutikManufacture ofirradiation,electro medical andelectrotherapeuticequipment
Pembuatan peralatan 2,765 2,400 365 12,390 12,388 244 372optikal dan alatanfotografiManufacture of opticalinstruments andphotographic equipment
Pembuatan media 215 179 36 813 813 32 121magnetik dan optikalManufacture of magneticand optical media
Bilangan pekerja pada akhir tahun
137
RM Juta / Million RM Juta / Million
Number of persons engaged as at end of year

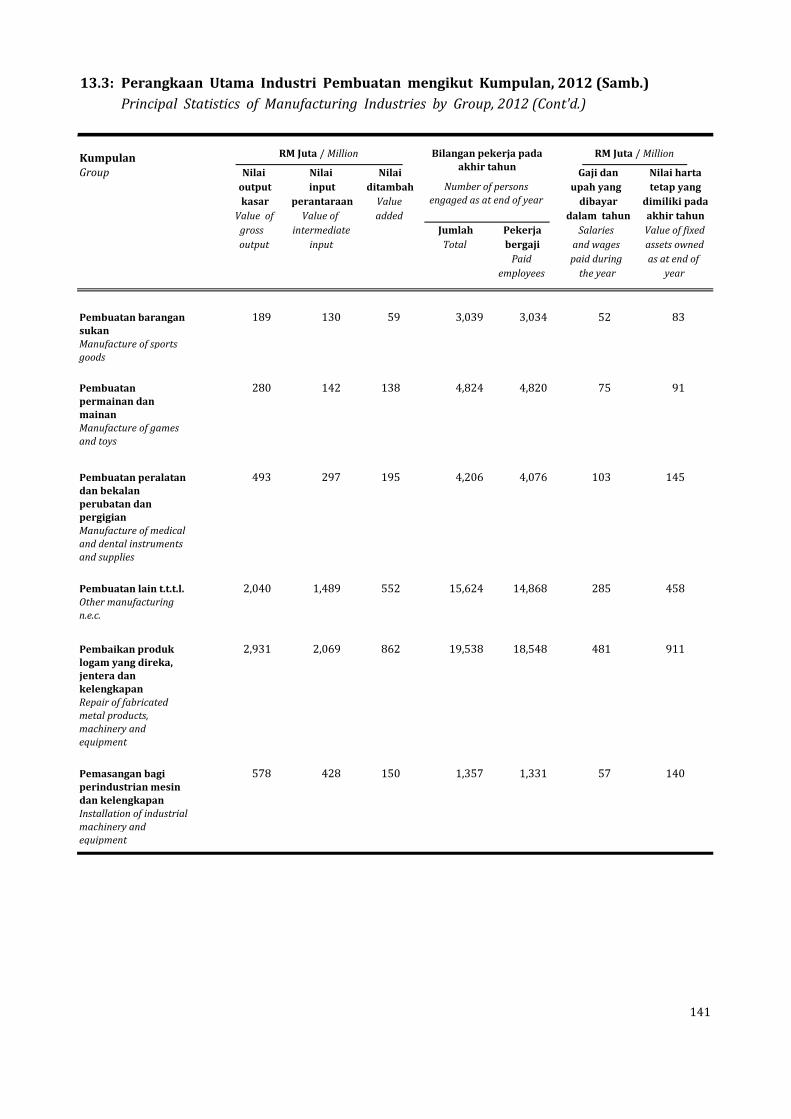
13.3: Perangkaan Utama Industri Pembuatan mengikut Kumpulan, 2012 (Samb.) Principal Statistics of Manufacturing Industries by Group, 2012 (Cont'd.)
Kumpulan Group Nilai Nilai Nilai Gaji dan Nilai harta
output input ditambah upah yang tetap yangkasar perantaraan Value dibayar dimiliki pada
Value of Value of added dalam tahun akhir tahungross intermediate Jumlah Pekerja Salaries Value of fixedoutput input Total bergaji and wages assets owned
Paid paid during as at end of employees the year year
Pembuatan motor 7,382 5,852 1,529 29,576 29,510 709 1,442elektrik, penjana,transformer danperkakasanpengagihan danpengawalan elektrikManufacture of electricmotors, generators,transformers andelectricity distributionand control apparatus
Pembuatan bateri 808 646 162 3,075 3,075 62 432dan akumulatorManufacture of batteriesand accumulators
Pembuatan 10,289 8,476 1,814 20,682 20,673 553 1,519pendawaian danalatan pendawaianManufacture of wiringand wiring devices
Pembuatan 799 546 253 5,517 5,507 125 213kelengkapanpencahayaan elektrikManufacture of electriclighting equipment
Pembuatan 4,163 3,380 783 10,089 10,081 334 576perkakasandomestikManufacture ofdomestic appliances
Pembuatan 1,013 734 279 7,799 7,766 142 315kelengkapanelektrik lainManufacture of otherelectrical equipment
Bilangan pekerja pada akhir tahun
138
RM Juta / Million RM Juta / Million
Number of persons engaged as at end of year

13.3: Perangkaan Utama Industri Pembuatan mengikut Kumpulan, 2012 (Samb.) Principal Statistics of Manufacturing Industries by Group, 2012 (Cont'd.)
Kumpulan Group Nilai Nilai Nilai Gaji dan Nilai harta
output input ditambah upah yang tetap yangkasar perantaraan Value dibayar dimiliki pada
Value of Value of added dalam tahun akhir tahungross intermediate Jumlah Pekerja Salaries Value of fixedoutput input Total bergaji and wages assets owned
Paid paid during as at end of employees the year year
Pembuatan jentera 16,242 12,489 3,753 43,787 43,489 1,328 3,066kegunaan umumManufacture ofgeneral purposemachinery
Pembuatan mesin 7,459 5,737 1,722 30,380 29,919 817 1,721bagi tujuan khasManufacture ofspecial purposemachineryPembuatan kenderaan 22,640 18,054 4,586 33,253 33,245 1,138 3,601bermotorManufacture ofmotor vehicles
Pembuatan kerangka 1,046 836 210 4,821 4,644 122 273(coachwork) untukkenderaan bermotor;pembuatan trelerdan semi trelerManufacture ofbodies (coachwork)for motor vehicles;manufacture of trailersand semi-trailers
Pembuatan alat ganti 11,313 8,230 3,084 44,334 44,193 1,102 2,456dan aksesori untukkenderaan bermotorManufacture of partsand accessories formotor vehicles
Pembinaan kapal 7,168 5,547 1,620 17,396 17,260 565 2,809dan botBuilding of shipsand boats
Bilangan pekerja pada akhir tahun
139
RM Juta / Million RM Juta / Million
Number of persons engaged as at end of year

13.3: Perangkaan Utama Industri Pembuatan mengikut Kumpulan, 2012 (Samb.) Principal Statistics of Manufacturing Industries by Group, 2012 (Cont'd.)
Kumpulan Group Nilai Nilai Nilai Gaji dan Nilai harta
output input ditambah upah yang tetap yangkasar perantaraan Value dibayar dimiliki pada
Value of Value of added dalam tahun akhir tahungross intermediate Jumlah Pekerja Salaries Value of fixedoutput input Total bergaji and wages assets owned
Paid paid during as at end of employees the year year
Pembuatan keretapi 2,009 1,457 552 5,739 5,739 185 488rolling stock;Pembuatan pesawatdan kapal angkasadan jentera berkaitanManufacture of railwaylocomotives and rollingstock; Manufacture of airand spacecraft andrelated machinery
Pembuatan kenderaan 5,757 3,957 1,800 15,699 15,681 422 1,083tempur ketenteraan;Pembuatan kelengkapanpengangkutan t.t.t.l.Manufacture of militaryfighting vehicles;Manufacture of transportequipment n.e.c.
Pembuatan perabot 9,686 7,180 2,506 82,766 80,950 1,406 3,198Manufacture offurniture
Pembuatan barang 3,621 2,677 943 5,687 5,425 143 162kemas, bijouterie danartikel berkaitanManufacture ofjewellery, bijouterie andrelated articles
Pembuatan instrumen 1 1 (a) 40 32 (a) (a)muzikManufacture of musicalinstruments
Bilangan pekerja pada akhir tahun
140
RM Juta / Million RM Juta / Million
Number of persons engaged as at end of year
(a) Nilai yang dilaporkan kurang daripada RM1,000,000 The value reported less than RM1,000,000
13.3: Perangkaan Utama Industri Pembuatan mengikut Kumpulan, 2012 (Samb.) Principal Statistics of Manufacturing Industries by Group, 2012 (Cont'd.)
Kumpulan Group Nilai Nilai Nilai Gaji dan Nilai harta
output input ditambah upah yang tetap yangkasar perantaraan Value dibayar dimiliki pada
Value of Value of added dalam tahun akhir tahungross intermediate Jumlah Pekerja Salaries Value of fixedoutput input Total bergaji and wages assets owned
Paid paid during as at end of employees the year year
Pembuatan barangan 189 130 59 3,039 3,034 52 83sukanManufacture of sportsgoods
Pembuatan 280 142 138 4,824 4,820 75 91permainan danmainanManufacture of gamesand toys
Pembuatan peralatan 493 297 195 4,206 4,076 103 145dan bekalan perubatan danpergigianManufacture of medicaland dental instrumentsand supplies
Pembuatan lain t.t.t.l. 2,040 1,489 552 15,624 14,868 285 458Other manufacturingn.e.c.
Pembaikan produk 2,931 2,069 862 19,538 18,548 481 911logam yang direka,jentera dankelengkapanRepair of fabricatedmetal products,machinery andequipment
Pemasangan bagi 578 428 150 1,357 1,331 57 140perindustrian mesindan kelengkapanInstallation of industrialmachinery andequipment
Bilangan pekerja pada akhir tahun
141
RM Juta / Million RM Juta / Million
Number of persons engaged as at end of year

13.4: Pengeluaran Produk Pembuatan Terpilih Production of Selected Manufacturing Products
ProdukProducts
2009 2010 2011 2012 2013
Susu pekat manis Tan metrik 233,865 233,700 203,346 275,432 325,247Sweetened condensed milk Tonne
Minuman susu '000 Liter 124,364 127,157 141,244 169,025 188,445Milk drinks '000 Litre
Nanas tin Tan metrik 12,739 10,440 13,368 9,985 8,733Canned pineapple Tonne
Ikan tin Tan metrik 24,774 18,330 18,170 19,211 19,498Canned fish Tonne
Udang/geragau/udang sejuk beku Tan metrik 22,945 23,494 20,748 24,532 28,044Frozen shrimps/prawns Tonne
Minyak kelapa mentah Tan metrik 18,835 14,911 11,134 14,805 16,195Crude coconut oil Tonne
Marjerin Tan metrik 32,700 35,424 47,041 41,578 48,785Margarine Tonne
Minyak masak campuran Tan metrik 77,083 473,921 480,876 466,860 409,049Blended cooking oil Tonne
Beras Tan metrik 734,029 732,168 727,885 768,654 855,782Whole rice Tonne
Beras hancur Tan metrik 52,478 65,375 88,450 82,921 57,108 Broken rice Tonne
Tepung gandum Tan metrik 889,076 960,397 998,402 976,208 1,002,420Wheat flour Tonne
Biskut Tan metrik 138,597 154,835 168,481 156,695 158,128Biscuit Tonne
Gula bertapis Tan metrik 1,488,767 1,661,701 1,688,565 1,594,734 1,733,070Refined sugar Tonne
Makanan ayam itik campuran Tan metrik 2,298,960 2,212,666 2,342,561 2,457,426 2,296,549Mixed poultry feeds Tonne
Minuman manis berkarbonat '000 Liter 391,707 447,229 424,794 306,937 341,404Carbonated sweet beverage '000 Litre
PengeluaranProduction
142
Unit kuantitiUnit of
quantity

13.4: Pengeluaran Produk Pembuatan Terpilih (Samb.) Production of Selected Manufacturing Products (Cont'd.)
ProdukProducts
2009 2010 2011 2012 2013
Minuman manis tidak berkarbonat '000 Liter 1,275,300 2,533,453 2,932,466 3,502,538 3,663,955Non-carbonated sweet beverage 000 Litre
Rokok Tan metrik 20,892 20,935 23,604 26,099 22,272Cigarettes Tonne
Benang kapas (asli dan campuran) Tan metrik 53,794 49,917 53,766 52,094 35,527Cotton yarn (pure and mixed) Tonne
Kain kapas '000 Meter 166,276 172,721 276,709 392,773 275,702Cotton cloth 000 Metre
Seluar panjang lelaki '000 Bil. 16,111 18,413 21,674 17,914 19,175Trousers - male's '000 No.
Kemeja lelaki '000 Bil. 22,623 25,889 25,939 27,002 23,607Shirts - male's '000 No.
Blaus '000 Bil. 18,350 13,143 10,977 10,268 9,768Blouses '000 No.
Pakaian perempuan '000 Bil. 5,684 3,740 5,707 3,895 2,116Dresses '000 No.
Kepingan venir Meter padu 753,518 1,016,637 912,376 871,589 883,074Veneer sheets Cubic Metre
Papan cantum Meter padu 46,889 60,629 39,384 44,141 41,882Blockboard Cubic Metre
Papan lapis Meter padu 3,655,206 4,094,574 3,796,975 3,658,274 3,651,565Plywood Cubic Metre
Ukiran kayu Meter padu 107,791 104,456 90,401 84,653 65,031Timber mouldings Cubic Metre
Kayu balak siap Meter padu 18,766 24,164 34,894 32,215 28,294Dressed timber Cubic Metre
Racun herba (cecair) '000 Liter 42,715 63,400 72,410 92,064 114,168Herbicides (liquid) '000 Litre
Racun herba (bukan cecair) Tan metrik 7,733 9,167 13,184 11,597 6,071Herbicides (non-liquid) Tonne
Baja (Termasuk urea) Tan metrik 2,007,298 2,218,514 2,477,242 2,509,814 2,624,883Fertiliser (Includes urea) Tonne
Cat emulsi '000 Liter 71,149 69,502 86,291 92,996 116,401Emulsion paints '000 Litre
PengeluaranProduction
143
Unit kuantitiUnit of
quantity

13.4: Pengeluaran Produk Pembuatan Terpilih (Samb.) Production of Selected Manufacturing Products (Cont'd.)
ProdukProducts
2009 2010 2011 2012 2013
Cat kilat 000 Liter 11,513 15,692 20,202 20,221 20,902Gloss paints 000 Litre
Cat lapis '000 Liter 6,779 7,091 6,502 8,316 10,260 Undercoats 000 Litre
Cat asas '000 Liter 17,326 18,501 20,994 20,439 19,065 Primers 000 Litre
Sabun mandi Tan metrik 50,837 47,905 42,266 40,367 41,912 Toilet soap Tonne
Sabun serbuk (bahan pencuci) Tan metrik 127,328 146,886 137,917 136,177 141,953 Soap powder (detergents) Tonne
Minyak tanah Tan metrik 3,402,778 3,350,367 3,559,679 3,504,452 3,269,616 Kerosene Tonne
Gas petroleum cecair Tan metrik 3,265,333 3,054,649 3,036,305 2,803,620 2,534,112 Liquefied petroleum gas Tonne
Minyak bahan api Tan metrik 2,269,201 2,087,236 2,790,140 3,225,985 2,398,992 Fuel oil Tonne
Minyak diesel / gas Tan metrik 9,494,751 8,585,460 9,999,539 11,754,674 11,234,249 Diesel / gas oil Tonne
Gasolin (spirit motor) Tan metrik 4,375,230 4,175,258 5,510,132 5,542,745 5,331,428 Gasoline (motor spirit) Tonne
Tayar pneumatik (semua jenis) '000 Bil. 13,098 14,699 14,862 16,631 15,215 Pneumatic tyres (all types) '000 No.
Tiub dalam (semua jenis) '000 Bil. 14,549 15,406 15,401 17,432 13,326 Inner tubes (all types) '000 No.
Getah Mutu Malaysia (semua gred) Tan metrik 745,056 872,183 819,208 899,792 933,975 Standard Malaysian Rubber (all grades) Tonne
Susu getah diproses Tan metrik 71,472 74,913 78,850 67,094 63,843 Processed latex Tonne
Kepingan getah Tan metrik 2,638 3,806 4,542 4,570 3,988 Rubber sheets Tonne
Campuran getah Tan metrik 112,179 129,983 140,812 158,416 167,731 Rubber compounds Tonne
Gelang getah Tan metrik 3,301 3,592 3,452 2,197 3,527 Rubber bands Tonne
PengeluaranProduction
144
Unit kuantitiUnit of
quantity

13.4: Pengeluaran Produk Pembuatan Terpilih (Samb.) Production of Selected Manufacturing Products (Cont'd.)
ProdukProducts
2009 2010 2011 2012 2013
Sarung tangan getah '000 Pasang 23,132,708 26,257,329 30,897,840 31,753,978 34,628,155Rubber gloves '000 Pairs
Catheters Bilangan 119,405,478 129,480,324 140,148,919 148,474,655 160,523,915Catheters Number
Kasut getah (semua jenis) '000 Pasang 5,604 6,658 6,656 6,409 6,281Rubber footwear (all types) '000 Pairs
Paip P.V.C. Tan metrik 81,155 93,109 111,533 126,989 121,697P.V.C. pipes Tonne
Bata tanah '000 Bil. 202,910 410,257 621,026 706,492 468,200Earthen bricks '000 No.
Jubin seramik '000 M. persegi 79,730 85,644 82,086 90,699 88,694Ceramic tiles '000 Sq. metre
Simen (semua jenis) '000 Tan metrik 19,457 19,762 21,198 21,726 21,457Cement (all types) '000 Tonnes
Bumbung genting simen '000 Bil. 108,659 118,143 118,710 168,061 171,175(semua jenis)Cement roofing tiles (all types) '000 No.
Konkrit campuran siap Meter padu 7,465,428 7,931,997 10,934,235 13,082,063 14,905,762Ready-mixed concrete Cubic Metre
Bar dan batang besi dan keluli Tan metrik 1,890,734 2,217,046 2,562,316 2,817,374 3,162,793Iron and steel bars and rods Tonne
Kepingan besi yang disadur Tan metrik 130,038 168,363 184,141 154,349 109,710Galvanised iron sheets Tonne
Paip, tiub dan kelengkapan Tan metrik 417,784 304,381 266,595 563,787 500,842besi kimpal dan keluli TonneWelded iron and steel pipesand tubes and fittings
Tin timah dan semua tin lain '000 Bil. 2,376,802 2,660,861 2,691,731 3,157,711 3,831,340Tin cans and all other tins '000 No.
Dram besi dan keluli '000 Bil. 4,533 3,732 11,225 4,508 4,357Iron and steel drums '000 No.
PengeluaranProduction
145
Unit kuantitiUnit of quantity

13.4 : Pengeluaran Produk Pembuatan Terpilih (Samb.) Production of Selected Manufacturing Products (Cont'd.)
ProdukProducts
2009 2010 2011 2012 2013
Dawai besi dan keluli bersadur Tan metrik 153,000 178,310 141,526 95,369 86,580 Galvanised iron and steel wire Tonne
Dawai mata punai dan jaring '000 M. persegi 157,233 189,696 225,126 212,793 183,080 Wire mesh and netting '000 Sq. Metre
Penyaman udara bilik Bilangan 1,940,966 2,593,647 2,846,511 2,665,326 2,633,717 Room air-conditioners Number
Peti televisyen Bilangan 6,361,787 13,163,257 13,966,508 13,054,444 17,072,420 Television sets Number
Radio '000 Bil. 58,410 57,350 47,889 28,365 18,954 Radios '000 No.
Separa konduktor Bilangan (juta) 14,885 17,997 16,281 19,765 19,281 Semi-conductors Number (million)
Transistor elektronik Bilangan (juta) 29,271 34,184 34,189 36,119 35,362 Electronic transistors Number (million)
Litar bersepadu Bilangan (juta) 23,279 38,007 33,380 39,391 35,686 Integrated circuits Number (million)
Dawai dan kabel yang bertebat Tan metrik 52,648 61,046 72,328 69,610 86,384 Insulated wires and cables Tonnes
Kereta penumpang kurang 1600 c.c. Bilangan 275,700 274,360 248,467 252,499 292,963 Passenger cars below 1600 c.c. Number
Kereta penumpang 1600 c.c. dan lebih Bilangan 133,668 200,340 207,154 227,818 222,103 Passengers cars 1600 c.c. and above Number
Kenderaan perdagangan Bilangan 67,634 72,565 65,658 81,786 90,363 Commercial vehicles Number
Motosikal dan skuter Bilangan 305,999 421,676 486,911 533,508 498,371 Motor cycles and scooters Number
PengeluaranProduction
146
Unit of quantityUnit kuantiti

13.5: Perangkaan Utama Industri Pembinaan mengikut Wilayah Principal Statistics of Construction Industries by Region
Wilayah Tahun BilanganRegion Year pertubuhan Nilai Nilai Nilai Gaji dan Nilai harta
No. of output input ditambah upah yang tetap yangestablishments kasar perantaraan Value dibayar dimiliki pada
Value of Value of added dalam tahun akhir tahungross intermediate Jumlah Pekerja Salaries Value of fixedoutput input Total bergaji and wages assets owned
Paid paid during as at end of employees the year year
Malaysia 2005 10,347 53,960 36,987 16,973 551,755 545,673 10,868 7,487
2007 5,543 60,716 42,617 18,099 595,139 593,302 12,957 8,395
2009 5,764 70,600 49,365 21,235 602,694 600,916 13,967 9,359
2010 22,140 91,342 59,400 31,941 974,488 960,491 19,841 14,476
2012 - 110,068 73,054 37,014 1,027,900 1,007,143 22,434 14,071
2005 8,908 48,489 33,727 14,762 447,366 442,404 9,321 6,571
2007 4,825 55,239 39,051 16,188 511,238 509,772 11,577 7,500
2009 4,896 62,705 44,290 18,414 500,237 498,902 12,243 7,953
2010 19,621 77,083 50,201 26,882 788,500 776,299 16,693 12,191
2012 - 92,552 61,740 30,812 831,719 814,005 18,875 11,850
Sabah (a) 2005 652 2,061 1,360 700 32,548 32,008 460 418
2007 287 2,008 1,359 649 25,375 25,219 397 372
2009 437 3,723 2,525 1,198 43,398 43,168 731 646
2010 1,387 7,677 5,116 2,561 92,388 91,345 1,607 1,093
2012 - 9,250 6,292 2,958 97,451 95,782 1,817 1,062
Sarawak 2005 787 3,411 1,900 1,511 71,841 71,261 1,087 498
2007 431 3,469 2,207 1,262 58,526 58,311 983 523
2009 431 4,172 2,549 1,623 59,059 58,846 993 760
2010 1,132 6,582 4,084 2,499 93,600 92,847 1,540 1,192
2012 - 8,266 5,022 3,244 98,730 97,357 1,742 1,159
147
RM Juta / Million RM Juta / MillionBilangan pekerja pada akhir tahun
Number of persons engaged as at end of year
Semenanjung Malaysia Peninsular Malaysia
(a) Data termasuk W.P. Labuan. Data includes W.P. Labuan.
1) Tiada penyiasatan dijalankan untuk tahun 2006, 2008 dan 2011. Maklumat untuk tahun 2005 dan 2010 berdasarkan keputusan banci. N survey was conducted for years 2006 , 2008 and 2011. Information for year 2005 and 2010 are based on census result. 2) Data pada tahun 2012 adalah menggunakan kaedah pensampelan berkebarangkalian di peringkat nasional. Data for year 2012 are using probalility sampling method at national level.
Nota / Notes :
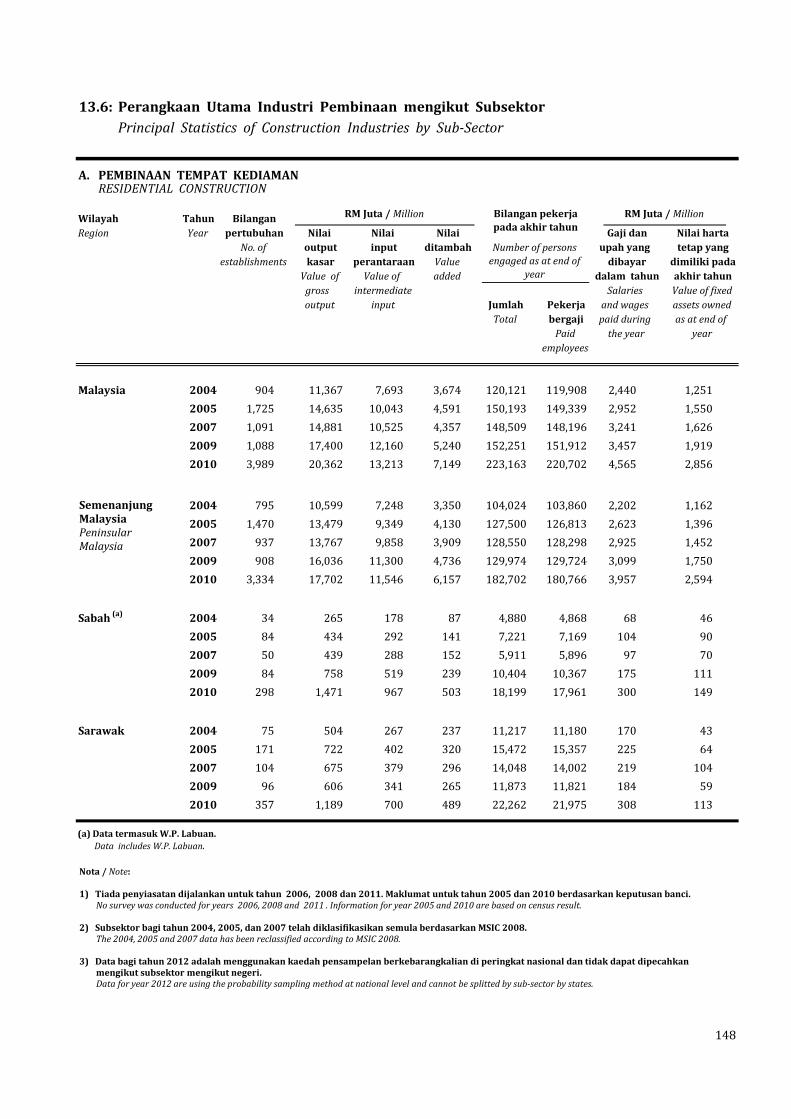
13.6: Perangkaan Utama Industri Pembinaan mengikut Subsektor Principal Statistics of Construction Industries by Sub-Sector
A. PEMBINAAN TEMPAT KEDIAMAN RESIDENTIAL CONSTRUCTION
Wilayah Tahun BilanganRegion Year pertubuhan Nilai Nilai Nilai Gaji dan Nilai harta
No. of output input ditambah upah yang tetap yangestablishments kasar perantaraan Value dibayar dimiliki pada
Value of Value of added dalam tahun akhir tahungross intermediate Salaries Value of fixedoutput input Jumlah Pekerja and wages assets owned
Total bergaji paid during as at end of Paid the year year
employees
Malaysia 2004 904 11,367 7,693 3,674 120,121 119,908 2,440 1,2512005 1,725 14,635 10,043 4,591 150,193 149,339 2,952 1,5502007 1,091 14,881 10,525 4,357 148,509 148,196 3,241 1,6262009 1,088 17,400 12,160 5,240 152,251 151,912 3,457 1,9192010 3,989 20,362 13,213 7,149 223,163 220,702 4,565 2,856
2004 795 10,599 7,248 3,350 104,024 103,860 2,202 1,1622005 1,470 13,479 9,349 4,130 127,500 126,813 2,623 1,3962007 937 13,767 9,858 3,909 128,550 128,298 2,925 1,4522009 908 16,036 11,300 4,736 129,974 129,724 3,099 1,7502010 3,334 17,702 11,546 6,157 182,702 180,766 3,957 2,594
Sabah (a) 2004 34 265 178 87 4,880 4,868 68 462005 84 434 292 141 7,221 7,169 104 902007 50 439 288 152 5,911 5,896 97 702009 84 758 519 239 10,404 10,367 175 1112010 298 1,471 967 503 18,199 17,961 300 149
Sarawak 2004 75 504 267 237 11,217 11,180 170 432005 171 722 402 320 15,472 15,357 225 642007 104 675 379 296 14,048 14,002 219 1042009 96 606 341 265 11,873 11,821 184 592010 357 1,189 700 489 22,262 21,975 308 113
148
RM Juta / Million RM Juta / MillionBilangan pekerja pada akhir tahun
Number of persons engaged as at end of
year
Semenanjung Malaysia Peninsular Malaysia
Nota / Note: 1) Tiada penyiasatan dijalankan untuk tahun 2006, 2008 dan 2011. Maklumat untuk tahun 2005 dan 2010 berdasarkan keputusan banci. No survey was conducted for years 2006, 2008 and 2011 . Information for year 2005 and 2010 are based on census result.
2) Subsektor bagi tahun 2004, 2005, dan 2007 telah diklasifikasikan semula berdasarkan MSIC 2008. The 2004, 2005 and 2007 data has been reclassified according to MSIC 2008.
3) Data bagi tahun 2012 adalah menggunakan kaedah pensampelan berkebarangkalian di peringkat nasional dan tidak dapat dipecahkan mengikut subsektor mengikut negeri. Data for year 2012 are using the probability sampling method at national level and cannot be splitted by sub-sector by states.
(a) Data termasuk W.P. Labuan. Data includes W.P. Labuan.
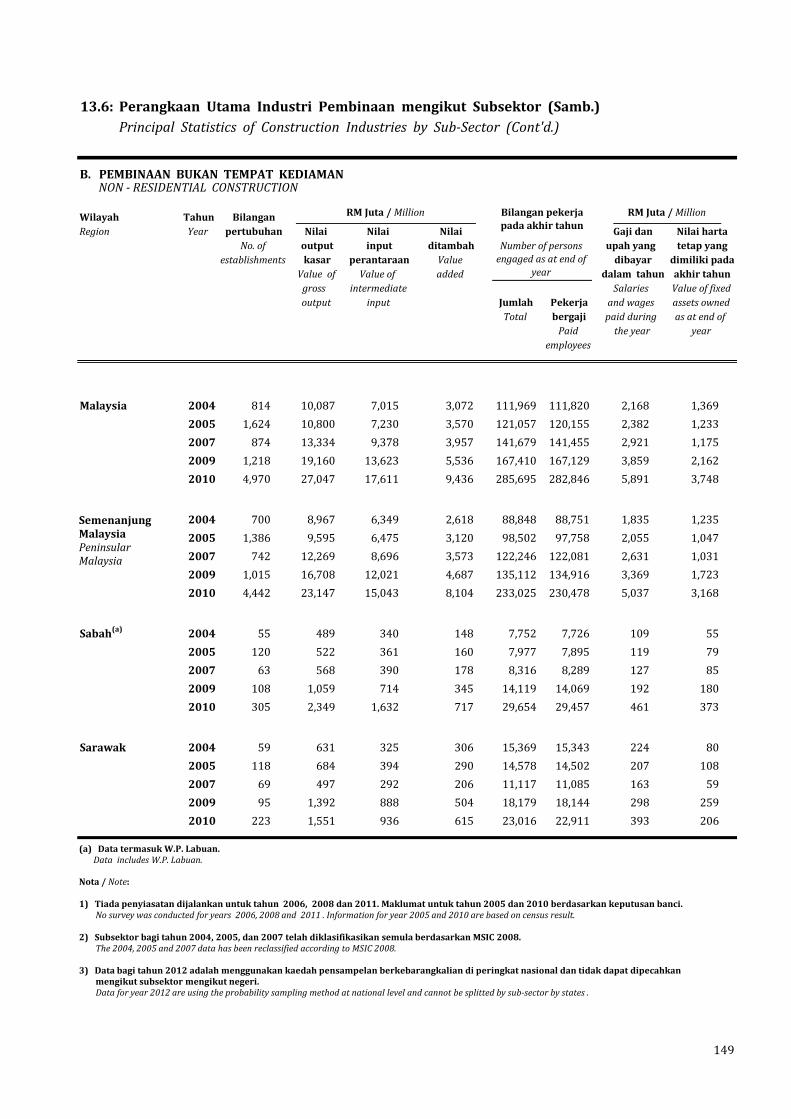
13.6: Perangkaan Utama Industri Pembinaan mengikut Subsektor (Samb.) Principal Statistics of Construction Industries by Sub-Sector (Cont'd.)
B. PEMBINAAN BUKAN TEMPAT KEDIAMAN NON - RESIDENTIAL CONSTRUCTION
Wilayah Tahun BilanganRegion Year pertubuhan Nilai Nilai Nilai Gaji dan Nilai harta
No. of output input ditambah upah yang tetap yangestablishments kasar perantaraan Value dibayar dimiliki pada
Value of Value of added dalam tahun akhir tahungross intermediate Salaries Value of fixedoutput input Jumlah Pekerja and wages assets owned
Total bergaji paid during as at end of Paid the year year
employees
Malaysia 2004 814 10,087 7,015 3,072 111,969 111,820 2,168 1,3692005 1,624 10,800 7,230 3,570 121,057 120,155 2,382 1,2332007 874 13,334 9,378 3,957 141,679 141,455 2,921 1,1752009 1,218 19,160 13,623 5,536 167,410 167,129 3,859 2,1622010 4,970 27,047 17,611 9,436 285,695 282,846 5,891 3,748
2004 700 8,967 6,349 2,618 88,848 88,751 1,835 1,2352005 1,386 9,595 6,475 3,120 98,502 97,758 2,055 1,0472007 742 12,269 8,696 3,573 122,246 122,081 2,631 1,0312009 1,015 16,708 12,021 4,687 135,112 134,916 3,369 1,7232010 4,442 23,147 15,043 8,104 233,025 230,478 5,037 3,168
Sabah(a) 2004 55 489 340 148 7,752 7,726 109 552005 120 522 361 160 7,977 7,895 119 792007 63 568 390 178 8,316 8,289 127 852009 108 1,059 714 345 14,119 14,069 192 1802010 305 2,349 1,632 717 29,654 29,457 461 373
Sarawak 2004 59 631 325 306 15,369 15,343 224 802005 118 684 394 290 14,578 14,502 207 1082007 69 497 292 206 11,117 11,085 163 592009 95 1,392 888 504 18,179 18,144 298 2592010 223 1,551 936 615 23,016 22,911 393 206
RM Juta / Million RM Juta / Million
149
Bilangan pekerja pada akhir tahun
Number of persons engaged as at end of
year
Semenanjung Malaysia Peninsular Malaysia
(a) Data termasuk W.P. Labuan. Data includes W.P. Labuan.
Nota / Note: 1) Tiada penyiasatan dijalankan untuk tahun 2006, 2008 dan 2011. Maklumat untuk tahun 2005 dan 2010 berdasarkan keputusan banci. No survey was conducted for years 2006, 2008 and 2011 . Information for year 2005 and 2010 are based on census result.
2) Subsektor bagi tahun 2004, 2005, dan 2007 telah diklasifikasikan semula berdasarkan MSIC 2008. The 2004, 2005 and 2007 data has been reclassified according to MSIC 2008.
3) Data bagi tahun 2012 adalah menggunakan kaedah pensampelan berkebarangkalian di peringkat nasional dan tidak dapat dipecahkan mengikut subsektor mengikut negeri. Data for year 2012 are using the probability sampling method at national level and cannot be splitted by sub-sector by states .

13.6: Perangkaan Utama Industri Pembinaan mengikut Subsektor (Samb.) Principal Statistics of Construction Industries by Sub-Sector (Cont'd.)
C. PEMBINAAN KEJURUTERAAN AWAM CIVIL ENGINEERING CONSTRUCTION
Wilayah Tahun BilanganRegion Year pertubuhan Nilai Nilai Nilai Gaji dan Nilai harta
No. of output input ditambah upah yang tetap yangestablishments kasar perantaraan Value dibayar dimiliki pada
Value of Value of added dalam tahun akhir tahungross intermediate Salaries Value of fixedoutput input Jumlah Pekerja and wages assets owned
Total bergaji paid during as at end of Paid the year year
employees
Malaysia 2004 1,374 16,845 11,815 5,030 148,450 148,112 3,163 2,8072005 3,613 18,393 12,651 5,742 184,008 181,787 3,600 3,0452007 1,738 18,774 13,115 5,660 180,089 179,622 3,949 3,7262009 1,474 19,700 13,568 6,133 161,948 161,527 3,717 2,7882010 4,740 24,852 16,346 8,506 251,793 248,857 5,229 3,861
2004 1,129 14,694 10,578 4,116 110,082 109,860 2,527 2,3612005 3,091 15,776 11,137 4,639 135,593 135,593 2,843 2,5582007 1,483 18,451 12,903 5,548 163,140 162,706 3,776 3,2382009 1,190 16,343 11,431 4,912 123,721 123,428 3,006 2,1102010 3,999 18,683 12,325 6,357 182,369 17,966 3,889 2,707
Sabah(a) 2004 96 709 456 252 10,909 10,859 156 1682005 268 886 568 318 13,370 13,151 189 2082007 98 746 509 237 7,602 7,551 121 1732009 148 1,527 1,033 494 15,000 14,932 293 2892010 487 3,028 1,990 1,038 33,444 33,053 671 402
Sarawak 2004 149 1,443 781 662 27,459 27,393 479 2782005 254 1,732 947 786 35,045 34,883 567 2782007 157 1,985 1,337 648 28,640 28,567 525 3162009 136 1,831 1,104 726 23,227 23,167 418 3892010 263 3,141 2,031 1,111 35,980 35,838 670 752
150
RM Juta / Million RM Juta / MillionBilangan pekerja pada akhir tahun
Number of persons engaged as at end of
year
Semenanjung Malaysia Peninsular Malaysia
(a) Data termasuk W.P. Labuan. Data includes W.P. Labuan.
Nota / Note: 1) Tiada penyiasatan dijalankan untuk tahun 2006, 2008 dan 2011. Maklumat untuk tahun 2005 dan 2010 berdasarkan keputusan banci. No survey was conducted for years 2006, 2008 and 2011 . Information for year 2005 and 2010 are based on census result.
2) Subsektor bagi tahun 2004, 2005, dan 2007 telah diklasifikasikan semula berdasarkan MSIC 2008. The 2004, 2005 and 2007 data has been reclassified according to MSIC 2008.
3) Data bagi tahun 2012 adalah menggunakan kaedah pensampelan berkebarangkalian di peringkat nasional dan tidak dapat dipecahkan mengikut subsektor mengikut negeri. Data for year 2012 are using the probability sampling method at national level and cannot be splitted by sub-sector by states.

13.6: Perangkaan Utama Industri Pembinaan mengikut Subsektor (Samb.)Principal Statistics of Construction Industries by Sub-Sector (Cont'd.)
D. PEMBINAAN PERTUKANGAN KHAS SPECIAL TRADE CONSTRUCTION
Wilayah Tahun BilanganRegion Year pertubuhan Nilai Nilai Nilai Gaji dan Nilai harta
No. of output input ditambah upah yang tetap yangestablishments kasar perantaraan Value dibayar dimiliki pada
Value of Value of added dalam tahun akhir tahungross intermediate Salaries Value of fixedoutput input Jumlah Pekerja and wages assets owned
Total bergaji paid during as at end of Paid the year year
employees
Malaysia 2004 1,358 7,476 5,250 2,226 69,404 68,899 1,513 1,1962005 3,385 10,132 7,062 3,070 96,497 94,392 1,935 1,6592007 1,840 11,318 7,966 3,352 105,569 104,827 2,372 1,8682009 1,984 14,340 10,014 4,326 121,085 120,348 2,934 2,4912010 8,441 19,080 12,230 6,850 213,837 208,086 4,157 4,011
2004 1,220 7,086 5,016 2,071 61,162 60,749 1,401 1,1202005 2,961 9,639 6,766 2,873 85,771 84,080 1,799 1,5712007 1,663 10,752 7,594 3,157 97,302 96,687 2,245 1,7792009 1,783 13,617 9,538 4,079 111,430 110,834 2,769 2,3712010 7,855 17,551 11,287 6,264 190,404 185,089 3,811 3,722
Sabah(a) 2004 56 183 120 63 3,057 3,016 41 372005 180 220 139 81 3,980 3,793 48 402007 76 255 172 83 3,546 3,483 51 442009 97 379 260 119 3,875 3,800 71 672010 297 829 526 302 11,091 10,874 176 169
Sarawak 2004 82 207 115 92 5,185 2,134 72 382005 244 274 157 116 6,746 6,519 87 482007 101 311 200 111 4,721 4,657 76 442009 104 344 216 128 5,780 5,714 93 542010 289 701 416 284 12,342 12,123 170 121
151
RM Juta / Million RM Juta / MillionBilangan pekerja pada akhir tahun
Number of persons engaged as at end of
year
Semenanjung Malaysia Peninsular Malaysia
(a) Data termasuk W.P. Labuan. Data includes W.P. Labuan.
Nota / Note: 1) Tiada penyiasatan dijalankan untuk tahun 2006, 2008 dan 2011. Maklumat untuk tahun 2005 dan 2010 berdasarkan keputusan banci. No survey was conducted for years 2006, 2008 and 2011 . Information for year 2005 and 2010 are based on census result.
2) Subsektor bagi tahun 2004, 2005, dan 2007 telah diklasifikasikan semula berdasarkan MSIC 2008. The 2004, 2005 and 2007 data has been reclassified according to MSIC 2008.
3) Data bagi tahun 2012 adalah menggunakan kaedah pensampelan berkebarangkalian di peringkat nasional dan tidak dapat dipecahkan mengikut subsektor mengikut negeri. Data for year 2012 are using the probability sampling method at national level and cannot be splitted by sub-sector by states.

13.7 : Pengeluaran Galian Production of Minerals
Galian Unit kuantiti 2009 2010 2011 2012 2013 p
Minerals Unit of quantity
Timah dalam konsentrat Tan metrik 2,412 2,668 3,340 3,745 3,696Tin-in-concentrates Tonne
Bauksit Tan metrik 263,432 124,274 182,831 121,873 208,770Bauxite Tonne
Bijih besi Tan metrik 1,470,186 3,557,813 8,077,879 10,886,022 12,133,556Iron ore Tonne
Kaolin Tan metrik 463,736 473,273 405,717 424,622 501,316Kaolin Tonne
Emas (a) Gram 2,794,167 3,765,936 4,219,325 4,624,987 3,822,708Gold (a) Gram
Perak (b) 000 gram 366,970 435,862 459,640 1,627,711 360,828Silver (b) 000 gram
Barit Tan metrik 6,380 1,000 - - 500Barite Tonne
Minyak mentah (c) 000 tong 240,479 238,478 212,794 218,706 214,696Crude oil (c) 000 barrel
Gas asli (d) JKPS (e) 2,119,355 2,496,185 2,547,555 2,544,305 2,647,898Natural gas (d) MMSCF (e)
Ilmenit Tan metrik 15,983 19,039 28,782 22,275 16,043Ilmenite Tonne
Struverit Tan metrik 176 84 110 262 190Struverite Tonne
Monasit Tan metrik 25 622 571 113 261Monazite Tonne
Zirkon Tan metrik 1,145 1,267 1,685 442 379Zircon Tonne
152
(a) Termasuk emas mentah dan kandungan emas dari konsentrat tembaga. Includes raw gold and gold from copper concentrates. (b) Hasil sampingan daripada lombong emas. By-product from gold mines. (c) Mentah dan peluwap. Crude and condensate. (d) Pengeluaran Bersih = Pengeluaran Kasar Gas Asli (Gas Bersekutu & Gas Tidak Bersekutu) tolak Suntikan Semula & Pembakaran Net Production = Gross Production of Natural Gas (Associated Gas & Non- Associated Gas) less Re-injected and Flared. (e) JKPS - (Juta) Kaki Padu Standard. MMSCF - (Million) Standard Cubic Feet.
Sumber : Jabatan Mineral dan Geosains, Malaysia Source : Department of Minerals and Geoscience, Malaysia Petroliam Nasional Berhad (PETRONAS)

13.8 : Perangkaan Utama Industri Perlombongan Mineral Principal Statistics of Mineral Mining Industry
Butir-butir 1997 1999 2000 2005 2010Particulars
Nilai output kasar (RM Juta) 290 364 349 385 1,528Value of gross output (RM Million)
Nilai input perantaraan (RM Juta) 142 141 232 224 929Value of intermediate input (RM Million)
Nilai ditambah (RM Juta) 148 223 117 161 600Value added (RM Million)
Bilangan pekerja pada akhir tahun :Number of persons engaged as at end of year :
Jumlah / Total 4,086 4,489 2,948 2,528 4,954
Pekerja bergaji / Paid employees 4,077 4,481 2,940 2,523 4,946
Gaji dan upah yang dibayar dalam tahun (RM Juta) 61 72 53 48 141Salaries and wages paid during the year (RM Million)
Nilai harta tetap yang dimiliki pada akhir tahun (RM Juta) 140 105 108 138 665Value of fixed assets owned as at end of year (RM Million)
13.9 : Perangkaan Utama Industri Pengkuarian Batu Principal Statistics of Stone Quarrying Industry
Butir-butir 1995 1998 2000 2005 2010Particulars
Nilai output kasar (RM Juta) 1,260 1,355 1,285 1,540 2,968Value of gross output (RM Million)
Nilai input perantaraan (RM Juta) 751 809 746 919 1,878Value of intermediate input (RM Million)
Nilai ditambah (RM Juta) 508 546 538 621 1,089Value added (RM Million)
Bilangan pekerja pada akhir tahun :Number of persons engaged as at end of year :
Jumlah / Total 13,675 13,507 11,608 9,420 14,343
Pekerja bergaji / Paid employees 13,655 13,497 11,604 9,412 14,280
Gaji dan upah yang dibayar dalam tahun (RM Juta) 206 232 210 203 345Salaries and wages paid during the year (RM Million)
Nilai harta tetap yang dimiliki pada akhir tahun (RM Juta) 731 1,107 1,199 947 1,183Value of fixed assets owned as at end of year (RM Million)
153
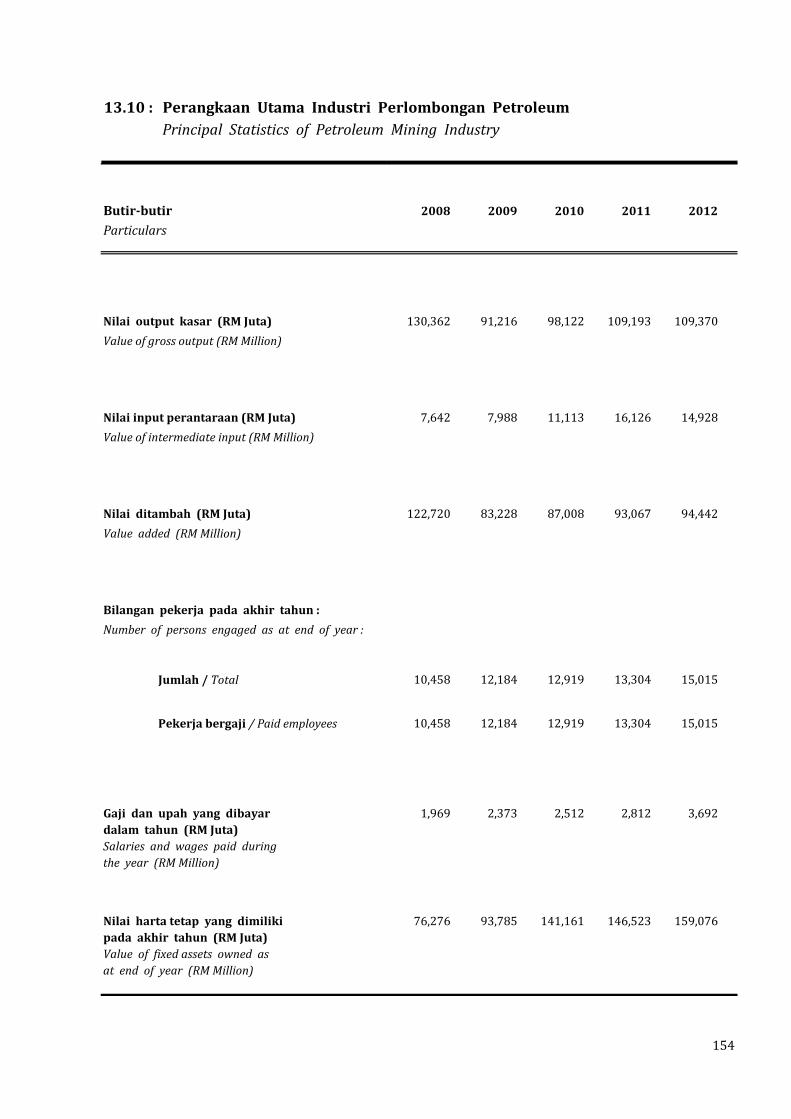
13.10 : Perangkaan Utama Industri Perlombongan Petroleum Principal Statistics of Petroleum Mining Industry
Butir-butir 2008 2009 2010 2011 2012
Particulars
Nilai output kasar (RM Juta) 130,362 91,216 98,122 109,193 109,370Value of gross output (RM Million)
Nilai input perantaraan (RM Juta) 7,642 7,988 11,113 16,126 14,928Value of intermediate input (RM Million)
Nilai ditambah (RM Juta) 122,720 83,228 87,008 93,067 94,442Value added (RM Million)
Bilangan pekerja pada akhir tahun :
Number of persons engaged as at end of year :
Jumlah / Total 10,458 12,184 12,919 13,304 15,015
Pekerja bergaji / Paid employees 10,458 12,184 12,919 13,304 15,015
Gaji dan upah yang dibayar 1,969 2,373 2,512 2,812 3,692dalam tahun (RM Juta)Salaries and wages paid during the year (RM Million)
Nilai harta tetap yang dimiliki 76,276 93,785 141,161 146,523 159,076pada akhir tahun (RM Juta)Value of fixed assets owned as at end of year (RM Million)
154
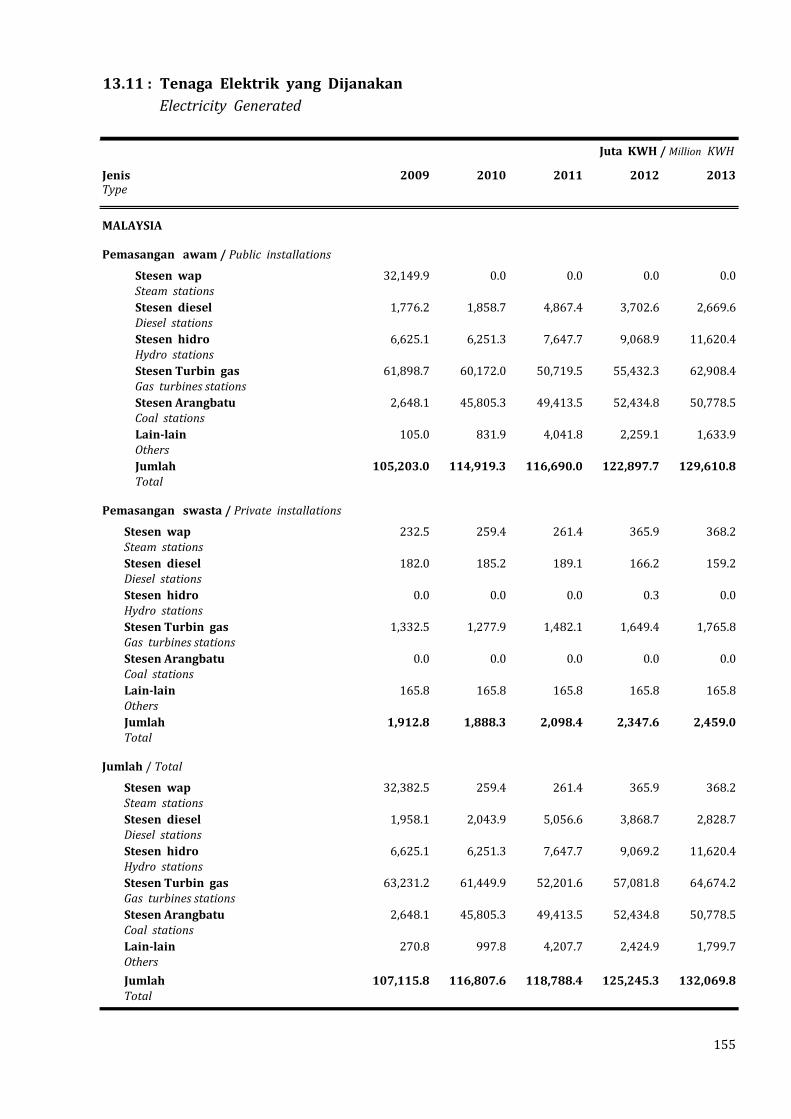
13.11 : Tenaga Elektrik yang Dijanakan Electricity Generated
Jenis 2009 2010 2011 2012 2013Type
MALAYSIA
Pemasangan awam / Public installations
Stesen wap 32,149.9 0.0 0.0 0.0 0.0Steam stationsStesen diesel 1,776.2 1,858.7 4,867.4 3,702.6 2,669.6Diesel stationsStesen hidro 6,625.1 6,251.3 7,647.7 9,068.9 11,620.4Hydro stationsStesen Turbin gas 61,898.7 60,172.0 50,719.5 55,432.3 62,908.4Gas turbines stationsStesen Arangbatu 2,648.1 45,805.3 49,413.5 52,434.8 50,778.5Coal stationsLain-lain 105.0 831.9 4,041.8 2,259.1 1,633.9OthersJumlah 105,203.0 114,919.3 116,690.0 122,897.7 129,610.8Total
Pemasangan swasta / Private installations
Stesen wap 232.5 259.4 261.4 365.9 368.2Steam stationsStesen diesel 182.0 185.2 189.1 166.2 159.2Diesel stationsStesen hidro 0.0 0.0 0.0 0.3 0.0Hydro stationsStesen Turbin gas 1,332.5 1,277.9 1,482.1 1,649.4 1,765.8Gas turbines stationsStesen Arangbatu 0.0 0.0 0.0 0.0 0.0Coal stationsLain-lain 165.8 165.8 165.8 165.8 165.8OthersJumlah 1,912.8 1,888.3 2,098.4 2,347.6 2,459.0Total
Jumlah / Total
Stesen wap 32,382.5 259.4 261.4 365.9 368.2Steam stationsStesen diesel 1,958.1 2,043.9 5,056.6 3,868.7 2,828.7Diesel stationsStesen hidro 6,625.1 6,251.3 7,647.7 9,069.2 11,620.4Hydro stationsStesen Turbin gas 63,231.2 61,449.9 52,201.6 57,081.8 64,674.2Gas turbines stationsStesen Arangbatu 2,648.1 45,805.3 49,413.5 52,434.8 50,778.5Coal stationsLain-lain 270.8 997.8 4,207.7 2,424.9 1,799.7Others
Jumlah 107,115.8 116,807.6 118,788.4 125,245.3 132,069.8Total
155
Juta KWH / Million KWH

13.11: Tenaga Elektrik yang Dijanakan (Samb.) Electricity Generated (Cont'd.)
JenisType 2009 2010 2011 2012 2013
SEMENANJUNG MALAYSIAPENINSULAR MALAYSIA
Pemasangan awam / Public installations
Stesen wap 32,149.9 0.0 0.0 0.0 0.0Steam stationsStesen diesel 183.7 223.0 3,507.5 2,487.8 1,412.2Diesel stationsStesen hidro 5,795.0 5,231.6 5,926.4 5,519.8 5,391.6Hydro stationsStesen Turbin gas 56,754.8 54,055.3 44,164.0 48,935.0 56,160.7Gas turbines stationsStesen Arangbatu 0.0 42,624.1 46,369.3 49,401.2 47,732.6Coal stationsLain-lain 0.0 673.9 3,868.8 2,096.1 1,427.9OthersJumlah 94,883.4 102,807.9 103,836.1 108,440.0 112,125.0Total
Pemasangan swasta / Private installations
Stesen wap 0.0 0.0 0.0 0.0 0.0Steam stationsStesen diesel 125.1 125.1 125.1 125.1 125.1Diesel stationsStesen hidro 0.0 0.0 0.0 0.0 0.0Hydro stationsStesen Turbin gas 172.3 172.3 172.3 172.3 172.3Gas turbines stationsStesen Arangbatu 0.0 0.0 0.0 0.0 0.0Coal stationsLain-lain 165.8 165.8 165.8 165.8 165.8OthersJumlah 463.2 463.2 463.2 463.2 463.2Total
Jumlah / Total
Stesen wap 32,149.9 0.0 0.0 0.0 0.0Steam stationsStesen diesel 308.7 348.1 3,632.6 2,612.9 1,537.3Diesel stationsStesen hidro 5,795.0 5,231.6 5,926.4 5,519.8 5,391.6Hydro stationsStesen Turbin gas 56,927.1 54,227.5 44,336.2 49,107.3 56,333.0Gas turbines stationsStesen Arangbatu 0.0 42,624.1 46,369.3 49,401.2 47,732.6Coal stationsLain-lain 165.8 839.8 4,034.7 2,261.9 1,593.7OthersJumlah 95,346.6 103,271.1 104,299.3 108,903.2 112,588.2Total
Juta KWH / Million KWH
156
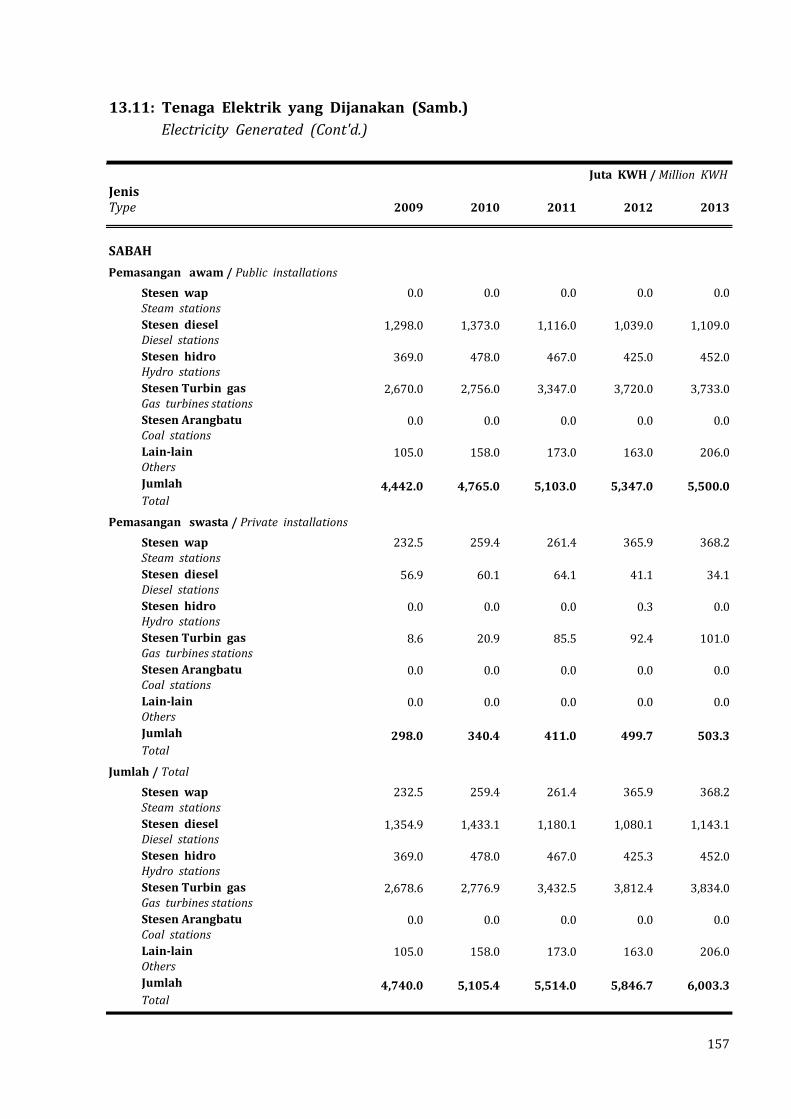
13.11: Tenaga Elektrik yang Dijanakan (Samb.) Electricity Generated (Cont'd.)
JenisType 2009 2010 2011 2012 2013
SABAH
Pemasangan awam / Public installations
Stesen wap 0.0 0.0 0.0 0.0 0.0Steam stationsStesen diesel 1,298.0 1,373.0 1,116.0 1,039.0 1,109.0Diesel stationsStesen hidro 369.0 478.0 467.0 425.0 452.0Hydro stationsStesen Turbin gas 2,670.0 2,756.0 3,347.0 3,720.0 3,733.0Gas turbines stationsStesen Arangbatu 0.0 0.0 0.0 0.0 0.0Coal stationsLain-lain 105.0 158.0 173.0 163.0 206.0OthersJumlah 4,442.0 4,765.0 5,103.0 5,347.0 5,500.0Total
Pemasangan swasta / Private installations
Stesen wap 232.5 259.4 261.4 365.9 368.2Steam stationsStesen diesel 56.9 60.1 64.1 41.1 34.1Diesel stationsStesen hidro 0.0 0.0 0.0 0.3 0.0Hydro stationsStesen Turbin gas 8.6 20.9 85.5 92.4 101.0Gas turbines stationsStesen Arangbatu 0.0 0.0 0.0 0.0 0.0Coal stationsLain-lain 0.0 0.0 0.0 0.0 0.0OthersJumlah 298.0 340.4 411.0 499.7 503.3Total
Jumlah / Total
Stesen wap 232.5 259.4 261.4 365.9 368.2Steam stationsStesen diesel 1,354.9 1,433.1 1,180.1 1,080.1 1,143.1Diesel stationsStesen hidro 369.0 478.0 467.0 425.3 452.0Hydro stationsStesen Turbin gas 2,678.6 2,776.9 3,432.5 3,812.4 3,834.0Gas turbines stationsStesen Arangbatu 0.0 0.0 0.0 0.0 0.0Coal stationsLain-lain 105.0 158.0 173.0 163.0 206.0OthersJumlah 4,740.0 5,105.4 5,514.0 5,846.7 6,003.3Total
Juta KWH / Million KWH
157
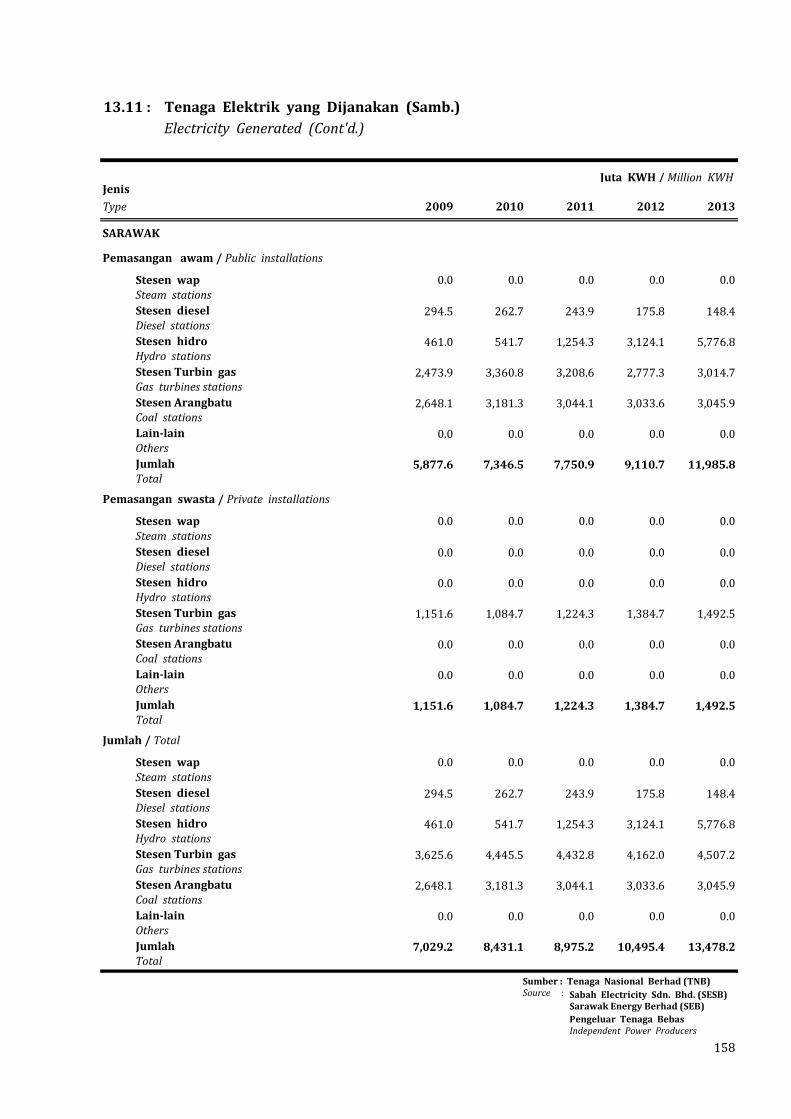
13.11 : Tenaga Elektrik yang Dijanakan (Samb.) Electricity Generated (Cont'd.)
JenisType 2009 2010 2011 2012 2013
SARAWAK
Pemasangan awam / Public installations
Stesen wap 0.0 0.0 0.0 0.0 0.0Steam stationsStesen diesel 294.5 262.7 243.9 175.8 148.4Diesel stationsStesen hidro 461.0 541.7 1,254.3 3,124.1 5,776.8Hydro stationsStesen Turbin gas 2,473.9 3,360.8 3,208.6 2,777.3 3,014.7Gas turbines stationsStesen Arangbatu 2,648.1 3,181.3 3,044.1 3,033.6 3,045.9Coal stationsLain-lain 0.0 0.0 0.0 0.0 0.0OthersJumlah 5,877.6 7,346.5 7,750.9 9,110.7 11,985.8Total
Pemasangan swasta / Private installations
Stesen wap 0.0 0.0 0.0 0.0 0.0Steam stationsStesen diesel 0.0 0.0 0.0 0.0 0.0Diesel stationsStesen hidro 0.0 0.0 0.0 0.0 0.0Hydro stationsStesen Turbin gas 1,151.6 1,084.7 1,224.3 1,384.7 1,492.5Gas turbines stationsStesen Arangbatu 0.0 0.0 0.0 0.0 0.0Coal stationsLain-lain 0.0 0.0 0.0 0.0 0.0OthersJumlah 1,151.6 1,084.7 1,224.3 1,384.7 1,492.5Total
Jumlah / Total
Stesen wap 0.0 0.0 0.0 0.0 0.0Steam stationsStesen diesel 294.5 262.7 243.9 175.8 148.4Diesel stationsStesen hidro 461.0 541.7 1,254.3 3,124.1 5,776.8Hydro stationsStesen Turbin gas 3,625.6 4,445.5 4,432.8 4,162.0 4,507.2Gas turbines stationsStesen Arangbatu 2,648.1 3,181.3 3,044.1 3,033.6 3,045.9Coal stationsLain-lain 0.0 0.0 0.0 0.0 0.0OthersJumlah 7,029.2 8,431.1 8,975.2 10,495.4 13,478.2Total
158
Juta KWH / Million KWH
Sumber : Tenaga Nasional Berhad (TNB) Source : Sabah Electricity Sdn. Bhd. (SESB)
Sarawak Energy Berhad (SEB) Pengeluar Tenaga Bebas Independent Power Producers

13.12: Tenaga Elektrik yang Dibekalkan dan Digunakan Electricity Supplied and Consumed
Transaksi Unit Nilai Unit Nilai Unit NilaiTransaction Unit Value Unit Value Unit Value
Juta KWH RM Juta Juta KWH RM Juta Juta KWH RM JutaMillion KWH RM Million Million KWH RM Million Million KWH RM Million
MALAYSIA
Tenaga elektrik yang dijana 118,788.4 n.a. 125,245.3 n.a. 132,069.8 n.a.Electricity generated
Tenaga elektrik yang diimport 324.1 156.2 1.1 0.8 4.2 3.1Electricity imported
Jumlah bekalan 119,112.5 n.a. 125,246.3 n.a. 132,074.0 n.a.Total supply
Kegunaan tenaga elektrik :Consumption of electricity :
Kegunaan sendiri oleh 2,026.0 n.a. 2,349.5 n.a. 2,461.4 n.a.pemasangan swastaOwn consumption by privateinstallations
Edaran oleh pemasangan awam mengikut jenis pengguna :Distribution by public installations by type of consumers :
(i) Kediaman 21,671.8 6,051.9 23,321.5 6,728.2 24,853.6 7,229.3Domestic
(ii) Perniagaan 35,343.6 13,527.2 37,167.1 14,900.2 39,064.8 15,558.3Commercial
(iii) Perindustrian 46,276.6 13,321.2 47,438.8 14,127.0 50,736.0 14,723.1Industrial
(iv) Lampu awam 1,260.6 283.1 1,366.7 311.0 1,433.9 325.5Public lighting
(v) Jumlah 104,552.6 33,183.5 109,294.0 36,066.4 116,088.3 37,836.3Total
Tenaga elektrik yang dieksport 10.2 9.0 12.6 10.7 17.4 18.3Electricity exported
Kehilangan dalam pancaran dan 12,523.7 n.a. 13,590.2 n.a. 13,506.9 n.a.perbezaan perangkaanLosses in transmissions andstatistical discrepancies
Jumlah 119,112.5 n.a. 125,246.3 n.a. 132,074.0 n.a.Total
2011 2012 2013
159
13.12: Tenaga Elektrik yang Dibekalkan dan Digunakan (Samb.) Electricity Supplied and Consumed (Cont'd.)
Transaksi Unit Nilai Unit Nilai Unit NilaiTransaction Unit Value Unit Value Unit Value
Juta KWH RM Juta Juta KWH RM Juta Juta KWH RM JutaMillion KWH RM Million Million KWH RM Million Million KWH RM Million
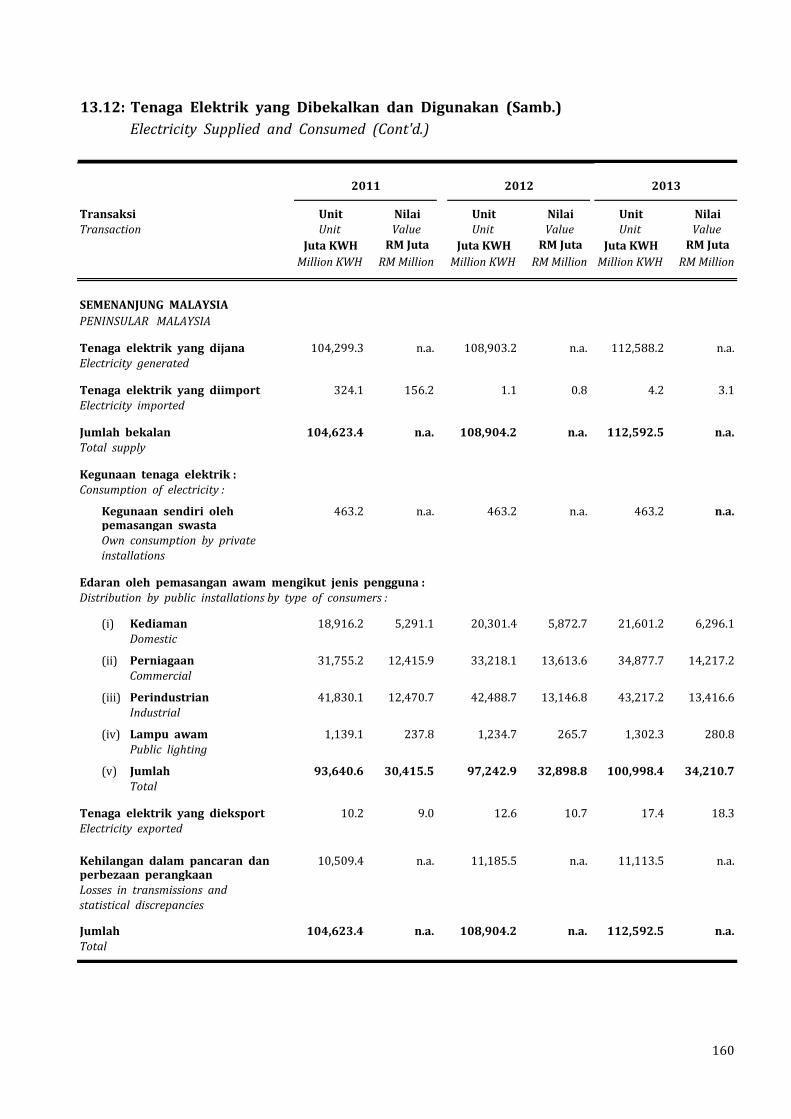
SEMENANJUNG MALAYSIAPENINSULAR MALAYSIA
Tenaga elektrik yang dijana 104,299.3 n.a. 108,903.2 n.a. 112,588.2 n.a.Electricity generated
Tenaga elektrik yang diimport 324.1 156.2 1.1 0.8 4.2 3.1Electricity imported
Jumlah bekalan 104,623.4 n.a. 108,904.2 n.a. 112,592.5 n.a.Total supply
Kegunaan tenaga elektrik :Consumption of electricity :
Kegunaan sendiri oleh 463.2 n.a. 463.2 n.a. 463.2 n.a.pemasangan swastaOwn consumption by privateinstallations
Edaran oleh pemasangan awam mengikut jenis pengguna :Distribution by public installations by type of consumers :
(i) Kediaman 18,916.2 5,291.1 20,301.4 5,872.7 21,601.2 6,296.1Domestic
(ii) Perniagaan 31,755.2 12,415.9 33,218.1 13,613.6 34,877.7 14,217.2Commercial
(iii) Perindustrian 41,830.1 12,470.7 42,488.7 13,146.8 43,217.2 13,416.6Industrial
(iv) Lampu awam 1,139.1 237.8 1,234.7 265.7 1,302.3 280.8Public lighting
(v) Jumlah 93,640.6 30,415.5 97,242.9 32,898.8 100,998.4 34,210.7Total
Tenaga elektrik yang dieksport 10.2 9.0 12.6 10.7 17.4 18.3Electricity exported
Kehilangan dalam pancaran dan 10,509.4 n.a. 11,185.5 n.a. 11,113.5 n.a.perbezaan perangkaanLosses in transmissions andstatistical discrepancies
Jumlah 104,623.4 n.a. 108,904.2 n.a. 112,592.5 n.a.Total
2011 2012 2013
160

13.12: Tenaga Elektrik yang Dibekalkan dan Digunakan (Samb.) Electricity Supplied and Consumed (Cont'd.)
Transaksi Unit Nilai Unit Nilai Unit NilaiTransaction Unit Value Unit Value Unit Value
Juta KWH RM Juta Juta KWH RM Juta Juta KWH RM JutaMillion KWH RM Million Million KWH RM Million Million KWH RM Million
SABAH
Tenaga elektrik yang dijana 5,514.0 n.a. 5,846.7 n.a. 6,003.3 n.a.Electricity generated
Tenaga elektrik yang diimport 0.0 0.0 0.0 0.0 0.0 0.0Electricity imported
Jumlah bekalan 5,514.0 n.a. 5,846.7 n.a. 6,003.3 n.a.Total supply
Kegunaan tenaga elektrik :Consumption of electricity :
Kegunaan sendiri oleh 338.6 n.a. 501.6 n.a. 505.8 n.a.pemasangan swastaOwn consumption by privateinstallations
Edaran oleh pemasangan awam mengikut jenis pengguna :Distribution by public installations by type of consumers :
(i) Kediaman 1,332.0 317.0 1,436.0 361.0 1,530.0 395.0Domestic
(ii) Perniagaan 1,742.0 534.0 1,923.0 639.0 2,018.0 648.0Commercial
(iii) Perindustrian 1,146.0 290.0 1,038.0 294.0 1,062.0 306.0Industrial
(iv) Lampu awam 55.0 14.0 59.0 11.0 60.0 11.0Public lighting
(v) Jumlah 4,275.0 1,155.0 4,456.0 1,305.0 4,670.0 1,360.0Total
Tenaga elektrik yang dieksport 0.0 0.0 0.0 0.0 0.0 0.0Electricity exported
Kehilangan dalam pancaran dan 900.4 n.a. 889.1 n.a. 827.6 n.a.perbezaan perangkaanLosses in transmissions andstatistical discrepancies
Jumlah 5,514.0 n.a. 5,846.7 n.a. 6,003.3 n.a.Total
2011 2012 2013
161
13.12: Tenaga Elektrik yang Dibekalkan dan Digunakan (Samb.) Electricity Supplied and Consumed (Cont'd.)
Transaksi Unit Nilai Unit Nilai Unit NilaiTransaction Unit Value Unit Value Unit Value
Juta KWH RM Juta Juta KWH RM Juta Juta KWH RM JutaMillion KWH RM Million Million KWH RM Million Million KWH RM Million
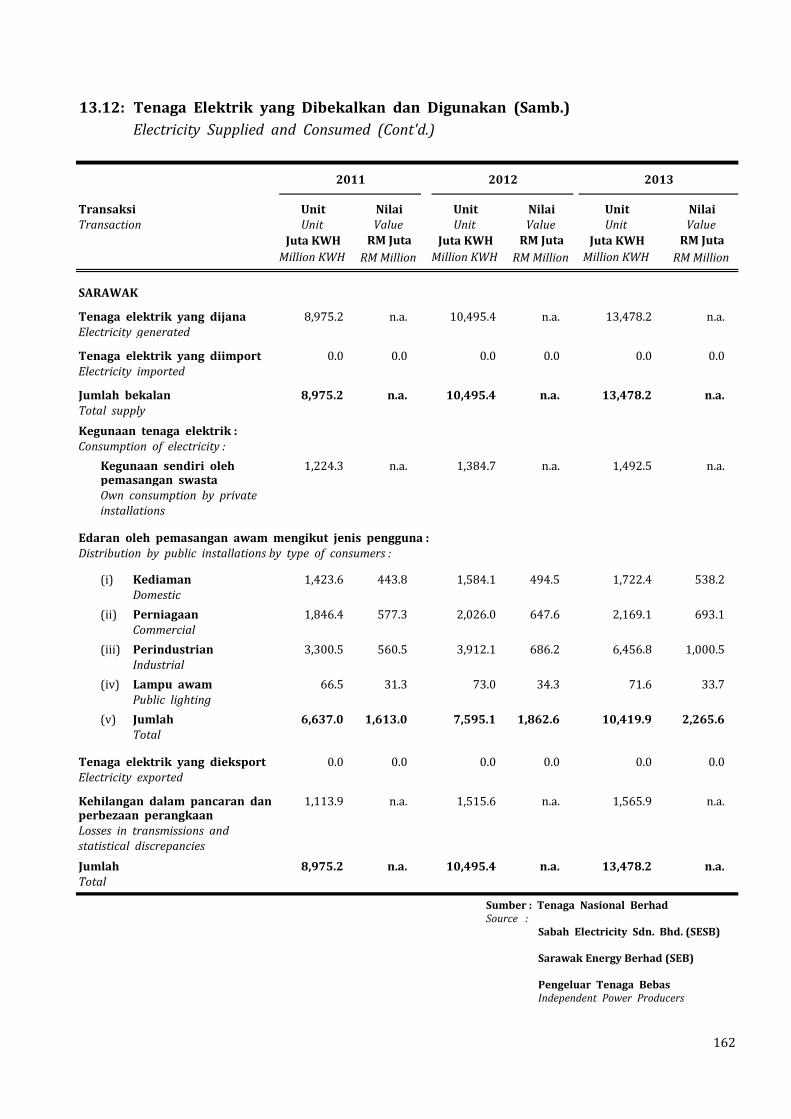
SARAWAK
Tenaga elektrik yang dijana 8,975.2 n.a. 10,495.4 n.a. 13,478.2 n.a.Electricity generated
Tenaga elektrik yang diimport 0.0 0.0 0.0 0.0 0.0 0.0Electricity imported
Jumlah bekalan 8,975.2 n.a. 10,495.4 n.a. 13,478.2 n.a.Total supply
Kegunaan tenaga elektrik :Consumption of electricity :
Kegunaan sendiri oleh 1,224.3 n.a. 1,384.7 n.a. 1,492.5 n.a.pemasangan swastaOwn consumption by privateinstallations
Edaran oleh pemasangan awam mengikut jenis pengguna :Distribution by public installations by type of consumers :
(i) Kediaman 1,423.6 443.8 1,584.1 494.5 1,722.4 538.2Domestic
(ii) Perniagaan 1,846.4 577.3 2,026.0 647.6 2,169.1 693.1Commercial
(iii) Perindustrian 3,300.5 560.5 3,912.1 686.2 6,456.8 1,000.5Industrial
(iv) Lampu awam 66.5 31.3 73.0 34.3 71.6 33.7Public lighting
(v) Jumlah 6,637.0 1,613.0 7,595.1 1,862.6 10,419.9 2,265.6Total
Tenaga elektrik yang dieksport 0.0 0.0 0.0 0.0 0.0 0.0Electricity exported
Kehilangan dalam pancaran dan 1,113.9 n.a. 1,515.6 n.a. 1,565.9 n.a.perbezaan perangkaanLosses in transmissions andstatistical discrepancies
Jumlah 8,975.2 n.a. 10,495.4 n.a. 13,478.2 n.a.Total
2011 2012 2013
162
Sumber : Tenaga Nasional Berhad Source : Sabah Electricity Sdn. Bhd. (SESB) Sarawak Energy Berhad (SEB) Pengeluar Tenaga Bebas Independent Power Producers

13.13: Indeks Pengeluaran Perindustrian Index of Industrial Production (2010 = 100)
%Keterangan Bahagian Wajaran 2010 2011 2012 2013 PerubahanDivision Description Weights Change
2013/2012
Indeks keseluruhan 100.00 100.0 102.4 106.7 110.3 3.37Overall index
Perlombongan 28.92 100.0 94.8 96.2 97.0 0.9Mining
Pembuatan 65.89 100.0 105.7 111.3 116.0 4.2Manufacturing
Elektrik 5.19 100.0 102.0 107.2 113.1 5.4 Electricity
163

13.14: Indeks Pengeluaran Perindustrian - Sektor Pembuatan Index of Industrial Production - Manufacturing Sector (2010 = 100)
%Kumpulan Wajaran 2010 2011 2012 2013 PerubahanGroup Weights Change
2013/2012
Pembuatan 65.89 100.0 105.7 111.3 116.0 3.4Manufacturing
1 Pembuatan minyak dan lemak 3.92 100.0 111.7 106.2 114.4 7.8daripada sayuran dan haiwanManufacture of vegetable and animal oils and fats
2 Pembuatan produk tenusu 0.40 100.0 101.0 135.7 147.5 8.7Manufacture of dairy products
3 Pembuatan produk bijian, kanji dan produk berkanji 0.23 100.0 107.0 106.8 111.4 4.3Manufacture of grain mill products, starches and starch products
4 Pembuatan produk makanan lain 1.83 100.0 111.0 108.2 110.7 2.3Manufacture of other food products
5 Pembuatan minuman ringan 0.64 100.0 109.0 105.6 103.3 -2.1Manufacture of beverages
6 Pembuatan produk tembakau 0.35 100.0 111.8 123.6 101.3 -18.0Manufacture of tobacco products
7 Pemintalan, penenunan dan penyiapan tekstil 0.37 100.0 102.0 102.3 89.9 -12.1Spinning, weaving and finishing of textiles
8 Pembuatan pakaian, kecuali pakaian berbulu 0.39 100.0 122.2 100.9 104.1 3.3Manufacture of wearing apparel, except fur apparel
9 Penyamakan dan pembersihan kulit, pembuatan 0.02 100.0 121.5 138.5 139.4 0.6bagasi, beg tangan, pelana dan abah-abah pembersihan pewarnaan buluTanning and dressing of leather; manufacture of luggage, handbags, saddlery and harness; dressing and dyeing of fur
10 Pembuatan kasut 0.08 100.0 119.1 130.4 142.1 9.0Manufacture of footwear
11 Pengilangan dan pengetaman kayu 0.38 100.0 94.5 108.2 119.2 10.1Sawmilling and planning of wood
12 Pembuatan produk daripada kayu, gabus, jerami dan 1.36 100.0 96.0 93.3 93.5 0.3bahan jalinan lainManufacture of products of wood, cork, straw and plaiting materials
13 Pembuatan kertas dan produk kertas 1.06 100.0 106.0 111.2 116.0 4.3Manufacture of paper and paper products
14 Percetakan dan aktiviti perkhidmatan berkaitan percetakan 0.91 100.0 113.6 114.9 114.8 -0.1Printing and service activities related to printing
15 Pembuatan produk petroleum bertapis 13.87 100.0 103.4 108.3 108.5 0.2Manufacture of refined petroleum products
164

13.14: Indeks Pengeluaran Perindustrian - Sektor Pembuatan (Samb.) Index of Industrial Production - Manufacturing Sector (Cont'd.) (2010 = 100)
%Kumpulan Wajaran 2010 2011 2012 2013 PerubahanGroup Weights Change
2013/2012
16 Pembuatan kimia asas, baja dan sebatian nitrogen, 5.59 100.0 100.3 108.7 101.4 -6.7plastik dan getah sintetik dalam bentuk primerManufacture of basic chemicals, fertilizer and nitrogencompounds, plastic and synthetic rubber in primary forms
17 Pembuatan produk kimia lain 1.32 100.0 121.9 128.2 144.4 12.6Manufacture of other chemical products
18 Pembuatan produk farmaseutikal, 0.29 100.0 132.1 156.0 154.3 -1.1kimia perubatan dan botaniManufacture of pharmaceuticals, medicinal chemical and botanical products
19 Pembuatan produk getah 2.06 100.0 115.3 117.4 124.4 5.9Manufacture of rubber products
20 Pembuatan produk plastik 2.24 100.0 124.3 146.7 152.2 3.7Manufacture of plastics products
21 Pembuatan kaca dan produk kaca 0.70 100.0 111.1 96.1 86.8 -9.7Manufacture of glass and glass products
22 Pembuatan pengeluaran galian bukan logam t.t.t.l. 2.05 100.0 112.5 122.0 124.6 2.1Manufacture of non-metallic mineral products n.e.c.
23 Pembuatan besi dan keluli asas 1.75 100.0 103.7 97.8 102.7 4.9Manufacture of basic iron and steel
24 Pembuatan logam asas berharga dan logam bukan ferus lain 0.90 100.0 99.1 90.6 90.6 0.0Manufacture of basic precious and other non-ferrous metals
25 Pembuatan produk struktur logam, tangki, 0.62 100.0 135.3 164.8 192.0 16.5takungan dan penjana wapManufacture of structural metal products, tanks, reservoirs and steam generators
26 Pembuatan produk lain yang direka daripada 1.44 100.0 116.1 127.4 140.0 9.8 logam; aktiviti perkhidmatan kerja logamManufacture of other fabricated metal products; metal working service activities
27 Pembuatan komponen dan papan elektronik 7.65 100.0 100.1 115.9 140.8 21.4Manufacture of electronic components and boards
28 Pembuatan komputer dan kelengkapan peranti 2.40 100.0 83.0 83.6 88.5 5.8Manufacture of computers and peripheral equipment
29 Pembuatan peralatan komunikasi 0.86 100.0 107.2 116.0 120.5 3.8Manufacture of communication equipment
30 Pembuatan peralatan elektronik pengguna 2.22 100.0 99.1 96.4 81.2 -15.8Manufacture of consumer electronics
165

13.14: Indeks Pengeluaran Perindustrian - Sektor Pembuatan (Samb.) Index of Industrial Production - Manufacturing Sector (Cont'd.) (2010 = 100)
%Kumpulan Wajaran 2010 2011 2012 2013 PerubahanGroup Weights Change
2013/2012
31 Pembuatan kelengkapan mengukur, menguji, 0.22 100.0 95.0 113.3 121.6 7.3memandu arah dan kawalan; jam tangan dan jamManufacture of measuring, testing, navigating and control equipment; watches and clocks
32 Pembuatan peralatan penyinaran, perubatan 0.25 100.0 104.2 92.5 102.3 10.6elektro dan elektroterapeutikManufacture of irradiation, electromedical and electrotherapeutic equipment
33 Pembuatan instrumen optikal dan kelengkapan fotografi 0.19 100.0 89.1 90.5 78.8 -12.9Manufacture of optical instruments and photographic equipment
34 Pembuatan motor elektrik, penjana, transformer 0.53 100.0 97.7 98.3 79.8 -18.8dan perkakasan pengagihan dan pengawalan elektrikManufacture of electric motors, generators, transformers and electricity distribution and control apparatus
35 Pembuatan pendawaian dan peranti pendawaian 0.42 100.0 129.1 121.5 145.8 20.0Manufacture of wiring and wiring devices
36 Pembuatan perkakasan domestik 0.24 100.0 117.9 103.8 96.7 -6.8Manufacture of domestic appliances
37 Pembuatan jentera kegunaan umum 1.00 100.0 95.3 86.8 86.6 -0.3Manufacture of general-purpose machinery
38 Pembuatan jentera kegunaan khas 0.59 100.0 118.3 149.3 148.9 -0.3Manufacture of special-purpose machinery
39 Pembuatan kenderaan bermotor 1.47 100.0 125.0 99.6 107.6 8.0Manufacture of motor vehicles
40 Pembuatan alat ganti dan aksesori untuk kenderaan bermotor 1.14 100.0 114.9 102.5 98.6 -3.8Manufacture of parts and accessories for motor vehicles
41 Pembinaan kapal dan bot 0.50 100.0 77.4 159.8 236.4 48.0Building of ships and boats
42 Pembuatan kapal angkasa dan udara dan jentera berkaitan 0.18 100.0 105.2 153.4 177.8 15.9Manufacture of air and spacecraft and related machinery
43 Pembuatan kelengkapan pengangkutan t.t.t.l. 0.23 100.0 109.8 140.4 140.9 0.4Manufacture of transport equipment n.e.c.
44 Pembuatan perabot 0.92 100.0 93.4 115.5 101.4 -12.2Manufacture of furniture
45 Pembaikan pemasangan produk logam, 0.10 100.0 77.6 160.7 237.3 47.6jentera dan kelengkapanRepair of fabricated metal products, machinery and equipment
166


