PEGAS NONWOVENS S.A. - CFA Institute Files/CFA Institute... · PEGAS NONWOVENS S.A. Team H January...
25
PEGAS NONWOVENS S.A. Team H January 28, 2015
Transcript of PEGAS NONWOVENS S.A. - CFA Institute Files/CFA Institute... · PEGAS NONWOVENS S.A. Team H January...
PEGAS NONWOVENS S.A.
Team H
January 28, 2015
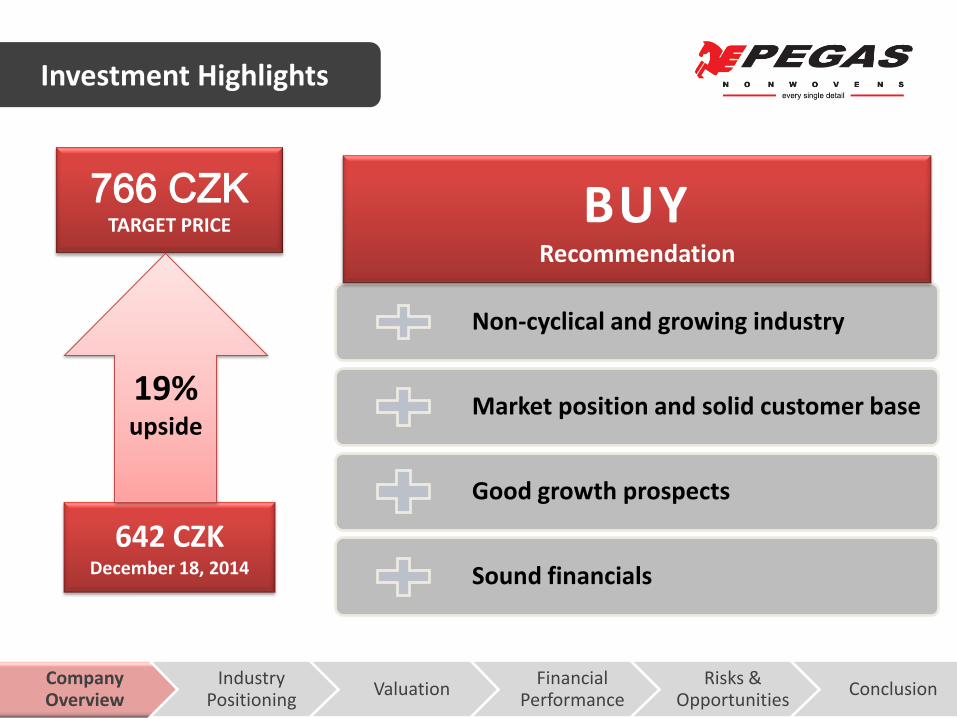
642 CZK December 18, 2014
766 CZK TARGET PRICE
19% upside
Non-cyclical and growing industry
Market position and solid customer base
Good growth prospects
Sound financials
Company Overview
Industry Positioning
Valuation Financial
Performance Risks &
Opportunities Conclusion
Investment Highlights
BUY Recommendation

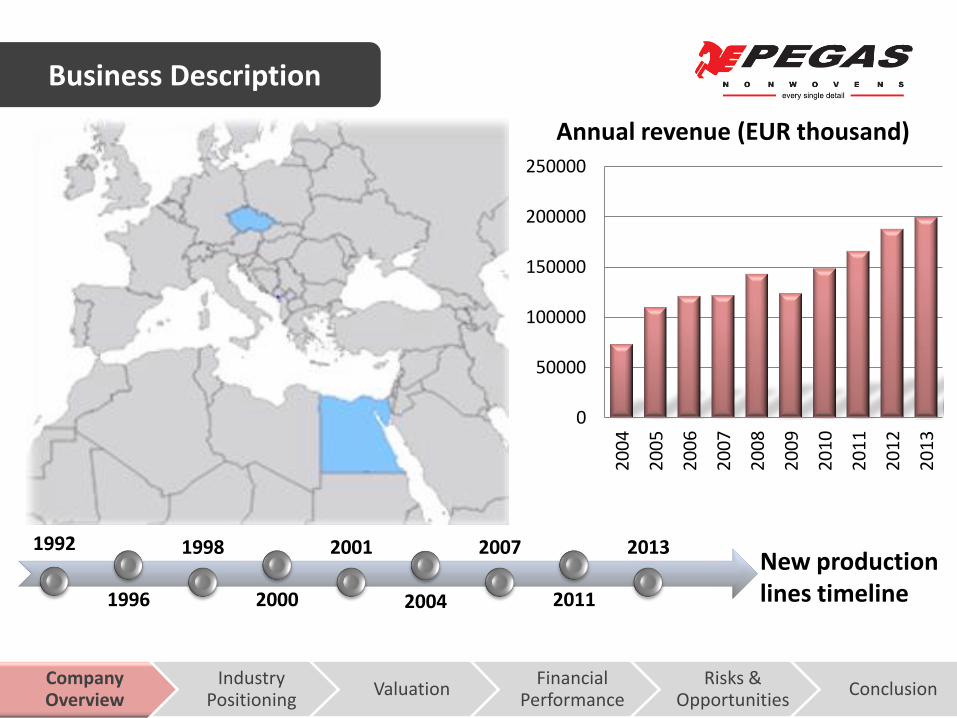
Business Description

Introduction
Revenue Breakdown by Product (% of sales 2013)
Company Overview
Industry Positioning
Valuation Financial
Performance Risks &
Opportunities Conclusion
Hygiene Commodity
Hygiene – Technologically Advanced
Non-hygiene
Leading nonwoven textile producer in the
Europe, Middle East and Africa market
Market Profile (ticker PGSNsp.PR)
Closing price 18/12/2014 (CZK) 642
52-week price range (CZK) 588.50 – 659.80
Average daily volume 6,191
As % of shares outstanding 0.0671%
Free float 100%
Market capitalization (CZK mil) 5,999.110
Hygiene sector: baby diapers, feminine and adult incontinence products
Company Overview
Industry Positioning
Valuation Financial
Performance Risks &
Opportunities Conclusion
Business Description
Annual revenue (EUR thousand)
1992
1996
1998
2000
2001
2004
2007
2011
2013
0
50000
100000
150000
200000
250000
20
04
20
05
20
06
20
07
20
08
20
09
20
10
20
11
20
12
20
13
New production lines timeline
Industry Overview & Competitive Positioning
Company Overview
Industry Positioning
Valuation Financial
Performance Risks &
Opportunities Conclusion
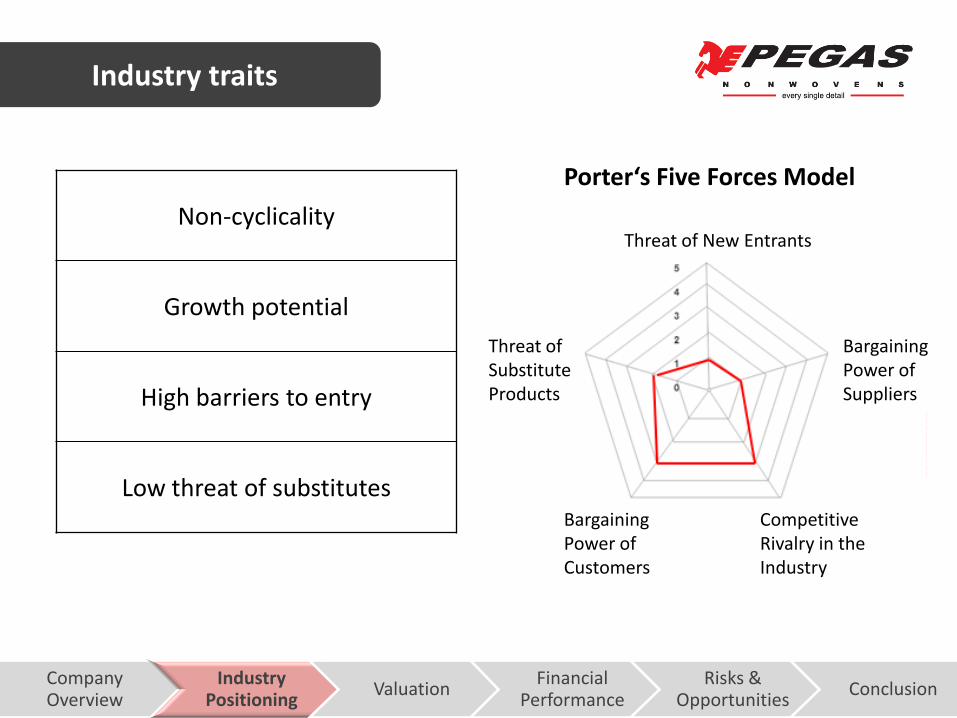
Industry traits
Threat of New Entrants
Threat of Substitute Products
Bargaining Power of Customers
Bargaining Power of Suppliers
Competitive Rivalry in the Industry
Porter‘s Five Forces Model
Non-cyclicality
Growth potential
High barriers to entry
Low threat of substitutes
Company Overview
Industry Positioning
Valuation Financial
Performance Risks &
Opportunities Conclusion
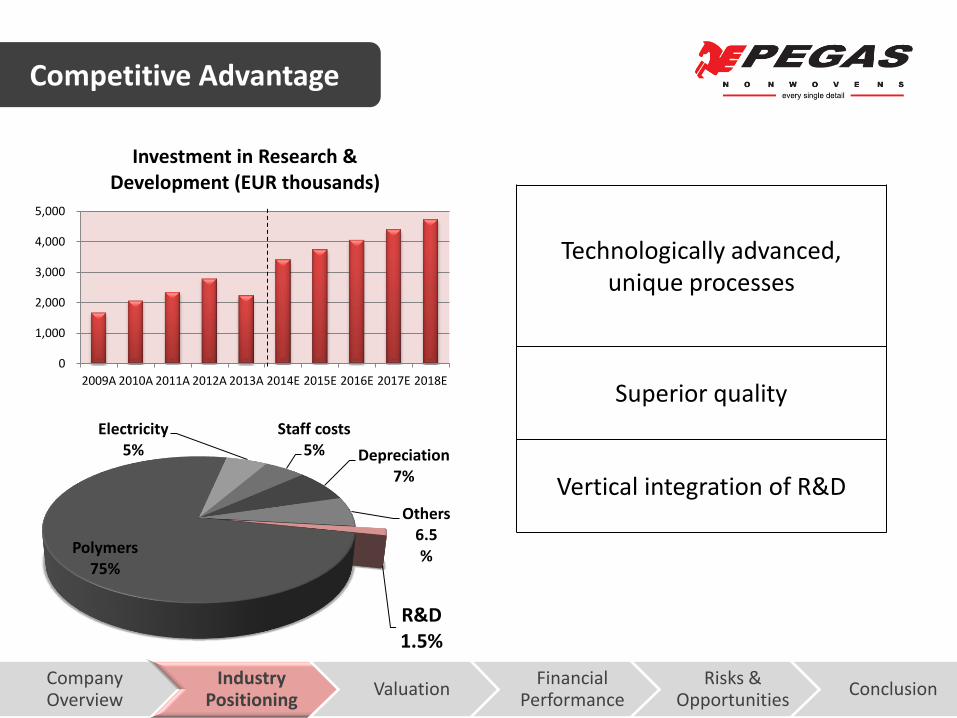
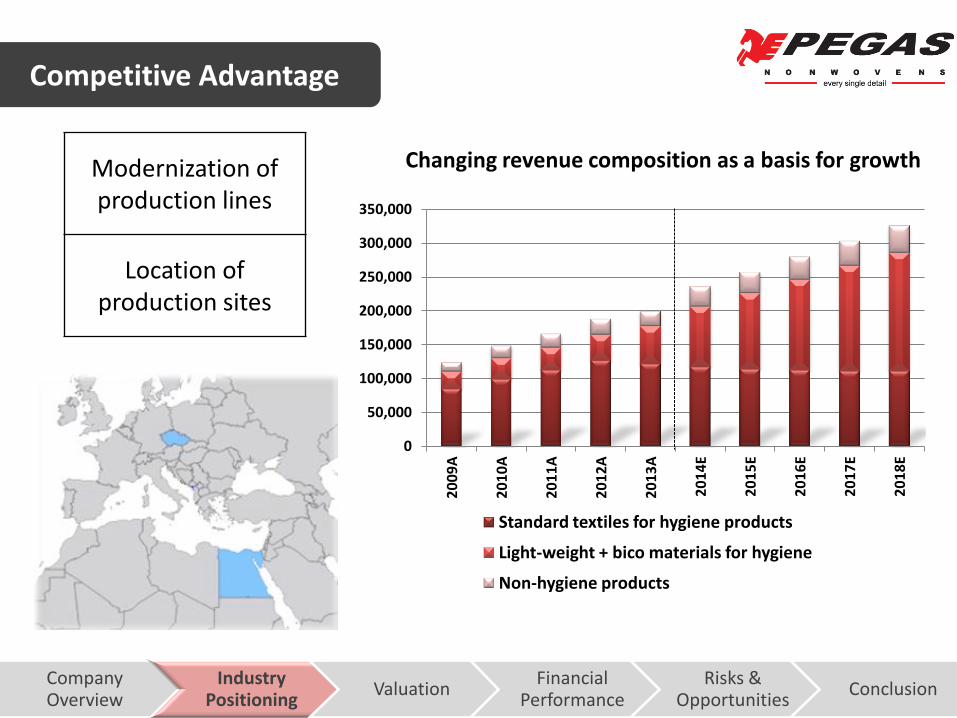
Competitive Advantage
0
1,000
2,000
3,000
4,000
5,000
2009A 2010A 2011A 2012A 2013A 2014E 2015E 2016E 2017E 2018E
Investment in Research & Development (EUR thousands)
Polymers 75%
Electricity 5%
Staff costs 5% Depreciation
7%
Others 6.5 %
R&D 1.5%
Technologically advanced, unique processes
Superior quality
Vertical integration of R&D
Company Overview
Industry Positioning
Valuation Financial
Performance Risks &
Opportunities Conclusion
Competitive Advantage
0
50,000
100,000
150,000
200,000
250,000
300,000
350,000
20
09
A
20
10
A
20
11
A
20
12
A
20
13
A
20
14
E
20
15
E
20
16
E
20
17
E
20
18
E
Standard textiles for hygiene products
Light-weight + bico materials for hygiene
Non-hygiene products
Modernization of production lines
Location of production sites
Changing revenue composition as a basis for growth
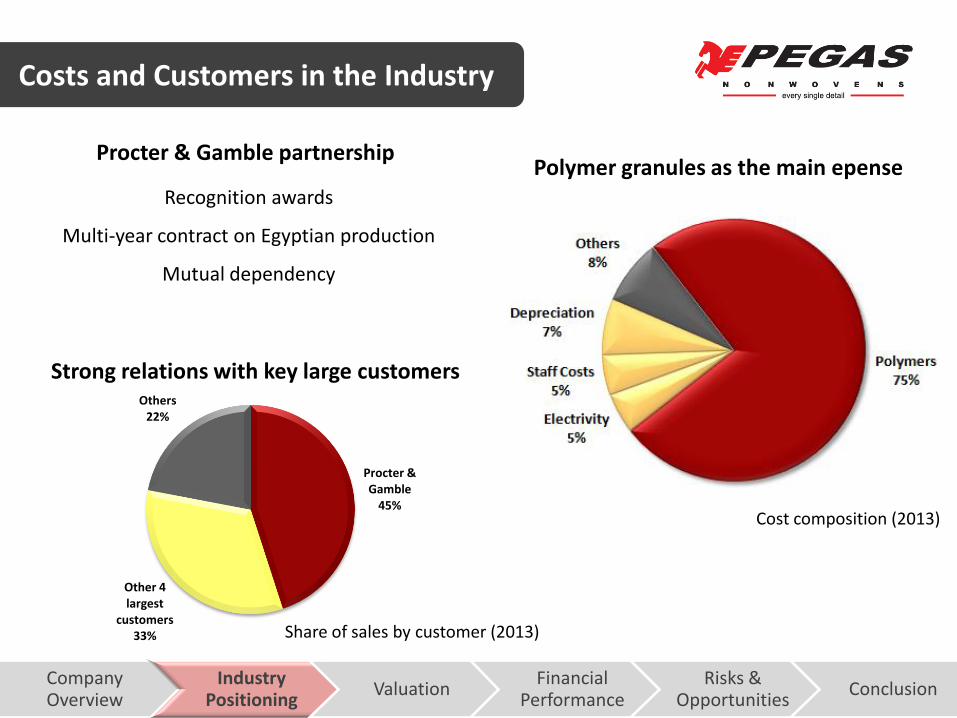
Procter & Gamble partnership
Cost composition (2013)
Company Overview
Industry Positioning
Valuation Financial
Performance Risks &
Opportunities Conclusion
Costs and Customers in the Industry
Procter & Gamble
45%
Other 4 largest
customers 33%
Others 22%
Polymer granules as the main epense
Share of sales by customer (2013)
Strong relations with key large customers
Recognition awards
Multi-year contract on Egyptian production
Mutual dependency

Valuation
Company Overview
Industry Positioning
Valuation Financial
Performance Risks &
Opportunities Conclusion
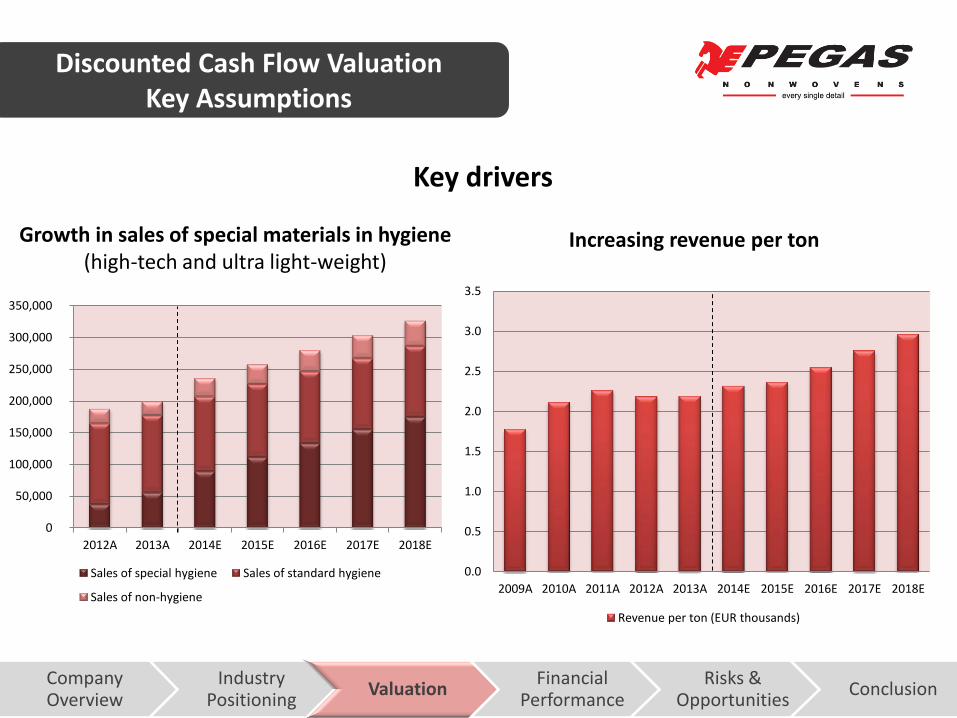
Discounted Cash Flow Valuation Key Assumptions
Key drivers
0.0
0.5
1.0
1.5
2.0
2.5
3.0
3.5
2009A 2010A 2011A 2012A 2013A 2014E 2015E 2016E 2017E 2018E
Increasing revenue per ton
Revenue per ton (EUR thousands)
Growth in sales of special materials in hygiene (high-tech and ultra light-weight)
0
50,000
100,000
150,000
200,000
250,000
300,000
350,000
2012A 2013A 2014E 2015E 2016E 2017E 2018E
Sales of special hygiene Sales of standard hygiene
Sales of non-hygiene
Company Overview
Industry Positioning
Valuation Financial
Performance Risks &
Opportunities Conclusion
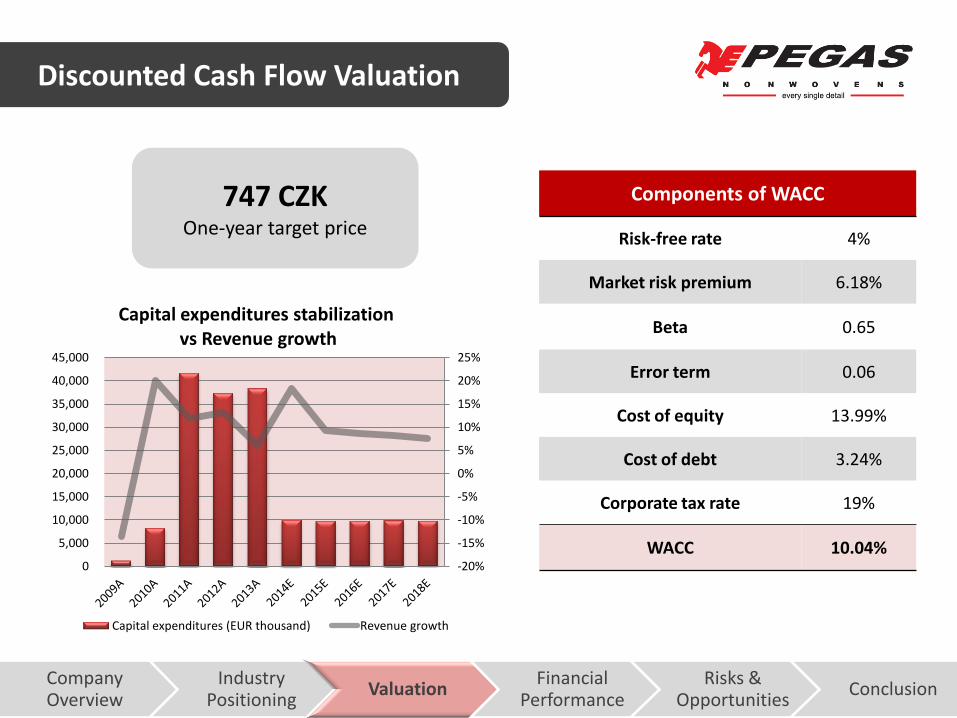
Discounted Cash Flow Valuation
-20%
-15%
-10%
-5%
0%
5%
10%
15%
20%
25%
0
5,000
10,000
15,000
20,000
25,000
30,000
35,000
40,000
45,000
Capital expenditures stabilization vs Revenue growth
Capital expenditures (EUR thousand) Revenue growth
747 CZK One-year target price
Components of WACC
Risk-free rate 4%
Market risk premium 6.18%
Beta 0.65
Error term 0.06
Cost of equity 13.99%
Cost of debt 3.24%
Corporate tax rate 19%
WACC 10.04%

Price/Earnings EV/EBITDA Price/Book
value
13.2 9.0 1.85
890 CZK 778 CZK 764 CZK
Multiples Valuation
Company Overview
Industry Positioning
Valuation Financial
Performance Risks &
Opportunities Conclusion
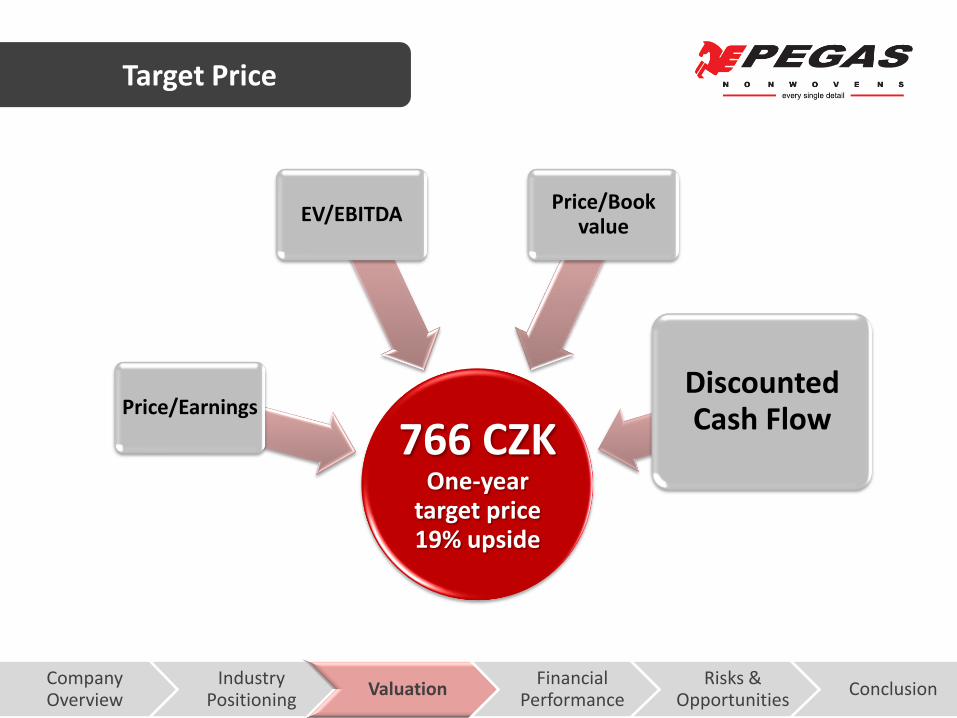
766 CZK One-year
target price 19% upside
Price/Earnings
EV/EBITDA Price/Book
value
Discounted Cash Flow
Company Overview
Industry Positioning
Valuation Financial
Performance Risks &
Opportunities Conclusion
Target Price
Financial Performance
Company Overview
Industry Positioning
Valuation Financial
Performance Risks &
Opportunities Conclusion
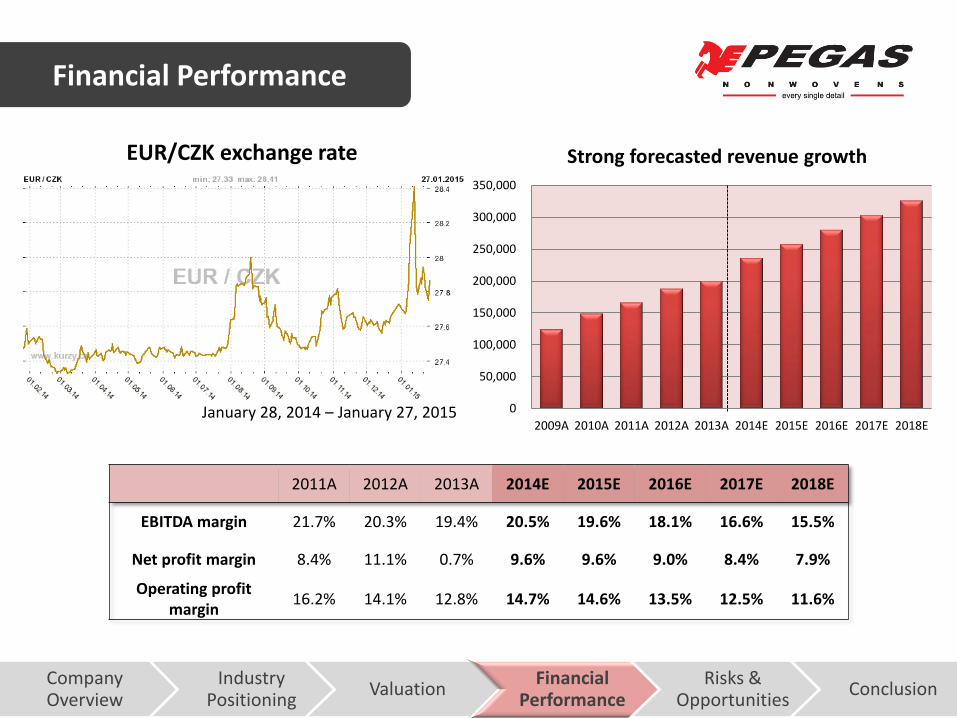
Financial Performance
0
50,000
100,000
150,000
200,000
250,000
300,000
350,000
2009A 2010A 2011A 2012A 2013A 2014E 2015E 2016E 2017E 2018E
Strong forecasted revenue growth EUR/CZK exchange rate
January 28, 2014 – January 27, 2015
2011A 2012A 2013A 2014E 2015E 2016E 2017E 2018E
EBITDA margin 21.7% 20.3% 19.4% 20.5% 19.6% 18.1% 16.6% 15.5%
Net profit margin 8.4% 11.1% 0.7% 9.6% 9.6% 9.0% 8.4% 7.9%
Operating profit margin
16.2% 14.1% 12.8% 14.7% 14.6% 13.5% 12.5% 11.6%

Company Overview
Industry Positioning
Valuation Financial
Performance Risks &
Opportunities Conclusion
Financial Performance
0.00
0.50
1.00
1.50
2.00
2.50
2009A 2010A 2011A 2012A 2013A 2014E 2015E 2016E 2017E 2018E
Progressive dividend policy
Gross dividend (EUR/share)
0%
50%
100%
150%
200%
250%
300%
350%
400%
450%
2012A 2013A 2014E 2015E 2016E 2017E 2018E
125,000
130,000
135,000
140,000
145,000
150,000
155,000
160,000
165,000
Decrease in long term debt levels
Long term debt Debt as % of EBITDA

Risk Analysis
Company Overview
Industry Positioning
Valuation Financial
Performance Risks &
Opportunities Conclusion
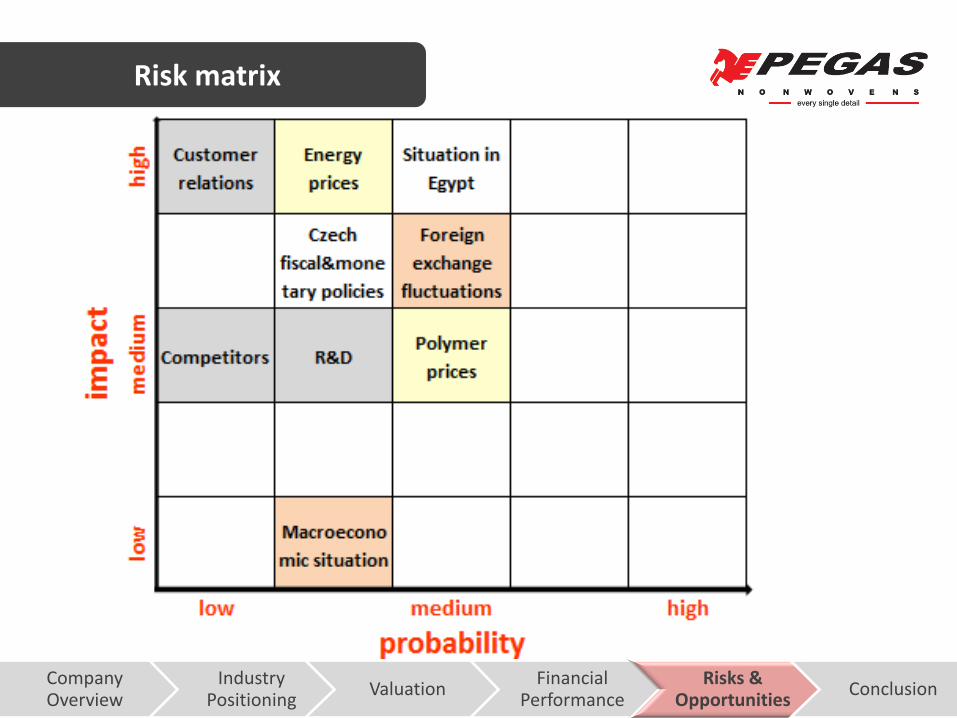
Risk matrix

100%
78%
45%
• all customers
• 5 customers
• 1 customer
Sensitivity of the target price to energy and staff costs
Composition of customers as % of sales (2013)
Company Overview
Industry Positioning
Valuation Financial
Performance Risks &
Opportunities Conclusion
Key Customers and Costs
Importance of the large corporate customers

Company Overview
Industry Positioning
Valuation Financial
Performance Risks &
Opportunities Conclusion
Expansion to Egypt: Upside Risk
642 CZK December 18, 2014
19% upside
827 CZK UPSIDE TARGET PRICE
766 CZK TARGET PRICE
29% upside
Upside scenario: annual revenue (EUR thousand)
Conclusion

BUY
Industry traits
non-cyclicality and growth
Competitive position
location of production sites, innovation and quality,
customer relations
Strong performance
financial performance, constant growth, dividend
payouts
Expansion in Egypt
Company Overview
Industry Positioning
Valuation Financial
Performance Risks &
Opportunities Conclusion
Conclusion

Thank you for your attention!
Team H
January 28, 2015