PEFA: What is it good for? - Overseas Development … · Key messages • The Public Expenditure...
24
PEFA: What is it good for? The role of PEFA assessments in public financial management reform Sierd Hadley and Mark Miller Discussion Paper April 2016
Transcript of PEFA: What is it good for? - Overseas Development … · Key messages • The Public Expenditure...

PEFA: What is it good for? The role of PEFA assessments in public financial management reform Sierd Hadley and Mark Miller
Discussion Paper
April 2016

Overseas Development Institute203 Blackfriars RoadLondon SE1 8NJ
Tel. +44 (0) 20 7922 0300 Fax. +44 (0) 20 7922 0399 E-mail: [email protected]
www.odi.org www.odi.org/facebook www.odi.org/twitter
Readers are encouraged to reproduce material from ODI Reports for their own publications, as long as they are not being sold commercially. As copyright holder, ODI requests due acknowledgement and a copy of the publication. For online use, we ask readers to link to the original resource on the ODI website. The views presented in this paper are those of the author(s) and do not necessarily represent the views of ODI.
© Overseas Development Institute 2016. This work is licensed under a Creative Commons Attribution-NonCommercial Licence (CC BY-NC 4.0).
Cover photo: Ollivier Girard, CIFOR/2012. Territorial Administrator of Lukolela
ODI Discussion Paper2
Key messages• The Public Expenditure and Financial Accountability
(PEFA) framework has been hugely successful inharmonising approaches to public financial management(PFM) systems in developing countries, and remains themost comprehensive indicator of PFM to date.
• However, not all elements of the framework areuniversally relevant, and indicators do not alwayscapture which systems are not working or why.
• Despite guidance from its Secretariat, PEFA ratingscontinue to be used as an end in themselves – todetermine what systems should look like.
• As the influence of the PEFA framework has grown,so have the incentives to implement reforms thatchange how the system looks but not how well itfunctions.
• PEFA ratings should be just one input in any reformprocess. More could be done to interpret whichratings matter in each national context, and why.
• More broadly, there is a need to revisit and rigorouslyevaluate the effectiveness of donors’ approaches tosupporting PFM reform.
Acknowledgements
The authors would like to thank Paolo de Renzio and Simon Gill for their time in providing peer review comments. We also thank Philipp Krause, Hamish Nixon, Bryn Welham, Tom Hart and Shakira Mustapha for their helpful comments, as well as Carole Pretorius and Mary Betley for early inputs. Any remaining errors are the sole responsibility of the authors.
This research was funded by the Overseas Development Institute’s Budget Strengthening Initiative. Philipp Krause oversaw the research. Richard Hughes provided programming support. Julia Hanne oversaw the production of the paper and Deborah Eade provided editorial support.
PEFA: What is it good for? 3

Abbreviations and acronyms CABRI Collaborative Africa Budget Reform Initiative
DeMPA Debt Management Performance Assessment
DRC Democratic Republic of the Congo
EIP Effective Institutions Platform
EU European Union
GFS Government Finance Statistics
IMF International Monetary Fund
IPSAS International Public Sector Accounting Standards
MTEF Medium-term expenditure framework
ODI Overseas Development Institute
OECD Organisation for Economic Co-operation and Development
PEFA Public Expenditure and Financial Accountability framework
PER Public Expenditure Review
PETS Public Expenditure Tracking Survey
PFM Public financial management
PI Performance indicator (for PEFA framework)
PIMA Public Investment Management Assessment
TADAT Tax Administration Diagnostic Assessment Tool
UNDP United Nations Development Programme
ODI Discussion Paper4

Contents
Acknowledgements 3
Abbreviations and acronyms 4
Key messages 5
List of figures, tables and boxes 6
1 Introduction: What is PEFA for? 7
2 How does PEFA help to understand PFM systems? 9
2.1 What does PEFA measure? 9
2.2 What does PEFA not measure? 10
2.3 Limited coverage 11
2.4 Measuring form not function 11
2.5 Missing institutions 12
2.6 Why does this matter? 12
3 How is PEFA used (and misused) to prioritise PFM reform? 14
3.1 How PEFA should be used? 14
3.2 How PEFA is misused? 15
4 Conclusion: What can be done to improve PFM reform programmes? 17
4.1 What is driving these behaviours? 17
4.2 How could PEFA be used better? 18
References 20
PEFA: What is it good for? 5

Figures
Figure 1: The growing interest in PFM, fiduciary risk and aid effectiveness 7
Figure 2: The PEFA Framework 10
Figure 3: Three limitations of the PEFA framework and their implications 10
Figure 4: Which PFM functions do PEFA diagnostics really measure? 12
Figure 5: The similarity of PFM reforms in 31 African countries 16
List of figures and boxes
Boxes
Box 1: Missing arrears in Timor-Leste 11
Box 2: Norway’s response to its 2008 PEFA self-assessment 15
Box 3: PEFA influencing PFM reform plans in the Pacific 15
ODI Discussion Paper6

1 Introduction: What is PEFA for?
Figure 1: The growing interest in PFM, fiduciary risk and aid effectiveness
Sha
re o
f wor
ds in
Eng
lish
book
s, b
y ye
ar (1
="pr
ojec
t aid
" sha
re in
198
0)
0.0
0.3
0.6
0.9
1.2
1980 1985 1990 1995 2000 2005
aid effectivenesspublic financial managementfiduciary riskbudget supportproject aid
shar
e of
wor
ds in
Eng
lish
book
s, b
y ye
ar
(1=
“pro
ject
aid
” in
1980
).
PEFA: What is it good for? 7
1 Public Expenditure and Financial Accountability http://www.pefa.org/.
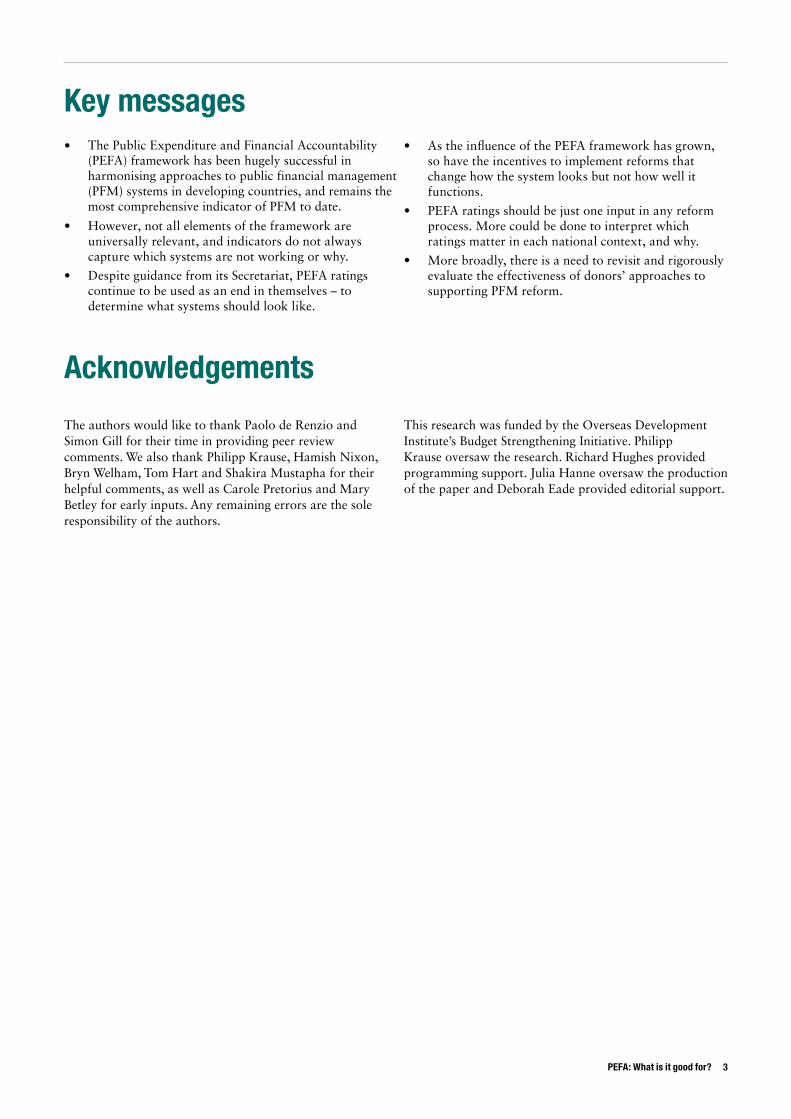
The Public Expenditure and Financial Accountability (PEFA) programme emerged as one part of a multi-donor initiative to come up with a strengthened approach to supporting public financial management (PFM) reform. Views regarding aid effectiveness were changing in the 1990s and 2000s. Project aid was widely deemed to have failed and there were particular concerns that it was undermining the quality of institutions in partner countries. As donors began to provide more budget support (and debt relief) they needed a better understanding of fiduciary risks, because more aid relied on using country systems. They also wanted a better way to check whether the institutional reforms that accompanied budget support were working. Figure 1 tracks the use of these terms in online documents to show how closely the interest in aid effectiveness was followed by interest in PFM.
Initially, many donors developed their own tools to assess fiduciary risks and systems of public expenditure management (including UNDP, IMF, the EU and World Bank). Recipient countries were subject to overlapping missions and an overwhelming number of externally driven, inconsistent recommendations. Multiple reform plans were also designed to provide financial support to implement recommended changes. This all imposed heavy transaction cost on governments in developing countries. These concerns gave rise to a ‘strengthened approach’ to supporting public financial management reform. As summarised on the PEFA website1, this approach embodied three principles:
1. ‘A country-led agenda, i.e. a government-led reform programme for which analytical work, reform design, implementation and monitoring reflect country priorities and are integrated into governments’ institutional structures;
2. A coordinated programme of support from donors and international finance institutions, i.e. in relation to both analytical work, reform financing and technical support for implementation;
3. A shared information pool on public financial management, i.e. information on PFM systems and their performance which is commonly accepted by and shared among the stakeholders at country level, thus avoiding duplicative and inconsistent analytical work.’
The PEFA measurement framework was introduced to harmonise the many diagnostic tools that donors were using (Allen et al., 2004). It was designed with two goals in mind: (i) to strengthen the ability of donors and recipients to assess systems of public expenditure and fiduciary management; and (ii) to support the development and monitoring of reform programmes. It aims to do this in a way that is true to the principles of the Strengthened Approach – as one component of a broader set of changes – and has been hugely influential. Over 500 formal assessments have been undertaken and verified by the PEFA Secretariat since its launch in 2005 (Betley, 2016), covering nearly all developing countries. Today, most development agencies use the PEFA framework as a basis for their diagnostics of PFM systems and assessing associated fiduciary risks (PEFA, 2010).
Source: Usage from Google Books Ngram Viewer (2016)
Sha
re o
f wor
ds in
Eng
lish
book
s, b
y ye
ar (1
="pr
ojec
t aid
" sha
re in
198
0)
0.0
0.3
0.6
0.9
1.2
1980 1985 1990 1995 2000 2005
aid effectivenesspublic financial managementfiduciary riskbudget supportproject aid

The revision of the PEFA framework in 2016 offers an opportune moment to critically revisit this important tool and examine how it has contributed to its stated goals. This discussion paper explores how the framework can both help
and hinder our understanding of systems. It then illustrates how PEFA can be used and misused to guide PFM system reform. It concludes by suggesting future areas of focus to improve the effectiveness of PFM reform.
ODI Discussion Paper8
Nearly all developing countries have used PEFA assessments…
Public Expenditure and Financial Accountability (PEFA)
But do better PEFA scores always mean better PFM systems?
And is it always necessary to aim for an A?
East Asia and Pacific
61%
Europe and Central Asia
34%
Sub-Saharan Africa
92%
Latin America and Caribbean
73%
Middle East and North Africa
60%
South Asia
100%
North America
0%
Find out more at odi.org/programmes/aid-public-expenditure
Applying PEFA scores to the local context: think like Norway?PEFA scores less than “A”
A
B
C
DNorway Burkina Faso Mali Norway Burkina Faso Mali Norway Burkina Faso Mali
Effectiveness of internal audit
Information on resources received by service delivery units
Transparency, competition and complaints mechanisms in procurement
D D D
C+
B B
C
B B
PEFA assessed
Not PEFA assessed
Score Response
Information on resources received by service delivery units
D No problem: Low ratings are a result of primary service provision being entirely decentralised to municipalities
Effectiveness of internal audit
D No problem: Norway finds the current systems to be appropriate in the Norwegian context
Transparency, competition and complaints mechanisms in procurement
B Needs improvement: Low score to some extent reflects a need for improvement
Total number of scores less than “A”
Number of reform targets
Norway
Tonga
Kiribati
3
14
22
12
18
26
jmazliah
Inserted Text
PFM

In terms of harmonising the approach taken to assessing PFM systems, PEFA has been a striking success. Even by 2010, PEFA was influencing the internal decision-making processes of most major donors and no doubt continues to do so (PEFA Secretariat, 2010). In some countries, PEFA has been applied to local governments, adapted for specific sectors (Todini, 2013; Lawson et al., 2009; Audras and Almanza, 2013). There has also been a proliferation of other institutional diagnostics that largely replicate the approach taken by PEFA, but focus on specific elements of the PFM system. These include TADATs, DeMPAs, PIMAs, and SAI Performance assessments.
The framework has also become the common standard for measuring progress in PFM reform. For certain donors, periodic PEFA assessments are a set requirement. Programme decisions and the provision of budget support are often linked to specific PEFA indicators. Contractors and consultants working on PFM commonly monitor PEFA scores as part of their logical frameworks. Academics are also using the information from assessments to assess the impact of reforms (de Renzio et al., 2011).
PEFA has several important advantages over other diagnostic frameworks for PFM (Andrews, 2007). First, it is the most comprehensive measure of PFM to date, covering virtually the full budget cycle, from budget preparation and approval, to execution, reporting and oversight (de Renzio, 2013:153). Second, it does this in a way that can be repeated and verified. Third, the framework is relatively easily understood, even by someone with relatively limited knowledge of PFM.
PEFA has some important limitations, however, and understanding these will improve its usefulness. No indicator set can be perfect. Governance is not an easy subject to measure, and all governance indicators have their critics (North et al., 2009; Langbein and Knack, 2010; Høyland et al., 2012). It is no surprise, therefore, that PEFA also draws specific criticisms (Dabla-Norris et al., 2010:9; Andrews et al., 2014). Understanding these limitations can help users to apply PEFA appropriately – taking action where the limitations can be overcome, or
acknowledging where that is simply not possible. However, as we will discuss in Section 3, this is not always the case.
2.1 What does PEFA measure?The framework measures overall budget reliability and benchmarks key processes against international ‘good practices’ (Andrews, 2007:361-362). The 31 indicators in the 2016 PEFA Framework are structured around seven pillars, implicitly linking outcomes with process quality (see Figure 2). Pillar 1 measures budget reliability as a key outcome of the PFM system. Pillars 2 and 3 are cross-cutting issues that are relevant to multiple PFM systems, while Pillars 4 to 7 apply to key stages of the budget process. Each indicator is rated on a scale from ‘A’ to ‘D’ implying different levels of compliance with good practices. The ‘highest score [A] is warranted if the core PFM element meets an internationally recognised standard of good performance’ while a ‘score of C reflects the basic level of performance’ (PEFA Secretariat, 2016a:5,7). The rating is standardised by placing emphasis on formal documentation which the assessor must reference (budgets, annual accounts, and so forth). Furthermore, the PEFA Secretariat offers quality assurance through the ‘PEFA check’ certifies that the framework has been properly applied.
Significant changes to PEFA were made for the first time in 2016, but the underlying logic remains the same. A 2011 evaluation of PEFA concluded that the framework has proved useful in a range of contexts and that there was no urgent need to update it (Lawson and Folscher, 2011:10). Therefore, the revisions aimed to ensure that PEFA remains relevant despite changes in good practice, also to incorporate more than 200 clarifications needed to further standardise assessments and improve areas of weakness. For those who are interested, the Secretariat has provided detailed guidance (PEFA Secretariat, 2016b) and Betley (2016) provides a useful review following testing in Mauritius.2 The key point, however, is that the broad framework and measurement approach have not radically changed.
2 How does PEFA help us to understand PFM systems?
PEFA: What is it good for? 9
2 Overall, the new framework is more comprehensive than before, with many more dimensions. There is a greater emphasis on transparency and the management of liabilities. There are also new indicators that assess the existence of a credible fiscal strategy, public investment management practices and public asset management. A number of other indicators have changed substantively, and the specific donor indicators have been dropped.

2.2 What does PEFA not measure?PFM systems are complex and a single diagnostic tool can only partially reveal how a system is working. The PEFA Secretariat (2016a: 4-5) openly acknowledges the framework does not capture all factors affecting PFM performance (such as the legal framework or human resource capacities) and continues to focus on PFM processes. Nor does it provide fiscal or expenditure policy analysis that would determine if spending is sustainable, equitable or achieving good value for money.
Critically, a PEFA assessment does not reveal how the overall PFM system is working and why it is working that way. There are a number of reasons for this, which are summarised in Figure 3:
• PEFA indicators tend to focus on processes in finance ministries (limited depth and coverage).
• PEFA largely measures how systems look, but not how they work in practice (‘form’ not ‘function’).
• PEFA misses important interactions between different role-players (missing institutions).
Figure 2: The PEFA Framework
Pillar 4: Policy-based fiscal strategy and budget
Pillar 6:Accounting and
reporting
Pillar 7:External scrutiny and
audit
Pillar 2: Transparency of public finances
Pillar 3: Management of assets and liabilities
Pillar 5: Predictability and control in budget
Pillar 1:Budget reliability
(outcome)
Source: PEFA Secretariat, 2016a
Figure 3: Three limitations of the PEFA framework and their implications
Limited coverage Form not function Missing institutions• Misses islands of excellence • Misses seas of mediocrity in delivery
• Misses the implementation gap• Creates a normative bias
• Political economy• Organisational capabilities• Interactions between processes
ODI Discussion Paper10

2.3 Limited coverage A PEFA assessment has limited depth and scope. To allow a PEFA assessment to be conducted in reasonable time it is necessary to limit the scope of what is covered.3 One way this is done is by focusing on the finance ministry and centre of government. This can mask weaknesses in line ministries and local governments which are usually responsible for executing most public spending. For example, accounting may comply with international standards in the national treasury, but not in line ministries and local governments (Andrews, 2007:371). This can miss ‘seas of mediocrity in delivery’ (see Box 1). Equally, to avoid assessing PFM in all line ministries, PEFA guidance suggests sampling a few larger ministries for certain indicators, such as payroll systems (PI-23), procurement (PI-24), and the choice of investment projects (PI-11). In these cases the final rating may not apply to all ministries, and so could miss ‘islands of excellence’ where systems are functioning more strongly.
Box 1: Missing arrears in Timor-Leste The problems of limited scope are illustrated well in Timor-Leste, which has had a number of PEFA assessments in recent years. In 2010, the indicator for the stock of expenditure arrears was rated ‘A’. In 2014, the same indicator was not rated, but the assessment concluded that (a) the carry-forward of obligations posed no immediate threats, and (b) the introduction of International Public Sector Accounting Standards accounting standards commitment controls will prevent the accumulation of expenditure arrears. However, these conclusions are contested by a more in-depth resource-tracking survey conducted by the World Bank in 2014 for health services provided by local governments and health centres. The evidence from this study showed that there were in fact large debts accumulated by taking credit from suppliers and staff, which were not being entered into the financial management system, and that paying these debts was effectively squeezing out other budgeted health expenditure.
3 According to the Secretariat it should take 4-5 months to conduct the assessment and prepare a draft report (PEFA Secretariat, 2012:14). If it took much longer, the results might already be out of date by the time they are published, and costs might make organisations think twice before commissioning a PEFA assessment.
PEFA: What is it good for? 11
2.4 Measuring form not function PEFA measures mainly how systems look (their ‘form’), not how they work in practice (their ‘function’). Most PEFA indicators assess whether governments have introduced specific processes or products, and assessors verify this by checking if there is formal documentation to support it. Although this helps to maintain comparability and makes it easier to verify results objectively, the focus on processes and documentation can draw focus away from whether the system is actually delivering as it should. For example, the indicator on procurement (PI-24) ‘focuses on transparency of arrangements, emphasis on open and competitive procedures, monitoring of procurement results, and access to appeal and redress arrangements’. It tells us little about whether systems are in fact making procurements in an efficient manner. Bangladesh, for example, received a ‘B’ for its procurement systems and yet a World Bank study on collusion in the roads sector found that companies paid officials up to 15% of the project value (Messick, 2011). Critically, diagnostic tools such as PEFA are particularly weak at measuring the quality of budget execution, such as the reliability and efficient use of resources (Andrews et al., 2014). For example, the revised indicator for service delivery (PI-8) considers the availability of performance plans and reports, but does not measure the extent to which resources reach service-delivery units, despite ample evidence that ‘leakages’ and staff absenteeism are often significant in sectors such as education and health (Glassman et al., 2008). Equally, the new indicators for public investment management don’t reveal whether budgeted projects were implemented, if they were implemented at cost, or if they were focused on the right areas. Yet a review of 4,700 public sector projects in Nigeria found that 38% were never started (Rasul and Rogger, 2015). These issues are summarised in Figure 4, which shows what the PFM system should do (its functions) and whether PEFA measures how well those functions are being fulfilled.

2.5 Missing institutions PEFA and other PFM diagnostics such as Public Expenditure Reviews(PERSs) and Fiscal ROSCs (IMF Reports on the Observance of Standards and Codes of Fiscal Transparency) have long been criticised for paying insufficient attention to the organisational and political dimensions of PFM, and for failing to include public management and governance experts in the assessment teams (Allen et al., 2004:41).4 Yet organisational and political issues are relevant on a number of levels. Studies show, for example, that processes that involve more actors are less likely to change than those in which the actors are more concentrated (Andrews, 2014). There is also a large literature that shows how some features of political systems make it more likely that finance ministries can maintain fiscal discipline in OECD countries (Hallerberg, 2004; Hallerberg et al., 2009; Wehner, 2010). Equally, in many developing countries informal systems are as important as the formal ones in influencing behaviours and budget decisions (Rakner et al., 2004). Essentially, the capacity of the PFM system depends not only on existing processes, but also on the interactions of the various actors and organisations – inside and outside the government (Andrews, 2007; Booth, 2012). This takes place within a broader context, with differences in laws, political arrangements, and economic environment, all of which will affect the way PFM systems work (de Renzio, 2013). For example, it has been argued that the PFM reform cycle in Malawi is closely linked to the political cycle (Folscher et al., 2012). Reforms to the control environment have been introduced as new presidents are returned to power and need to rebuild donor and economic confidence, only to unwind in the run-up to elections. The recognition of these gaps has led to a range of research work on the organisation and capabilities of finance ministries in OECD and developing countries (Allen and Krause, 2013; Allen et al., 2015; Krause et al., 2016).
2.6 Why does this matter? It is critical to recognise, but is too often overlooked, that improvements in PEFA scores do not necessarily represent improvements in the functioning of the PFM system as a whole. An assessment can miss important problems (such as arrears in Timor-Leste). It can mask the implementation gap between what the system looks like and how it works in practice (as illustrated in Bangladesh). It can also miss problems that are rooted in organisational or political issues (as in the case of Malawi’s internal controls).
This puts a premium on a cautious and well-informed interpretation of PEFA scores. Part of the responsibility for this should rest on those who undertake the assessments. As public documents, these are often couched in diplomatic language. A summary of Malawi’s PFM reforms in a 2011 PEFA assessment was relatively complimentary about its reforms to budget management, despite no bank reconciliation having been undertaken for the entire previous year. However, much of the responsibility lies with governments and donor organisations to recognise what PEFA scores can reveal and what they do not.
A push to harmonise diagnostic work through a common reliance on PEFA also risks squeezing out other analytical tools that provide different insights. PEFA’s ambition was to provide a better overall indicator of PFM that all donors could use to avoid asking the same questions, and in this way it has been an important advance. There is a danger, however, that over-reliance on PEFA means that other important questions are not asked because they do not lend themselves to a ‘one-size-fits all’ PEFA-type study.
Figure 4: Which PFM functions do PEFA diagnostics really measure?
Functions of the PFM systemDoes the existing PEFA framework reflect on functionality?
Prudent fiscal decisions Partly
Reliable budgets Yes
Reliable and efficient resource flows and transactions No
Institutionalised accountability Partly
Source: Andrews et al., 2014
4 ‘With the possible exception of the broad constitutional and legal descriptions of the state apparatus in PERs and Fiscal ROSCs, the instruments provide little guidance on defining and accounting for institutional factors in assessments. Nor do any of the guidelines recommend that assessment teams include staff with specific expertise in public management and governance. It seems to be assumed that in most cases economists and financial management and procurement staff can undertake any needed institutional analysis’ (Allen et al., 2004:41).
ODI Discussion Paper12
jmazliah
Inserted Text
jmazliah
Cross-Out

One good example of this is the relative decline of public expenditure tracking surveys (PETS). When done well, these can track the flow of resources (financial, human and other) from central government to service-delivery units, to give a better understanding of which PFM systems are a barrier to better services. Some common problems that such surveys
have revealed are absenteeism among service providers, delays in transfers or in-kind support, and leakage of funds, particularly in non-wage expenditures (Reinikka and Smith, 2004; Koziol and Tolmie, 2010). Such issues are unlikely to be revealed through standard PFM diagnostics such as PEFA or high-level public expenditure analysis.
PEFA: What is it good for? 13

The use of diagnostic work to inform the design of PFM reforms is welcome. Effective change requires a good understanding of what is working, what is not working and why. PEFA has become the ‘go-to’ tool for providing that analysis (Wescott, 2008; Lawson and Folscher, 2011). Indeed, there is a growing literature looking at how PEFA might be used to inform the sequencing of reform (Diamond, 2013; Haque et al., 2013). These clearly indicate that PEFA is not the only basis for prioritising PFM reforms, reiterating the messages of the Strengthened Approach and the PEFA Secretariat’s own guidance. Yet, in practice reform plans are frequently designed almost exclusively on the basis of PEFA scores, and without adequately considering local context or the limitations described above.
3.1 How PEFA should be used?PEFA can provide useful analytical input to thinking about problems in PFM performance. The experience of Norway offers an instructive example on how that might be done well. In 2008, Norad, the Norwegian development agency, undertook a PEFA self-assessment of the Norwegian government. The results certainly confirmed that Norway scores higher than most developing countries, but it did not rate its systems as ‘A’ in all areas, and the average score is less than Brazil, Georgia and South Africa, which all have
much lower GDP per capita. The Norwegian government did not, however, immediately rush out to address each low score.
A number of key lessons on how to use PEFA to inform change can be drawn out from Norway’s response to the study (see Box 2 for full response):
• PEFA results can be used to complement other forms of analysis and existing local knowledge. In Norway, the PEFA study identified weaknesses in procurement, which lent weight to existing concerns about potential problems in the government’s procurement systems.
• PEFA results need to be interpreted in the light of the local context. Norway obtained the lowest score on the indicator for information about service delivery because of its decentralisation arrangements, not because of inherent weaknesses in its systems.
• Any plans to make change should be selective. Following the PEFA assessment, Norway focused on improving certain specific weaknesses, but did not use the PEFA as a blueprint for reforms.
• Sometimes ‘C’ or ‘D’ may be ‘good enough’. Norway scored a ‘D’ on the indicator for internal audit, yet deemed its internal controls to be working well enough without investing additional resources in these functions.
3 How is PEFA used (and misused) to prioritise PFM reform?
ODI Discussion Paper14

3.2 How is PEFA misused? The reality is that in many countries, PEFA is used as a blueprint for reform: it is used as a guide of what systems should look like, rather than a useful (but incomplete) measure of what systems do look like. There are numerous examples of PEFA being used mechanistically as the basis for designing PFM reform programmes. Following a recent PEFA assessment, the Government of Mauritius is currently
preparing a comprehensive PFM Action Plan to determine what actions it will take. This approach is common and the subsequent reforms are heavily influenced by PEFA – for example Papua New Guinea has recently adopted a ‘PEFA Road Map’ and Nepal’s steering committee for reforms is called the PEFA Secretariat. In some cases, PEFA has been used line-by-line to inform reform plans, often prepared quickly by external consultants (see Box 3).
Box 3: PEFA influencing PFM reform plans in the PacificODI and the World Bank recently conducted research in Tonga and Kiribati to look at these issues. In both countries reform plans aimed to achieve higher scores in virtually all PEFA indicators that were not already scoring an ‘A’ (in Tonga’s case) or a ‘B’ (in Kiribati’s case). Tonga’s reform plan is certainly a better document, and a more realistic reflection of what could be achieved than the one drafted in Kiribati. Nevertheless, it remains overambitious, with over 35 actions that require coordination across all line ministries for successful implementation, in an environment where coordination has proven challenging in the past. Even if implementation is successful, we doubt that the planned reforms will lead to significant improvements in macroeconomic management and service delivery.
Note: PEFA scores have been converted to numerical scores as follows 0=N/A, 1=D, 2=C, 3=B, 4=A Sources: World Bank et al., 2016; Kingdom of Tonga, 2015; Republic of Kiribati, 2011
Box 2: Norway’s response to its 2008 PEFA self-assessment‘Norway is one of the richest countries in the world with the standard of governance being perceived as very high. This is confirmed in the assessment as 22 of the indicators were rated at A or B level (in a scale from A to D). However there were exceptions from this general standard as eight indicators or indicator dimensions were rated at C or D level.
Areas obtaining low ratings include procurement practices, legislative scrutiny of external audit reports and follow-up to the external audit report findings, affecting three indicator ratings. On these areas low score to some extent reflects a need for improvement also anticipated by the Norwegian government.
Low ratings affecting two other indicators are a result of primary service provision being entirely decentralised to municipalities. The local government is primary [sic] to be responsible for the local inhabitants, so for that reason the central government do not see central collection of ex-ante (budget) fiscal information from each municipality as needed. Furthermore, for the same reason, there is no central regulation in Norway to make sure that information on resources at primary service level (e.g. schools, health clinics) are made public available.
Three other areas of low performance ratings are lack of multi-year budgeting at dis aggregated level, internal audit functions being optional for agencies and lack of a central consolidated assessment of risks in public corporations and autonomous agencies. In these areas the government in Norway find the current systems to be appropriate in the Norwegian context.
The assessment shows that the PEFA framework seems to be broadly applicable in a highly developed country as Norway. However on some areas it is more uncertain whether middle and lower performance scorings implies needs for improvement. This point out some areas for discussion whether good international practices and standards as reflected in some of the indicators, addresses needs for improvement in a country’s public financial system, both in high income countries and developing countries.’
Source: Norad, 2008
0
1
2
3
41
2 34
56
7
8
910
1112
131415
161718
1920
21
22
2324
2526
27 28
Tonga
2014
2019 Target
0
1
2
3
41
2 34
56
7
8
910
1112
131415
161718
1920
21
22
2324
2526
27 28
Kiribati
2009
2014 Target
PEFA: What is it good for? 15

Using PEFA in this way risks undermining the impact and ‘ownership’ of PFM reforms. This is demonstrated by the evidence that PFM reforms in developing countries are very similar. Andrews (2010:43) compared PFM reform plans in 31 African countries and found that all 31 were introducing GFS classification schemes and had identified steps to consolidate public bank accounts, 28 had MTEFs (medium-term expenditure frameworks) or were establishing them, and 25 were introducing programme, performance or activity-based budgeting. Figure 5 summarises this graphically. Did these countries really face the same problems and need the same interventions to solve them? Andrews thinks not and concludes that ‘reform similarities belie country differences’. More specifically, it gives rise to three interrelated risks:
• It promotes highly similar reforms, regardless of country context. An implicit assumption in the PEFA framework is that all systems must comply with good practices (rated ‘A’) for the PFM system to function optimally, regardless of the context. However, it is possible to achieve similar PFM outcomes with different systems. Among OECD countries, for
example, Germany has maintained strong economic and fiscal performance not by using MTEFs but by using an incremental budget system, in stark contrast to the UK, which has systems that more closely resemble the good practices in PEFA (Krause et al., 2016).
• It risks concentrating efforts on changing what the PEFA framework measures and ignoring what it does not measure. This may result in reform plans that favour changes to the way processes look rather than improvements in process quality, or organisational or political arrangements. As was shown by de Renzio et al. (2011), this commonly leads to reforms that change institutional ‘forms’ without changing how well systems actually ‘function’.
• It can divert scarce government resources away from addressing the true reasons for poor performance. This has given rise to concerns that external support is overburdening existing institutions and channelling their efforts away from solving local problems, a scenario neatly summarised as ‘capacity overload’ (Andrews et al., 2012; Porter et al., 2010; Pritchett et al., 2010).
% o
f cou
ntrie
s us
ing
or a
dopt
ing
refo
rm
0%
25%
50%
75%
100%
Performance budgeting Top-down ceilings MTEF IFMIS Accounting standards Commitment control Treasury Single Accounts
Figure 5: The similarity of PFM reforms in 31 African countries
Performing budgeting Top-down ceilings MTEF IFMIS Accounting standards Commitment control Treasury Single Accounts0%
25%
50%
75%
100%
% o
f cou
ntrie
s us
ing
or a
dapt
ing
refo
rm
ODI Discussion Paper16
At the outset of this discussion paper, we revisited the goals and principles of the Strengthened Approach to PFM that gave rise to PEFA. In terms of harmonising and coordinating fiduciary assessments, diagnostic work and reform preparation, PEFA has been a resounding success – an ‘A’ grade if you like. PEFA has also for the first time provided a comparable, international data-set on PFM systems. Many of the studies cited in this paper draw from that very same data.
At the same time this paper has pointed to certain examples where PEFA is being used in a way that undermines what it takes to make effective changes to PFM systems. While PFM reform may ostensibly be ‘country-led’, PEFA seems to be contributing to a tendency to design reforms that work towards OECD best practices are often unsuitable for the countries concerned.
This risks diminishing its value as an objective measure of PFM performance, but also as a tool designed to increase the impacts of reform. Where change is introduced for external legitimacy, rather than as a genuine solution to local problems, it risks diverting resources away from actions that are likely to achieve a greater impact. For this we must surely give the donor community a ‘D’?
Using PEFA as a blueprint for reform runs counter to the advice of the PEFA Secretariat, which explicitly states that ‘PEFA does not provide recommendations for reforms’ (PEFA Secretariat, 2016a:4). Plenty of advice has been written to discourage poor use of PEFA. This begs the question of why this approach to reform has proved to be so persistent.
4.1 What is driving these behaviours?In a certain sense, PEFA has been a victim of its own success. As ever more emphasis has been placed on PEFA scores for programming decisions, the stakes to improve PEFA scores at all costs have grown ever higher. Given that PEFA is used to inform decisions on programming budget support, for measuring progress on PFM reform, for undertaking cross-country comparisons of PEFA systems, for shaping debate with civil society on PFM systems, and so on, it is hardly surprising that governments want to see
their PEFA scores improve. Perhaps a system that is used to measure fiduciary risk is not the best platform for honest dialogue and self-reflection what is not working well.
The growing importance of PEFA scores is likely to have encouraged ‘gaming’ behaviour. As indicators become important for decisions on resource allocation and political legitimacy, they are more likely to shape organisational behaviour, but not always in a way that leads to better public services.5 There are strong parallels to be drawn here with the ‘Doing Business Indicators’. Countries strive to do well on such international indexes because scoring badly compared to their peers can be politically ‘embarrassing’ and may affect foreign investment. Yet it has been shown that climbing up these rankings has not always led to changes in private sector perceptions of the effectiveness of systems, as measured in the Enterprise Survey (Hallward-Driemeier and Pritchett, 2010). This calls into question the actual ability of ‘reforms’ to improve the business environment in many countries and is likely to be the case with PEFA too, as Andrews and Bategeka (2013) have illustrated in Uganda.
There are also financial incentives to undertake PFM reform in low income countries. For a country like Norway, it is costly to make changes to PFM systems. Decisions on reform draw scarce management time and financial resources away from meeting day-to-day responsibilities. The use of these resources is also closely monitored by the legislature and civil society groups. For low-income countries, however, the decision to proceed with reforms can greatly expand the overall resources available by attracting donor financing. It is therefore almost to be expected that each and every entity in the PFM system wants to be involved in PFM reforms. All the more so if scores can be improved without actually changing how the systems work.
Critically, the revised PEFA framework will not address these incentives. The new PEFA is bigger, and possibly better, but it still uses the same underlying logic and is likely to give similar scores as the old one overall. This is not a problem for the PEFA framework itself. If it continues to be used the same way, however, then we may need to get ready for a surge in ‘cheap’ fiscal strategies
4 Conclusion: What can be done to improve PFM reform programmes?
5 There is a rich literature that explains the behavioural effects of targets such as Bevan and Hood (2006), Hood (2006) and Høyland et al. (2012).
PEFA: What is it good for? 17

that are not adhered to (the new indicator 11) that simply rubberstamp politically motivated projects without question; and performance plans and reports (the new indicator 8) that have little impact on institutional incentives to provide better services. What then can be done to prevent this?
4.2 How could PEFA be used better? Ideally, countries should be using PEFA assessments more like Norway. Scores should be interpreted carefully, and reforms prioritised after considering all the relevant information. As we saw in the last section – and in Box 2 – Norway did not attempt to improve every score that did not receive an ‘A’ rating. It considered its context and used insider knowledge to focus on the most problematic areas.
More could be done to help to interpret assessment results in the local context of developing countries. One possible way to do this is to strengthen the requirements for the Summary Assessment so that it more explicitly interprets ‘which scores merit priority attention and why’ in the country context (ODI, 2014).6 Good PEFA assessments can often provide useful commentary in the description of each indicator rating, which can be used as a basis for discussion rather than the scores themselves in country-level dialogue on PFM reforms. To ensure that these are of sufficient quality, donors should require all assessments to be quality assured by the PEFA Secretariat through the ‘PEFA Check’.
Diagnostics of PFM performance should not rest solely on PEFA and related tools that follow a similar logic. Faustino and Booth (2014) speak of using ‘measures that matter’ to guide reforms. There may be room to introduce periodic surveys that are complementary to PEFA, but more oriented to service delivery. Perhaps we could draw from experience with the Enterprise Survey in the business environment. Questions to schools and hospitals on the predictability and timing of financial and non-financial resources flows or contractors on the promptness of payments would serve as a useful counterpoint to certain PEFA measures. PERs and PETS could also be used to consider areas of particular importance to the government.
The more challenging agenda, but with greater potential impact, is to revisit the donors’ approach to programming PFM reform. There is a large literature criticising the ‘blueprint’ project approach donors use to support institutional reforms in partner countries (Brinkerhoff and Ingle, 1989; Bond and Hulme, 1999; Grindle, 2004; Booth, 2011; Andrews, 2013). Such projects are designed by defining very precisely what interventions are needed and sticking rigidly to those plans during implementation, usually over a just a few years, which is the blink of an
eye in institutional terms. The challenge to donors is that this approach might work well for delivering vaccines and similar logistical tasks, but has been much less successful for PFM and other institutional reforms.
Future reforms will need to be more ‘problem-driven’. The concerns with the blueprint approach are heightened when reforms tackle the wrong problems from the start. Institutions are important for development, but it is increasingly clear that introducing Denmark’s PFM processes in the DRC will not result in DRC’s PFM systems working like those in Denmark. Yet this has been the predominant donor ‘solution’ to PFM problems in developing countries, and PEFA has become the agreed view on what that ‘solution’ looks like. But we have seen already that adopting PEFA in this way does not necessarily lead to better macroeconomic management or service-delivery outcomes. A key challenge then is to reorient donors (and now their country partners) to focus on the real problems.
So far there are not many answers to how this could be done. The large volume of work criticising this approach has not been matched by efforts to offer a practical alternative. However, this gap has not gone unnoticed, and some have attempted to fill it. A range of research is currently pointing to the potential of using ‘arms-length organisations’ to support the change process more effectively (Booth, 2013; Faustino and Booth, 2014; Williamson; 2015). Andrews (2015a; 2015b) provide tools for reformers to help in identifying and understanding the problems and assessing the space for change. Haque et al. (2013) have also attempted to guide donors working in Pacific Island countries where state capacities are constrained by isolation and small populations. They explicitly state that some PEFA scores will need to lag behind, and provide some basic mapping for how PFM systems relate to broader development outcomes as a means to establish priorities. Others are considering whether more could be learnt from budget support groups on jointly identifying issues to address. Changing the government–donor dialogue will be an important ingredient for change. Currently, this centres strongly on PEFA and allows different stakeholders to press their vested interests. For example, accounting and audit bodies push for international standards or performance audits to be implemented. However, this distracts from discussing the real problems. Collaborative Africa Budget Reform Initiative (CABRI) and the Effective Institutions Platform (EIP 2015) are encouraging a new donor dialogue for monitoring the Busan commitments on aid effectiveness. This will allow countries and donors to pick seven out of 14 PFM indicators (from PEFA) to measure the strength of country systems. It may be possible
6 Under existing guidance, the Summary Assessment should cover the likely impact of PFM weaknesses on fiscal discipline, strategic allocation of resources and efficient service delivery. In practice, the Summary Assessment commonly resembles an executive summary followed by a list of recommended reforms, often based on the indicators that scored poorly. The 2010 PEFA assessment for Bhutan and the 2007 assessment for Lesotho are just two randomly picked examples.
ODI Discussion Paper18

to broaden this dialogue still further to consider key development problems, the PFM systems that contribute to those problems, and which indicators are the best measure of functionality in those areas – not just from PEFA.
Any new approach will need to be based on a better understanding of PFM. PEFA is not a substitute for in-depth, country-level, politically informed understanding of how PFM systems work. This would need to be rebuilt to some extent, to put ‘good practices’ into their proper context. Such efforts would focus not only on the government but on all the main stakeholders in PFM – including donors, regional bodies and consultants. Some have suggested that broad training programmes are designed and implemented for these different groups, starting with regional bodies and government which are a focal point for most PFM learning in the region.
Addressing these negative incentives is the most
important challenge for anyone who cares about PEFA and PFM reforms in developing countries. The current approach will not benefit developing countries in the long term. It is based on a flawed logic – that making systems look like PEFA will improve PFM and so lead to better macroeconomic and service-delivery outcomes. This assumption is false. This is not the fault of PEFA, which remains a useful framework for thinking through the problems that governments face in strengthening their PFM systems. The challenge is to use it well, to unlock the real problems, and direct resources where they are needed. As yet, there is no new blueprint to follow, and this discussion paper has made only initial suggestions for what could be done. In the meantime, we simply urge countries that are using PEFA to consider, rather than wanting to ‘look like Norway’, how they can ‘think like Norway’ and make the best of what PEFA has to offer for PFM reforms.
PEFA: What is it good for? 19

References Allen, R. and Krause, P. (2013) ‘The role, responsibilities, structure and evolution of central finance agencies.’ In:
R. Allen, R. Hemming and B. Potter (eds) TheInternational Handbook of Public Financial Management. Basingstoke: Palgrave Macmillan, pp. 98-115.
Allen, R., Schiavo-Campo, S. and Garrity,T. C. (2004) ‘Assessing and reforming public financial management, a new approach’. Washington, DC: World Bank.
Allen, R. et al. (2015) ‘The evolving functions and organization of finance ministries’. Washington, DC: International Monetary Fund.
Andrews, M. (2007) ‘What would an ideal public finance management system look like?’. In: A. Shah (ed.) Budgeting and Budgetary Institutions. Washington, DC: World Bank, pp. 359-383.
Andrews, M. (2010) ‘How far have public finance management reforms come in Africa?’ Cambridge, MA: Harvard Kennedy School.
Andrews, M. (2013) The Limits of Institutional Reform in Development: Changing Rules for Realistic Solutions. Cambridge: Cambridge University Press.
Andrews, M. (2014) ‘Why distributed end users often limit public financial management reform success’. Cambridge MA: Harvard University.
Andrews, M. (2015a) ‘Benefits and costs of the governance and institutions targets for the post-2015 development agenda’, Copenhagen: Copenhagen Consensus Centre.
Andrews, M. (2015b) ‘Has Sweden injected realism into public financial management reforms in partner countries’. Stokholm: Expertgruppen for Bistandsanalys.
Andrews, M. and Bategeka, L. (2013) ‘Overcoming the limits of institutional reform in Uganda’. Manchester: Effective States and Inclusive Development Research Centre.
Andrews, M., Pritchett, L., Samji, S. and Woolcock, M. (2015) ‘Building capability by delivering results: putting Problem-Driven Iterative Adaptation (PDIA) principles into practice’. In: A. Whaites, E. Gonzalez, S. Fyson and G. Teskey (eds) A Governance Practitioner’s Notebook: Alternative Ideas and Approaches. Paris: OECD, pp. 123-133.
Andrews, M., Pritchett, L. and Woolcock, M. (2012) ‘Escaping Capability Traps through Problem-Driven Iterative Adaptation (PDIA)’. CFGD Working Paper 299. Washington D.C.: Centre for Global Development.
Andrews, M., Pritchett, L. and Woolcock, M. (2015) ‘Doing problem driven work’. Cambridge, MA: Harvard University.
Andrews, M. et al. (2014) ‘This is PFM’. Cambridge, MA: Center for International Development at Harvard University.
Audras, F. and Almanza, J.-F. (2013) ‘PEFA methodology and sub-national governments: what lessons for AFD?’. Paris: Agence Française de Développement.
Betley, M. (2016) ‘Testing the new PEFA methodology in Mauritius’. Oxford: Mokoro.
Bevan, G. and Hood, C. (2006) ‘What’s measured is what matters: targets and gaming in the English public health care system’, Public Administration 84(3):517-538.
Bond, R. and Hulme, D. (1999) ‘Process approaches to development: theory and Sri Lankan practice’, World Development 27(8):1339-1358.
Booth, D. (2011) ‘Aid, institutions and governance: what have we learned?’, Development Policy Review 29(1): 5-26.
Booth, D. (2012) ‘Development as a collective action problem’. London: Overseas Development Institute.
Booth, D. (2013) ‘Facilitating development: An arm’s length approach to aid’. Discussion Note. London: Overseas Development Institute.
Brinkerhoff, D.W. and Ingle, M.D. (1989) ‘Integrating blueprint and process: a structured flexibility approach to development management’, Public Administration and Development 9(5): 487-503.
CABRI and EIP (2015) ‘Draft policy brief: revised indicator 9a for the global partnership monitoring framework’. Paris: OECD Effective Institutions Platform.
Dabla-Norris, E. et al. (2010) ‘Budget institutions and fiscal performance in low-income countries’. Washington, DC: International Monetary Fund.
de Renzio, P. (2009) ‘Taking Stock: What do PEFA Assessments tell us about PFM systems across countries?’. ODI Working Paper 302. London: Overseas Development Institute.
de Renzio, P. (2013) ‘Assessing and comparing the quality of public financial management systems’. In: R. Allen, R. Hemming and B. H. Potter (eds) The International Handbook of Public Financial Management. Basingstoke: Palgrave Macmillan, pp. 137-160.
ODI Discussion Paper20
de Renzio, P. and Simson, R. (2013). ‘Transparency for what? The usefulness of publicly available budget information in African countries’. London: Overseas Development Institute.
de Renzio, P., Andrews, M. and Mills, Z. (2011) ‘Does donor support to public financial management reforms in developing countries work? An analytical study of quantitative cross-country evidence’. London: Overseas Development Institute.
Diamond, J. (2013) ‘Good practice note on sequencing PFM reforms’. Washington, DC: Public Expenditure and Financial Accountability Secretariat.
DFID (2011) ‘How to Note: managing fiduciary risk when providing Financial Aid’. London: Department for International Development.
Faustino, J. and Booth, D. (2014) ‘Development entrepreurship: how donors and leaders can foster institutional change’. Working Politically in Practice Series Case Study No. 2. San Francisco: The Asia Foundation.
Fölscher, A., Mkandawire, A. and Faragher, R. (2012) ‘Evaluation of public financial management reform in Malawi, 2001-2010: final country case study report’. Stockholm: Sida.
Glassman, A., Becker, L. and Bun, C. (2008) [Draft] ‘Monitoring the quality of public spending in the social sectors in developing countries: lessons from public expenditure tracking surveys and other sources’. Washington, DC: The Brookings Institution.
Google Books Ngram Viewer (2016) ‘Google Books Ngram Viewer’. [Online] Available at: https://books.google.com/ngrams [Accessed 2 April 2016].
Grindle, M.S. (2004) ‘Good enough governance: poverty reduction and reform in developing countries’, Governance 17(4): pp.525-548.
Gurkan, A., Kaiser, K. and Voorbraak, D. (2009) ‘Implementing public expenditure tracking surveys for results: lessons from a decade of global experience’, PREM Notes, Vol.145.
Hallerberg, M. (2004) Domestic Budgets in a United Europe: Fiscal Governance from the End of Bretton Woods to EMU. New York: Cornell University Press.
Hallerberg, M., Strauch, R.R. and Von Hagen, J. (2009) Fiscal Governance in Europe. Cambridge: Cambridge University Press.
Hallward-Driemeier, M. and Pritchett, L. (2010) ‘How business is done and the “doing business” indicators: the investment climate when firms have climate control’, Cambridge, MA: Harvard University.
Haque, T. A., Knight, D. and Jayasuriya, D. (2015) ‘Capacity constraints and public financial management in Small Pacific Island Countries’, Asia & the Pacific Policy Studies (early view).
Hood, C. (2006) ‘Gaming in targetworld: the targets approach to managing British public services’, Public Administration Review 66(4):.515-521.
Høyland, B., Moene, K. and Willumsen, F. (2012) ‘The tyranny of international index rankings’, Journal of Development Economics 97(1): 1-14.
Kingdom of Tonga (2015) ‘Tonga’s public financial management reform roadmap, 2014/15-2018/19’. Nuku’Alofa: Government of the Kingdom of Tonga.
Knack, S. (2014) ‘Building or bypassing country systems: are donors defying the Paris Declaration?’, The Journal of Development Studies 50(6): 839-854.
Koziol, M. and Tolmie, C. (2010) ‘Using public expenditure tracking surveys to monitor projects and small-scale programs’. Washington, DC: World Bank.
Krause, P. (2013) ‘The origins of modern finance ministries: an evolutionary account based on the history of Britain and Germany’. London: Overseas Development Institute.
Krause, P., Hadley, S., Mustapha, S. and Welham, B. (2016) ‘The Capabilities of Finance Ministries’. London: Overseas Development Institute.
Langbein, L. and Knack, S. (2010) ‘The worldwide governance indicators: six, one or none?’, The Journal of Development Studies 46(2): 350-370.
Lawson, A. and Folscher, A. (2011) ‘Evaluation of PEFA programme 2004-2010 and development of recommendations beyond 2011’. Oxford: Fiscus Ltd.
Lawson, A. et al. (2009) ‘Assessment of public finance management and procurement systems in the Mozambique health sector, 2008, based on an adaptation of the PEFA methodology to the health sector’. Oxford: Fiscus Public Finance Consultants Ltd.
Lienert, I. (2003) ‘A comparison between two public expenditure management systems’. Washington, DC: International Monetary Fund.
Messick, R. (2011) ‘Curbing fraud, corruption, and collusion in the roads sector’. Washington, DC: World Bank.
PEFA: What is it good for? 21
Nixon, H. and Bredenkamp, C. (2014) ‘Timor-Leste health resource tracking study’. Washington, DC: World Bank.
Norad (2008) ‘Public Financial Management Performance Report – Norway’. [Online]
Available at: https://www.norad.no/en/toolspublications/publications/2009/public-financial-management-performance-report---norway/ [Accessed 9 March 2016].
North, D., Wallis, J. and Weingast, B. (2009) Violence and Social Orders. Cambridge: Cambridge University Press.
ODI (2014) ‘Joint response to the PEFA consultation: For a stronger summary assessment’. London: Overseas Development Institute.
PEFA Secretariat (2009) ‘Issues in comparison and aggregation of PEFA assessment results over time and across countries’. Washington, DC: Public Expenditure and Financial Accountability Secretariat.
PEFA Secretariat (2010) ‘Survey of PEFA partners’ use of PEFA assessments for internal processes’. Washington, DC: Public Expenditure and Financial Accountability Secretariat.
PEFA Secretariat (2012) ‘Good practices in applying the PFM performance measurement framework guidance for assessment planners and managers. Washington, DC: Public Expenditure and Financial Accountability Secretariat.
PEFA Secretariat (2016a) ‘Framework for assessing public financial management’. Washington, DC: Public Expenditure and Financial Accountability Secretariat.
PEFA Secretariat (2016b) ‘Guidance on reporting performance changes in PEFA 2016 from previous assessments that applied PEFA 2005 or PEFA 2011’. Washington, DC: Public Expenditure and Financial Accountability Secretariat.
Porter, D., Andrews, M., Turkewitz, J. and Wescott, C. (2010) ‘Managing public finance and procurement in fragile and conflict affected states’. Washington, DC: World Bank.
Pritchett, L., Woolcock, M. and Andrews, M. (2010) ‘Capability traps? The mechanisms of persistent implementation failure’. Cambridge, MA: Harvard Kennedy School.
Pruce, K. (n.d.) ‘Closing the gap between form and function: a new approach to institutional reform in Uganda’. Manchester: Effective States and Inclusive Development Research Centre.
Rakner, L., Mukubvu, L., Ngwira, N., Smiddy, K. and Schneider, A. (2004) ‘The budget as theatre: the formal and informal institutional makings of the budget process in Malawi’. Bergen: Chr. Michelsen Institute.
Rasul, I. and Rogger, D. (2015) ‘Management of bureaucrats and public service delivery: evidence from the Nigerian civil service’. London: The London School of Economics and Political Science.
Reinikka, R. and Smith, N. (2004) ‘Public expenditure tracking surveys in education’. Paris: International Institute for Education Planning.
Republic of Kiribati (2011) ‘Public financial management plan version 2.0’. [Unpublished document.] Tarawa: Government of the Republic of Kiribati.
Schick, A. (1998) ‘Why most developing countries should not try New Zealand reforms’, The World Bank Research Observer 13(1):123-131.
Todini, N. (2013) ‘Guided self-assessment of public financial management performance (PFMP-SA): A toolkit for health sector managers’. Bethesda, MD: United States Agency for International Development.
World Bank, et al. (2016) ‘Towards problem-driven public financial management reform in pacific island countries, a joint report by the World Bank, New Zealand Ministry of Foreign Affairs and Trade, Australian Department of Foreign Affairs and Trade, and Overseas Development Institute’. Washington, DC: World Bank.
Wehner, J. (2010) Legislatures and the Budget Process: The Myth of Fiscal Control. Basingstoke: Palgrave Macmillan.
Wescott, C. G. (2008) ‘World Bank support for public financial management: conceptual roots and evidence of impact – background paper to public sector reform: what works and why? an IEG evaluation of World Bank support’. Washington, D.: World Bank.
Williamson, T. (2015) ‘Changing in challenging contexts: how does it happen?’ London: Overseas Development Institute.
ODI Discussion Paper22

PEFA: What is it good for? 23

ODI is the UK’s leading independent think tank on international development and humanitarian issues.
Readers are encouraged to reproduce material from ODI Reports for their own publications, as long as they are not being sold commercially. As copyright holder, ODI requests due acknowledgement and a copy of the publication. For online use, we ask readers to link to the original resource on the ODI website. The views presented in this paper are those of the author(s) and do not necessarily represent the views of ODI.© Overseas Development Institute 2016. This work is licensed under a Creative Commons Attribution-NonCommercial Licence (CC BY-NC 4.0).
All ODI Reports are available from www.odi.org
Cover photo: Ollivier Girard, CIFOR/2012. Territorial Administrator of Lukolela
Overseas Development Institute203 Blackfriars Road London SE1 8NJTel +44 (0)20 7922 0300 Fax +44 (0)20 7922 0399
odi.org