Peer-Reviewed Establishing Correlation Between Aerosol...
7
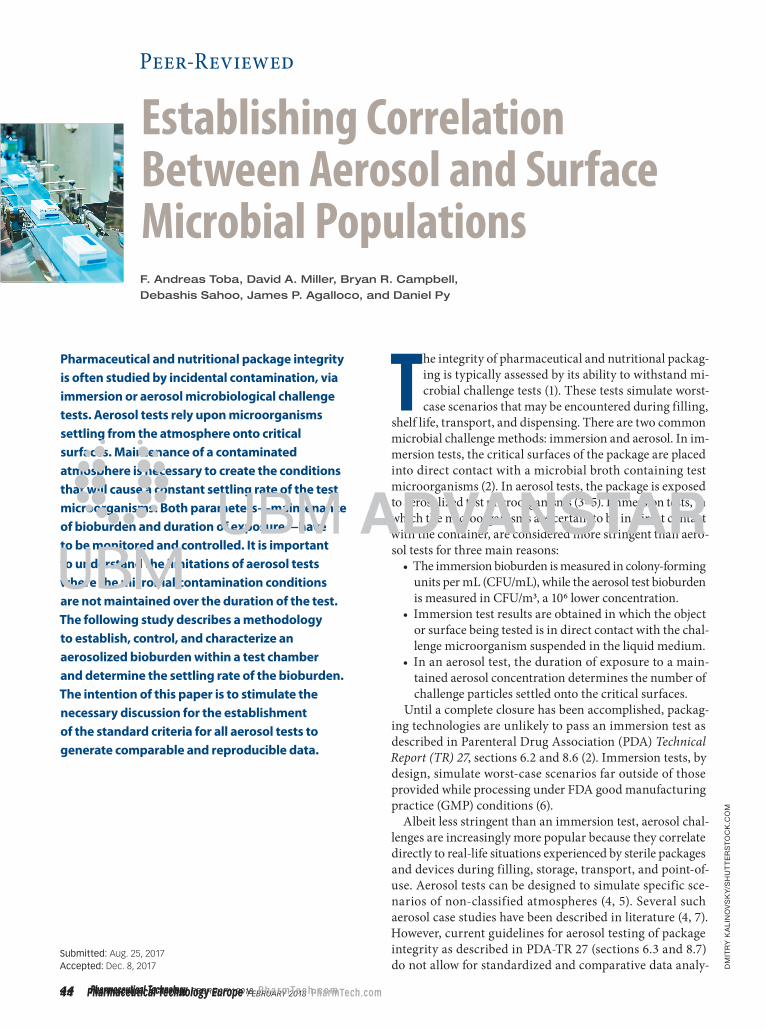
44 Pharmaceutical Technology Europe FEBRUARY 2018 PharmTech.com 44 Pharmaceutical Technology FEBRUARY 2018 PharmTech.com Pharmaceutical and nutritional package integrity is often studied by incidental contamination, via immersion or aerosol microbiological challenge tests. Aerosol tests rely upon microorganisms settling from the atmosphere onto critical surfaces. Maintenance of a contaminated atmosphere is necessary to create the conditions that will cause a constant settling rate of the test microorganisms. Both parameters—maintenance of bioburden and duration of exposure—have to be monitored and controlled. It is important to understand the limitations of aerosol tests where the microbial contamination conditions are not maintained over the duration of the test. The following study describes a methodology to establish, control, and characterize an aerosolized bioburden within a test chamber and determine the settling rate of the bioburden. The intention of this paper is to stimulate the necessary discussion for the establishment of the standard criteria for all aerosol tests to generate comparable and reproducible data. DMITRY KALINOVSKY/SHUTTERSTOCK.COM Peer-Reviewed T he integrity of pharmaceutical and nutritional packag- ing is typically assessed by its ability to withstand mi- crobial challenge tests (1). These tests simulate worst- case scenarios that may be encountered during filling, shelf life, transport, and dispensing. There are two common microbial challenge methods: immersion and aerosol. In im- mersion tests, the critical surfaces of the package are placed into direct contact with a microbial broth containing test microorganisms (2). In aerosol tests, the package is exposed to aerosolized test microorganisms (3–5). Immersion tests, in which the microorganisms are certain to be in direct contact with the container, are considered more stringent than aero- sol tests for three main reasons: • The immersion bioburden is measured in colony-forming units per mL (CFU/mL), while the aerosol test bioburden is measured in CFU/m3, a 106 lower concentration. • Immersion test results are obtained in which the object or surface being tested is in direct contact with the chal- lenge microorganism suspended in the liquid medium. • In an aerosol test, the duration of exposure to a main- tained aerosol concentration determines the number of challenge particles settled onto the critical surfaces. Until a complete closure has been accomplished, packag- ing technologies are unlikely to pass an immersion test as described in Parenteral Drug Association (PDA) Technical Report (TR) 27 , sections 6.2 and 8.6 (2). Immersion tests, by design, simulate worst-case scenarios far outside of those provided while processing under FDA good manufacturing practice (GMP) conditions (6). Albeit less stringent than an immersion test, aerosol chal- lenges are increasingly more popular because they correlate directly to real-life situations experienced by sterile packages and devices during filling, storage, transport, and point-of- use. Aerosol tests can be designed to simulate specific sce- narios of non-classified atmospheres (4, 5). Several such aerosol case studies have been described in literature (4, 7). However, current guidelines for aerosol testing of package integrity as described in PDA-TR 27 (sections 6.3 and 8.7) do not allow for standardized and comparative data analy- Establishing Correlation Between Aerosol and Surface Microbial Populations F. Andreas Toba, David A. Miller, Bryan R. Campbell, Debashis Sahoo, James P. Agalloco, and Daniel Py Submitted: Aug. 25, 2017 Accepted: Dec. 8, 2017
Transcript of Peer-Reviewed Establishing Correlation Between Aerosol...
44 Pharmaceutical Technology Europe February 2018 PharmTech.com44 Pharmaceutical Technology February 2018 PharmTech .com
Pharmaceutical and nutritional package integrity is often studied by incidental contamination, via immersion or aerosol microbiological challenge tests. Aerosol tests rely upon microorganisms settling from the atmosphere onto critical surfaces. Maintenance of a contaminated atmosphere is necessary to create the conditions that will cause a constant settling rate of the test microorganisms. Both parameters—maintenance of bioburden and duration of exposure—have to be monitored and controlled. It is important to understand the limitations of aerosol tests where the microbial contamination conditions are not maintained over the duration of the test. The following study describes a methodology to establish, control, and characterize an aerosolized bioburden within a test chamber and determine the settling rate of the bioburden. The intention of this paper is to stimulate the necessary discussion for the establishment of the standard criteria for all aerosol tests to generate comparable and reproducible data.
Dm
itr
y K
al
ino
vs
Ky
/sh
ut
te
rs
to
cK
.co
m
Peer-Reviewed
The integrity of pharmaceutical and nutritional packag-ing is typically assessed by its ability to withstand mi-crobial challenge tests (1). These tests simulate worst-case scenarios that may be encountered during filling,
shelf life, transport, and dispensing. There are two common microbial challenge methods: immersion and aerosol. In im-mersion tests, the critical surfaces of the package are placed into direct contact with a microbial broth containing test microorganisms (2). In aerosol tests, the package is exposed to aerosolized test microorganisms (3–5). Immersion tests, in which the microorganisms are certain to be in direct contact with the container, are considered more stringent than aero-sol tests for three main reasons:•The immersion bioburden is measured in colony-forming
units per mL (CFU/mL), while the aerosol test bioburden is measured in CFU/m3, a 106 lower concentration.
• Immersion test results are obtained in which the object or surface being tested is in direct contact with the chal-lenge microorganism suspended in the liquid medium.
• In an aerosol test, the duration of exposure to a main-tained aerosol concentration determines the number of challenge particles settled onto the critical surfaces.
Until a complete closure has been accomplished, packag-ing technologies are unlikely to pass an immersion test as described in Parenteral Drug Association (PDA) Technical Report (TR) 27, sections 6.2 and 8.6 (2). Immersion tests, by design, simulate worst-case scenarios far outside of those provided while processing under FDA good manufacturing practice (GMP) conditions (6).
Albeit less stringent than an immersion test, aerosol chal-lenges are increasingly more popular because they correlate directly to real-life situations experienced by sterile packages and devices during filling, storage, transport, and point-of-use. Aerosol tests can be designed to simulate specific sce-narios of non-classified atmospheres (4, 5). Several such aerosol case studies have been described in literature (4, 7). However, current guidelines for aerosol testing of package integrity as described in PDA-TR 27 (sections 6.3 and 8.7) do not allow for standardized and comparative data analy-
Establishing Correlation Between Aerosol and Surface Microbial PopulationsF. Andreas Toba, David A. Miller, Bryan R. Campbell,
Debashis Sahoo, James P. Agalloco, and Daniel Py
Submitted: Aug. 25, 2017Accepted: Dec. 8, 2017

46 Pharmaceutical Technology Europe February 2018 PharmTech.com46 Pharmaceutical Technology February 2018 PharmTech .com
Peer-Reviewed
Al
l f
igu
re
s c
ou
rt
es
y o
f t
he
Au
th
or
.
sis. Aerosol testing relies upon microorganisms settling from the atmosphere onto the critical surfaces being tested (3–5). Therefore, the rate at which test microorganisms settle onto surfaces has to be determined for the test setup.
An initially established and continuously maintained level of contamination in the test environment is required to determine the duration of exposure that results in a pre-dictable bioburden accumulation on the surface to be tested. Bioburden accumulated on these surfaces as a function of the duration of exposure should be the common denomina-tor in aerosol challenge tests. In this study, bioburden was measured after different periods of exposure to establish a correlation between aerosolized bioburden and accumu-lated surface bioburden for a specific aerosol challenge test. This correlation can be used to determine the duration of exposure in a controlled aerosol chamber, which will pro-vide comparable and reproducible tests conditions for the test items.
In this article, the authors describe a methodology to es-tablish and control an aerosolized bioburden within a test chamber. The key test parameters to be measured were iden-tified and the accumulation of bioburden on surfaces tested inside the test chamber was studied as a function of time. This article also seeks to initiate the necessary efforts for the standardization of meaningful duration of exposure in aerosol challenge tests. Finally, this method can also be used as a risk-analysis tool for exposed surfaces of filling systems, closures, connectors, and devices that are dependent on the air quality of the surrounding environment.
Materials and equipmentThe materials and equipment were specially designed to achieve and maintain the desired aerosolized bioburden level. Equivalent material and equipment can be used if the key operational features are maintained or the methods adapted to achieve and maintain the desired aerosolized bio-burden.
The chamber (see Figure 1) consists of Plexiglas glued into an aluminum T-slotted frame box with four pairs of polyure-thane gloves, two nebulizers (one at each end of the chamber), programmable electrical outlet, three internal mixing fans, access door, air sampler, and air sample strips. The chamber is vented to the building exterior.
Black neoprene, 1.5-mm thick gloves that are chemical, oil, and ozone resistant were used.
Two DeVilbiss PulmoNeb LT nebulizers with a nebuliza-tion rate of 0.24 mL/min were used to aerosolize the test microorganism strains from the nebulizer stock and deliver them into the chamber. One nebulizer was located at each end of the chamber. The nebulizers conform to Healthcare Common Procedure Coding System Code E0570—Nebulizer: • Operating temperature range: +40 °F to +104 °F (+5 °C
to +40 °C)• Operating humidity: up to 95% non-condensing• Supplied nebulizer capacity: >10cc• Supplied nebulizer nebulization rate: 0.24 mL/min• Supplied nebulizer mass median aerodynamic diameter:
2.7 micron.The nebulizer stock consisted of a phosphate buffered sa-
line (PBS) stock that was made fresh overnight using test microorganisms culture, concentrated at 2-Logs (CFU/mL) above (100x) the desired chamber bioburden in CFU/m3. The formulation of the PBS stock solution (pH 7.2) is used in food, dairy, and pharmaceutical testing as referenced in AOAC International, American Public Health Association, FDA, US Department of Agriculture, and US Pharmacopeia test methods.
A programmable unit (VWR traceable time switch con-troller) was used to control the duration of nebulizer bursts of microorganisms and ensure the maintenance of the de-sired bioburden throughout the duration of the test.
Three Massey four-inch high-velocity desk fans, one at each end of the chamber above the nebulizers and the third in the center of the chamber, maintained a mixture of the aerosolized microorganisms.
Operated according to the manufacturer’s instructions, the air sampler (RCS HYCON) assessed the microbial popu-lation within the chamber. The total count agar (TCA) strips were incubated at 30–37 °C for the appropriate period of time (24–48 hours). Enumeration of these TCA strips confirmed that the target bioburden was maintained throughout the test.
A thermometer with clock and humidity monitor (VWR, 62344-734) was used to monitor the ambient tem-perature, humidity, and time.
At the completion of the test, the chamber was decontami-nated by manual wiping with 70% isopropyl alcohol.
ProceduresAchieving and maintaining the desired aerosol bioburden. The con-taminated environment in an aerosol challenge test needs to be contained in a defined chamber and made uniform by air circulation. The primary construction materials (acrylics,
Figure 1: Aerosol chamber, 183 cm x 84 cm x 76 cm (length x width x height), 1.168 m3 volume.

Pharmaceutical Technology Europe February 2018 47Pharmaceutical Technology February 2018 47
polyvinyl chloride, Plexiglas, etc.) of many aerosol chambers are prone to bacterial adhesion especially with fans pushing test microorganisms against these surfaces. When air samples are taken after setting a defined bioburden (CFU/m3) inside an aerosol chamber, enumeration counts will decrease at a rate governed by the chamber materials, internal objects, fan speed, nebulization rate, and settling rate of the microorganisms. Unlike the immersion test, the aerosolized bioburden in the chamber is dynamic, constantly settling, and thus diminish-ing in the chamber over time. To maintain a constant aerosol challenge level, the aerosolized bioburden must be periodically replenished with test microorganisms (Figure 2).
Several means were evaluated to achieve and maintain the desired aerosol bioburden inside the chamber. These mea-sures included using a variety of microorganisms, chamber management, and data capture and report.
Microorganisms. The choice of microorganisms is a com-promise between relevant species for the intended product, product storage conditions, and resilience of the bacterial species to aerosolizing procedures. It was acknowledged that a single bacterial strain would not suffice to fulfill all the selection criteria. Three test microorganisms were evaluated and the rationale for their inclusion in the proposed chal-lenge test has been outlined:• Bacillussubtilis ATCC# 6633, a common sporeforming
test microorganism• Enterobacteraerogenes ATCC#13048, a broad spectrum
substrate and motile test microorganism (Serratiamarc-escens is a possible substitute)
• Brevindumonasdiminuta ATCC#19146, an extremely small (0.31 um) test microorganism.
The challenge microorganisms were grown under optimal media/conditions (usually trypticase soy broth), 30 °C, aera-tion by shaking) overnight (approximately 16 hours) prior to the test (see ATCC for additional information specific to each microorganism). On the day of the test, a fresh culture was diluted in PBS to create the nebulizer stock suspension. The stock suspension was concentrated to 2-Logs above (100x) the desired chamber bio-burden (see Table I).
The stock suspension was enumerated by serial dilution on trypticase soy agar (TSA) plates to confirm the population.
Chamber management. The test chamber and its compo-nents were checked for integrity before every aerosol test. The major components of the test chamber included:• Neoprene gloves• Nebulizers (filled with stock suspension)• Programmable outlet• Mixing Fans•Air samplers and total count (TC) agar strips.Using the nebulizers, programmable outlet, and fans, the
microbial content of the chamber was elevated and main-tained at the desired challenge level (Log [CFU/m3]) as de-scribed in the following and depicted in Figure 3. The nebuliz-ers were maintained active during the charging phase (i.e., the first 20 minutes in the aerosol chamber as described). Once
the target bioburden concentration was reached, both nebu-lizers were inactived for a five-minute period. After the min-ute “off” period, both nebulizers were activated again. The
“on” and “off” cycle was repeated for the duration of the test.The recorded data should be included in the final report
(photos, tables, and graphs are recommended to support the data), including: stock suspension enumeration; room con-ditions (temperature, room humidity, and duration of test); air sampling times and populations; specific test character-istics; and exposure time. Appropriate negative and positive controls are used to confirm validity of the microbial tests.
Data capture and report. Periodic air sampling was per-formed using the RCS HYCON air sampler. The agar strips were incubated at optimal conditions for the test microor-ganisms. The bioburden was enumerated using the formula provided by the manufacturer (Figure 4):
Aerosol bioburden maintenance. Using the steps described in the previous section, the chamber was charged and main-tained at the target microbial levels for the duration of the test period (Table II).
During the tests, periodic air samples were taken to assess the aerosolized bioburden level inside the chamber.
Aerosol bioburden decay. Using the steps described, the chamber was initially charged to the target concentration, but not maintained at that level. Then, the aerosolized bio-
Figure 2: Bioburden dynamics and fate inside the aerosol chamber.
Table I: Nebulizer stock and target chamber bioburden.
Nebulizer stock log (CFU/mL)
Chamber bioburden (After charging and during
maintennace) log (CFU/m3)
8 6
7 5
6 4
5 3
4 2
3 1
CFU is colony-forming units.

48 Pharmaceutical Technology Europe February 2018 PharmTech.com48 Pharmaceutical Technology February 2018 PharmTech .com
Peer-Reviewed
burden was allowed to settle (Table III). During these studies, periodic air samples were taken (as described previously) to monitor the internal bioburden level.
Aerosol bioburden and surface bioburden accumulation. Using the steps described, the chamber was charged and main-tained at different microbial population levels ranging from 1-Log (CFU/m3) to 7-Log (CFU/m3).
The following steps were taken to capture the settling of the bacterial population onto TSA plates. A total of six plates were distributed along the base of the chamber. Three air samples were obtained for each test condition (Table IV).
After each air sample, two settling plates (for a total of six) were exposed to the aerosolized bioburden for a pre-determined time period (Table V). Surface enumerations and aerosol samples were correlated to study their relationship within the chamber.
Results and discussionAerosol bioburden maintenance. Following the procedure de-scribed, the air sampling results were plotted against time (Figure 5 and Figure 6).
After the initial charging period of 20 minutes, the aero-solized bioburden inside the chamber was maintained with periodic bursts of nebulized microorganisms. The aerosol-ized bioburden can be maintained over periods ranging from a few minutes (Figure 5) to several hours (Figure 6). The results obtained confirm that the method described allows for the establishment, maintenance, and control of a homogenous aerosolized bioburden. Also, a stable bioburden level can be maintained for several hours.
The rationale for continuous bioburden maintenance is that aerosolized microorganisms (and particles) settle on available surfaces over time, decreasing the number of microorganisms present in the environment and lowering the aerosol bioburden over time. The programmed bursts of nebulized bioburden replenish the environment, hence, main-taining the bioburden level over time as shown in Figure 5 and Figure 6. Without replenishment, the aerosol bioburden will result in a decay of aerosol population.
Aerosol bioburden decay. To determine the bioburden decay in the chamber without aerosol maintenance bursts, the chamber was initially charged, but the aerosol bioburden was not maintained with subsequent microbial injection. The air sampling population results were plotted against time (Figure 7).
After an initial charging period of 20 minutes, the aero-solized bioburden level inside the chamber reached the target concentration and then decayed over time when it is not maintained with periodic nebulized bursts. The results shown in Figure 7 confirm that without maintenance bursts, the aerosol bioburden decays with time, which will impact the total settling population available during the studied period. Therefore, maintaining the aerosolized bioburden as shown in Figure 5 and Figure 6 provides conditions for con-stant settling of the bioburden. A constant settling rate will enable the comparison and reproducibility of aerosol micro-bial challenge tests. Figure 8 describes the proposed steps in a constant aerosolized microbial challenge test.
Figure 3: Nebulizers “on” and “off” cycle.
Figure 4: Bioburden calculation using RCS HYCON, BioTest air sampler. CFU is colony-forming units.
Table II: Aerosol bioburden maintenance test conditions.
Test #
Aerosol bioburden maintenance
Target log (CFU/m3)
Charge (minutes)
Test aprox. duration (minutes)
Nebulizer stock enumerations log (CFU/ml)
1 6 to 7 20 60 8.77
2 6 to 7 20 60 8.78
3 6 to 7 20 60 8.60
4 3 to 4 20 70 5.74
5 3 to 4 20 50 5.78
6 3 to 4 20 520 5.74
7 3 to 4 20 520 5.97
CFU is colony-forming units.
Table III: Aerosol bioburden decay test conditions.
Test #
Aerosol decay
Target starting log (CFU/m3)
Test aprox. duration (minutes)
8 6 to 7 100
9 3 to 4 60
10 6 to 7 90
CFU is colony-forming units.

Pharmaceutical Technology Europe February 2018 49Pharmaceutical Technology February 2018 49
Aerosol bioburden and surface bioburden accumulation. To study the bioburden accumulation onto surfaces exposed to aerosol bioburden populations, the chamber was charged and main-tained following the steps described previously. The results of a series of experiments are shown in Table VI, and the data indicates a linear relationship between aerosol bioburden and surface bioburden accumulation over time (Figure 9).
The observed results confirm, as expected, that the level of aerosolized bioburden determines the surface bioburden accumulation over time of exposure (Table VI and Figure 9). Thus, a higher aerosol bioburden population will accumulate a higher surface bioburden per unit time. This is a settling rate of colony forming units per meter square per minute (CFU/[m2 min]), and it remains constant as long as the aero-sol bioburden is maintained constant (Figure 2). Thus, in an unmaintained aerosol bioburden scenario, the settling rate will decrease over time as the aerosolized bioburden is de-pleted and eventually exhausted (Figure 7).
The surface bioburden accumulation in a maintained aerosolized environment can be estimated using this con-stant settling rate (Figure 9). The bioburden accumulated on the surfaces essentially reaches a constant level over time (Figure 10) associated with the maintained aerosolized popu-lation. This minimum time of exposure should be used to carry out meaningful and reproducible aerosol challenge tests after all sample units have been exposed to similar conditions.
A constant settling rate allows the prediction of surface bioburden by using the correlation formula (Equation 1) ob-tained from the aerosol to surface bioburden accumulation (Figure 9) for the aerosol chamber:
y = 1.037x - 1.3055 (R2 = 0.9997)[Eq. 1]
where: x is the logarithm of the aerosol bioburden in CFU/m3 and y is the logarithm of the surface bioburden in CFU/m2 after one minute of exposure.
This formula can be used in risk assessment for tests car-ried out inside the chamber when the aerosolized bioburden is maintained as described. A similar approach has been pre-viously studied when calculating the likelihood of airborne contamination in controlled classified or non-classified en-vironments (8).
Similarly, an example of a controlled non-classified envi-ronment less than ISO 8 was studied. In this example, the measured aerosol bioburden was close to 3-Log (CFU/m3). Using Equation 2:
y = 1.037x - 1.30553 = 1.037x - 1.3055x = (3 – 1.3055)/1.037x = 1.63←Log (CFU/m2)/minute
[Eq. 2]
Table IV: Air sampling for each test.
Test #
Aerosol enumerations
Target log (CFU/m3)Volume
sampled (L)
1 6 to 7 1
2 6 to 7 1
3 5 to 6 2
4 4 to 5 2
5 4 to 5 5
6 4 to 5 10
7 3 to 4 50
8 2 to 3 100
9 2 to 3 100
10 1 to 2 1000
CFU is colony-forming units.
Table V: Settling plate exposure for each test.
Test #
Aerosol enumerations
Surface enumerations
Target log (CFU/m3)Plate exposure time
(minutes)
1 6 to 7 0.17
2 6 to 7 0.17
3 5 to 6 2
4 4 to 5 2
5 4 to 5 8
6 4 to 5 10
7 3 to 4 16
8 2 to 3 120
9 2 to 3 120
10 1 to 2 300
CFU is colony-forming units.
Figure 5: Aerosol bioburden maintenance. Results are shown for Test #1 through Test #5. Also depicted are the initial charge and the maintenance period with the periodic nebulizer bursts. CFU is colony-forming units.

50 Pharmaceutical Technology Europe February 2018 PharmTech.com50 Pharmaceutical Technology February 2018 PharmTech .com
Peer-Reviewed
After one minute of exposure, there is an accumulated sur-face bioburden of 1.63-Log (CFU/m2) or about 43 CFU/m2. If the critical surface of the neck opening of an unsealed 2-mL vial is 0.64 cm2, then the accumulated bioburden into that opening per minute is approximately 0.003 CFU. This im-plies a risk of three contaminated vials every 1000 exposed vials to a 3-Log (CFU/m3) environment for one minute.
If the level of aerosolized bioburden is increased to 4-Log (CFU/m3), the risk per minute of exposure increases to three contaminated vials every 100 exposed vials. If the analysis is done on a typical 250-mL bottle with a neck opening of 6.33 cm2, the risk of contamination increases to three contaminated vials every 10 exposed vials in a 4-Log (CFU/m3) environment.
The actual risk numbers are dependent on the chamber and procedures described, but the risk analysis can easily be correlated and used independent of the test chamber, as stated in the literature (8). From this analysis, it is evident
that the major governing parameters are the critical sur-face area and the time of exposure, as the environment of concern is either a set bioburden during a challenge test or refers to the low bioburden controlled, maintained, and monitored in classified environments. Thus, as stated in other studies, to minimize the risks of contamination, both critical surfaces and exposure time have to be minimized (8).
In the manufacture of sterile products, aseptic technolo-gies strive to control the two major risk factors in different ways (6). The vast majority of aseptic processing technolo-gies operate in classified environments (i.e., ISO 5), where the expected aerosol bioburden is kept low by sophisticated means. High-speed filling operations are often used to minimize critical surfaces exposure time (6). Other tech-nology approaches have engineered the reduction of the critical surfaces to be independent from time of exposure, and therefore, independent of classified environments (9).
ConclusionA 15-minute minimum duration of exposure within an es-tablished and maintained aerosol chamber has been shown to be the critical parameter needed for aerosol-based mi-crobial challenge tests to be comparable. For example, in a maintained 6-Log (CFU/m3) aerosol chamber, the biobur-den on the surface tested varies by a factor of 10, between two minutes and 10 minutes of exposure.
The procedure described proposes a method for stan-dardization and reproducibility of aerosol microbial challenge tests that allow for reproducible comparisons of performances and safety level between different devices, filling equipment, background environments, control pro-cedures, or aseptic processing technologies.
The constant settling rate that leads to increasing biobur-den accumulation on critical surfaces can be used to deter-mine a duration threshold for a discriminative aerosol chal-
Figure 6: Aerosol bioburden maintenance. Results are shown for Test #6 and Test #7. Also depicted are the initial charge and the maintenance period with the periodic nebulizer bursts. CFU is colony-forming units.
Figure 7: Aerosol bioburden decay. Results are shown for Test #8 through Test #10. Also depicted are the initial charge and the decay period. CFU is colony-forming units.
Figure 8: Proposed steps in an aerosol microbiological challenge test. Step-P: pre-test activities. Step 1: charge, to elevate the chamber bioburden to test levels using the programmable nebulizers. Step 2: maintenance of bioburden using the programmable nebulizers for successive tests. Step 3, Step 4, and Step N: exposure time during the maintenance (Step 2) for test units or test groups; the exposure time of 15 to 60 minutes is suggested considering the settling rates calculated below (see Table VI).

Pharmaceutical Technology Europe February 2018 51Pharmaceutical Technology February 2018 51
lenge test. The standardization of aerosol tests is a necessity for the “x” Log proof claims to be meaningful and comparable.
References 1. L. Li, “Advances in Container Closure Integrity Testing”, Sterile Prod-
uct Development, P. Kolhe, M. Shah, and N. Rathore, Eds. pp. 315-329 (Springer, New York, NY, Vol. 6, 2013).
2. PDA Technical Report No. 27, “Pharmaceutical Package Integrity,” PDA Journal of Pharmaceutical Science & Technology, 52 (S-2). 1998.
3. ASTM F1608, Standard Test Method for Microbial Ranking of Porous Packaging Materials (Exposure Chamber Method) (2009).
4. S. Keller, J. Marcy, B. Blakistone, and G. Lacy, Proceedings of the In-ternational Symposium Advances in Aseptic Processing and Packaging Technologies, SIK (Goteborg, Sweden, 1995).
5. S. Keller, et al., Journal of Food Protection 59 (7) 768–771 (1996). 6. FDA, Guidance for Industry: Sterile Drug Products Produced by Asep-
tic Processing—Current Good Manufacturing Practice (Washington, DC, 2004).
7. C. Chen, et al., Journal of Food Protection. 54 (8) 643–647 (1991). 8. W. Whyte, Journal of Parenteral Science and Technology, 40 (5) 188-197
(1986). 9. Program for Appropriate Technology in Health (PATH), “Review of
Multi-Dose Primary Packaging and Delivery Systems for Vaccines Without Preservatives,” PATH Internal Report (draft), 2014. PT
F. Andreas Toba* is vice president, Intact Pharma Operations, [email protected]; David A. Miller is manager, Device Performance Engineering; Debashis Sahoo is executive vice-president, Regulators & Key Customers; and Daniel Py is chairman and CEO—all at MedInstill Development. Bryan R. Campbell is a Doctor of Osteopathic Medicine at Touro University Nevada; and James P. Agalloco is president, Agalloco & Associates, and a member of the Pharmaceutical Technology editorial advisory board.*To whom all correspondence should be addressed.
Table VI: Aerosol bioburden and surface bioburden accumulation.
Test#
Aerosol enumerations Surface enumerationsSurface bioburden
accumulation per minute
Volume sampled
Average colonies per
strip
Log (CFU/m3)
Exposure time (minutes)
Average colonies per
plateCFU/m2 Log
(CFU/m2)
1 1 3890.45 6.59 0.17 467.08 350000.00 5.54
2 1 1000.00 6.00 0.17 110.11 82508.75 4.92
3 2 240.45 5.08 2 133.45 8500.00 3.93
4 2 144.89 4.86 2 80.07 5100.00 3.71
5 5 125.59 4.40 8 125.60 2000.00 3.30
6 10 100.00 4.00 10 54.62 695.82 2.84
7 50 50.00 3.00 16 8.03 63.90 1.81
8 100 19.95 2.30 120 11.31 12.01 1.08
9 100 10.00 2.00 120 5.53 5.87 0.77
10 1000 18.15 1.26 300 2.36 1.00 0.00
CFU is colony-forming units.
Figure 9: Aerosol bioburden and surface bioburden accumulation. Settling plates were exposed inside the aerosol chamber charged and maintained to different aerosolized bioburden levels. CFU is colony-forming units.
Figure 10: Estimated bioburden accumulation in a 6-Log (CFU/m3) aerosol atmosphere inside the aerosol chamber. The accumulated bioburden reaches a plateau after 15 minutes of exposure. This exposure time could be considered as a minimum because the change in accumulated bioburden after this time point is minimal. CFU is colony-forming units.