Peelian Principle in a Data-Driven World, By The R Simmons group
13
Peelian Principles in a Data-Driven World: How data-driven solutions can help law enforcement drive community engagement, and manage crisis.
-
Upload
rufus-simmons-iiimba -
Category
Government & Nonprofit
-
view
10 -
download
0
Transcript of Peelian Principle in a Data-Driven World, By The R Simmons group

Peelian Principles in a Data-Driven World:How data-driven solutions can help law enforcement drive community engagement, and manage crisis.

Introduction
Nearly two hundred years after his death the father of modern policing, Sir Robert Peel, fills this need. Just as we used his principles to define our mission and strategies, we can use them to adopt data-driven solutions in a way that builds partnerships. We used his seventh principle as a guide for our analysis of the opportunities and challenges these solutions present.
Our analysis identified the challenges in building partnerships with the use of data-driven solutions. To do so you must develop an ability to: identify the directionality of each solution, build and recognize community trust, develop a proficiency in aligning data-driven solutions to your tactics and to the community.
The planning phase is not just solution identification and time lines. Remember, perception is reality, so a communication plan that informs and elicits input is vital. Then long-term success is ensured with two steps. A feedback loop that monitors data effectiveness and use, while a performance management systems keeps the chosen solutions aligned with the departments goals and delivering on tactics. This white paper presents our theories, analysis, and the steps to ensure your adoption of data-driven solutions drive community engagement and help you manage your next crisis.
Police, at all times, should maintain a relationship with the public that gives reality to the historic tradition that the police are the public and the public are the police; the police being only members of the public who are paid to give full-time attention to duties which are incumbent on every citizen in the interests of community welfare and existence.
“
”Seventh Peelian Principle
The good news is that after last year’s 22-year record low, America’s confidence in the police has edged up a bit. (Newport, 2016) The bad news, support is cyclical and unfortunately the next crisis will cause confidence to dip again.
All crises affect our relationship with the communities we serve, even a slow drip non-acute crisis can create a groundswell. We see this as we move into the era of data-driven policing, because some people think these solutions will usher in the era of Big Brother. They see them as intrusive and overreaching, and straining what is already an uneasy relationship.
Our challenge, how do we inform communities that data-driven solutions are a tool to increase the personalization of policing for their members? It will take some heavy lifting, but we use the solutions themselves to show communities they bring us together. All we need is a guide on how to be viewed as a partner, and not big brother.

The strategic goal of technology adoption was identified in The RAND Corporation’s, The Visions of Law Enforcement Technology in the Period 2024-2034. “SAFE STREETS,” is the position law enforcement will occupy when it effectively adopts technology while maintaining society’s backing.
RAND developed a matrix to illustrate desirable and undesirable positions. The axis represents the drives-technology adoption, and societal support. Technology adoption must keep pace with criminal adoption, and allow law enforcement to fulfill its mission. But, it must be in balance with, and keep law enforcement in sync with society so that it can maintain its support.
THE STRATEGIC GOAL
RAND states that any path to SAFE STREETS will contain ebbs in flow because law enforcement must gauge and readjust its tactics since technology and society will constantly evolve. Along with identifying a strategic goal, the report also identifies less desirable positions. The four quadrants of the matrix and their characteristics are:
The Visions of Law Enforcement Technology in the Period 2024-2034 is a ground-breaking report because it lays out the landscape associated with law enforcement’s technology adoption. Peelian Principles in a Data-Driven World aligns this strategic goal with tactical execution. (Silberglitt, et al., 2014)
MeanStreets
Criminal’Advantage
Technology Axis
Effective use in performingfuture missions
Ineffective usein performingfuture missions
Law enforcementopposed (out of synch)So
ciet
y Ax
is2014
CommunicationsTraining
Partnerships
Law enforcementsupported (in synch)
(Silberglitt, et al., 2014)
ToughLove
SafeStreets
SAFE STREETS (Northeast) - the most desirable position, where police effectively use technology to increase public safety and share information in a non-intrusive manner so that law enforcement is supported.
TOUGH LOVE (Northwest) - here police effectively use technology, but in an intrusive manner which leads to society’s distrust, resulting in non-support for law enforcement.
CRIMINALS ADVANTAGE - (Southeast)- this position represents law enforcement not utilizing technology well, however it is in sync with and supported by society.
MEAN STREETS (Southwest) - here law enforcement is ineffective in its use of technology, and is out of sync and unsupported by society.

“Technology strategies must balance inward and outward facing solutions that inform, and elicit community input while offering tangible results that improve the everyday lives of community members.”
Is your current technology tactical or operational? Every police department needs CAD, RMS, mobile data terminals, computers, and modern forms of defensive tools, because these essential tools improve operational efficiency. Operational efficiency is driven by inward facing tools, while outward facing solutions drive community engagement, and managing crisis.
INWARD VERSUS OUTWARD FACING SOLUTIONS
Perception is reality when it comes to a community’s view of its police department’s use of technology. Available solutions may not align a police department with the community it serves. Balance is the key.
In a neighborhood where a high volume of calls for service make it difficult for officers to interact with community, officers may be seen as a necessary evil. Take this a step further. What if the neighborhood officer is observed parked in a cruiser equipped with a license plate reader while he, or she, types on a mobile terminal, and then every so often stops a car to issue a citation?
Or, a police department identifies a gunshot using gunshot detection technology, and subsequently uses city cameras to identify a suspect. With this information, they pull officers unfamiliar with the neighborhood and its residents in to assist with searches. Although necessary, this is a highly volatile and dangerous situation for the officers and community.
The biggest problem is that when the data-driven solutions in these examples are used as standalone solutions, they will be viewed as intrusive. Therefore, technology strategies must balance inward and outward facing solutions that inform an elicit community input while offering tangible results that improve the everyday lives of community members.
ANALYSIS & PLANNING

“The best indicator of community trust is the presence of vibrant information sharing that enables the community to become an extension of your police department.”
Outward facing data-driven solutions are tactical tools to help us connect with community members, and give them input into matters that affect their quality of life. These solutions can help build trust, but to get the full potential from any of these solutions we must look at them from the perspective of a community member.
DATA-DRIVEN SOLUTIONS AS TACTICAL TOOLS
Police, at all times, should maintain a relationship with the public that gives reality to the historic tradition that the police are the public and the public are the police; the police being only members of the public who are paid to give full-time attention to duties which are incumbent on every citizen in the interests of community welfare and existence
“
”Seventh Peelian Principle
The best indicator of community trust is the presence of vibrant information sharing that enables the community to become an extension of your department. With greater transparency and engagement, the community can see officers as an extension of the community, and officers can begin to see themselves as community members, vested in its success.
Therefore, analysis of outward facing data-driven solutions should focus on platforms and methods that better enable us to leverage data externally, and help the community share information comfortably and easily with the police. The building of trust through back and forth information sharing helps us prepare for the next crisis.
The Philadelphia Police Department turned what could be viewed as an inward facing solution, into an outward facing one that allowed the community to increase the quality of life for its members. The PPD used analysis from a hot spot identifier to inform the community of areas susceptible to burglaries. With an informed community, burglaries dropped by 39% in the targeted sector. (Richey, 2014) The Philadelphia Police Department could have put cops on dots, or took a hard look at suspects which would have risked alienating the community at large, instead it educated and enlisted help. This is a perfect example of how a data driven solution drove community engagement and helped manage a crisis.

“Community members may see the mission of reducing the fear of crime as something intangible, but with data-driven solutions we can inform them of the conditions that invite crime so they become partners in the reduction of both crime and its fear.”
In economically depressed communities it is especially important for us to balance and align data- driven solutions with community needs. These communities pay a high price for, “The fear of crime,” because it drives down economic value with reduced earnings, results in declining property values, and negatively impacts community members’ upward mobility.
ALIGNING THE SOLUTION AND COMMUNITY NEEDS
The cost of the fear of crime was identified in Hidden in Plain Sight, What Cost of Crime Research Can Tell Us About Investing in The Police. This RAND report identified the tangible and intangible cost of crime, where most of the intangible cost is the result of the fear of crime. It is interesting that the report stated that only 35% of the costs of all crimes are tangible and directly tied to the crime, while 64% are intangible and indirect cost such as lost productivity and quality of life measures. Rape at 94% has the highest intangible cost. (Heaton, 2010)
Community members may see the mission of reducing the fear of crime as something intangible, but, as with the Philadelphia example, we can inform them about the conditions that invite crime so they become partners in the reduction of both crime and its fear. We can also use outward facing tools such as social media platforms to gather information and engage the community in dialogue. This will keep us informed and build trust with the community so that we can enlist their help when the next crisis arises.
Trust is what cements the police’s relationship with community’, and consistency is the key in building it. It is not just consistency of use with data-driven solutions, it’s also consistency of balancing inward and outward facing solutions, and consistency of alignment with the community and its needs.
ALIGNING THE SOLUTION AND COMMUNITY NEEDS
Trust gives the community courage to share information that benefits us. Two of the many crucial benefits are, it increases department effectiveness by fueling analytical and predictive tools, and it provides information to complete reports that will ultimately help close open cases.

“Consistently utilizing data-driven solutions to drive community engagement will increase the community’s desire to help law enforcement in times of crisis. The Boston Police Department’s data-driven strategy paid off when it needed the community’s help the most.”
A great example of effective use of outward facing technology is the Boston Police Department, and it’s use of social media to stop the spread of false information and widen the search for the Boston Marathon bombing suspects.
This effort did not start after the bombings, it began when then Commissioner Edward Davis oversaw the development of a strategy to extend community policing efforts onto socialmedia platforms by utilizing Twitter, Facebook, Pinterest, and YouTube.
BOSTON POLICE DEPARTMENT EXTENDS COMMUNITY POLICING EFFORTS
The BPD created its official Twitter account in 2009. Like all other police departments, it initially used Twitter to share general information with the city. Over time, efforts became more personalized with initiatives such as “, Tweets from the Beat,” which began in 2011. With Tweets from the Beats ranking officers from across the city created their own Twitter accounts and provided residents localized information about their neighborhood. The social media strategy was successful in growing the BPD’s social media followers, prior to the 2013 Boston Marathon it had 40,000 Twitter followers.
These efforts paid off with the terrorist attack on the 117th running of the Boston Marathon. Immediately following the bombings Commissioner Davis ordered his media relations department to keep the public informed using all social media channels. Then two days into the search for the suspects CNN mistakenly reported the suspects had been caught. This report was magnified when the Associated Press joined CNN in tweeting the original report which led to 5,000 retweets. BPD responded with a single tweet that no arrest had been made. Then BPD’s social media followers showed the power of its strategy by retweeting the post close to 11,00 times.
Had the Boston Police not effectively engaged the community with the use of Twitter, and other social media platforms, the CNN report could have been very damaging. This false report and the subsequent postings may have slowed down public reporting, and might have helped the suspects elude authorities. But, two years of active engagement with city neighborhoods demonstrated the BPD’s commitment to being a part of the community, and drove the community to respond when most needed (Davis III, Alves , & Sklansky, 2014).

“A good technology strategy complements the department’s strategy, its goal is to improve and complement tactical initiatives, and any data-driven solution used should communicate its value to the community.”
We have already identified the strategic goal, learned how to use the seventh Peelian Principle as guide, and analyzed techniques to evaluate effective use of data-driven solutions. Now we can apply this knowledge to develop and execute technology strategies that align data-driven solutions with our mission and strategy.
DEVELOPING & EXECUTING TECHNOLOGY STRATEGY
`
A good technology strategy complements the department’s strategy, its goal is to improve and complement tactical initiatives. These six steps create the technology strategy by articulating:
Information inventory - provides a summary of the various department processes, functions, data entities, and informational needs of the department. This inventory will define both current and expected future information requirements.
Mission and objectives of technology - include a primary role and goals of the technology within the department.
Constraints and influences of technology deployment - describes limitations of the technology and how it may influence an officer’s decisions. This is important because all technology should complement the officers’ intuitions and field work, not replace it.
Short-term plan - of technology implementation
Long-term plan - identifies applications that allow for overall system growth and easy solutions adoption.
Risk Management - evaluates the technology strategy and plans to identify likely but not certain events that may affect either
To avoid data-driven solutions being viewed as intrusive we should look at their tactical applications, and how they communicate their value to the community. Otherwise, the community will not cooperate with their use, and it will move the department into Mean Streets.
IDENTIFY REQUIREMENTS AND OUTPUT

CREATE A COMMUNICATION PLAN
“It is a mistake to limit input on technology decisions to executive level leadership. Two-way communication with all levels of the department, and community is critical.”
A great communication strategy lays the groundwork for successful technology adoption. The technology strategy must have:
Committed executive level involvement- Technology supports management and tactics. So, the technology strategy must parallel the departmental strategy, and be accepted by department leadership.
Community communication strategy- The adoption of technology must not be viewed as intrusive, especially since the success of many of the elements will depend upon community input. It must also communicate value through its alignment with the improvement of departmental tactics that engage and inform the community.
A structured decision making process- All issues should be escalated in a consistent manner. This will demonstrate that the technology and personnel are in place to support all solutions and their users.
An effective model for department wide communication- It is a mistake to limit input on technology decisions to executive leadership. Two-way communication with all levels of the department, and community is critical.
Tactical level alignment and communication- Every technology solution should be utilized by the entire department in a manner which aligns with the user’s responsibility level, the communication must be two way since front line officers will provide the data to fuels the technology, and they will be the first to see where improvements are needed.
The communication strategy is not something you begin and end once the technology strategy has been executed, “and data-driven solutions are in place. This plan will continue to evolve just as the data-driven solutions and their applications will.

DEVELOP A FEEDBACK PLAN
“The community and officer interaction provides the fuel for data-driven solutions to refine strategy. This refines tactics and identifies more effective uses of resources to produce better results and data output, to again optimize the system.”
A formal feedback loop ensures continuous improvement of any applied data-driven solutions. It is especially essential for police departments since the one constant we all deal with is changing conditions. A feedback loop for data-driven solutions produce data which allow the department to:
Set Priorities- by completing the data cycle, police departments can prioritize actions that will improve community engagement, or whatever metric they are measuring.
Identify data discrepancies- It will also identify discrepancies in input data, and that can be used to address operational issues with those efforts which produce the input data.
Improve performance- by analyzing the data output you can identify what inputs have the greatest impact on the desired outcome.
Identify which budget items are cost effective- knowing what training, partnership development, or staffing needs effect data-driven solutions most is step toward improvement.
The diagram above illustrates how the flow of data improves the department’s execution. The community and officer interaction provides the fuel for data-driven solutions to refine strategy, which in turn refines tactics to identify more effective uses so resources produce better results and data output, to again optimize the system.
PERFORMANCE MANAGEMENT SYSTEM
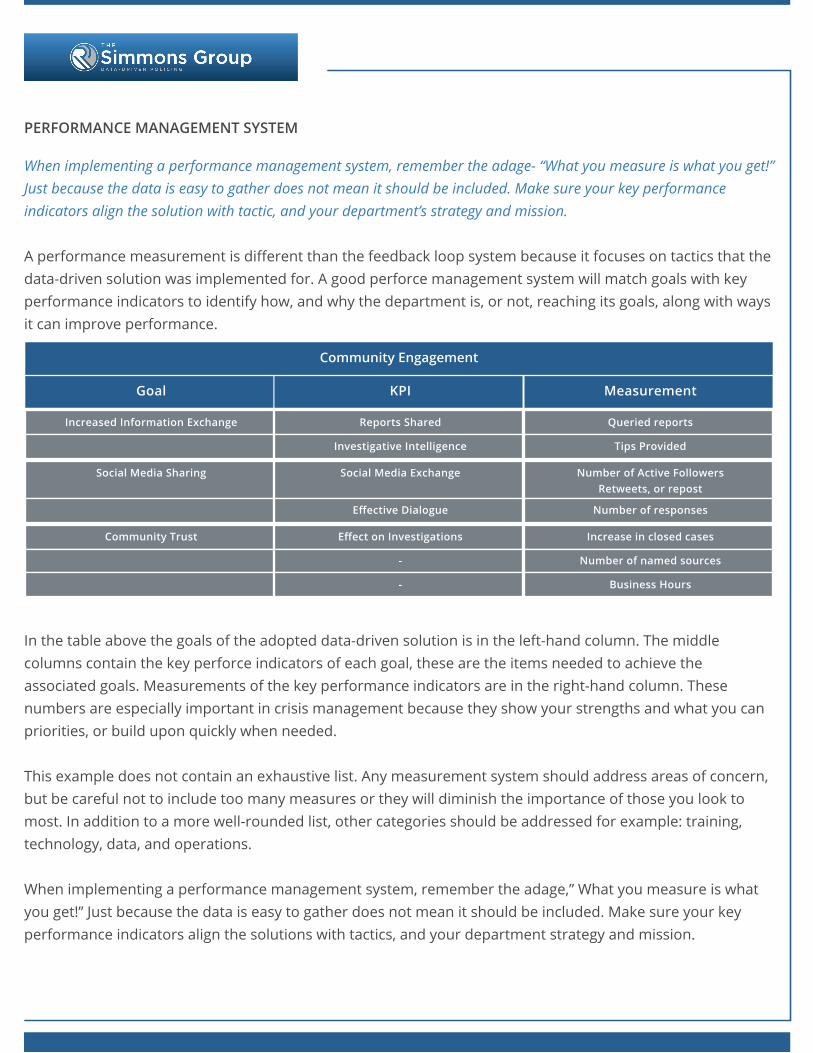
When implementing a performance management system, remember the adage- “What you measure is what you get!” Just because the data is easy to gather does not mean it should be included. Make sure your key performance indicators align the solution with tactic, and your department’s strategy and mission.
A performance measurement is different than the feedback loop system because it focuses on tactics that the data-driven solution was implemented for. A good perforce management system will match goals with key performance indicators to identify how, and why the department is, or not, reaching its goals, along with ways it can improve performance.
In the table above the goals of the adopted data-driven solution is in the left-hand column. The middle columns contain the key perforce indicators of each goal, these are the items needed to achieve the associated goals. Measurements of the key performance indicators are in the right-hand column. These numbers are especially important in crisis management because they show your strengths and what you can priorities, or build upon quickly when needed.
This example does not contain an exhaustive list. Any measurement system should address areas of concern, but be careful not to include too many measures or they will diminish the importance of those you look to most. In addition to a more well-rounded list, other categories should be addressed for example: training, technology, data, and operations.
When implementing a performance management system, remember the adage,” What you measure is what you get!” Just because the data is easy to gather does not mean it should be included. Make sure your key performance indicators align the solutions with tactics, and your department strategy and mission.
Community Engagement
KPIGoal Measurement
Reports SharedIncreased Information Exchange Queried reports
Investigative Intelligence Tips Provided
Social Media ExchangeSocial Media Sharing Number of Active FollowersRetweets, or repost
Effective Dialogue Number of responses
Effect on InvestigationsCommunity Trust Increase in closed cases
-Increased Information Exchange Queried reports- Number of named sources
- Business Hours

The data-driven world is here to stay! We need to embrace it because data-driven solutions hold promise in helping us achieve our mission. How do we shape data-driven policing for success now, and into the future? The answer is not too difficult. In the true nature of the Peelian Principles we adopt data-driven solutions with an eye towards trust. Each police department’s relationship with the community it serves is its most valuable asset, especially in times of crisis. We demonstrate and gain trust through our actions and the alignment of chosen solutions.
Every neighborhood has its own unique makeup and challenges, and obtaining its trust is a tailored exercise. Data-driven solutions provide us with the ability to create tailored approaches to individual neighborhoods, because we can create precision with the most relevant data. This will go a long way in shifting the talk from big brother to personalized policing.
How can data-driven solutions better connect your department with the community it serves? What kind of tactical advantages can your department achieve with the use of data-driven solutions? How might they benefit your department, your officers, and community members? The approaches offered in this white paper can help you assess your local situation. Also, raising the topic of data-driven solutions with department personnel, and municipal and community leaders can yield useful insight into options and approaches to consider; as well as, create agreement for practical applications in the adoption of data-driven solutions.
CONCLUSION
The R Simmons Group leverages 100+ years of combined experience from data scientists, sociologists, technologists, and police officers to drive tangible outcomes by.
For information contact [email protected]
Davis III, E. F., Alves , A. A., & Sklansky, D. A. (2014). Social Media and Police Leadership: Lessons From Boston. Cambridge MA.: Harvard Kennedy School Program in Criminal Justice Policy and Mangement & National Institute of Justice.
Heaton, P. (2010). Hidden in Plain Sight, What Cost-of-Crime Research Can Tell Us About Investing in Police. Santa Monica, CA: The RAND Corporation.
Newport, F. U.S. Confidence in Police Recovers From Last Year's Low. Source: Gallup, (2016, Dec. 10) (2016, June 14).http://www.gallup.com/poll/192701/confidence-police-recovers-last-year-low.aspx.
Richey, E. How Data Analysis Helps Police Departments Fight Crime. Forbes,(11 Nov. 2016) (2014, June 3).http://www.forbes.com/sites/emc/2014/06/03/data-analysis-helps-police-departments-fight-crime/#2bad32c243e8.
Silberglitt, R., Chow, B. G., Hollywood, J. S., Woods, D., Zaydman, M., & Jackson, B. A. (2014). Visions of Law Enforcement Technology in The Period 2024-2034. Santa Monica, Calif.: The RAND Corporation.
References