Pedigree analysis of 5 swine breeds in the United States ... analysis of 5 swine...58.6% for...
11
C. S. Welsh, T. S. Stewart, C. Schwab and H. D. Blackburn genetic conservation Pedigree analysis of 5 swine breeds in the United States and the implications for doi: 10.2527/jas.2009-2537 originally published online February 26, 2010 2010, 88:1610-1618. J ANIM SCI http://www.journalofanimalscience.org/content/88/5/1610 the World Wide Web at: The online version of this article, along with updated information and services, is located on www.asas.org by guest on January 11, 2014 www.journalofanimalscience.org Downloaded from by guest on January 11, 2014 www.journalofanimalscience.org Downloaded from
Transcript of Pedigree analysis of 5 swine breeds in the United States ... analysis of 5 swine...58.6% for...

C. S. Welsh, T. S. Stewart, C. Schwab and H. D. Blackburngenetic conservation
Pedigree analysis of 5 swine breeds in the United States and the implications for
doi: 10.2527/jas.2009-2537 originally published online February 26, 20102010, 88:1610-1618.J ANIM SCI
http://www.journalofanimalscience.org/content/88/5/1610the World Wide Web at:
The online version of this article, along with updated information and services, is located on
www.asas.org
by guest on January 11, 2014www.journalofanimalscience.orgDownloaded from by guest on January 11, 2014www.journalofanimalscience.orgDownloaded from

ABSTRACT: Globally, genetic diversity of livestock populations is contracting. Knowing the true extent of the contraction is needed to develop effective conser-vation strategies. Although contractions of genetic di-versity have been documented at the breed level, little within breed documentation has occurred. This situa-tion is no different for US swine breeds. Therefore, the objective of this study was to establish an inbreeding baseline for 5 pig breeds via pedigree records extract-ed from purebred registrations to each breed associa-tion for Berkshire (n = 116,758), Duroc (n = 878,480), Hampshire (n = 744,270), Landrace (n = 126,566), and Yorkshire (n = 727,268). For all breeds the number of registrations peaked after 1990 and declined since that time. The breeder structure was analyzed for Berkshire and Duroc; the average breeder registered pigs for 4.0 yr for both breeds. Breeders were grouped by longevity and herd size, and the inbreeding levels for the cur-rent population (pigs born 2006 and later) were evalu-ated. Presently, more than 99% of all pigs are inbred with the majority having inbreeding less than 10%. The range for percentage of animals that are more than 25% inbred ranged from 1.16% for Yorkshire to 6.09%
for Berkshire. The greatest inbreeding for all animals within a breed ranged from 51% for Landrace and 65% for Yorkshire. Sires were grouped into 10 percentiles based on number of great-grandprogeny (GGP) pro-duced; for all breeds, the top 10 percentile accounted for more than 75% of all GGP. Sixty percent of all sires produced less than 1% of all GGP, indicating few males are contributing to future generations. Genera-tions ranged from 17 to 19 per breed with a generation interval ranging from 1.65 yr for Berkshire to 2.21 yr for Yorkshire. Mean inbreeding (%) at generation 17 (the most generations computed across breeds), rate of inbreeding per generation, and effective population size were 12.3, 0.0065, and 77 for Berkshire; 11.8, 0.0044, and 113 for Duroc; 6.8, 0.0046, and 109 for Hampshire; 17.9, 0.0067, and 74 for Landrace; and 8.0, 0.0044, and 113 for Yorkshire, respectively. The 2 breeds with few-est registrations, Berkshire and Landrace, had greater inbreeding rates and smaller effective population sizes, suggesting a need for more immediate conservation ef-forts. This analysis provides a basis for future monitor-ing of the genetic diversity of pig breeds and serves as a basis for planning conservation activities.
Key words: genetic conservation, genetic diversity, inbreeding, swine
©2010 American Society of Animal Science. All rights reserved. J. Anim. Sci. 2010. 88:1610–1618 doi:10.2527/jas.2009-2537
INTRODUCTION
Globally and within the United States there has been a contraction in animal genetic resources (Blackburn et al., 2003; FAO, 2007). To address the contraction and
potential loss of animal genetic resources, the USDA es-tablished the National Animal Germplasm Program to conserve livestock genetic resources (Blackburn, 2004, 2009). Ideally, genetic conservation efforts would cap-ture all available alleles and their combinations in a population; collecting and cryopreserving germplasm samples allows these alleles to be made available for future use.
Evaluating the genetic diversity within a breed is also a requisite for genetic conservation. Fortunately, many breeds have pedigree information to serve as the ba-sis for such an analysis. Breed-wide reports on levels of inbreeding for beef and dairy have been published. For example, Cleveland et al. (2005) reported inbreed-ing levels for Hereford cattle, the most complete analy-
Pedigree analysis of 5 swine breeds in the United States and the implications for genetic conservation1
C. S. Welsh,* T. S. Stewart,† C. Schwab,‡ and H. D. Blackburn*2
*National Animal Germplasm Program, National Center for Genetic Resources Preservation, ARS, USDA, Fort Collins, CO 80521; †Department of Animal Sciences, Purdue University, West Lafayette, IN 47907;
and ‡National Swine Registry, West Lafayette, IN 47996
1 Mention of a trade name or proprietary product does not con-stitute a guarantee or warranty by the USDA and does not imply approval to the exclusion of other products that may be suitable. USDA, ARS, Northern Plains Area, is an equal opportunity/affir-mative action employer. All agency services are available without discrimination.
2 Corresponding author: [email protected] September 29, 2009.Accepted January 18, 2010.
1610
by guest on January 11, 2014www.journalofanimalscience.orgDownloaded from
sis of that breed in the United States since the 1930s (Willham, 1937), and Wiggans et al. (1995) published inbreeding levels for Ayrshire, Brown Swiss, Guernsey, Holstein, Jersey, and Milking Shorthorn cattle. To date, no such breed-wide analysis has been performed for US Berkshire, Duroc, Hampshire, Landrace, and Yorkshire breeds. Partial analyses for these breeds have been per-formed in the US and Canada, but they lacked a long-term perspective and did not evaluate the status of the entire breed (Highfill et al., 1982; Hubbard et al., 1990). Rathje (2000) points out that 4 of the study breeds are used by breeding companies to form composite popula-tions, underscoring their importance in supporting ge-netic progress and therefore a need to understand the level of genetic diversity. Therefore the objective of this study was to fill this information void by establishing a baseline for 5 major pig breeds. Specifically, to derive measures of inbreeding, trends in registration, breeder structure, generation intervals, and effective population size.
MATERIALS AND METHODS
Animal Care and Use Committee approval was not obtained for this study because the study did not uti-lize any live animals. Pedigree records were obtained from the National Swine Registry for Duroc, Hamp-shire, Landrace, and Yorkshire; Berkshire records were obtained with approval from the American Berkshire Association.
For each breed, a complete pedigree was built until all ancestors were unknown using the Animal Breeders Tool-Kit (ABTK; Golden et al., 1992). The stack_ped option in the ABTK was used to generate a list of ani-mals that appear as both a sire and dam in the pedigree and animals that appear as their own parent. Inbreed-ing coefficients (F) were computed using the ABTK and serve as the primary basis for the evaluation.
Founder animals, defined as having both parents unknown, were assigned a generation number of zero. Then, subsequent generation numbers (g) were calcu-lated iteratively as
g = 1/2(gs + gd) + 1,
where gs is the generation number of the sire and gd is the generation number of the dam (MacKinnon, 2003). Generation number was compared with mean inbreeding, percentage of inbred animals, and number of years of registrations to determine any associations or trends.
Regression procedures were performed using SAS (Cary, NC). Increases in inbreeding per generation (ΔF) were calculated by regressing individual inbreed-ing coefficients on generation number (MacKinnon, 2003). Contrast statements were used to test for dif-ferences in ∆F among breeds. Effective population size
(Ne), defined as the number of individuals that would generate the current level of inbreeding, was computed as
Ne = 1/(2 ∆F)
(Falconer and Mackay, 1996). Generation intervals (GI) were computed by regressing generation number on birth year (MacKinnon, 2003). Contrast statements were used to test breeds for differences in generation intervals. To determine if inbreeding levels were influ-enced by declining number of registrations, the rate of change of inbreeding was compared with the rate of change of number of registrations per year, and correla-tions were computed for each breed.
To obtain a current assessment of inbreeding levels for each breed, the inbreeding frequencies were calculated for animals born 2006 and later (using the relationships from the entire pedigree). Coefficient of relationship be-tween boars provides an assessment of future inbreed-ing. The boars that are producing the majority of the offspring are driving changes in genetic diversity and the inbreeding levels for each population. Therefore, the approach by VanRaden and Smith (1999) was used to compute the coefficient of relationships between the top 10% of boars, as defined by number of progeny registered, for 2006 and later. The top 10% of boars included 90, 160, 114, 40, and 199 Berskshire, Duroc, Hampshire, Landrace, and Yorkshire males, respec-tively. To further assess the genetic relationship within each breed, influential males were determined by com-puting the number of great-grandprogeny (GGP) reg-istered in the entire pedigree and were grouped into 10 percentiles; each percentile included 675, 2,662, 2,321, 737, and 4,046 males for Berkshire, Duroc, Hampshire, Landrace, and Yorkshire, respectively.
In general, the number of breeders producing breed-ing stock within any breed has decreased. Evaluating the number of breeders and the length of time a breeder has registered animals provides insight into potential losses of genetic diversity. To make such an assessment, breeder summary statistics were computed for the breed with the fewest registrations (Berkshire) and the most registrations (Duroc) to evaluate how breeder structure influences the genetic diversity of the breed.
Breeder statistics included number of breeders, geo-graphic location, and years they registered pigs of a particular breed. Breeders were grouped into longevity groups of 1 to 3, 4 to 6, 7 to 9, 10 to 12, and 13 and more years of registering pigs as described by Maiwashe and Blackburn (2003) and were evaluated using con-trast statements in SAS for differences in inbreeding levels. Average herd size for birth years 2006 to 2008 was computed and grouped into 1 to 5, 6 to 20, 21 to 50, and more than 50 pigs registered per year, and dif-ferences in inbreeding levels were evaluated using con-trast statements in SAS.
Pedigree analysis of 5 swine breeds in the United States 1611
by guest on January 11, 2014www.journalofanimalscience.orgDownloaded from

RESULTS AND DISCUSSION
Population Status
Summary statistics for each breed are shown in Table 1. In general, records started being stored in electronic format for each breed registry around 1980. Number of registrations peaked in 1990 for all breeds, except Berk-shire, which peaked in 2000. From 2001 to the pres-ent, registration numbers have declined for all breeds. Comparing peak year registrations with registrations in 2007 showed a decline of 59.8, 92.8, 95.2, 73.0, and 58.6% for Berkshire, Duroc, Hampshire, Landrace, and Yorkshire, respectively. Duroc registrations, the most populous breed, declined from 176,621 in 1990 to 12,787 in 2007. This decline in registrations is indicative of the shift of the swine industry from reliance on purebred populations to large breeding companies that primarily develop and market composite populations.
Number of dams outnumbered number of sires by approximately 4 to 1. The most offspring registered for a single sire for lifetime production by breed was 481, 3,797, 1,624, 949, and 1,417, whereas the single dam lifetime count was 80, 99, 96, 84, and 142 for Berkshire, Duroc, Hampshire, Landrace, and Yorkshire, respec-tively. The most prolific Duroc male registered more than 38 times more offspring than the most prolific Duroc female, showing how influential individual boars are within a breed.
The Food and Agriculture Organization of the United Nations (FAO, 2000) suggested the Ne for a breed be maintained above 50; however, Meuwissen and Wool-liams (1994) suggested a minimum range for Ne of 31 to 250 to maintain population fitness. By both bench-marks, Duroc, Hampshire, and Yorkshire have relative-ly robust Ne levels. The Ne values for Berkshire and Landrace are smaller and therefore may warrant ad-ditional attention. Inbreeding rate is another criterion for measuring population health, and Nicholas (1989) has recommended a ∆F rate of <0.005, whereas the
FAO (2000) suggested a ∆F rate of <0.01 as a goal. All breeds meet the FAO goal, but Berkshire and Landrace are greater than the rate suggested by Nicholas (1989). All breeds had a ∆F that was significantly different from each other (P < 0.0001). A rapid turnover of gen-erations for all breeds was found, ranging from 1.65 yr for Berkshire to 2.21 yr for Yorkshire. Generation inter-vals (Table 1) were significantly different among breeds (P < 0.0001); however, this difference was just over 6 mo between the longest and shortest GI.
With the increase in AI in the swine industry (Black-burn, 2003), it will be important to ensure inbreeding levels do not increase more rapidly than they currently are; therefore, the swine industry may wish to incorpo-rate approaches into their genetic evaluation programs that minimize the rate of inbreeding (e.g., Meuwissen, 1997).
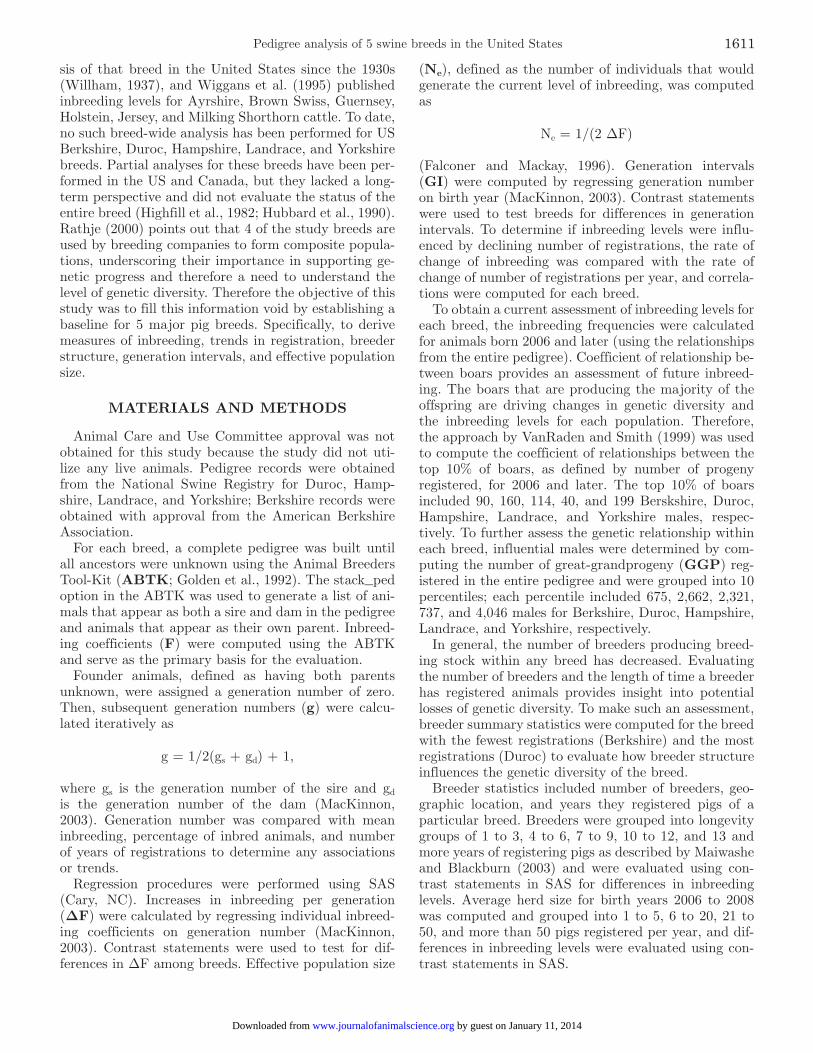
The mean F for each breed is reported in Table 1; however, because most of those animals are no longer actively contributing genes to the future generations, reporting the mean F values as representing the entire breed underestimate the inbreeding present in the cur-rent population, although this value is routinely report-ed. For Canadian pigs, Hubbard et al. (1990) reported average inbreeding levels of 0.75, 0.66, 0.53, and 0.70% for 10 yr for Duroc, Hampshire, Landrace, and York-shire, respectively; they assumed all ancestors before the 10-yr period were unrelated, while acknowledging this was unlikely. Clearly, the inbreeding levels of the US population exceed those of the Canadian population, although the Canadian numbers are likely underesti-mated. Knowing the status of the current population is crucial for conservation activities. Figure 1 shows the percentage of animals, born 2006 or later, with various inbreeding levels for the 5 breeds. Berkshire (44.7%) and Landrace (39.9%) had the greatest percentages of animals with F > 0.10 compared with the other breeds. In contrast, Duroc had 64% of the current population with F ≤ 0.05 and 88% with F ≤ 0.10.
Table 1. Summary statistics for pedigree file size, inbreeding (F), sires and dams, change in inbreeding per gen-eration (∆F), generation interval (GI), effective population size (Ne), coefficient of relationship between sires, and boars in repository for all breeds
Item Berkshire Duroc Hampshire Landrace Yorkshire
Pedigree file size 116,758 878,480 744,270 126,566 727,268Mean F 0.078 0.032 0.036 0.053 0.039F range 0 to 0.61 0 to 0.58 0 to 0.59 0 to 0.51 0 to 0.65Unknown sires, % 1.27 1.15 1.04 2.37 3.23Unknown dams, % 1.26 1.13 1.02 2.38 3.44Unique sires1 6,748 26,615 23,206 7,370 40,458Unique dams1 27,487 126,289 100,246 28,827 175,985∆F 0.00647a 0.00442b 0.00458c 0.00674d 0.00443e
GI, yr 1.65a 1.92b 2.06c 1.83d 2.21e
Ne 77.28 113.12 109.17 74.18 112.87Coef. of relationship2 0.135 (90) 0.083 (160) 0.122 (114) 0.129 (40) 0.116 (119)Boars in repository, n 29 50 33 29 91
a–eWithin a row, values without a common superscript differ (P < 0.0001).1Unique sires and dams include any boar or sow that produced any number of progeny.2Coefficient of relationship between top 10% of sires producing the most progeny born 2006 and later, number boars in parentheses.
Welsh et al.1612
by guest on January 11, 2014www.journalofanimalscience.orgDownloaded from
The coefficient of relationships between the top 10% of sires producing the most progeny born 2006 and lat-er are shown in Table 1. With the exception of Duroc, on average the most popular boars for the remaining 4 breeds had a relationship as close as first cousins.
After 17 generations (the most generations computed to allow for comparison across all breeds) Landrace had the greatest mean F of 17.9% (Figure 2). That is ev-ery animal being, on average, somewhere between half-siblings (12.5%) and full-siblings (25%). As a breed, Hampshires had the least F (6.8%). Whereas inbreeding tends to be less for this breed, the average relationship of Hampshires is greater than first cousins, suggesting even the breed with the least inbreeding is at risk for losing genetic diversity.
The progression of inbreeding for Berkshires is note-worthy (Figure 2); of particular interest is the decrease in inbreeding after 10 generations. Generations 10 through 12 generally correspond to the years 1993 to 2000. The decrease in inbreeding may be attributable to a change in breeding strategies to facilitate the mar-keting of Berkshire pork in US and Japanese markets, which began in 1994. The Berkshire Gold Program, started in 1994, and the Royal Berkshire Program, started in 1998, were eventually replaced by the 100% Berkshire Program, which markets Berkshire pork from certified herds to Japan and the United States for a
premium. This program guarantees the animals mar-keted are 100% Berkshire, traceable to source farms, and from herds that meet the National Pork Board’s Pork Quality Assurance Level III guidelines (McMullen, 2006). Berkshire registrations were steady throughout the late 1980s and early 1990s, but began to increase steadily in 1995 until the peak in 2000. The increased value of Berkshire pigs brought about by specialized marketing programs further suggests that mating deci-sions changed for this breed, resulting in a decline of inbreeding. This is a similar situation to that observed in Hereford cattle by Cleveland et al. (2005).
After 12 generations, for all breeds, all animals had an F > 0 (Figure 3). All breeds followed a similar rate of increase in the proportion of inbred animals. A steady increase in the proportion of inbred animals was also reported by Hubbard et al. (1990).
Figure 4 shows how the average generation number increased with number of registration years. The steep-est ascent was observed for Berkshire, which also had the shortest GI. Yorkshire generation number plateaued during registration yr 20 to 24, which corresponds to 1992 to 1996. Upon investigation, it was determined there were 13 imported animals, or sons of imported animals, that were contributing between 216 and 1,019 offspring per boar during this time period. To verify if these animals were reducing the slope of the curve, they
Figure 1. Inbreeding coefficient frequencies by breed for animals born 2006 and later.
Pedigree analysis of 5 swine breeds in the United States 1613
by guest on January 11, 2014www.journalofanimalscience.orgDownloaded from

were assigned the average generation number for their birth year, and the generation numbers of the popula-tion were recalculated. The slope of the curve increased (Figure 5), showing how influential a few heavily used
imported males were for the Yorkshire breed. The influ-ence of imports was also observed by Cleveland et al. (2005) in Hereford cattle and Hubbard et al. (1990) in Duroc and Hampshire pigs.
Figure 2. Inbreeding by generation number for all breeds.
Figure 3. Percentage of animals with inbreeding coefficient (F) >0 by generation number for all breeds.
Welsh et al.1614
by guest on January 11, 2014www.journalofanimalscience.orgDownloaded from

To better understand the association between the rates of change in inbreeding and number of regis-trations per year, within breed correlations were per-
formed. The correlations were 0.24, 0.38, 0.31, 0.58, and 0.20 for Berkshire, Duroc, Hampshire, Landrace, and Yorkshire, respectively, indicating a modest, but
Figure 4. Generation number by number of years of registrations for all breeds.
Figure 5. Generation number by number of years of registrations for Yorkshire and for Yorkshire adjusted for 13 sires.
Pedigree analysis of 5 swine breeds in the United States 1615
by guest on January 11, 2014www.journalofanimalscience.orgDownloaded from
nonsignificant (P > 0.05), association between the rates of change in inbreeding and number registered. This result suggests that other factors influenced inbreed-ing besides population size; otherwise the correlations would have been closer to unity. One factor expected to influence inbreeding levels is the popularity of particu-lar boars, regardless of the population size.
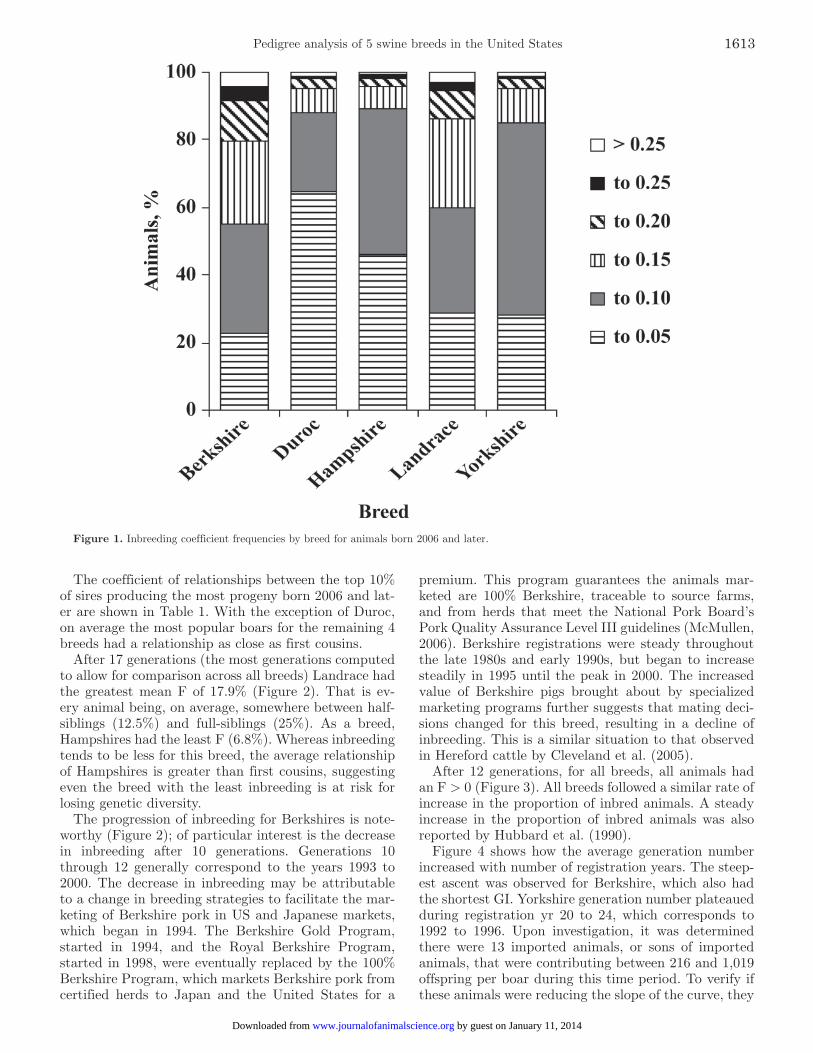
To evaluate the importance of the most popular boars, the number of GGP registered were computed and were grouped into 10 percentiles (Figure 6). The top 10% of males produced more than 75% of all GGP for all breeds; in Duroc and Hampshire this was more pronounced (85 and 87%, respectively). Heavier use of a small proportion of available boars implies a greater selection intensity, which might be expected for Du-roc and Hampshire because they tend to be used as sire breeds. However, it is interesting that these breeds have smaller inbreeding levels (Figure 1). Perhaps, this smaller level may be due to larger populations. The bottom 60% of sires produced less than 1% of GGP across breeds. Considering how few males are selected to become sires, and even fewer of those selected males are producing the majority of GGP, suggests the ge-netic base can contract in a few generations.
Breeder Dynamics
Breeder summary statistics are shown in Table 2. Berkshire breeders were found in 39 states, whereas Duroc breeders were in 47 states plus Puerto Rico. In addition, the Duroc is internationally important, being
found in 93 countries (FAO, 2007). The top 5 states by number of Berkshire breeders were Oklahoma, Indiana, Illinois, Texas, and Iowa; breeders from these states ac-counted for 60.5% of all pigs registered. The greatest concentration of Berkshire pigs was in Iowa, Illinois, In-diana, Minnesota, and Wisconsin. Trends and rankings have changed over time; when looking at the current population of pigs born 2006 and later rather than the entire population, the most number of breeders were found in Indiana, Oklahoma, and Illinois, whereas the most pigs were in Iowa, Indiana, and Illinois. For Du-roc, the top 5 states by number of breeders were Indi-ana, Oklahoma, Texas, Illinois, and Ohio, accounting for 46.5% of pig registrations. The most pigs were reg-istered in Illinois, Indiana, Ohio, Iowa, and Nebraska. Reranking occurred in the current Duroc population; the most breeders of pigs born 2006 and later are lo-cated in Indiana, Texas, and Illinois, with the most pigs being concentrated in Indiana, Illinois, and Ohio.
The inbreeding levels for the current population (pigs born 2006 and later) were evaluated for differences by breeder longevity group, and the results are presented in Figure 7. Although some of the within breed groups were statistically different from one another (P < 0.02), there was no trend for either breed to conclude the results are biologically important. As with all breeds in the study, the Berkshire and Duroc fulfill different markets, and differences in breeder structure were ex-pected to exist that would assist in identifying areas of opportunity to manage genetic diversity in each breed. Maiwashe and Blackburn (2004) discussed the poten-
Figure 6. Influential males grouped into 10 percentiles by number of great-grandprogeny registered for all breeds.
Welsh et al.1616
by guest on January 11, 2014www.journalofanimalscience.orgDownloaded from

tial impact of short-term ownership on Navajo Churro sheep genetic diversity, and the average ownership of Berkshire and Duroc pigs being only 4.0 yr suggests that those breeders with less time invested in either breed might tend to have a greater inbreeding level than more established breeders. The longest-term Berkshire breeders had a reduced inbreeding level (2.7%) than the shortest-term breeders (P < 0.0001). However, the lon-gest-term Duroc breeders had a greater inbreeding level (1.4%) than the shortest-term breeders (P < 0.0001). The lack of a consistent trend for these 2 breeds may suggest that due to the relatively larger number of pig breeders (vs. Navajo Churro breeders), the effects of breeder dynamics are dampened.
Inbreeding levels were evaluated for differences by average herd size (Figure 8). Similar to the results for differences in longevity group, herd size showed no de-finitive trend despite some of the within-breed groups being statistically different from each other (P < 0.05). For Berkshire, herd sizes greater than 50 animals had a reduced inbreeding level than the other 3 groups (P < 0.05). For Duroc, herd sizes of 1 to 5 animals had a greater inbreeding level than herd sizes 6 to 20 animals (P < 0.04), with no other statistical differences among the other herd sizes. From a practical standpoint, herd size does not appear to influence inbreeding levels.
Conclusions
This study serves as a baseline for these 5 pig breeds in the United States. Having estimated effective popu-lation size, inbreeding levels, and inbreeding rates pro-vides greater insight about the genetic diversity of these breeds which can be used in conservation strategies. Al-though the inbreeding levels are useful genetic diversity indicators, the depth of the pedigrees is relatively shal-low given the initial import dates (1820 to 1830) into the US Berkshire, Duroc, Hampshire, and Yorkshire, and the 1930s for Landrace (McMullen, 2006; National Swine Registry, 2009). Due to the pedigree depth, it might be safely assumed the reported inbreeding levels are underestimates. However, the rate of change in in-breeding is likely not to be biased and is in fact an im-portant indicator of how quickly genetic diversity may be contracting which can be utilized in genetic resource management. Analysis using DNA markers might fur-ther elucidate within breed genetic diversity and the genetic differences among the breeds presented in this study (e.g., Vicente et al., 2008).
Berkshire and Landrace are borderline for both effec-tive population size and increase in inbreeding per gen-eration, whereas Duroc, Hampshire, and Yorkshire are within acceptable levels. Berkshire and Landrace also had the fewest registrations, increasing the challenge
Table 2. Summary statistics for number of breeders, mean and range of number of years of registering animals, and peak number of active breeders for Berkshire and Duroc
Item Berkshire Duroc
Breeders, n 1,596 7,481Mean years registering animals 4.0 4.0Range of years registering animals 1 to 33 1 to 31Peak active breeders, n (year) 361 (2007) 1,604 (1989)
Figure 7. Inbreeding level by longevity group for Berkshire and Duroc pigs born 2006 and later. a–dValues are within breed, and those without a common letter differ (P < 0.02). Values above each bar are the number of breeders.
Figure 8. Inbreeding level by average herd size for Berkshire and Duroc pigs born 2006 and later. a,bValues are within breed, and those without a common letter differ (P < 0.05). Values above each bar are the number of breeders.
Pedigree analysis of 5 swine breeds in the United States 1617
by guest on January 11, 2014www.journalofanimalscience.orgDownloaded from

breeders face making mating decisions that minimize long-term inbreeding and maximize performance.
Over the past 2 decades the swine breeding industry has been restructured toward corporate breeding com-panies developing proprietary composite lines that have replaced a significant portion of the purebred seedstock industry. The status of the rate of inbreeding for such composite populations is unknown and not formally part of this analysis. Furthermore, it is not clear how frequently and to what order of magnitude pigs from purebred breeders migrate into composite populations. Based upon Rathje (2000), Danish Landrace, Hamp-shire, and Duroc nucleus herds (which are part of a cor-porate breeding strategy) had levels of ∆F and GI that suggest a slightly faster contraction of genetic diversity than what was found in this report. We also know that breeding companies can and do set limits on the extent to which high performing boars are used and as a re-sult are able to control ∆F among their populations. Whereas breeding companies may successfully control ∆F, the tendency for inbreeding to increase over time will still exist, and if for no other reason corporations will still depend upon various purebred populations as a source of lowly related breeding stock.
The current trends suggest level of inbreeding will continue to rise, if so and accompanied by artificial se-lection, the potential for changing allele frequencies or loss of alleles or both could be a concern. Such a situ-ation can be managed at the in situ and ex-situ levels. For in situ purebred and composite populations, there is a need to incorporate mating strategies that control the rate of inbreeding (Meuwissen, 1997). As an alternative for some breeds or populations, the establishment of a set of rules that limit the impact of individual sires or dams by limiting the number of progeny utilized in future matings could be established (Rathje, 2000). However, for such procedures to function, a method of compensating a breeder for foregoing additional profits from a specific animal would have to be established.
Ex situ germplasm collections held by gene banks are also a source of genetic variability for industry to utilize. For such collections to have utility, they must contain a broad sampling of minimally related animals. In addition, the frequency of collection efforts must be such as to ensure the genetics contained in the collec-tion are relevant to the industry. To date, the National Animal Germplasm Program has initiated germplasm collections on all 5 breeds (Table 1); however, addition-al collections are needed and planned to complete the process. With the completion of the germplasm collec-tion for each of these breeds, a greater level of protec-tion will be afforded the swine industry.
LITERATURE CITED
Blackburn, H. D. 2004. Development of national animal genetic re-source programs. Reprod. Fertil. Dev. 16:27–32.
Blackburn, H. D. 2009. Genebank development for the conservation of livestock genetic resources in the Unites States of America. Livest. Sci. 120:196–203.
Blackburn, H. D., T. Stewart, D. Bixby, P. Seigel, and E. Brad-ford. 2003. United States of America Country Report for FAO’s State of the World’s Animal Genetic Resources. http://www.ars.usda.gov/Main/docs.htm?docid=18527 Accessed Mar. 20, 2009.
Cleveland, M. A., H. D. Blackburn, R. M. Enns, and D. J. Garrick. 2005. Changes in inbreeding of U.S. Herefords during the twen-tieth century. J. Anim. Sci. 83:992–1001.
Falconer, D. S., and T. F. C. Mackay. 1996. Introduction to Quanti-tative Genetics. 4th ed. Longman Group Ltd., Essex, UK.
FAO. 2000. Secondary guidelines for development of national farm animal genetic resources management plans: Management of small populations at risk. UN Food and Agric. Org. http://www.fao.org/AG/AGAInfo/resources/en/pubs_gen.html Ac-cessed Mar. 12, 2009.
FAO. 2007. The state of the world’s animal genetic resources for food and agriculture. UN Food and Agric. Org. http://www.fao.org/docrep/010/a1250e/a1250e00.htm. Accessed Aug. 19, 2009.
Golden, B. L., W. M. Snelling, and C. H. Mallinckrodt. 1992. Ani-mal breeders tool-kit: user’s guide. Colorado State Univ., Exp. Sta. Tech. Bull. LTB92–2.
Highfill, G. A., D. S. Buchanan, and C. V. Maxwell. 1982. Inbreed-ing and relationship among prominent Hampshire boars. Okla-homa Agric. Exp. Stn., Oklahoma State Univ., 1982 Anim. Sci. Res. Rep. 312–315.
Hubbard, D. J., O. I. Southwood, and B. W. Kennedy. 1990. Rates of inbreeding in Yorkshire, Landrace, Duroc, and Hampshire performance tested pigs in Ontario. Can. J. Anim. Sci. 70:401–407.
MacKinnon, K. M. 2003. Analysis of inbreeding in a closed popula-tion of crossbred sheep. MS Thesis. Virginia Poly. Inst. State Univ., Blacksburg.
Maiwashe, A. N., and H. D. Blackburn. 2004. Genetic diversity in and conservation strategy considerations for Navajo Churro sheep. J. Anim. Sci. 82:2900–2905.
McMullen, L. K. 2006. Berkshire swine production and market-ing: Berkshire niche market opportunity guidelines. Iowa State Univ., Anamosa, IA. http://www.nichepork.org/Documents/Berkshire%20Production%20and%20Marketing%20Report%20-%208%2022%2006.pdf Accessed Sep. 8, 2009.
Meuwissen, T. H. E. 1997. Maximising the response of selection with a predefined rate of inbreeding. J. Anim. Sci. 75:934–940.
Meuwissen, T. H. E., and J. A. Woolliams. 1994. Effective sizes of livestock populations to prevent a decline in fitness. Theor. Appl. Genet. 89:1019–1026.
National Swine Registry. 2009. http://www.nationalswine.com/in-dex.html Accessed Sep. 9, 2009.
Nicholas, F. W. 1989. Incorporation of new reproductive technology in genetic improvement programmes. Pages 201–209 in Evolu-tion and Animal Breeding. W. G. Hill and T. F. C. Mackay, ed. CAB Int., Wallingford, UK.
Rathje, T. A. 2000. Strategies to manage inbreeding accumulation in swine breeding company nucleus herds: Some case studies. J. Anim. Sci. 79:1–8.
VanRaden, P. M., and L. A. Smith. 1999. Selection and mating considering expected inbreeding of future progeny. J. Dairy Sci. 82:2771–2778.
Vicente, A. A., M. I. Carolino, M. C. O. Sousa, C. Ginja, F. S. Silva, A. M. Martinez, J. L. Vega-Pla, N. Carolino, and L. T. Gama. 2008. Genetic diversity in native and commercial breeds of pigs in Portugal assessed by microsatellites. J. Anim. Sci. 86:2496–2507.
Wiggans, G. R., P. M. VanRaden, and J. Zuurbier. 1995. Calcula-tion and use of inbreeding coefficients for genetic evaluation of United States dairy cattle. J. Dairy Sci. 78:1584–1590.
Willham, O. S. 1937. A genetic history of Hereford cattle in the United States. J. Hered. 28:283–294.
Welsh et al.1618
by guest on January 11, 2014www.journalofanimalscience.orgDownloaded from

Referenceshttp://www.journalofanimalscience.org/content/88/5/1610#BIBLThis article cites 12 articles, 6 of which you can access for free at:
Citationshttp://www.journalofanimalscience.org/content/88/5/1610#otherarticlesThis article has been cited by 1 HighWire-hosted articles:
by guest on January 11, 2014www.journalofanimalscience.orgDownloaded from