Pediatric Obesity Interventions Marsha D. Marcus, Ph.D. June 7, 2007.
92
Pediatric Obesity Interventions Marsha D. Marcus, Ph.D. June 7, 2007
-
Upload
jordan-greer -
Category
Documents
-
view
216 -
download
2
Transcript of Pediatric Obesity Interventions Marsha D. Marcus, Ph.D. June 7, 2007.
Pediatric Obesity Interventions
Marsha D. Marcus, Ph.D.
June 7, 2007
Overview
• Obesity in children
• Efficacious lifestyle interventions
• Family-Based Treatment of Severe Pediatric Obesity
• Obesity Prevention Trial
Definition of Obesity
• Obesity refers to an excess of adiposity that increases the risk for medical morbidity
• Body weight in excess of a standard weight has been the most common index of obesity
• However, overweight does not always reflect adiposity, especially in children
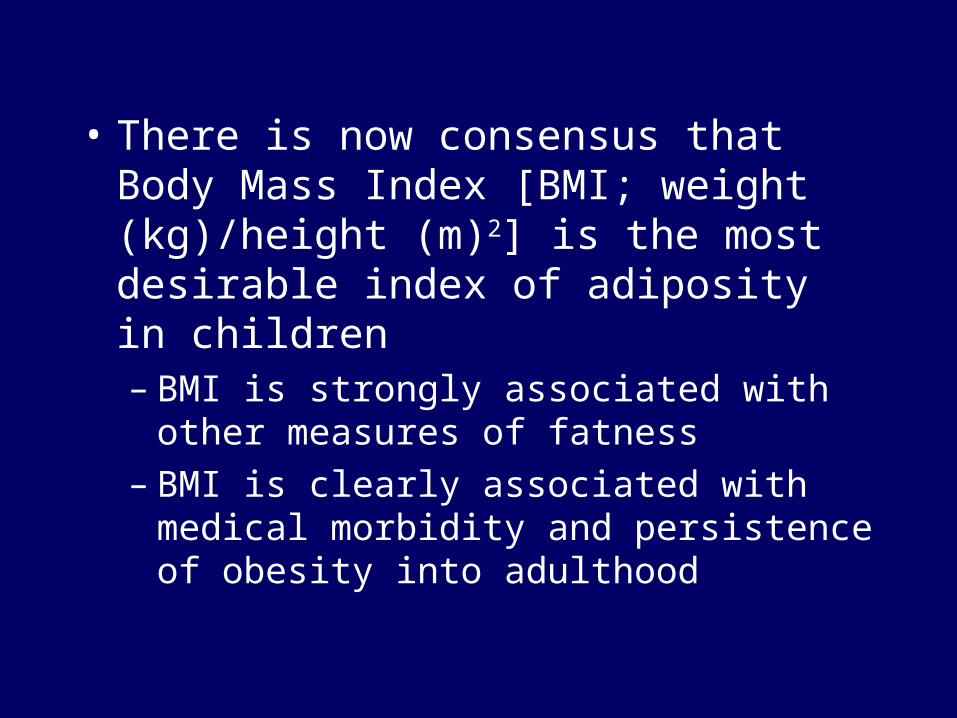
• There is now consensus that Body Mass Index [BMI; weight (kg)/height (m)2] is the most desirable index of adiposity in children– BMI is strongly associated with other
measures of fatness– BMI is clearly associated with medical
morbidity and persistence of obesity into adulthood
• The National Center for Health Statistics provides pediatric growth charts that provide age and sex specific norms for BMI
http://www.cdc.gov/growthcharts
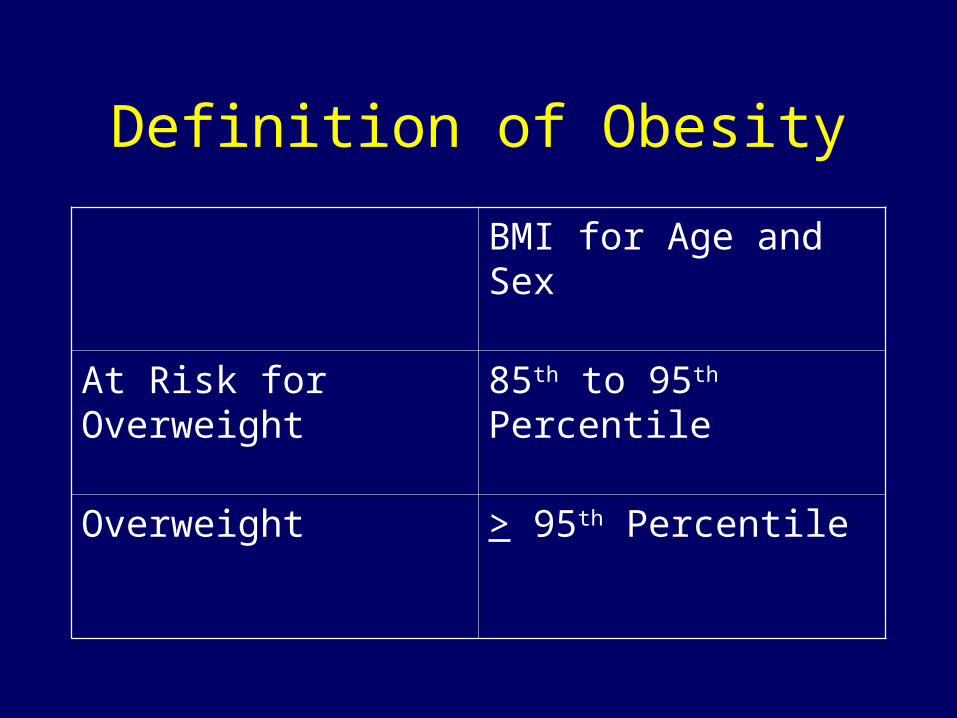
Definition of Obesity
BMI for Age and Sex
At Risk for Overweight 85th to 95th Percentile
Overweight > 95th Percentile
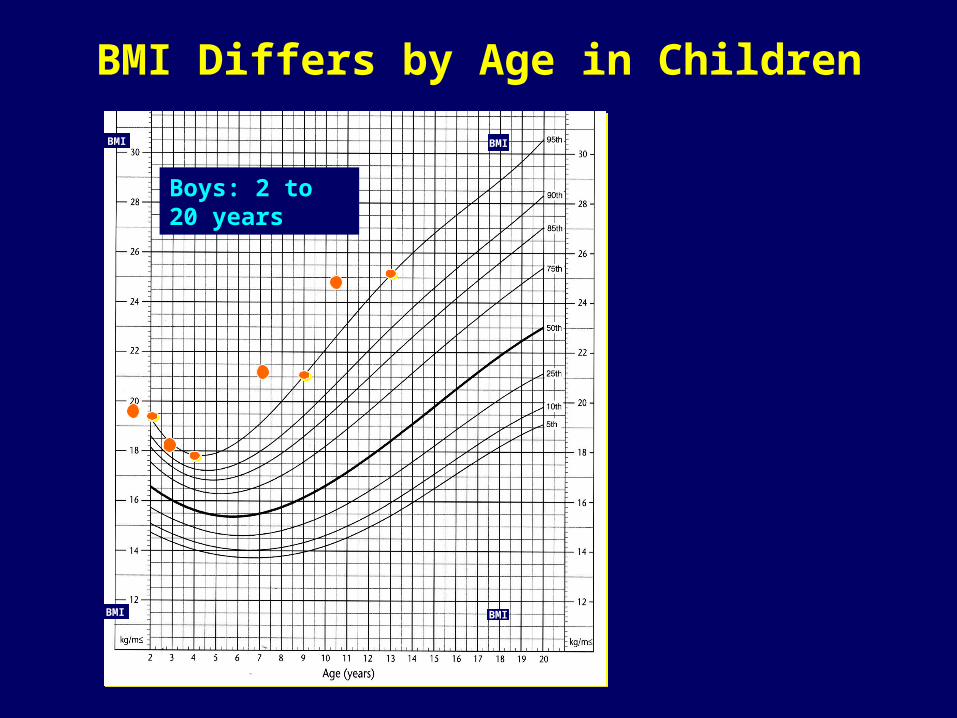
BMI Differs by Age in Children
Boys: 2 to 20 years
BMI BMI
BMI BMI
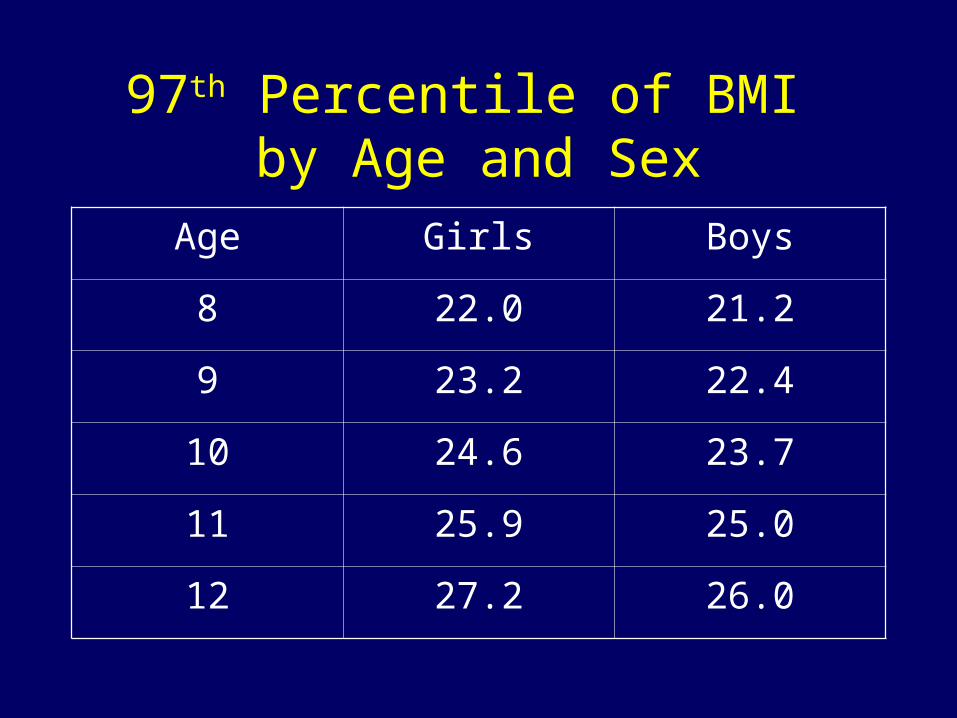
97th Percentile of BMI by Age and Sex
Age Girls Boys
8 22.0 21.2
9 23.2 22.4
10 24.6 23.7
11 25.9 25.0
12 27.2 26.0
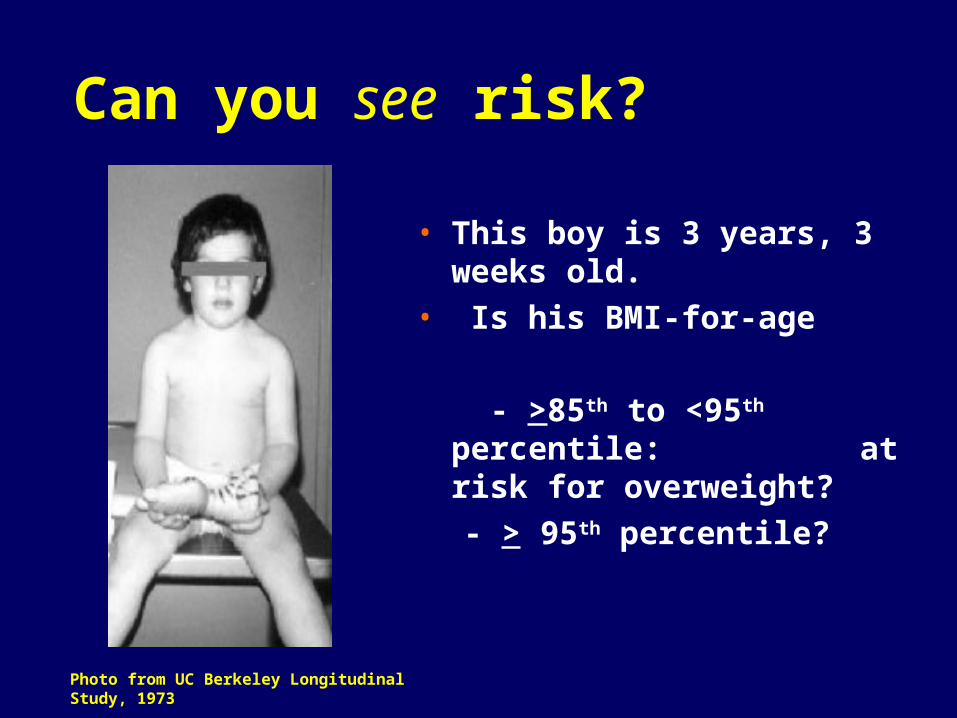
Can you see risk?
• This boy is 3 years, 3 weeks old.
• Is his BMI-for-age
- >85th to <95th percentile: at risk for overweight?
- > 95th percentile?
Photo from UC Berkeley Longitudinal Study, 1973
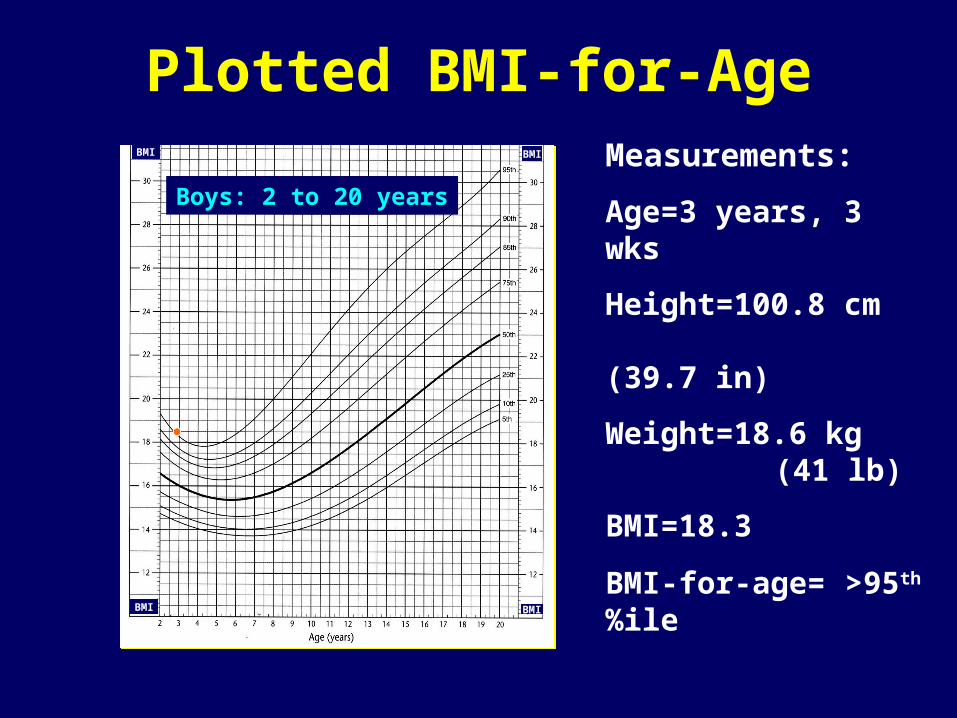
Measurements:
Age=3 years, 3 wks
Height=100.8 cm (39.7 in)
Weight=18.6 kg (41 lb)
BMI=18.3
BMI-for-age= >95th %ile %ilepercentile overweight
Plotted BMI-for-Age
Boys: 2 to 20 years
BMI BMI
BMI BMI
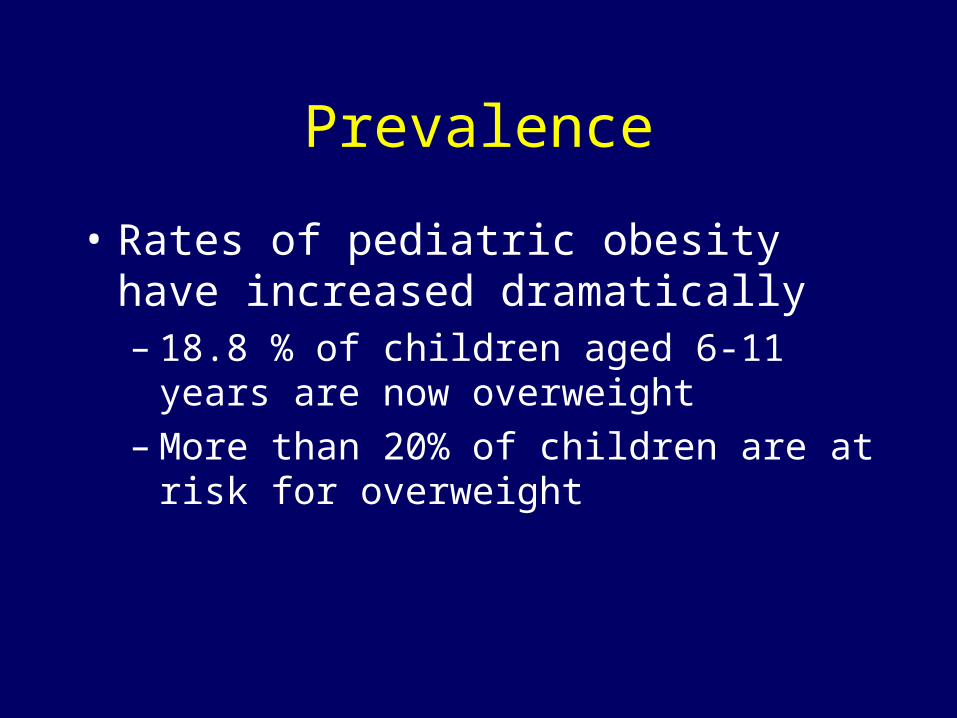
Prevalence
• Rates of pediatric obesity have increased dramatically– 18.8 % of children aged 6-11 years are
now overweight– More than 20% of children are at risk for
overweight
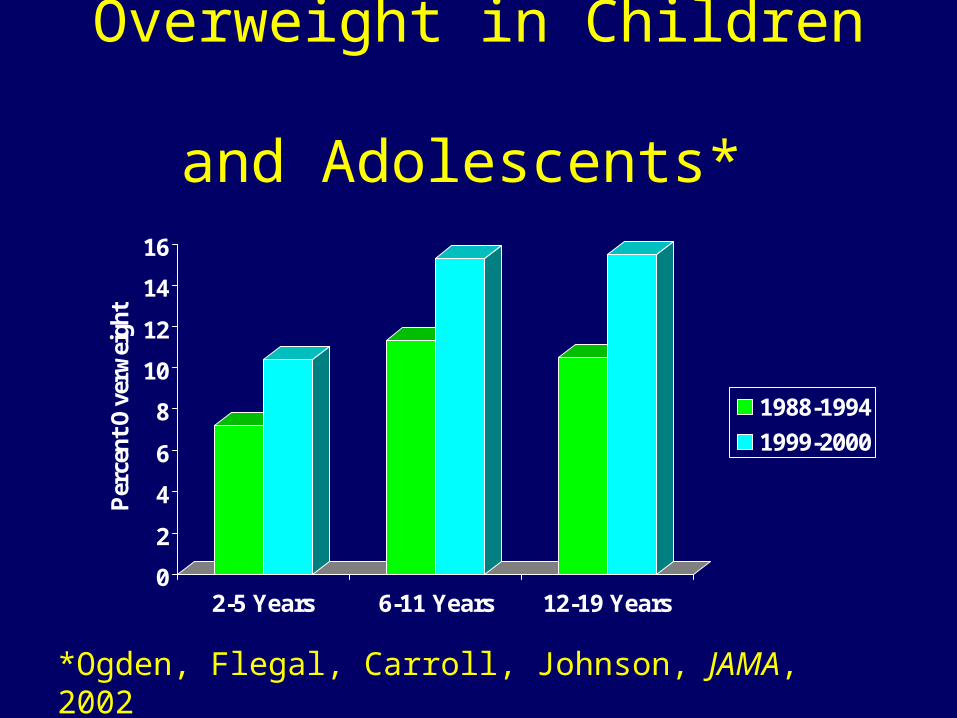
Overweight in Children and Adolescents*
0
2
4
6
8
10
12
14
16
Per
cent
Ove
rwei
ght
2-5 Years 6-11 Years 12-19 Years
1988-1994
1999-2000
*Ogden, Flegal, Carroll, Johnson, JAMA, 2002
Ethnic Differences in Prevalence
• Minority children (i.e., African American, Native American, and Hispanic children) are more likely than White children are to be overweight
• Minority children also are likelier than White children are to suffer from obesity-related medical morbidity
Differential Increase in Severe Obesity
• Of note, the greatest increase in obesity prevalence has been among the heaviest children, i.e., the heaviest children are getting heavier
• 4% of American children are now > 99th percentile for age and sex
Obesity-Related Morbidity
• Obese children suffer the same medical consequences that obese adults do:– Hypertension– Hyperlipidemia– Hyperinsulinemia– Type 2 diabetes
Psychosocial Consequences
• There is an association between higher BMI and psychological distress
• Severely obese children and children who seek obesity treatment are likelier to suffer psychological morbidity than are more mildly affected children
• Severely obese children and adolescents report significant impairment in health-related quality of life compared to healthy children and adolescents [Schwimmer et al., 2003]
– Impairments are similar to those reported by children with cancer


Body Weight is Heritable
• 40-70% of the variability in body weight is accounted for by genetic factors
• However, increases in severe obesity are suggestive of “profound environmental determinants in a population with a high degree of susceptibility”*
*Flegal & Troiano, 2000

What’s Going On?*• We’re producing more food• Food is cheaper
– In 1950 US families spent 21% of income on food; in 2000 we spent 11%
• Food is easy to buy and prepare• We eat out more often• We are less physically active
*Center for Science in the Public Interest, 2001

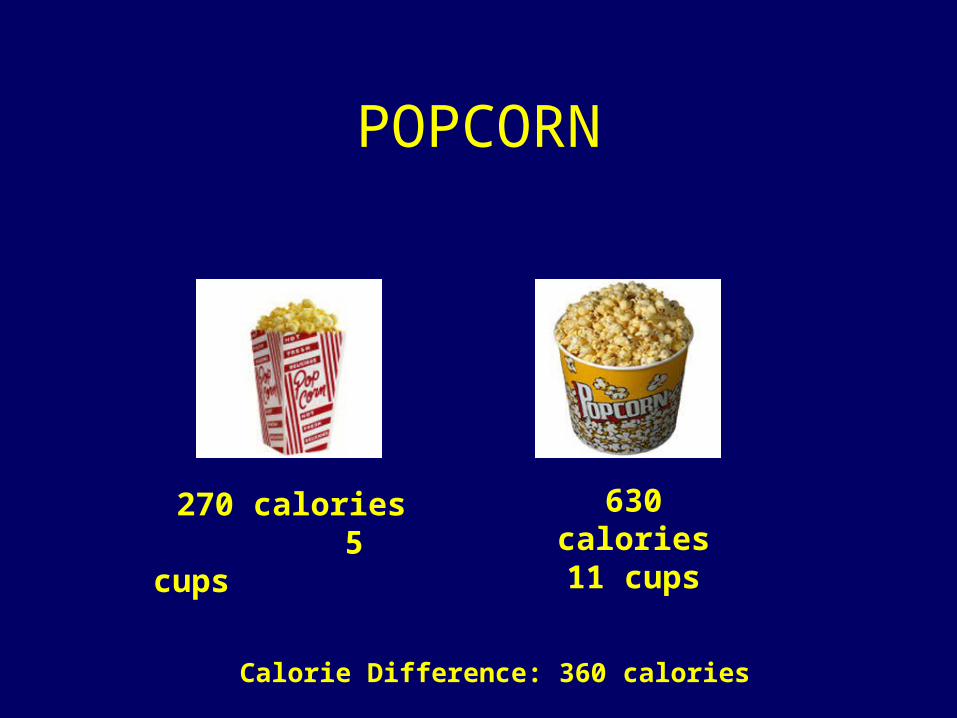
POPCORN20 Years Ago Today
270 calories 5 cups
630 calories11 cups
Calorie Difference: 360 calories
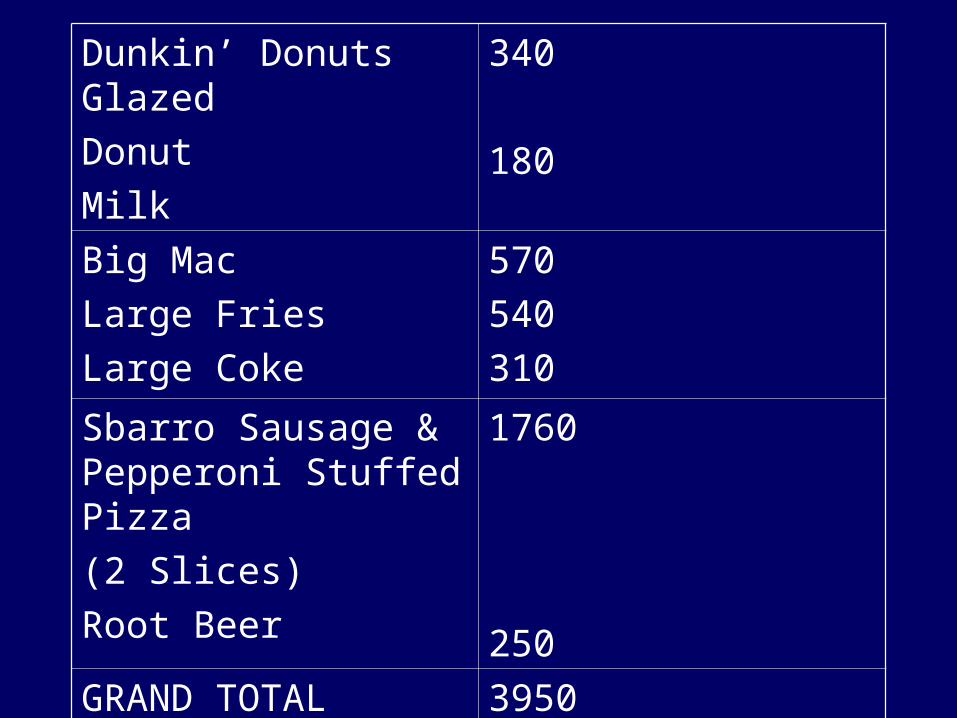
Dunkin’ Donuts Glazed
Donut
Milk
340
180
Big Mac
Large Fries
Large Coke
570
540
310
Sbarro Sausage & Pepperoni Stuffed Pizza
(2 Slices)
Root Beer
1760
250
GRAND TOTAL 3950
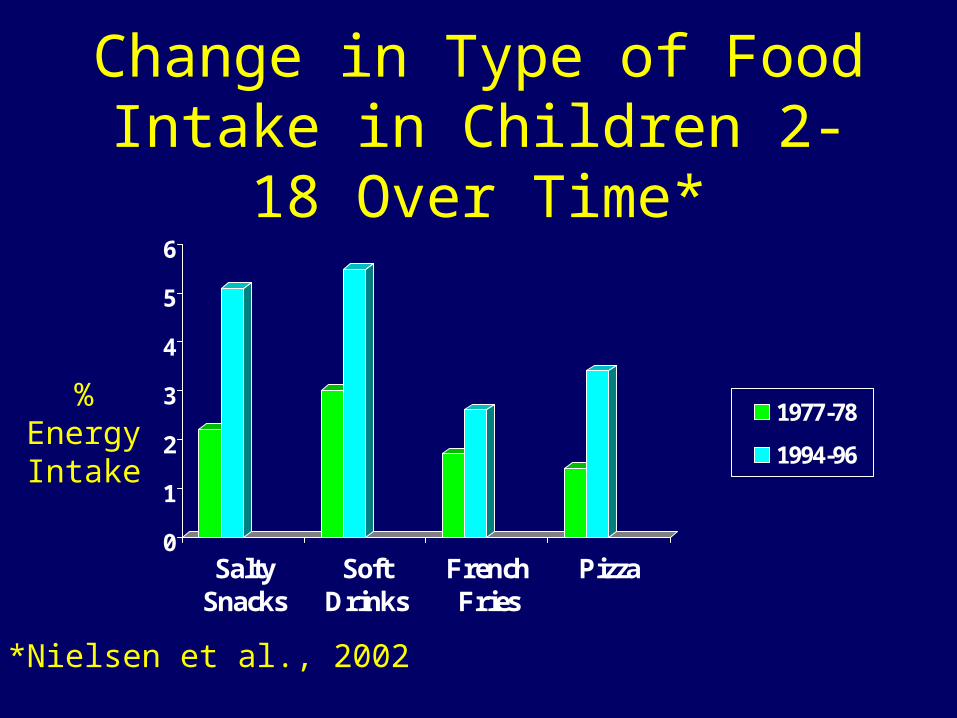
Change in Type of Food Intake in Children 2-18 Over
Time*
0
1
2
3
4
5
6
SaltySnacks
SoftDrinks
FrenchFries
Pizza
1977-78
1994-96
% Energy Intake
*Nielsen et al., 2002

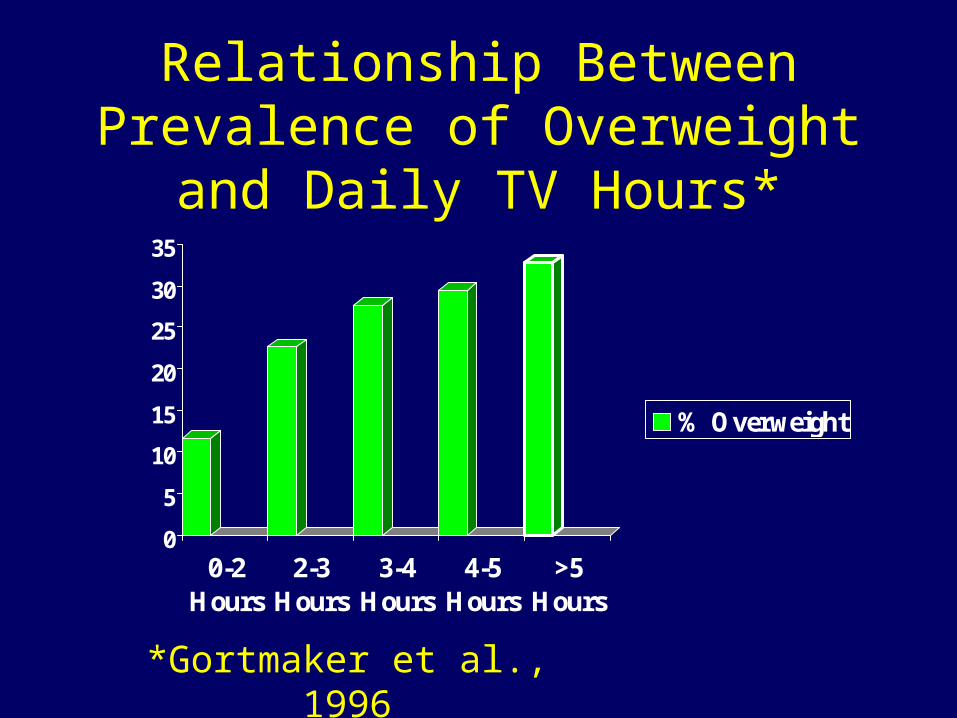
Relationship Between Prevalence of Overweight and Daily TV
Hours*
0
5
10
15
20
25
30
35
0-2Hours
2-3Hours
3-4Hours
4-5Hours
>5Hours
% Overweight
*Gortmaker et al., 1996
Benefits of Weight Loss
• Weight loss is associated with significant improvements
• Adiposity
• Blood pressure
• Lipid profiles
• Insulin resistance
• Psychosocial parameters
Can We Help Children Lose Weight and Change
Behavior?
• There is strong evidence for the efficacy of multi-component behavioral weight control programs in the treatment of pediatric obesity*
*Jelalian & Saelens, 1999
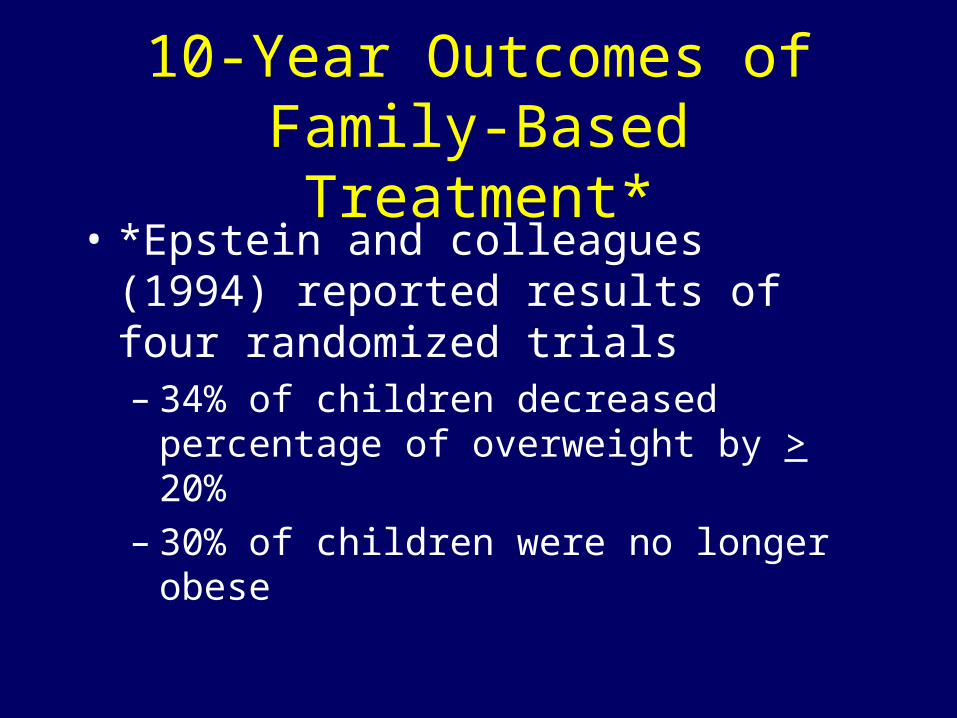
10-Year Outcomes of Family-Based Treatment*
• *Epstein and colleagues (1994) reported results of four randomized trials– 34% of children decreased percentage of
overweight by > 20%– 30% of children were no longer obese
Components of Behavioral Weight Control Programs
• Information
• Diet
• Exercise
• Behavior Modification Strategies
Behavioral Targets
• Decrease intake of high fat, high calorie, low nutrient foods
• Increase intake of lower fat, lower calorie, nutrient dense foods
• Decrease sedentary behaviors
• Increase activity and exercise
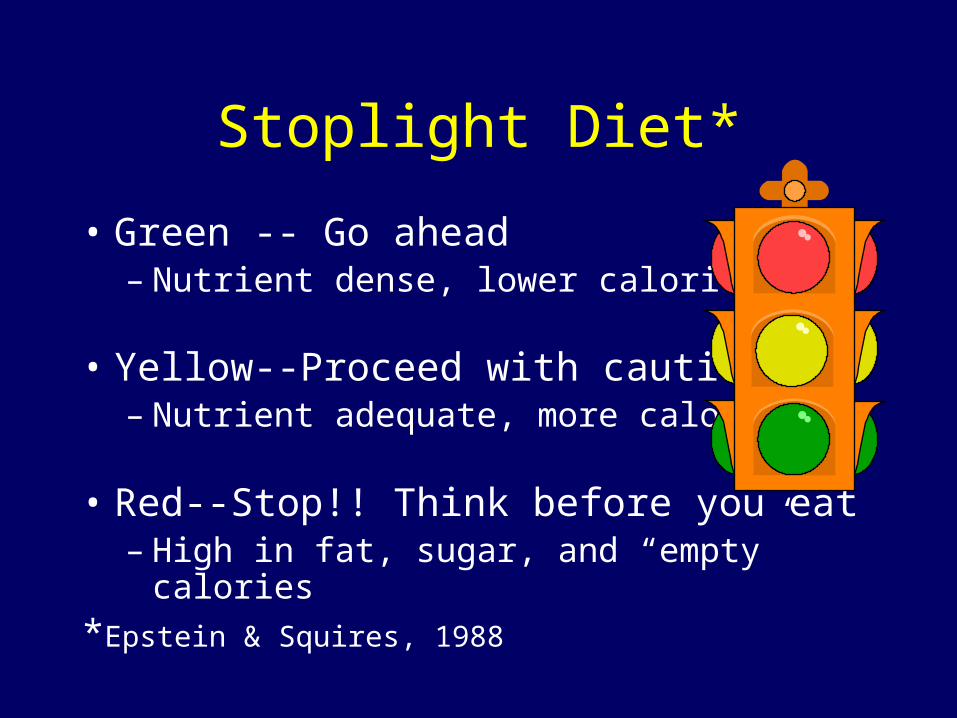
Stoplight Diet*
• Green -- Go ahead – Nutrient dense, lower calorie
• Yellow--Proceed with caution– Nutrient adequate, more calories
• Red--Stop!! Think before you eat– High in fat, sugar, and “empty” calories
*Epstein & Squires, 1988
Behavior Therapy
• Self-monitoring
• Reinforcement
• Contingency contracting
• Stimulus control
• Social assertion
• Relapse prevention
Summary• Dramatic increases in pediatric obesity are
associated with changes in eating behavior and increases in sedentary behavior
• Family-based behavioral weight control programs are associated with long-term reductions in overweight
• Comprehensive family-based behavioral lifestyle interventions should be the cornerstone of obesity treatment
• Successful Programs– Use balanced calorie-deficit diets– Incorporate state-of-the-art behavioral
strategies– Target parents as well as children – Include an emphasis on increasing
physical activity• Lifestyle interventions • Decreasing sedentary behavior,
particularly “recreational screen time”
Caveats
• Although the efficacy of behavioral programs is well-documented, there is less information about their effectiveness– There is little third party coverage for obesity
treatment– There are relatively few well trained behavioral
interventionists• Not all children have parents or guardians
willing to participate• Most research has been conducted with
moderately obese children
• There is less evidence of the utility of family-based behavioral treatment for– Adolescents– Ethnically diverse samples– Severely overweight children
• Given the scope of obesity-related health problems, further research in the development of effective lifestyle interventions is critically important
• Our research group has focused on family-based treatment of severely overweight children
Family-Based Treatment of Severe Pediatric Obesity
Principal Investigator : Marsha D. Marcus, Ph.D.
Support: NICHD [R01 HD 038425]Pittsburgh ONRC [DK046204]Children’s Hospital of Pittsburgh PCTRC

Melissa Kalarchian, Ph.D.
Michele Levine, Ph.D.
Silva Arslanian, MD
Linda Ewing, Ph.D., RN
Monique Higginbotham, MD*
Lisa Weissfeld, Ph.D.
*NICHD Research Supplement for Underrepresented Minorities
Specific Aims
• To evaluate the efficacy of a family-based behavioral weight control program for severe pediatric overweight
• To examine the relationships among gender, ethnicity, compliance and psychosocial factors and treatment outcome
Study Design
• Randomized controlled trial
• 192 children assigned to a six-month family based behavioral weight management program or usual care condition and followed for one year post-treatment
Study ParticipantsChildren were:
Between 8 and 12 years of age at enrollment
Have a parent or guardian who is willing to participate with the child
> 97th percentile of BMI for age and sex
Exclusion Criteria• Acute or severe medical conditions, including
diabetes• Inability to engage in moderate exercise• Previously diagnosed genetic obesity
syndrome (e.g., Prader Willi)• Current obesity treatment• Developmental disorder or psychosis• Psychiatric symptoms requiring immediate
treatment• Recent initiation of drugs that affect body
weight (< 4 months)
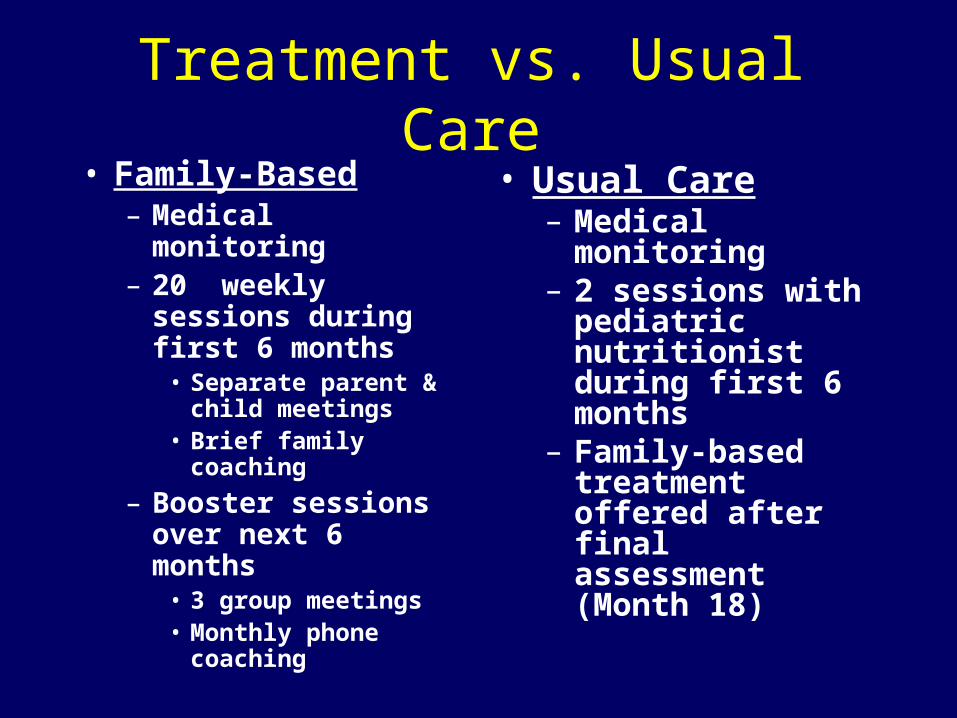
Treatment vs. Usual Care• Family-Based
– Medical monitoring– 20 weekly
sessions during first 6 months
• Separate parent & child meetings
• Brief family coaching
– Booster sessions over next 6 months
• 3 group meetings• Monthly phone
coaching
• Usual Care– Medical monitoring – 2 sessions with
pediatric nutritionist during first 6 months
– Family-based treatment offered after final assessment (Month 18)
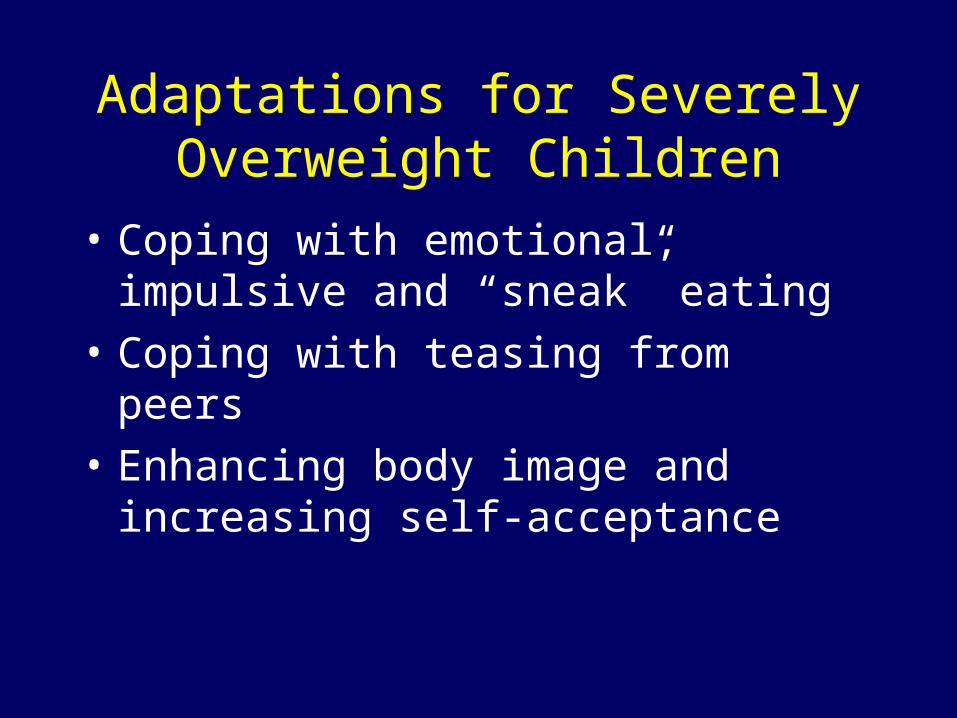
Adaptations for Severely Overweight Children
• Coping with emotional, impulsive and “sneak” eating
• Coping with teasing from peers
• Enhancing body image and increasing self-acceptance
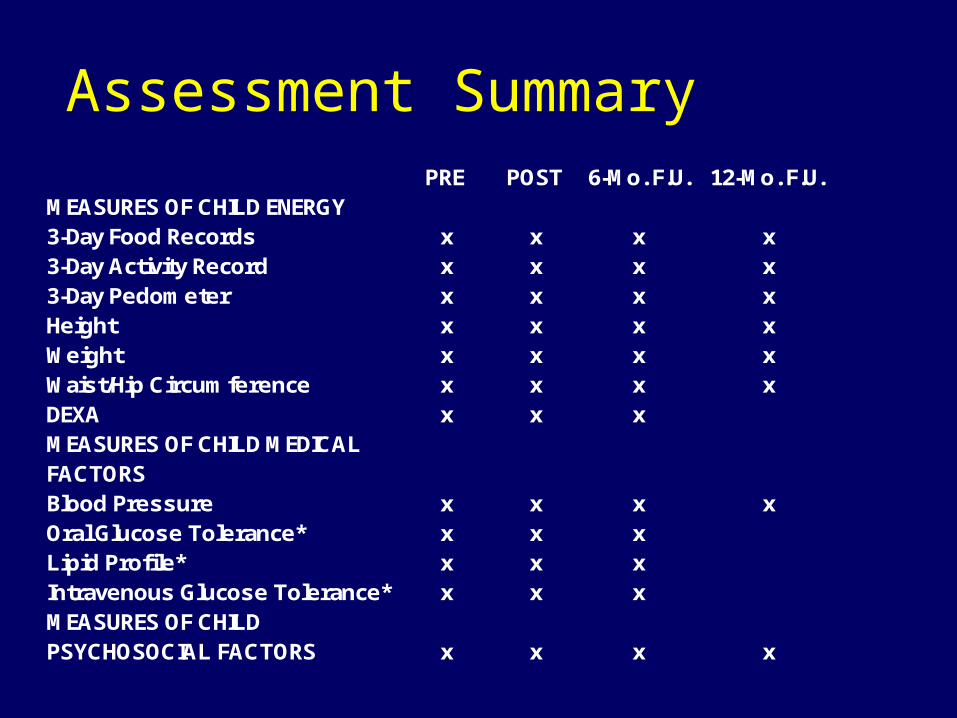
PRE POST 6-Mo. F.U. 12-Mo. F.U.MEASURES OF CHILD ENERGY 3-Day Food Records x x x x3-Day Activity Record x x x x3-Day Pedometer x x x xHeight x x x xWeight x x x xWaist/Hip Circumference x x x xDEXA x x xMEASURES OF CHILD MEDICAL FACTORSBlood Pressure x x x xOral Glucose Tolerance* x x xLipid Profile* x x xIntravenous Glucose Tolerance* x x xMEASURES OF CHILD PSYCHOSOCIAL FACTORS x x x x
Assessment Summary
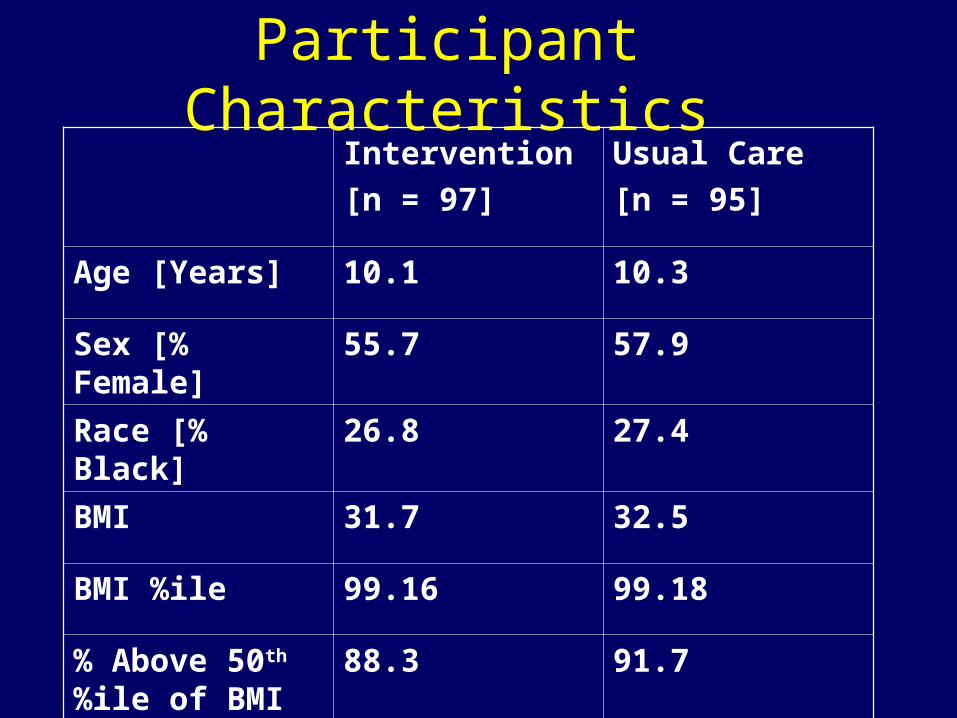
Participant CharacteristicsIntervention
[n = 97]
Usual Care
[n = 95]
Age [Years] 10.1 10.3
Sex [% Female] 55.7 57.9
Race [% Black] 26.8 27.4
BMI 31.7 32.5
BMI %ile 99.16 99.18
% Above 50th
%ile of BMI88.3 91.7
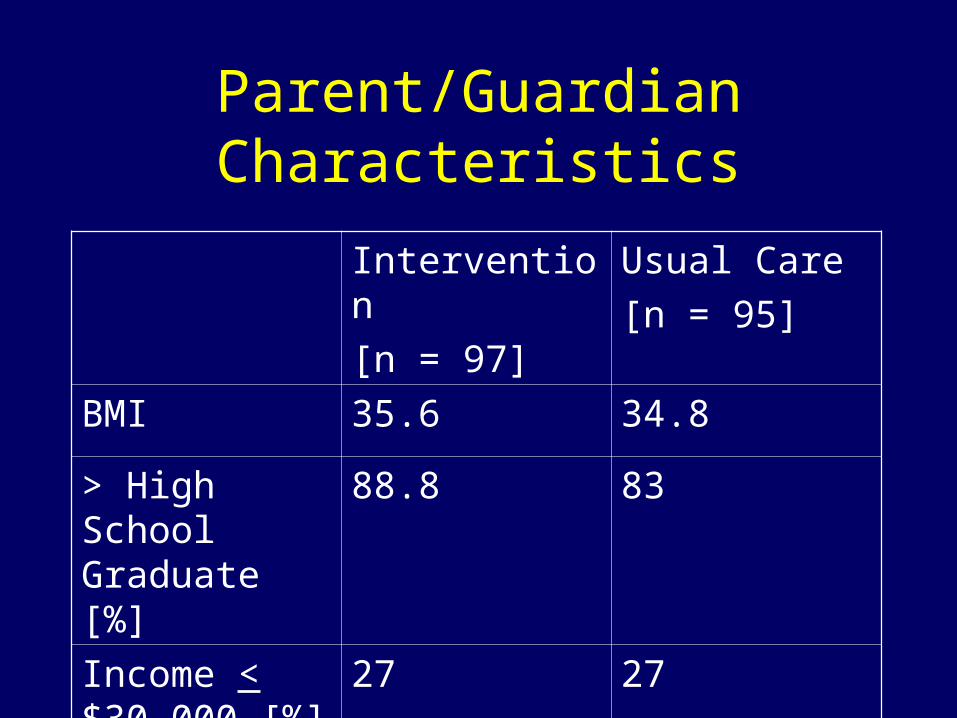
Parent/Guardian Characteristics
Intervention
[n = 97]
Usual Care
[n = 95]
BMI 35.6 34.8
> High School Graduate [%]
88.8 83
Income < $30,000 [%]
27 27
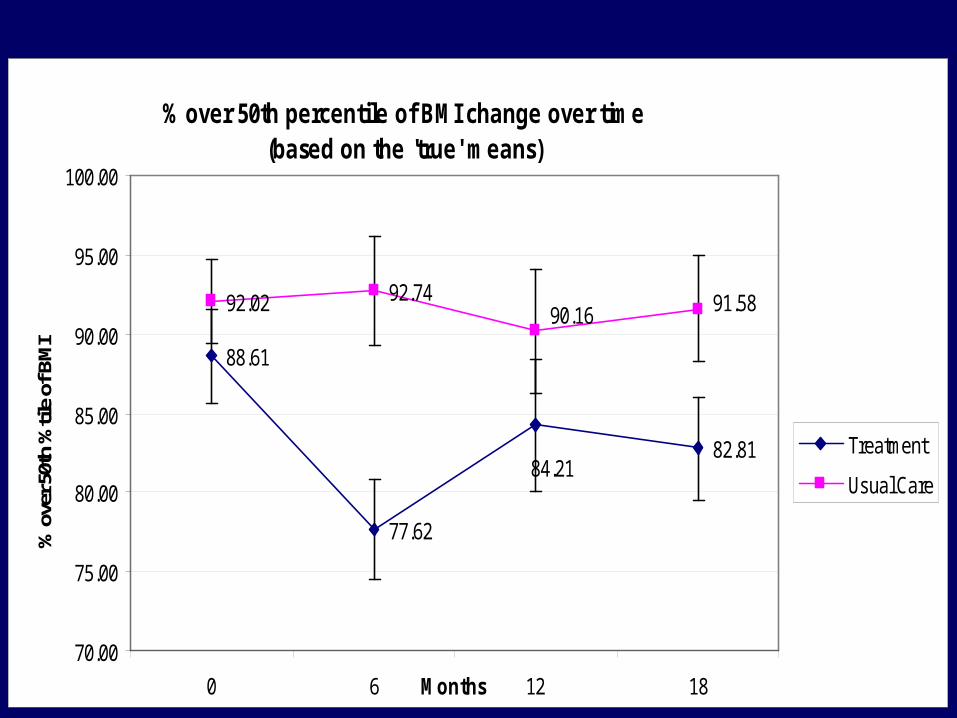
% over 50th percentile of BMI change over time(based on the 'true' means)
88.61
77.62
82.81
92.02 92.74
84.21
91.5890.16
70.00
75.00
80.00
85.00
90.00
95.00
100.00
0 6 12 18Months
% o
ver 5
0th
%til
e of
BM
I
Treatment
Usual Care
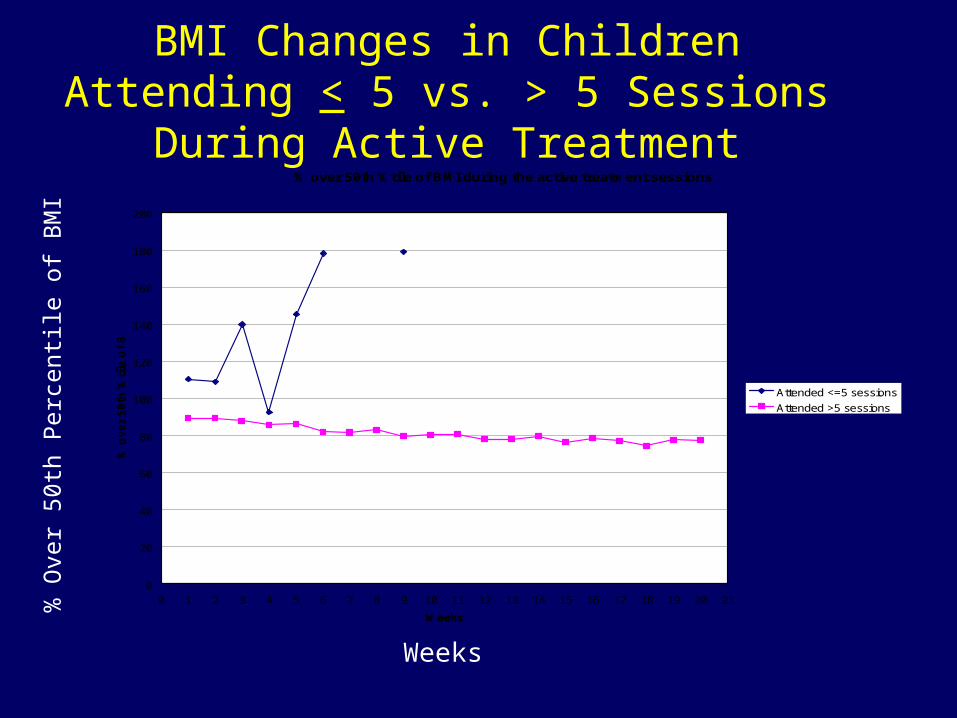
BMI Changes in Children Attending < 5 vs. > 5 Sessions During Active Treatment
Weeks
% O
ver
50th
Per
cent
ile o
f B
MI
% over 50th %tile of BMI during the active treatment sessions
0
20
40
60
80
100
120
140
160
180
200
0 1 2 3 4 5 6 7 8 9 10 11 12 13 14 15 16 17 18 19 20 21
Weeks
% o
ve
r 5
0th
%ti
le o
f B
MI
Attended <=5 sessions
Attended >5 sessions
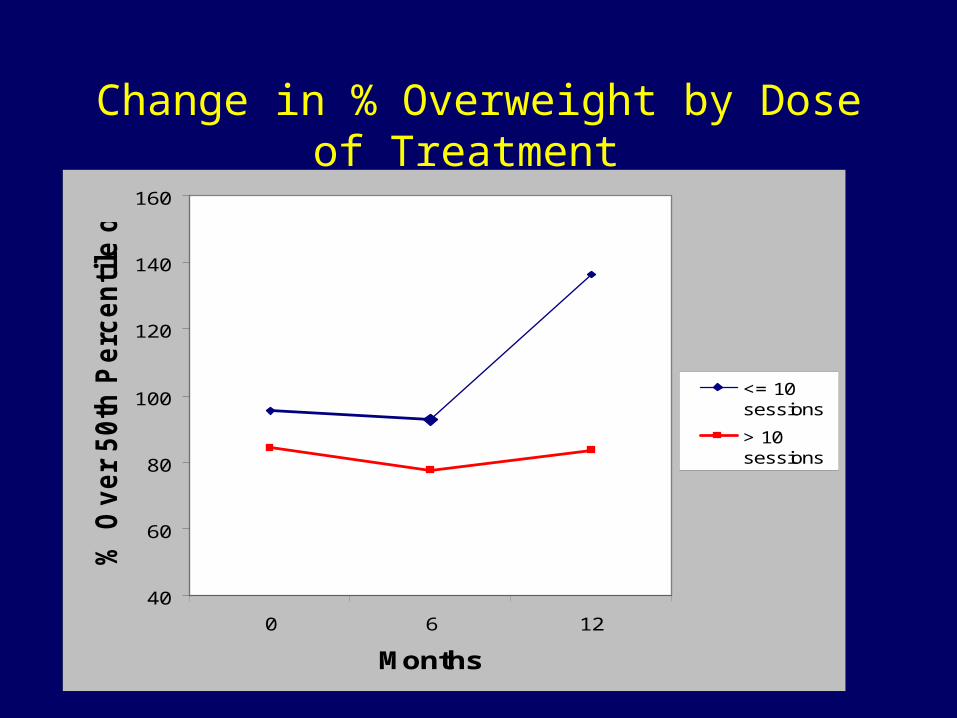
Change in % Overweight by Dose of Treatment
40
60
80
100
120
140
160
0 6 12
Months
% O
ver
50th
Perc
en
tile
of
BM
I
<= 10sessions
> 10sessions
Factors Associated with Attrition
• Children who dropped out of treatment were more likely to come from families with incomes < $30,000 (p’s = .02)
• Children who were heavier at baseline tended to drop out of treatment (p = .07) and to be lost to long-term follow-up (p = .003)
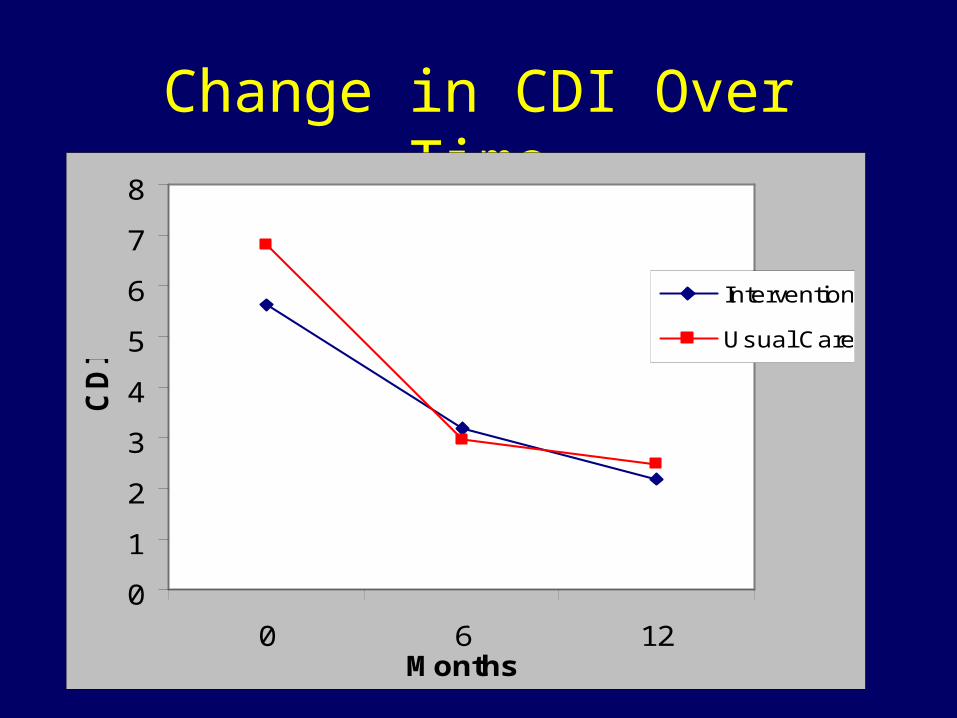
Change in CDI Over Time
0
1
2
3
4
5
6
7
8
0 6 12Months
CD
I
Intervention
Usual Care
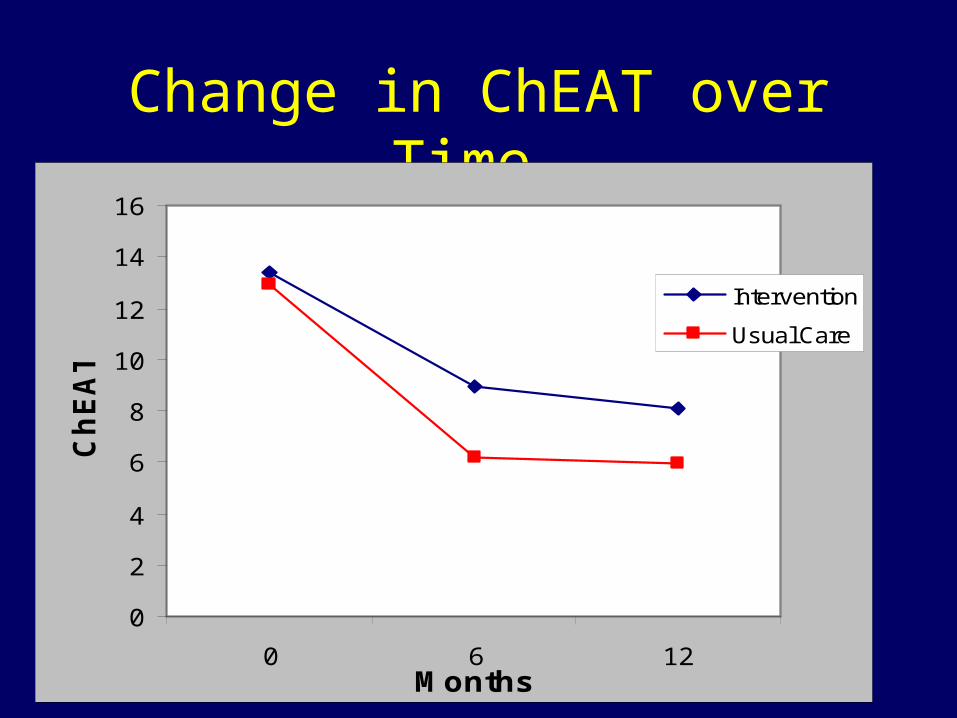
Change in ChEAT over Time
0
2
4
6
8
10
12
14
16
0 6 12Months
Ch
EA
T
Intervention
Usual Care
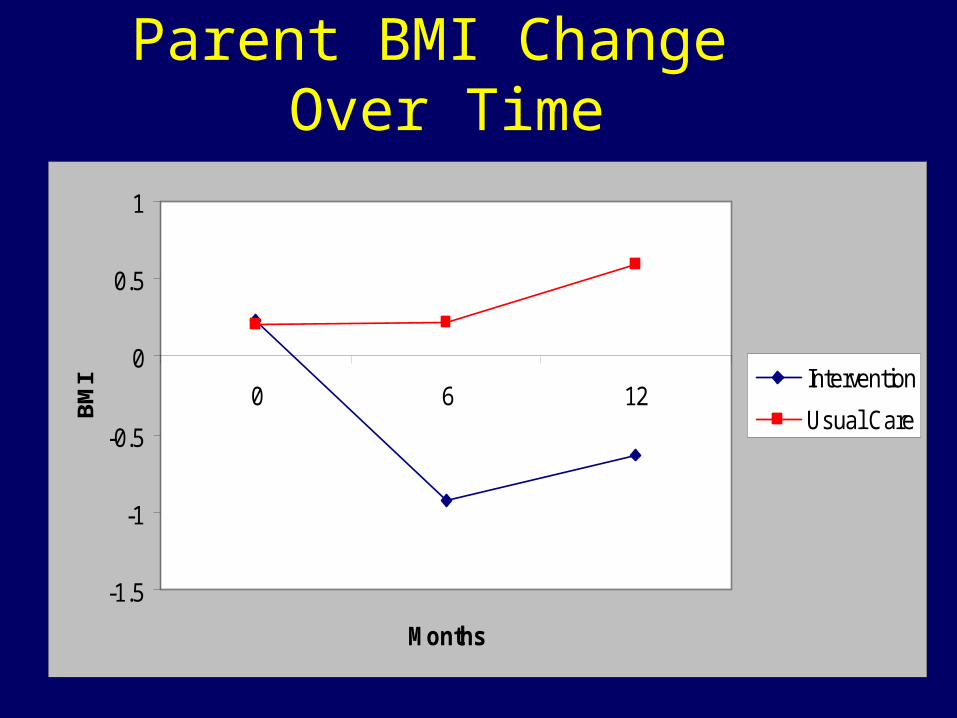
Parent BMI Change Over Time
-1.5
-1
-0.5
0
0.5
1
0 6 12
Months
BM
I Intervention
Usual Care
Comment
• Intensive family-based intervention is associated with modest decreases in overweight relative to usual care and improvements in health-related parameters
• There are no untoward effects of intervention on mood or eating behavior
• However, longer-term benefits are minimal
Comment
• Families with lower SES and heavier children may be at increased risk for poor attendance and attrition
• Children with better attendance appear to have better BMI trajectory
Comment
• A family-based behavioral approach shows promise, but it is critical to enhance initial changes in BMI and sustain these improvements over time
• Our pilot work suggests that a more structured approach to dietary changes is feasible, acceptable to families, and associated with improved short-term weight losses
A Look to the Future
• Intensive, structured dietary and activity interventions
• School-, community-, state-, and federally-based initiatives to promote activity and minimize exposure to unhealthy foods
• Numerous drugs in varying stages of development
• Research integrating lifestyle programs with medication
• Bariatric surgery for children and adolescents
Menu Provision
• We conducted a pilot study with families who were provided the standard KidQuest program along with tailored menus and meal plans
• All families received partial reimbursement for food, and some received prepared foods
• Three groups have been run, involving 19 families
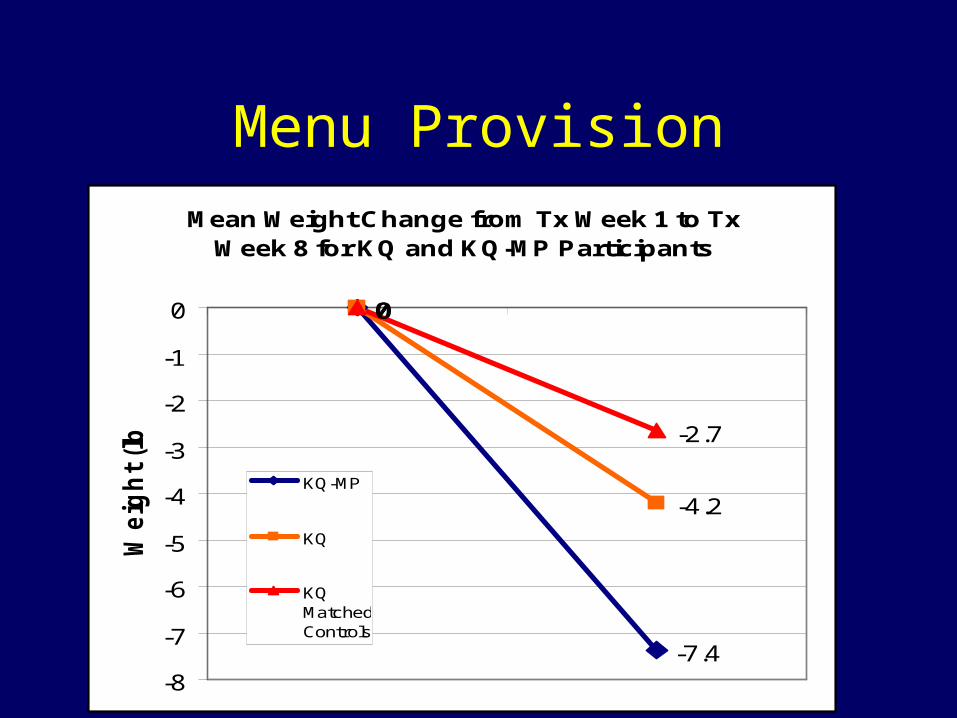
Menu ProvisionMean Weight Change from Tx Week 1 to Tx
Week 8 for KQ and KQ-MP Participants
0
-7.4
0
-4.2
0
-2.7
-8
-7
-6
-5
-4
-3
-2
-1
0
We
igh
t (l
bs
)
KQ-MP
KQ
KQMatchedControls
Obesity Prevention
• There is consensus that there is a compelling need to prevent the development of obesity in pediatric populations
STOPP-T2DStudies to Treat Or Prevent Pediatric Type 2 Diabetes
National Institute of Diabetes and Digestive and Kidney Diseases
National Institutes of Health
Rationale
• ‘Epidemic’ increase in rates of obesity and type 2 diabetes in children and youth
• Increase in environmental risk factors• Lack of large-scale, population-based
prevention studies investigating multiple integrated components

Map of the 7 Prevention Study Group Field Centers

Why Schools?• Reach 95% of children• Practice healthy mind, healthy body• Where children eat 1-2 meals per day• Offer physical education and sports• Presence of natural interventionists, role
models, and peers
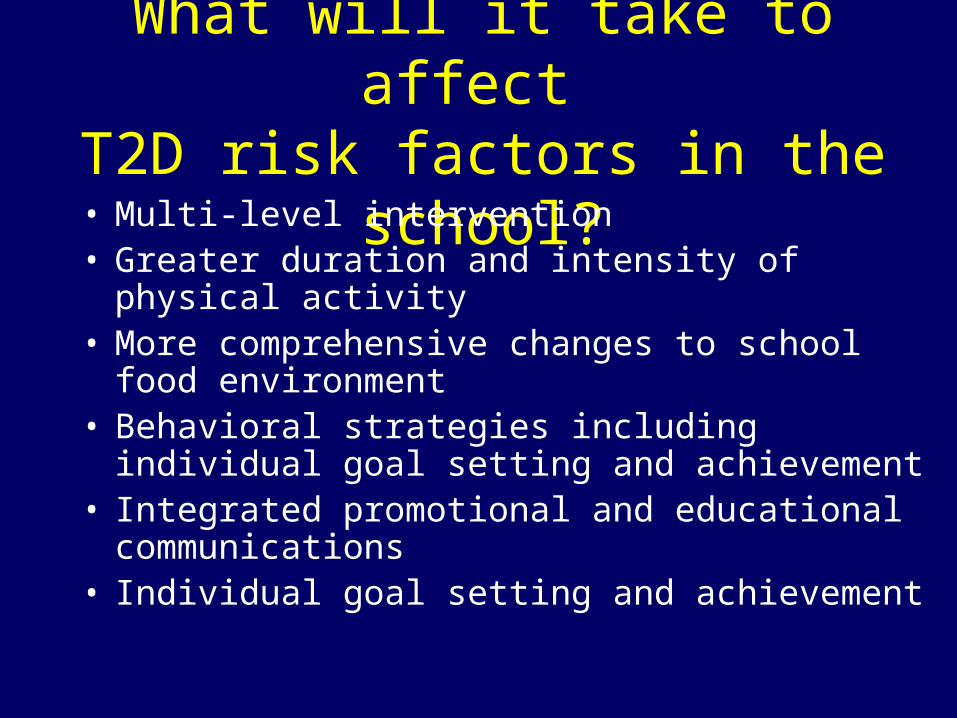
What will it take to affect T2D risk factors in the school?• Multi-level intervention• Greater duration and intensity of physical activity • More comprehensive changes to school food
environment• Behavioral strategies including individual goal
setting and achievement• Integrated promotional and educational
communications • Individual goal setting and achievement
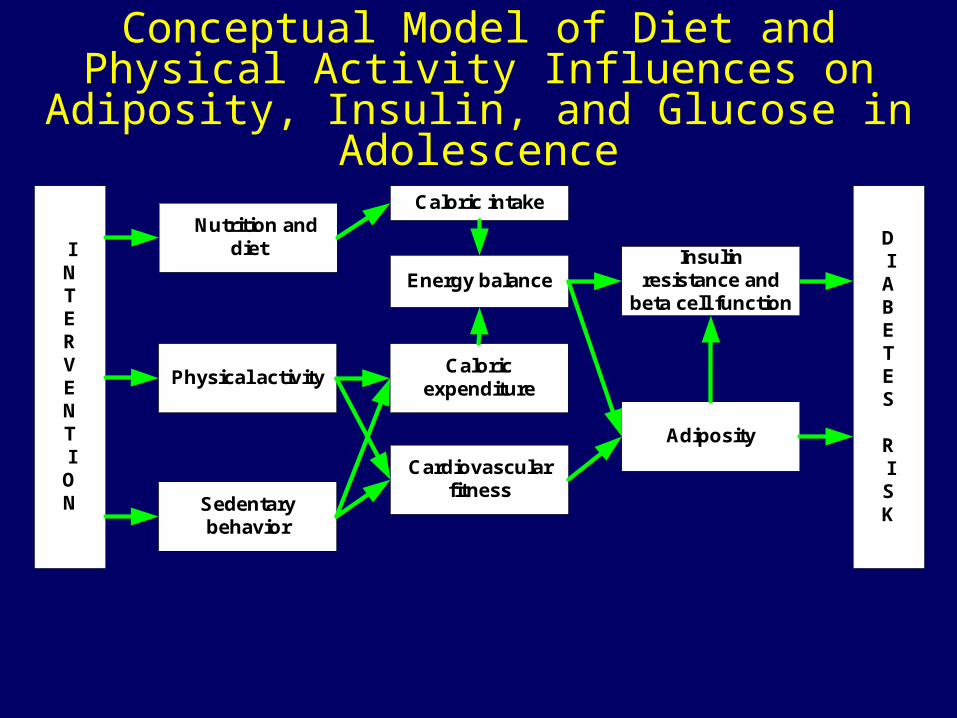
Conceptual Model of Diet and Physical Activity Influences on Adiposity, Insulin, and Glucose
in Adolescence
INTERVENTION
Nutrition anddiet D
IABETES
RISK
Caloric intake
Sedentarybehavior
Physical activity
Energy balance
Caloricexpenditure
Cardiovascularfitness
Adiposity
Insulinresistance and
beta cell function
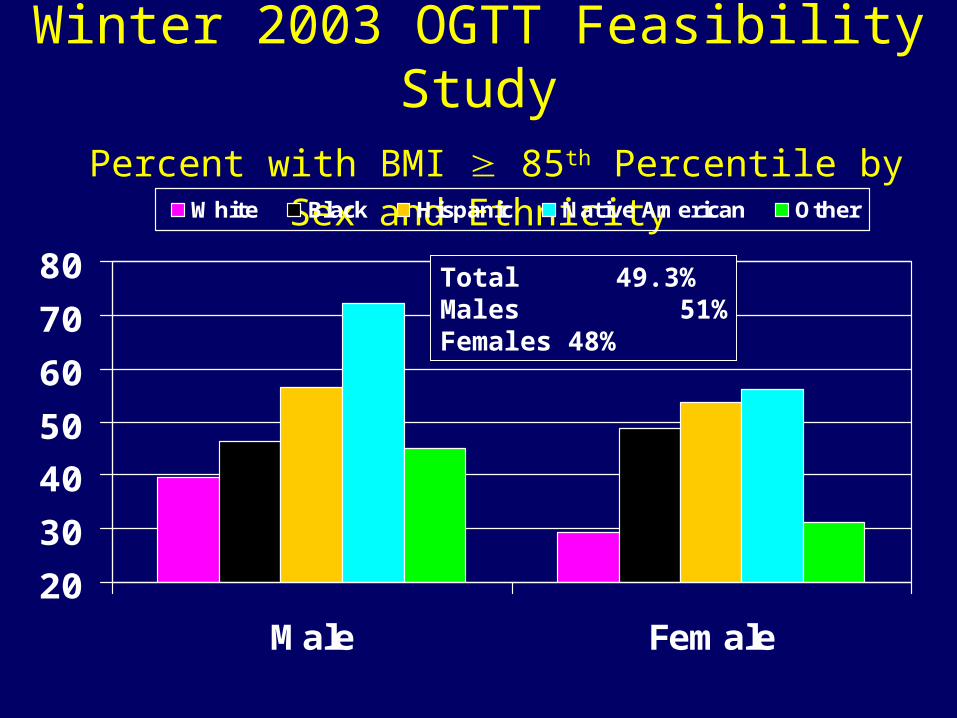
Winter 2003 OGTT Feasibility Study Percent with BMI 85th Percentile by Sex and Ethnicity
20
30
40
50
60
70
80
Male Female
White Black Hispanic Native American Other
Total 49.3%Males 51%Females 48%
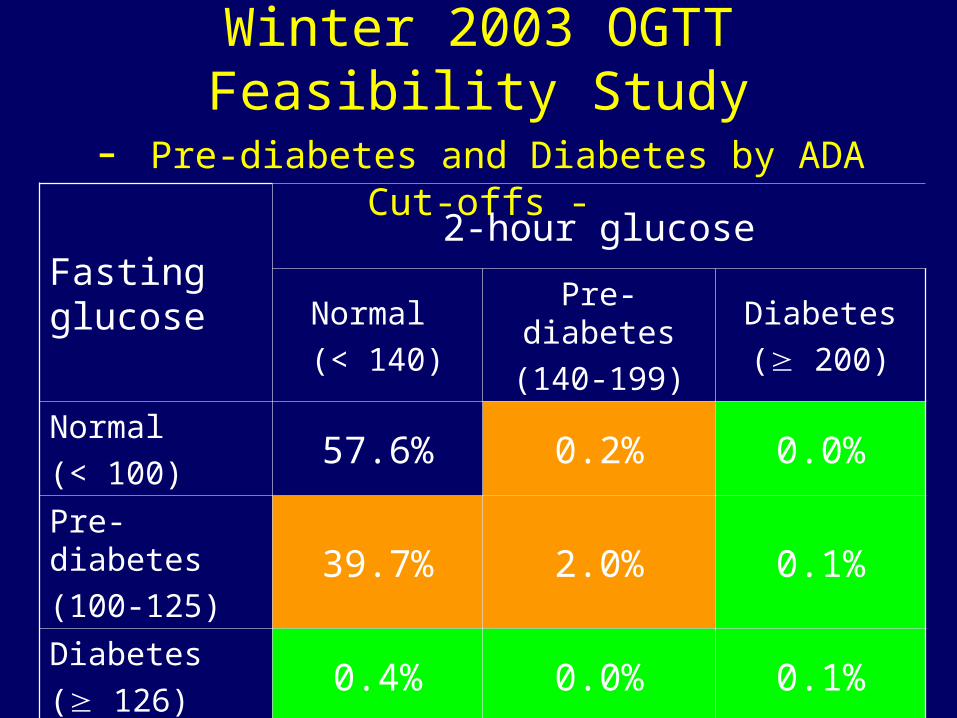
Winter 2003 OGTT Feasibility Study- Pre-diabetes and Diabetes by ADA Cut-offs -
Fasting glucose
2-hour glucose
Normal
(< 140)
Pre-diabetes
(140-199)
Diabetes
( 200)
Normal
(< 100)57.6% 0.2% 0.0%
Pre-diabetes
(100-125)39.7% 2.0% 0.1%
Diabetes
( 126)0.4% 0.0% 0.1%
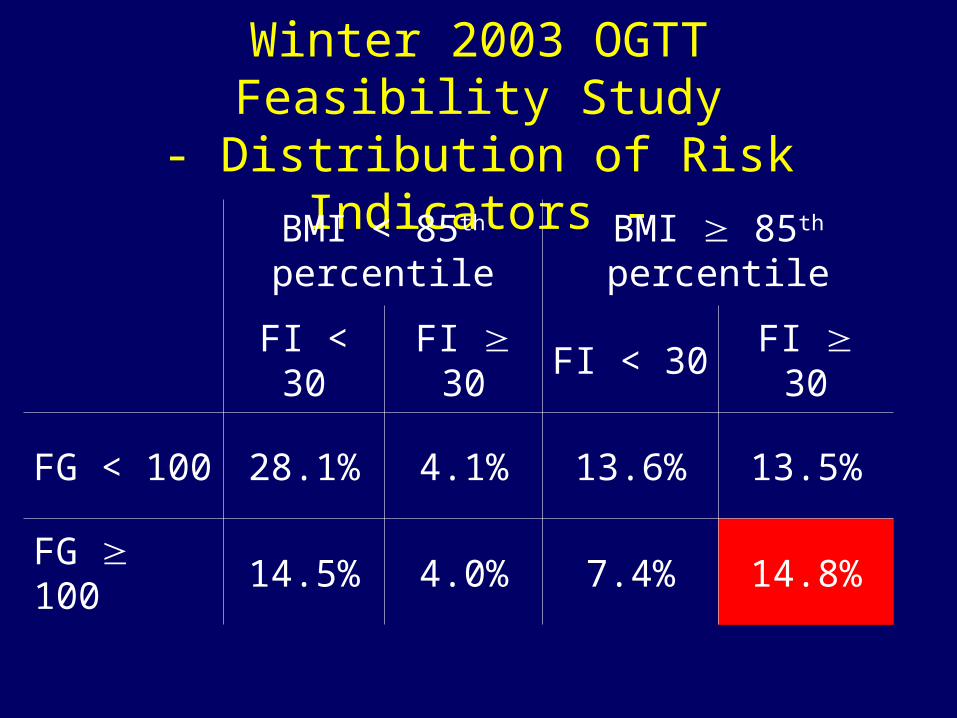
Winter 2003 OGTT Feasibility Study- Distribution of Risk Indicators -
BMI < 85th percentile
BMI 85th percentile
FI < 30 FI 30 FI < 30 FI 30
FG < 100 28.1% 4.1% 13.6% 13.5%
FG 100 14.5% 4.0% 7.4% 14.8%
Winter 2003 OGTT Feasibility Study- Conclusions -
• A significant number of 8th grade students representing ethnic minorities are at risk for diabetes as assessed by risk factors of elevated fasting glucose and insulin levels and high BMI.
• School-based prevention strategies should be undertaken to improve diabetes risk factors.
HEALTHY Study Design• 42 middle schools randomized to intervention or
control• Intervention
– Changes to school food environment and physical education class activities
– Educational and promotional communications campaigns
– Behavior change activities, messages, and goal setting
• Intervention goal: reduce risk factors for type 2 diabetes
HEALTHY - Elements of Cluster Design -
• Focus is on public health impact.• The public is grouped in various collectives
called clusters, e.g., community, workplace, school.
• The cluster is the unit of sample size, randomization, intervention, and analysis—in our study, middle school.
• Observations are made at school, grade, class, and student levels.
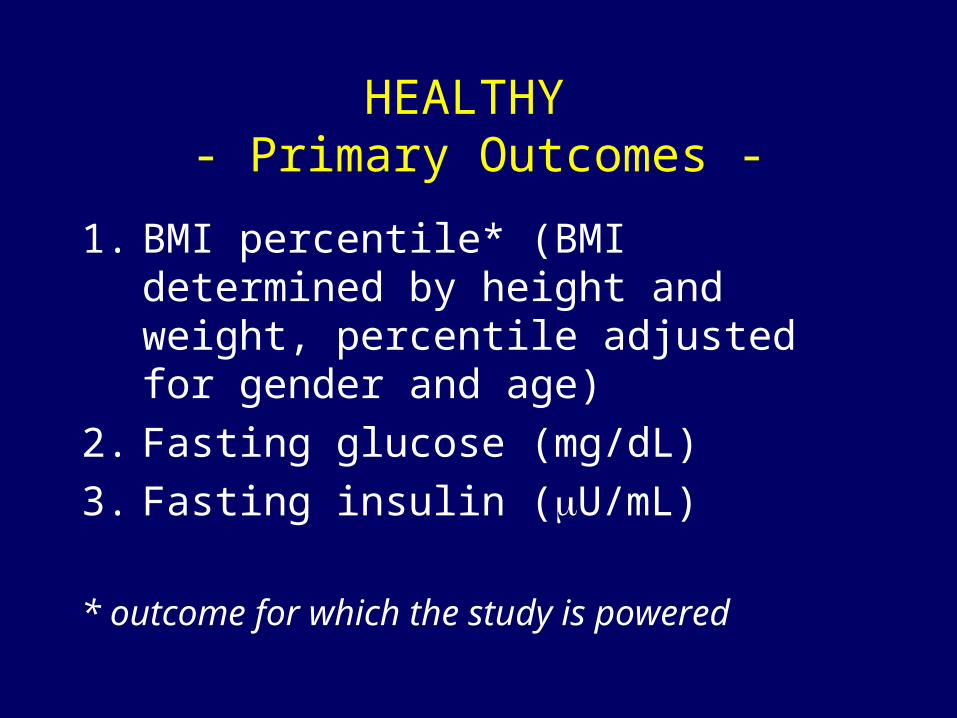
HEALTHY - Primary Outcomes -
1. BMI percentile* (BMI determined by height and weight, percentile adjusted for gender and age)
2. Fasting glucose (mg/dL)
3. Fasting insulin (U/mL)
* outcome for which the study is powered
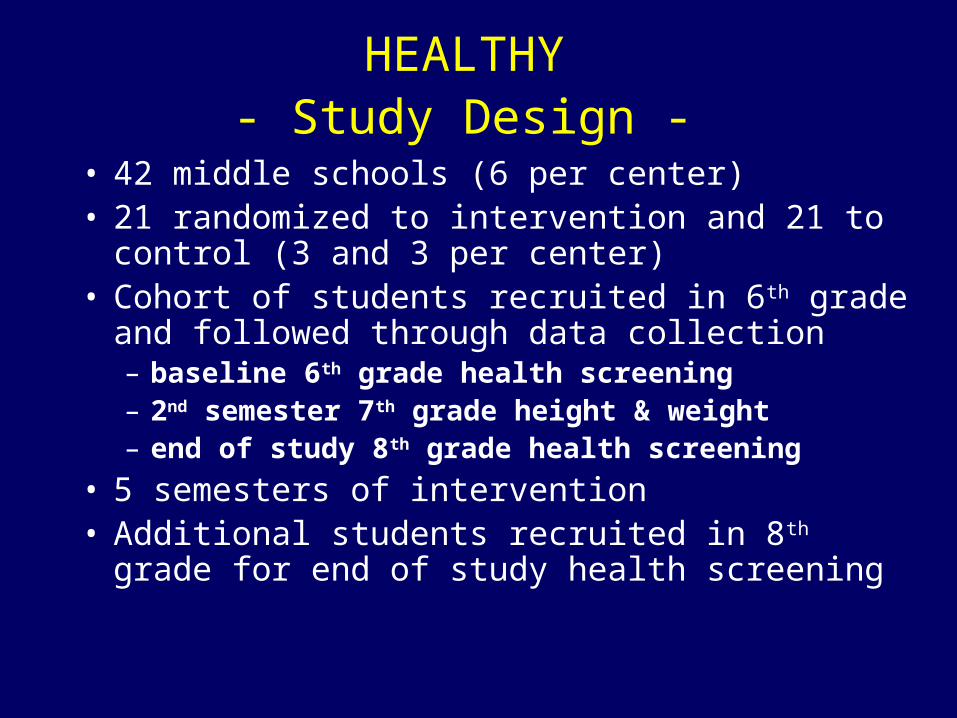
HEALTHY - Study Design -
• 42 middle schools (6 per center)• 21 randomized to intervention and 21 to control
(3 and 3 per center)• Cohort of students recruited in 6th grade and
followed through data collection– baseline 6th grade health screening– 2nd semester 7th grade height & weight– end of study 8th grade health screening
• 5 semesters of intervention• Additional students recruited in 8th grade for end
of study health screening
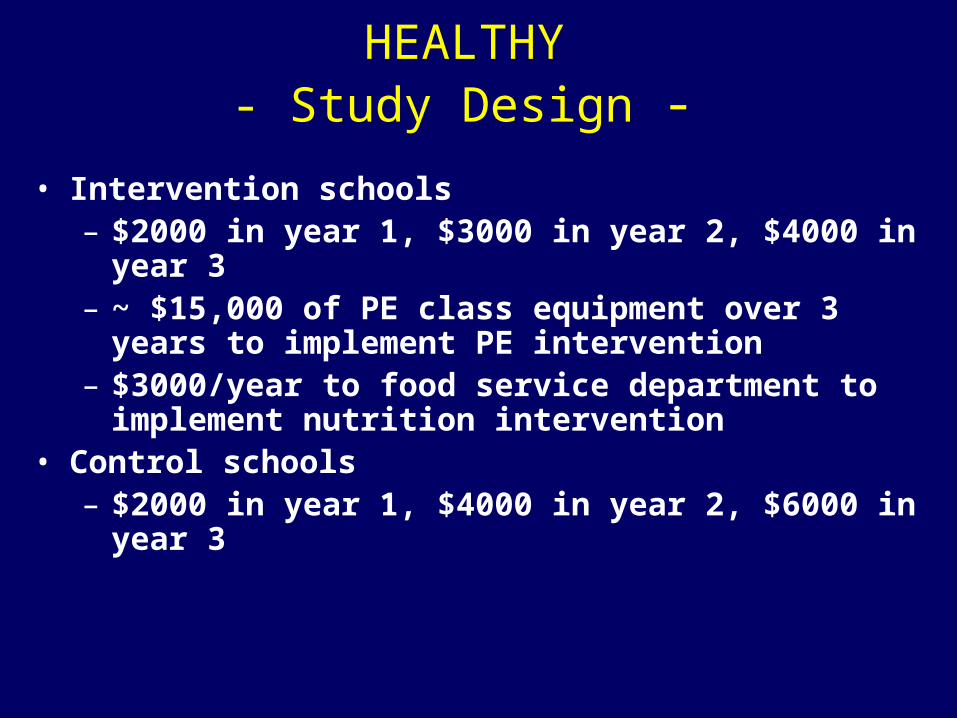
HEALTHY - Study Design -
• Intervention schools– $2000 in year 1, $3000 in year 2, $4000 in year 3– ~ $15,000 of PE class equipment over 3 years to
implement PE intervention– $3000/year to food service department to implement
nutrition intervention• Control schools
– $2000 in year 1, $4000 in year 2, $6000 in year 3

HEALTHY - Study Design: School Eligibility -
50% minority (African American, Hispanic/Latino, Native American) and/or > 50% eligible for free or reduced lunch
• Annual student attrition from all causes 25%
• Students attend PE class for a minimum of 225 minutes every 10 days
• School district operates under Federal Wide Assurance (FWA) to conduct research

HEALTHY - Study Design: Student Eligibility -
• Student is able to participate in the school’s standard PE program
• Parent/guardian signs informed consent indicating understanding of the study and willingness for the child to participate in data collection and evaluation procedures
• Student (minor child) signs informed assent

HEALTHY - Study Design: Data Collection -
• Baseline 1st semester of 6th grade– Health screening– Self-report questionnaires
• 2nd semester of 7th grade– Height and weight– Health related quality of life
• End of study 2nd semester of 8th grade– Health screening– Self-report questionnaires
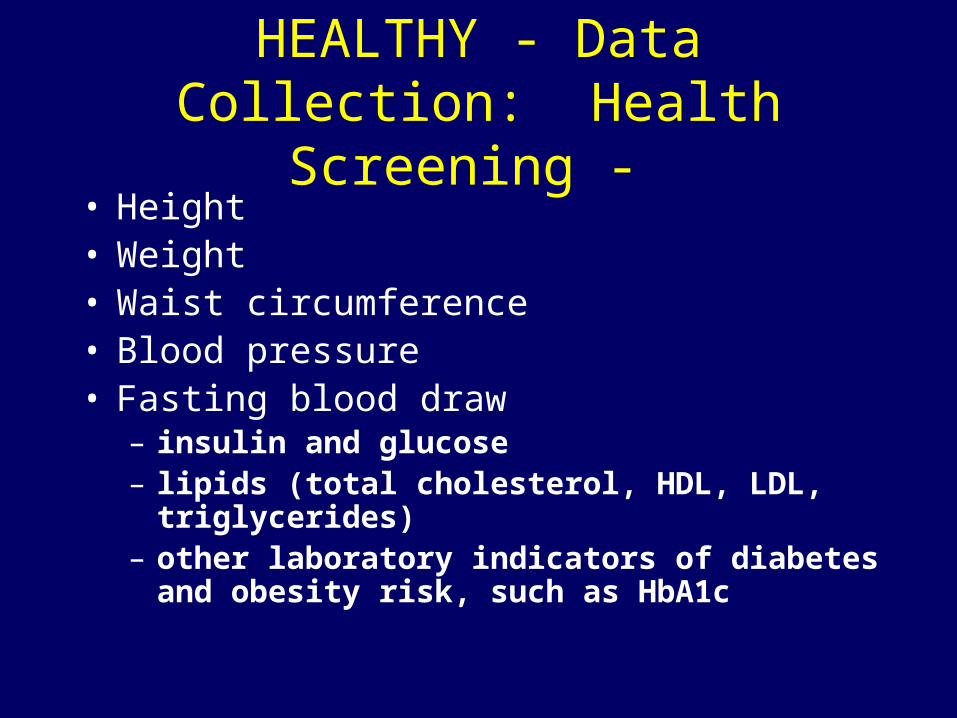
HEALTHY - Data Collection: Health Screening -
• Height• Weight• Waist circumference• Blood pressure• Fasting blood draw
– insulin and glucose– lipids (total cholesterol, HDL, LDL, triglycerides) – other laboratory indicators of diabetes and obesity
risk, such as HbA1c
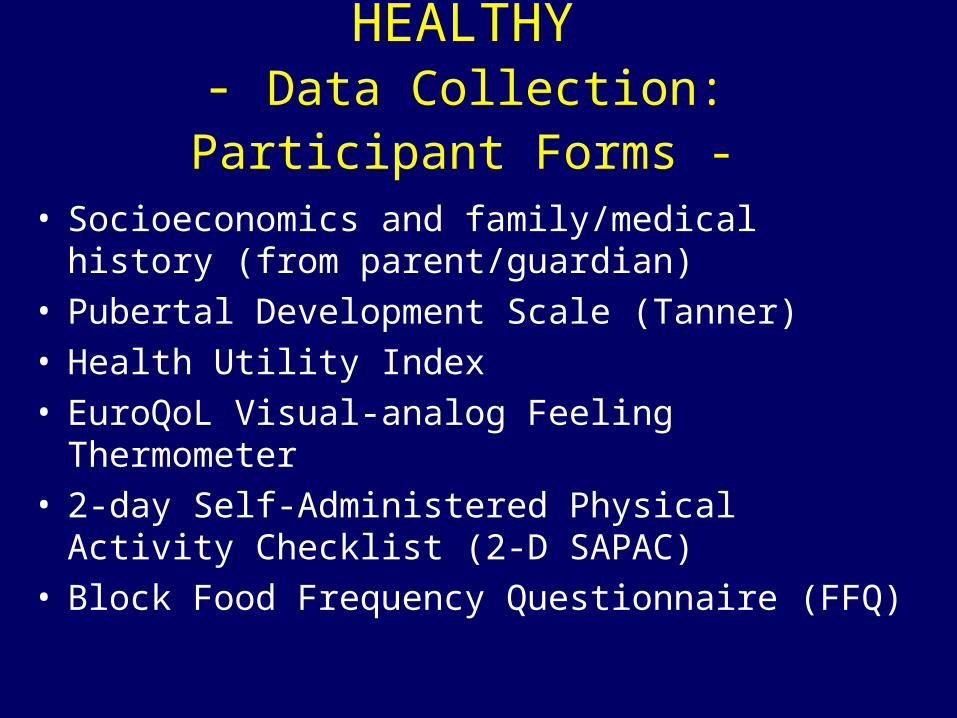
HEALTHY - Data Collection: Participant Forms -
• Socioeconomics and family/medical history (from parent/guardian)
• Pubertal Development Scale (Tanner)• Health Utility Index• EuroQoL Visual-analog Feeling Thermometer• 2-day Self-Administered Physical Activity Checklist
(2-D SAPAC)• Block Food Frequency Questionnaire (FFQ)

HEALTHY - Data Collection: Other -
• Student Fitness (20-Meter Shuttle Test)• Student Behavior Self-Assessment• Economic Cost-Effectiveness• School Food Environment
– production, sales, servings– item-based nutrient analysis
• School Academic Performance– standard test scores, attendance, comportment
• Environmental Influences
HEALTHY - Intervention Components -
• Nutrition
• Physical Education
• Behavior
• Communications
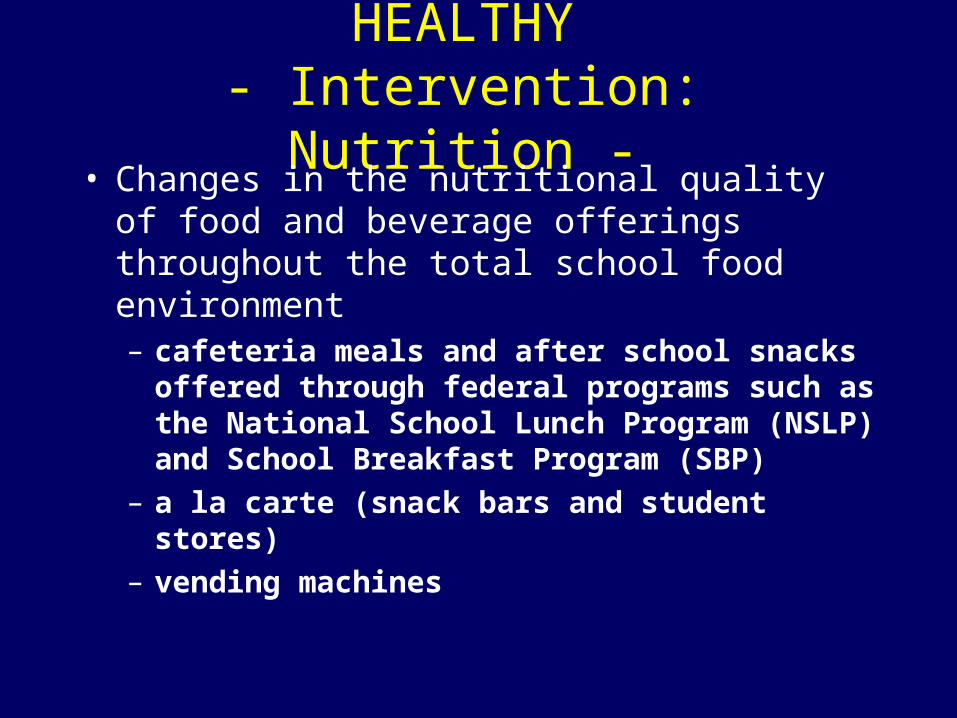
HEALTHY - Intervention: Nutrition -
• Changes in the nutritional quality of food and beverage offerings throughout the total school food environment – cafeteria meals and after school snacks
offered through federal programs such as the National School Lunch Program (NSLP) and School Breakfast Program (SBP)
– a la carte (snack bars and student stores)– vending machines
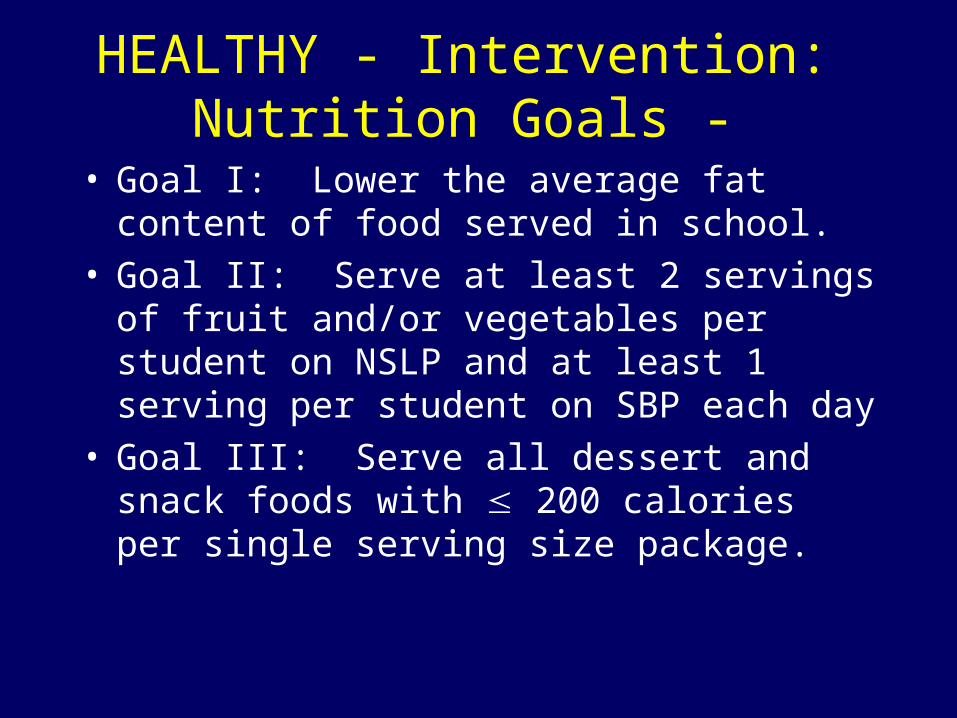
HEALTHY - Intervention: Nutrition Goals -
• Goal I: Lower the average fat content of food served in school.
• Goal II: Serve at least 2 servings of fruit and/or vegetables per student on NSLP and at least 1 serving per student on SBP each day
• Goal III: Serve all dessert and snack foods with 200 calories per single serving size package.
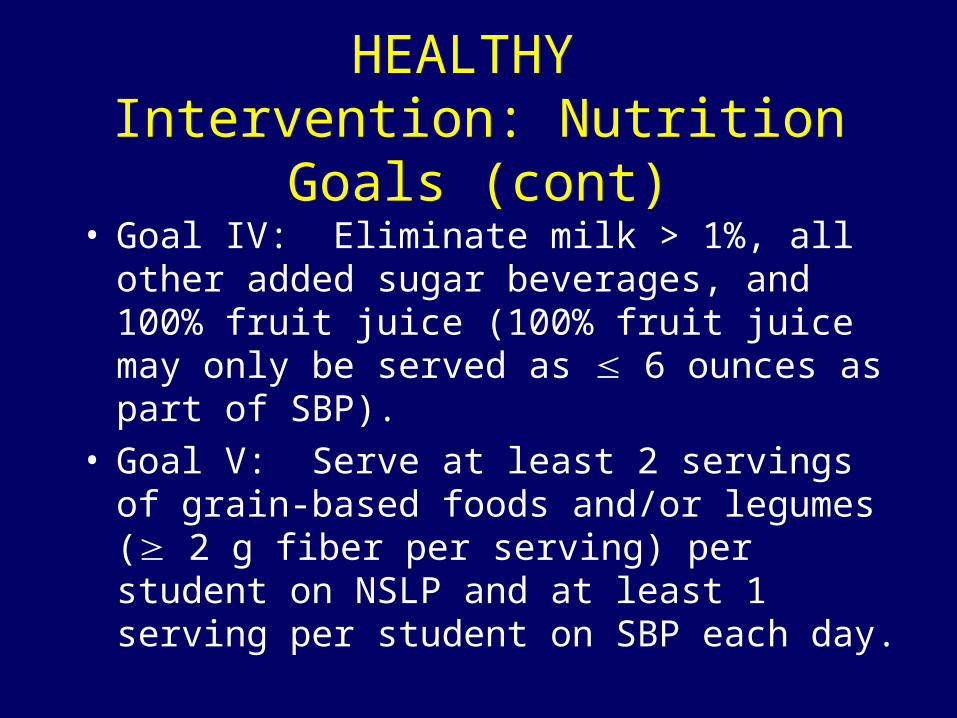
HEALTHY Intervention: Nutrition Goals (cont)
• Goal IV: Eliminate milk > 1%, all other added sugar beverages, and 100% fruit juice (100% fruit juice may only be served as 6 ounces as part of SBP).
• Goal V: Serve at least 2 servings of grain-based foods and/or legumes ( 2 g fiber per serving) per student on NSLP and at least 1 serving per student on SBP each day.
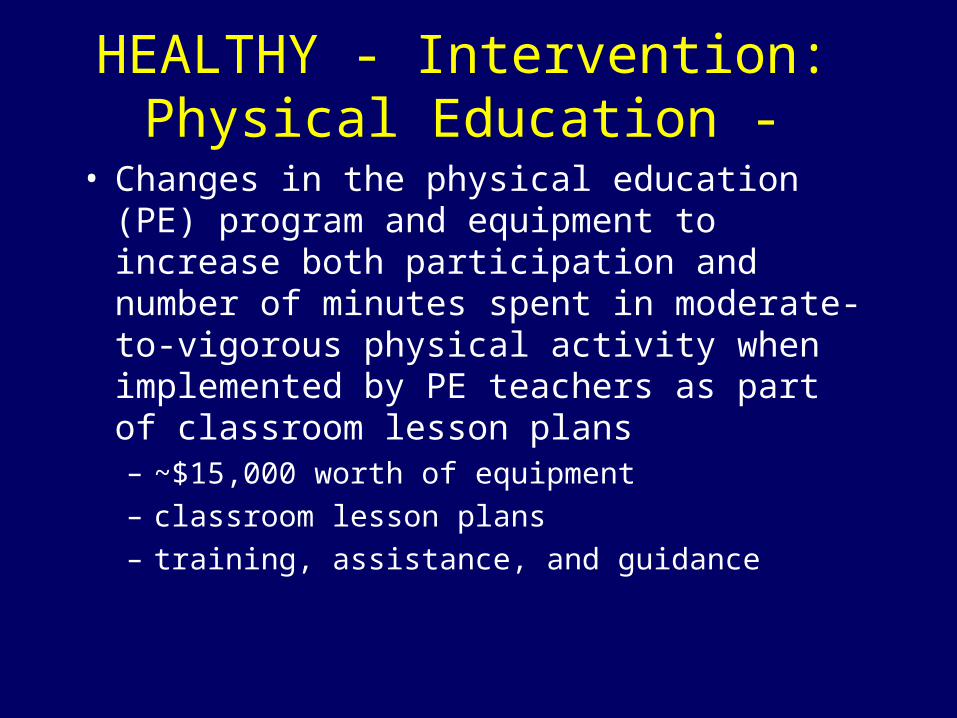
HEALTHY - Intervention: Physical Education -
• Changes in the physical education (PE) program and equipment to increase both participation and number of minutes spent in moderate-to-vigorous physical activity when implemented by PE teachers as part of classroom lesson plans– ~$15,000 worth of equipment– classroom lesson plans– training, assistance, and guidance
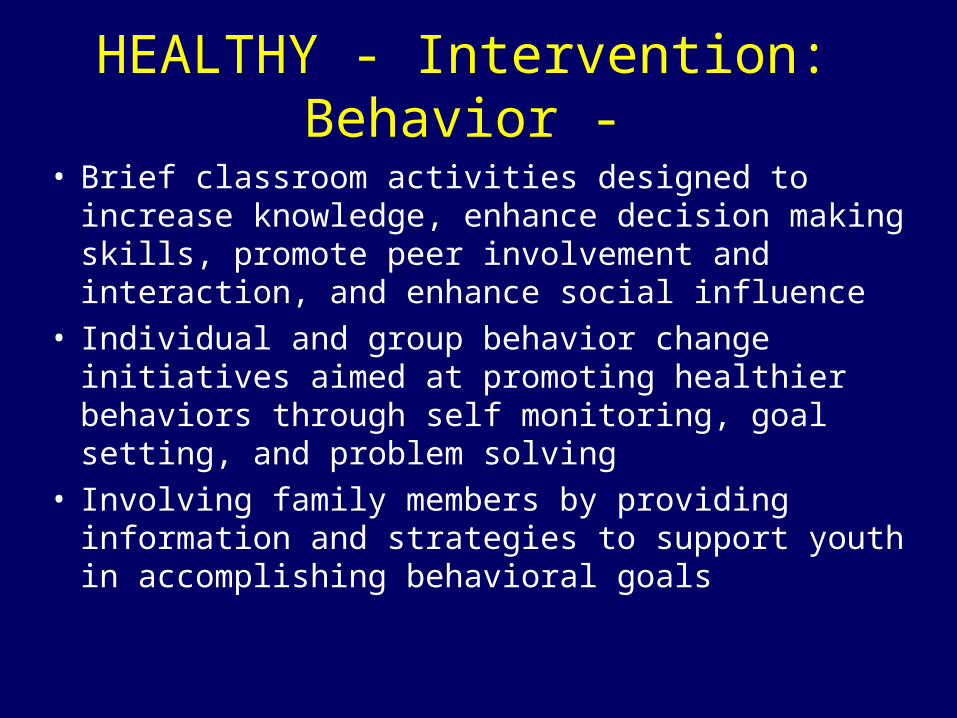
HEALTHY - Intervention: Behavior -
• Brief classroom activities designed to increase knowledge, enhance decision making skills, promote peer involvement and interaction, and enhance social influence
• Individual and group behavior change initiatives aimed at promoting healthier behaviors through self monitoring, goal setting, and problem solving
• Involving family members by providing information and strategies to support youth in accomplishing behavioral goals
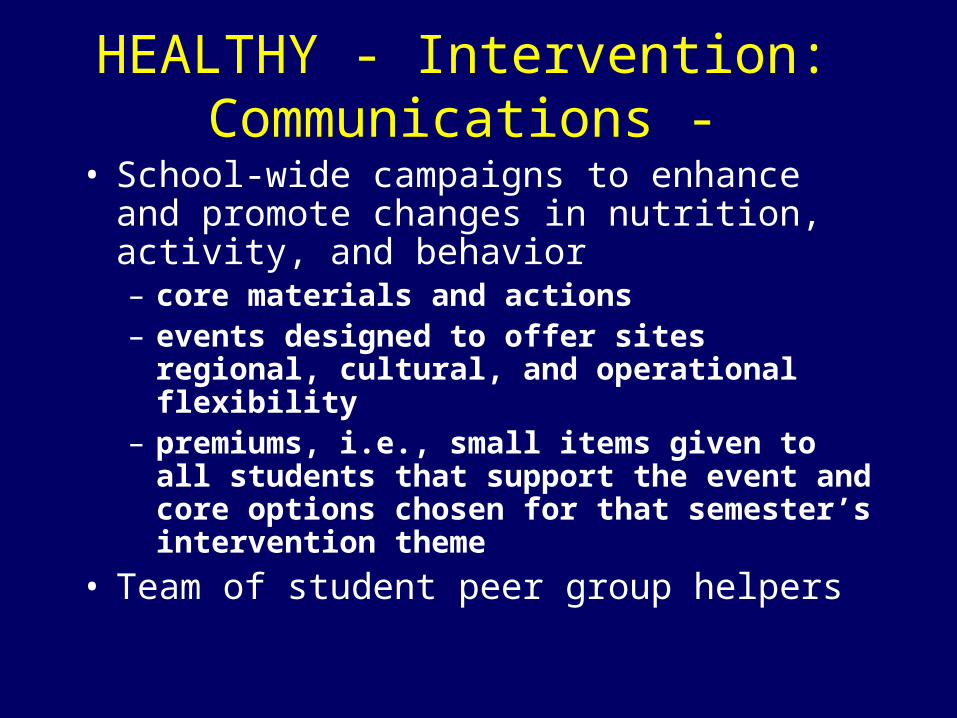
HEALTHY - Intervention: Communications -
• School-wide campaigns to enhance and promote changes in nutrition, activity, and behavior– core materials and actions– events designed to offer sites regional,
cultural, and operational flexibility– premiums, i.e., small items given to all
students that support the event and core options chosen for that semester’s intervention theme
• Team of student peer group helpers
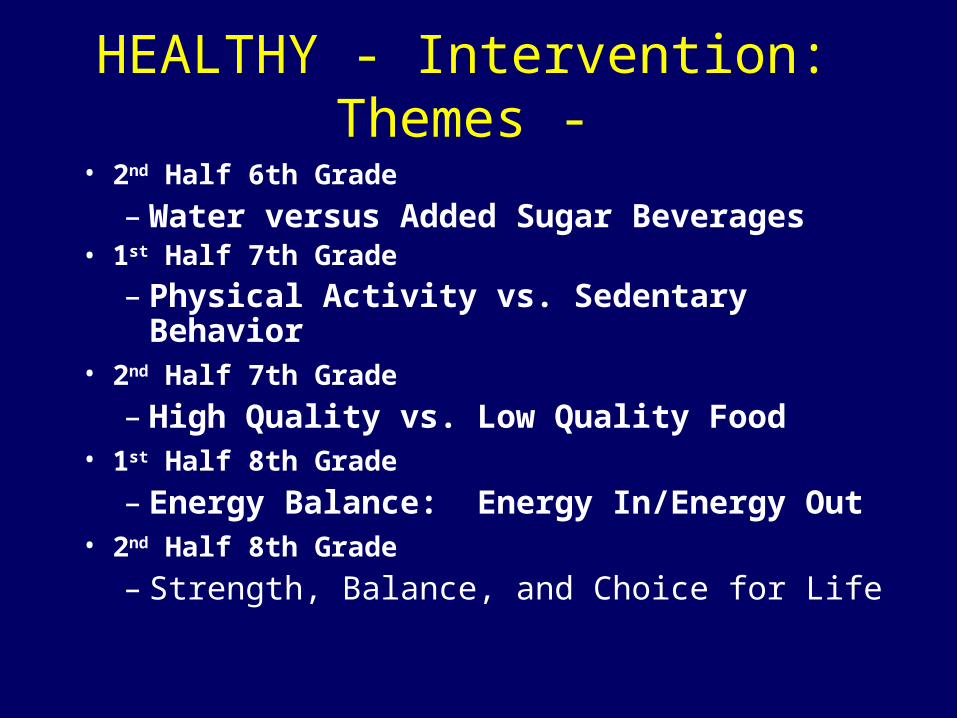
HEALTHY - Intervention: Themes -
• 2nd Half 6th Grade
– Water versus Added Sugar Beverages• 1st Half 7th Grade
– Physical Activity vs. Sedentary Behavior• 2nd Half 7th Grade
– High Quality vs. Low Quality Food• 1st Half 8th Grade
– Energy Balance: Energy In/Energy Out• 2nd Half 8th Grade
– Strength, Balance, and Choice for Life