Pedestrian wind comfort around a large football stadium in ...
26
1 Pedestrian wind comfort around a large football stadium in an urban environment: CFD simulation, validation and application of the new Dutch wind nuisance standard B. Blocken∗, J. Persoon Building Physics and Systems, Eindhoven University of Technology, P.O. box 513, 5600 MB Eindhoven, The Netherlands Abstract 3D steady RANS CFD simulations are used in combination with the new Dutch wind nuisance standard to assess pedestrian wind comfort around a large football stadium in Amsterdam, before and after the addition of new high-rise buildings. The focus of the study is on the elevated circulation deck and the surrounding streets and squares. CFD validation is performed by comparison of the simulated mean wind speed at the deck with full-scale measurements. The important effect of local ground roughness specification on the simulated wind speed values is indicated. The application of the Dutch wind nuisance standard shows that wind comfort at the elevated circulation deck is only slightly influenced by the new buildings. Wind comfort at the surrounding streets and squares however significantly deteriorates. Finally, the results obtained by the Dutch wind nuisance standard are compared to those obtained by a more simplified procedure for the transformation of wind statistics to the building site, as used in earlier studies. The more sophisticated transformation procedure in the Dutch standard was successfully validated based on full-scale measurements in earlier research. Comparison of the Dutch standard results in this study with those of the simplified procedure shows that the latter provides overestimations by up to 25% for the highest discomfort probabilities. This type of large discrepancies can significantly change the outcome of wind comfort studies. Keywords: Pedestrian wind environment; Wind conditions; Wind flow; Building; Computational Fluid Dynamics (CFD); Numerical simulation; Full-scale experiments; Validation; Sport stadium aerodynamics; Soccer stadium 1. Introduction The “Amsterdam ArenA” (Fig. 1) is a large multifunctional stadium located in south-east Amsterdam. It has a retractable roof and a capacity of 51,628 seated spectators. It is the home stadium of the Ajax Amsterdam football team. It also hosts several concerts every summer. The stadium has an outdoor circulation deck that runs around the stadium circumference (Fig. 1). The deck is located at a height of about 8.5 m above ground level. Wind speed at the deck is often experienced as uncomfortable. In addition, the new urban master plan of the site aims to erect several new high-rise buildings in the stadium vicinity, which raises questions about the future wind comfort at the deck and at the surrounding streets and squares. Wind comfort assessment studies consist of combining statistical meteorological data with aerodynamic information and a comfort criterion. The aerodynamic information is needed to transform the statistical meteorological data from the weather station to the location of interest at the building site, after which it is combined with a comfort criterion to judge local wind comfort. The aerodynamic information usually consists of two parts: the terrain related contribution and the design related contribution. The terrain related contribution represents the change in wind statistics from the meteorological site to a reference location near the building site (see Fig. 2: transformation from U pot to U ref ). The design related contribution represents the change in wind statistics due to the local urban design, i.e. the building configurations (U ref to U). Different transformation procedures exist to determine the terrain related contribution; they often employ a simplified model of the atmospheric boundary layer (ABL) such as the logarithmic mean wind speed profile. The design related ∗ Corresponding author: Bert Blocken, Building Physics and Systems, Eindhoven University of Technology, P.O. box 513, 5600 MB Eindhoven, the Netherlands. Tel: +31 (0)40 247 2138, Fax: +31 (0)40 243 8595. E-mail address: [email protected] Accepted for publication in Journal of Wind Engineering and Industrial Aerodynamics, 20 June 2009
Transcript of Pedestrian wind comfort around a large football stadium in ...
1
Pedestrian wind comfort around a large football stadium in an urban environment: CFD simulation, validation and application of the new Dutch wind nuisance standard
B. Blocken∗, J. Persoon
Building Physics and Systems, Eindhoven University of Technology, P.O. box 513, 5600 MB Eindhoven, The Netherlands
Abstract
3D steady RANS CFD simulations are used in combination with the new Dutch wind nuisance standard to assess pedestrian wind comfort around a large football stadium in Amsterdam, before and after the addition of new high-rise buildings. The focus of the study is on the elevated circulation deck and the surrounding streets and squares. CFD validation is performed by comparison of the simulated mean wind speed at the deck with full-scale measurements. The important effect of local ground roughness specification on the simulated wind speed values is indicated. The application of the Dutch wind nuisance standard shows that wind comfort at the elevated circulation deck is only slightly influenced by the new buildings. Wind comfort at the surrounding streets and squares however significantly deteriorates. Finally, the results obtained by the Dutch wind nuisance standard are compared to those obtained by a more simplified procedure for the transformation of wind statistics to the building site, as used in earlier studies. The more sophisticated transformation procedure in the Dutch standard was successfully validated based on full-scale measurements in earlier research. Comparison of the Dutch standard results in this study with those of the simplified procedure shows that the latter provides overestimations by up to 25% for the highest discomfort probabilities. This type of large discrepancies can significantly change the outcome of wind comfort studies. Keywords: Pedestrian wind environment; Wind conditions; Wind flow; Building; Computational Fluid Dynamics (CFD); Numerical simulation; Full-scale experiments; Validation; Sport stadium aerodynamics; Soccer stadium 1. Introduction
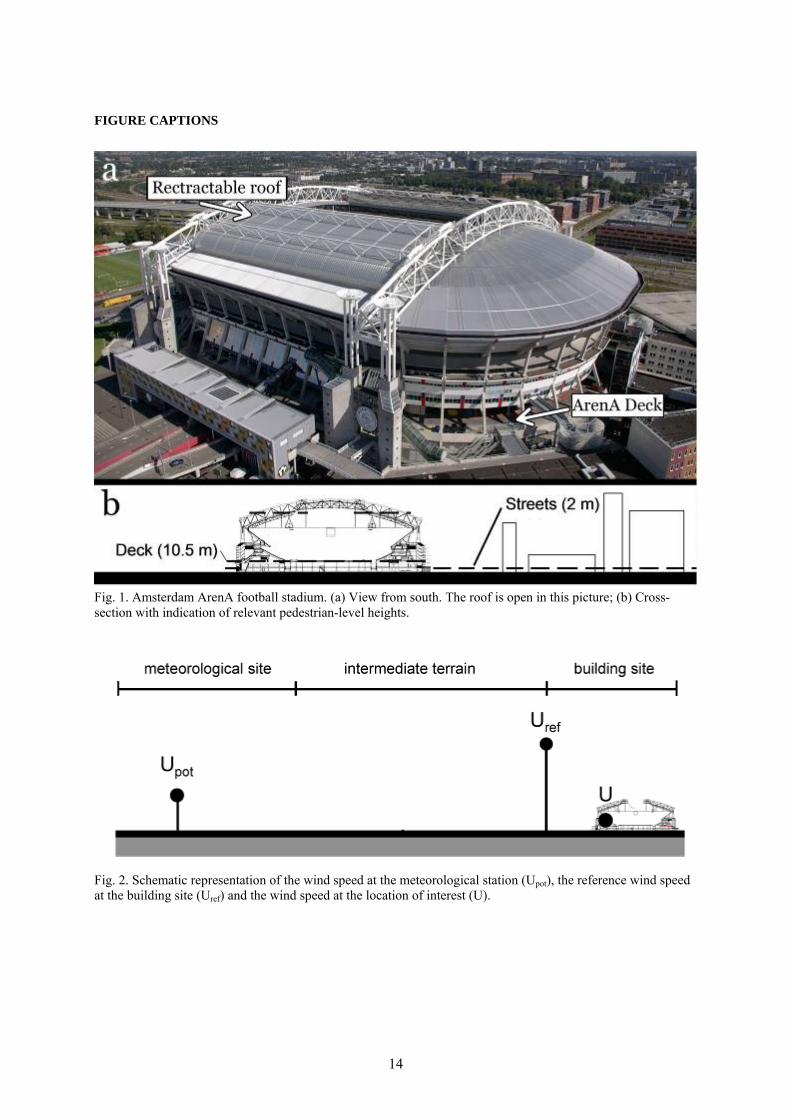
The “Amsterdam ArenA” (Fig. 1) is a large multifunctional stadium located in south-east Amsterdam. It has a retractable roof and a capacity of 51,628 seated spectators. It is the home stadium of the Ajax Amsterdam football team. It also hosts several concerts every summer. The stadium has an outdoor circulation deck that runs around the stadium circumference (Fig. 1). The deck is located at a height of about 8.5 m above ground level. Wind speed at the deck is often experienced as uncomfortable. In addition, the new urban master plan of the site aims to erect several new high-rise buildings in the stadium vicinity, which raises questions about the future wind comfort at the deck and at the surrounding streets and squares.
Wind comfort assessment studies consist of combining statistical meteorological data with aerodynamic information and a comfort criterion. The aerodynamic information is needed to transform the statistical meteorological data from the weather station to the location of interest at the building site, after which it is combined with a comfort criterion to judge local wind comfort. The aerodynamic information usually consists of two parts: the terrain related contribution and the design related contribution. The terrain related contribution represents the change in wind statistics from the meteorological site to a reference location near the building site (see Fig. 2: transformation from Upot to Uref). The design related contribution represents the change in wind statistics due to the local urban design, i.e. the building configurations (Uref to U). Different transformation procedures exist to determine the terrain related contribution; they often employ a simplified model of the atmospheric boundary layer (ABL) such as the logarithmic mean wind speed profile. The design related
∗ Corresponding author: Bert Blocken, Building Physics and Systems, Eindhoven University of Technology, P.O. box 513, 5600 MB Eindhoven, the Netherlands. Tel: +31 (0)40 247 2138, Fax: +31 (0)40 243 8595. E-mail address: [email protected]
Accepted for publication in Journal of Wind Engineering and Industrial Aerodynamics, 20 June 2009

2
contribution (i.e. the wind flow conditions around the buildings at the building site) is usually obtained by wind tunnel modelling, but can also be obtained by CFD.
In the past, several CFD studies of pedestrian wind conditions in complex urban environments have been performed (Murakami 1990, Gadilhe et al. 1993, Takakura et al. 1993, Stathopoulos and Baskaran 1996, Baskaran and Kashef 1996, He and Song 1999, Ferreira et al. 2002, Richards et al. 2002a, Miles and Westbury 2002, Westbury et al. 2002, Hirsch et al. 2002, Blocken et al. 2004, Yoshie et al. 2007, Blocken and Carmeliet 2008). Almost all studies were conducted with the steady Reynolds-averaged Navier-Stokes (RANS) approach. An exception to this is the study by He and Song (1999) who used Large Eddy Simulation (LES). Most studies included a comparison of the CFD results with wind tunnel measurements for the same urban configuration (Gadilhe et al. 1993, Takakura et al. 1993, Stathopoulos and Baskaran 1996, Ferreira et al. 2002, Richards et al. 2002, Miles and Westbury 2002, Westbury et al. 2002, Yoshie et al. 2007). In some other studies, sub-configuration validation was performed (Blocken et al. 2004, Blocken and Carmeliet 2008). This refers to performing validation for simpler generic building configurations that represent sub-configurations of the more complex urban configuration. For these generic configurations, wind tunnel measurements are generally available. The confidence extracted from this validation can be used to support the application of CFD with similar computational parameters for the more complex urban configuration. Pedestrian-level wind studies in complex urban environments in which CFD results are compared with field measurements – as opposed to wind tunnel measurements – are very scarce. One such study was performed by Yoshie et al. (2007), who compared CFD simulations with field measurements performed with 3-cup anemometers in 1977 in the Shinjuku Sub-central Area in Tokyo (Yoshida et al. 1978, Asami et al. 1978).
Although the use of CFD for the study of pedestrian wind conditions in complex urban configurations is still an issue of debate, it has been employed on a few occasions in the past as part of wind comfort assessment studies (e.g. Richards et al. 2002a, Hirsch et al. 2002, Blocken et al. 2004, Blocken and Carmeliet 2008). The use of CFD in such studies is receiving strong support from several international initiatives that specifically focus on the establishment of guidelines for such simulations (Franke et al. 2004, Franke et al. 2007, Yoshie et al. 2007, Tominaga et al. 2008) and from review papers summarizing past achievements and future challenges (Stathopoulos 2002, Blocken and Carmeliet 2004, Franke et al. 2004, Stathopoulos 2006, Mochida and Lun 2008).
Recently, a new standard for wind comfort (NEN 8100) and a new practice guideline (NPR 6097) have been developed in the Netherlands (NEN 2006a, 2006b) based on research work by Verkaik (2000, 2006), Willemsen and Wisse (2002, 2007), Wisse and Willemsen (2003), Wisse et al. (2007), and others. This standard and guideline contain a verified transformation model for the terrain related contribution. The standard also explicitly allows the user to choose between wind tunnel modelling and CFD to determine the design related contribution. In relation to this new standard, Willemsen and Wisse (2007) state that research and demonstration projects are needed. This paper presents such a research and demonstration project.
In this paper, 3D steady RANS CFD simulations are combined with the new Dutch wind nuisance standard to assess pedestrian wind comfort around the Amsterdam “ArenA” football stadium, before and after the addition of new high-rise buildings at the site. Special attention is given to ground roughness specification and validation. The results by the Dutch wind nuisance standard are compared to those obtained by a more simplified procedure for the transformation of wind statistics to the building site, as used in earlier studies. In section 2, some general aspects of wind comfort assessment procedures are briefly outlined. Section 3 contains the headlines of the new Dutch wind nuisance standard. In section 4, the football stadium and its surroundings are described. Section 5 presents the field measurements. In section 6, the computational model and the computational parameters are outlined. Section 7 presents the CFD simulation results and the comparison with the field measurements. In section 8, the results of wind comfort assessment with the Dutch standard are presented. They are compared with the results by a simpler procedure in section 9. Finally, sections 10 (discussion) and 11 (conclusions) conclude the paper. 2. General aspects of wind comfort assessment procedures
Although thermal effects are also important for (wind) comfort (Stathopoulos 2006, Metje et al. 2008), wind comfort assessment studies generally only focus on the mechanical effects of wind on people. For such studies, three aspects are needed: (1) statistical meteorological data; (2) aerodynamic information; and (3) a comfort criterion.

3
2.1. Statistical meteorological data
Generally, data is selected from a nearby meteorological station at which the wind climate is considered representative for the building site. The data should cover a period of several decades (typically 30 years) and should be exposure corrected. In the Netherlands, the Royal Dutch Meteorological Institute (KNMI) provides hourly mean values of potential wind speed (Upot) and wind direction. Upot is the wind speed at 10 m height at an ideal meteorological station with an aerodynamic roughness length y0,1 = 0.03 m. 2.2. Aerodynamic information
The aerodynamic information is used to transfer the statistical meteorological data from the meteorological station to the location of interest at the building site (Fig. 2). The ratio of the local pedestrian-level mean wind speed U at the location of interest to Upot is given by the total wind amplification factor γ, which can be split into contributions from different spatial scales: the design related contribution (U/Uref) and the terrain related contribution (Uref/Upot):
pot
ref
refpot UU
UU
UUγ ⋅== (1)
where Uref is a reference wind speed that can be defined in various ways. In this study, it will be taken at 60 m height near the building site. As mentioned before, the ratio U/Uref can be determined by wind tunnel testing or by CFD. The terrain related contribution Uref/Upot should at least take into account the difference in terrain roughness between the meteorological site and the building site. Different transformation models exist to determine Uref/Upot. A simple procedure is based on the logarithmic law for both terrain types:
( )( )
⎟⎟⎠
⎞⎜⎜⎝
⎛+⋅
⎟⎟⎠
⎞⎜⎜⎝
⎛+⋅
===
=
1y
m10lnu
1y
m60lnu
m10yUm60yU
UU
0,1
*1
0,2
*2
1
2
pot
ref (2)
where y is the height coordinate, u* is the friction velocity, y0,1 the aerodynamic roughness length at the meteorological station (= 0.03 m) and y0,2 the aerodynamic roughness length of the terrain upstream of the building site (10 km fetch), for the wind direction under consideration. y0,2 can be determined based on the Davenport roughness classification, updated by Wieringa (1992). A relationship between u2* and u1* is given by Simiu and Scanlan (1986):
0.0706
0,1
0,2*1
*2
yy
uu
⎟⎟⎠
⎞⎜⎜⎝
⎛= (3)
By applying this procedure for each wind direction θ, values for the total amplification factor γ can be obtained for each wind direction: γθ. 2.3. Comfort criterion
Many wind comfort criteria have been suggested and used in the past. Most criteria are based on the combination of a threshold wind speed and a maximum allowed exceedence probability of this threshold value. A comparison of a wide range of criteria can be found in (Bottema 1993, 2000). 3. New Dutch wind nuisance standard
Only the main features of the new standard are outlined here. For more information, the reader is referred to the original documents (NEN 2006a, 2006b) and the relevant publications (Verkaik 2000, 2006, Willemsen and Wisse 2002, 2007, Wisse and Willemsen 2003, Wisse et al. 2007).

4
3.1. Statistical meteorological data and aerodynamic information
The combination of statistical meteorological data and the terrain related contribution is dealt with by the Dutch practice guideline NPR 6097 (NEN 2006b). This guideline provides a more advanced, detailed and verified procedure than the simplified procedure in section 2. This procedure is embedded in a software tool that can provide the wind statistics of the hourly mean wind speed at 60 m height for every location in the Netherlands. It is based on the statistical meteorological data at 51 meteorological stations across the Netherlands for a period of 40 years (1963 – 2002), the national land-use map with a resolution of 500x500 m², a footprint model and a two-layer model of the neutral ABL. The national land-use map is converted to a roughness map by assigning aerodynamic roughness lengths to each type of land use. For any location in the Netherlands, the roughness map and the footprint model are combined to provide a regional roughness length y0,NPR, based on a 6 – 10 km upstream fetch, for every wind direction. The two-layer model divides the ABL into a surface layer (0 - 60 m height) and an Ekman layer (60 m – 1 km height) and assumes neutral atmospheric stability (Verkaik 2006). In the surface layer, the vertical transformation of mean wind speed is based on the neutral logarithmic law and the local roughness length. In the Ekman layer, the vertical transformation is performed with the planetary resistance laws and the regional roughness length. Based on this model and information, the wind statistics at the building site are obtained using a five-step procedure (NEN 2006b): (1) Vertical transformation of the wind statistics at each meteorological station from 10 m height to 60 m
height based on the logarithmic wind speed profile and the local roughness resulting from gust analysis; (2) Vertical transformation of the 60 m wind statistics at every station to the top of the atmospheric boundary
layer (“macro-wind”) using the planetary resistance laws and the regional roughness y0,NPR as derived from the roughness map;
(3) Horizontal interpolation of the macro-wind of each station on a regular grid; (4) Horizontal interpolation of the macro-wind from the grid to the location of the building site; (5) Vertical transformation of the macro-wind at the building site to the wind at 60 m height using the
planetary resistance laws and the regional roughness y0,NPR as derived from the roughness map. This procedure was verified by Verkaik (2006) by comparing the downscaled wind speed values predicted by this procedure to the corresponding wind speed measurements at two sites: Hansweert, in the southwest part of the Netherlands, and Amsterdam Schiphol Airport, in the northwest. Hansweert is a coastal location in the province of Zeeland. This location was selected for its highly complex roughness map with large directional differences in roughness. Amsterdam Airport Schiphol is a typical inland location with built-up areas. However, also at this site there are large directional differences in roughness. Comparisons in the winter and summer period showed that for Hansweert, the absolute difference between downscaled prediction and measurements is less than 0.5 m/s for the greater part of the measurement period and for each wind direction. For Schiphol, for the greater part of the measurement period and for most wind directions, the absolute difference is less than 0.5 m/s in the summer period and less than 1 m/s in the winter period. This is about 5-10% of the measured wind speeds for most wind directions, which is considered a very good agreement.
The design related contribution can be determined by wind tunnel or CFD modelling of the wind flow around the building and its surroundings. The standard explicitly allows the user to choose between either wind tunnel modelling or CFD, but also requires a report specifying details of the employed wind tunnel or CFD procedure, as a measure to achieve a minimum level of quality assurance.
3.2. Comfort criterion
The comfort criterion is based on a threshold value for the hourly mean wind speed of 5 m/s and on the
exceedence probability P of this threshold value, which determines the grade or “quality class” (A to E) of the local wind climate (Table 1). The judgement of the local wind climate (“good, moderate, poor”) of a certain class depends on the activity (traversing, strolling or sitting). 4. Description of football stadium and surroundings
The football stadium has a length of 226 m, a width of 190 m and a height of 72 m (Fig. 3). It has a
retractable roof that consists of two moving parts as indicated in Fig. 1. The roof is opened during most of the year, except in the concert season, when it is almost continuously closed from end of May until end of August. It is also closed during football games when it rains. An elevated circulation deck (ArenA deck) runs around the circumference of the stadium (Figs. 1, 3, 4a) at a height of about 8.5 m above ground level. The deck is connected with the stadium interior by four large apertures or “gates” in the corners of the circumference (Fig.

5
4b). The gates have a cross-section of Wg x Hg = 6.2 x 6.7 m². Their position is indicated by the black arrows in Fig. 3a. The roof and the gates are the main openings and connections between the stadium interior and exterior.
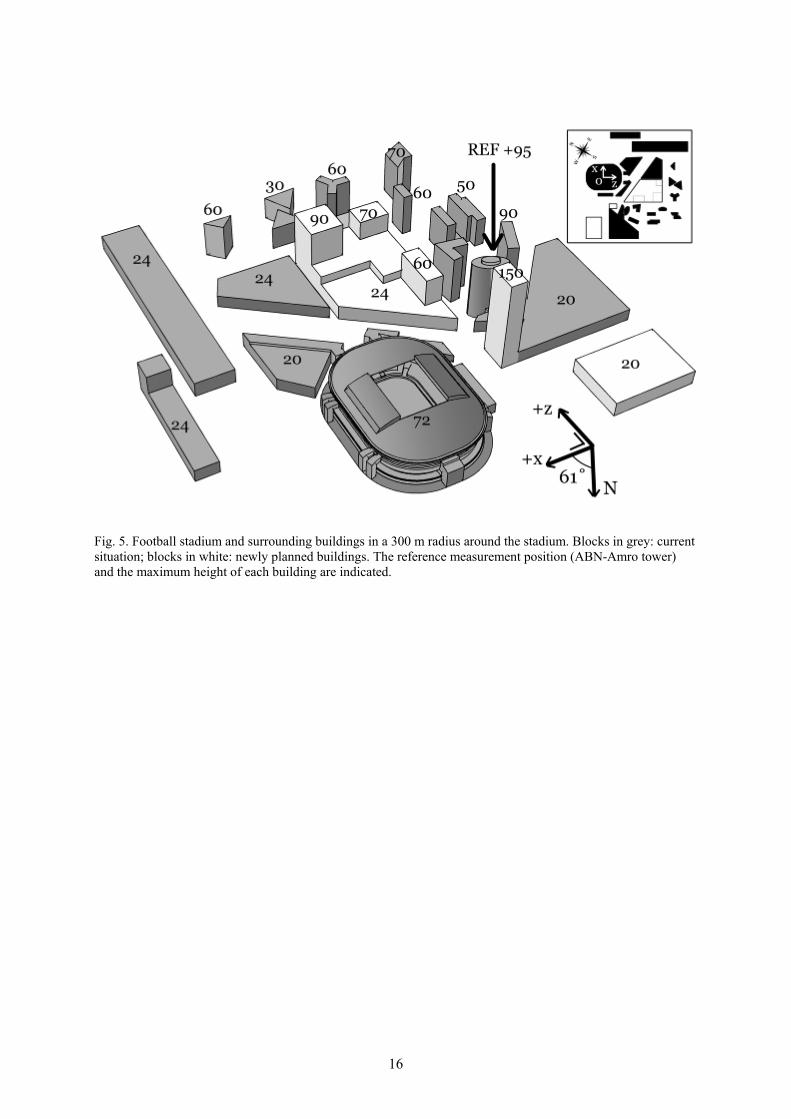
The stadium is located at the outskirts of the city of Amsterdam. Several high-rise and medium-rise office and residential buildings are present in the immediate vicinity. The present situation is indicated in Fig. 5 by the buildings that are represented by grey blocks. The newly planned developments consist of the buildings represented by white blocks in Fig. 5. Relatively few trees or other vegetation are present in this area. A plan view of the wider surroundings, with a radius of 10 km around the stadium, is shown in Fig. 6. The part of the site that will be modelled in CFD is indicated by the white square at the centre of the circle. Fig. 6 also indicates an estimate of the aerodynamic roughness length y0,DAV for this 10 km fetch and for the twelve wind direction sectors, based on the updated Davenport roughness classification (Wieringa 1992). These y0,DAV values are needed for the inlet profiles of the CFD simulations. Obtaining a good estimate for y0,DAV is difficult given the heterogeneity of the surrounding terrain. For example, on the NE side, roughness is low for the distant part, but high for the concentration of high-rise apartment buildings close to the edge of the computational domain. It is important to note that these y0,DAV values have been estimated from the land-use map from NPR 6097 in combination with the updated roughness classification by Wieringa (1992). It might seem strange to determine them this way, because they could be taken equal to the regional roughness lengths y0,NPR, which have already been calculated from the high-resolution roughness map and which are used in the NPR 6097 software (see section 3). It would be better to use these y0,NPR values – which are probably considerably more accurate than the y0,DAV estimates by the user - for the inlet profiles for the CFD simulations. Unfortunately, the y0,NPR values cannot be extracted from NPR 6097. This issue will be discussed further in section 10. 5. Full-scale measurements
Wind speed measurements were made at the deck during the period September – November 2007 with four
3D ultrasonic anemometers, mounted on mobile posts, at 20 different positions at the deck, including the four gates, and at a height of 2 m. The reference wind speed Uref,meas is measured by an ultrasonic anemometer on top of a 10 m mast, positioned on the roof of the ABN-Amro tower building, which is the highest building in the present situation (Fig. 5). The total reference measurement height is 105 m. Data were sampled at 5 Hz and analysed. Only measurement data that showed sufficiently stable wind direction values for at least an hourly interval were retained and transformed into hourly averaged values. Only measured wind speed values at the deck larger than 2 m/s were retained, in an attempt to exclude measurement values that could be affected by local thermal effects. This is important because these measurements will be used for CFD validation, and the CFD simulations will be performed for isothermal conditions. In addition, note that the discomfort threshold wind speed in the comfort criterion used in this study (Table 1) is 5 m/s and that periods with lower local wind speed values do not add to the discomfort probability. For this reason, wind comfort studies are generally performed for isothermal conditions.
An important consideration during the measurements is the situation of the retractable roof (open versus closed). Evidently, this has a large impact on wind speed and wind direction, at least near the gates. Measurements indicated that, with open roof, all wind velocity vectors are directed to the stadium interior, caused by the under-pressure at roof height. With the roof closed, the wind enters at one or two gates, and exits through the others. In this study, we focus on the situation with open roof, which is the configuration during most part of the year, including the majority of the football season. It is also the situation with the highest wind speed ratio or amplification factor (U/Uref,meas) in the gates. Fig. 7 shows measured horizontal wind velocity vectors for three different wind directions, illustrating the wind circulation over the deck. Different measurement sets for similar reference wind directions (within a 10° interval) have been added together in this figure. 6. CFD simulations: computational model and computational parameters 6.1. Computational model and domain
The model geometry of the stadium and the surrounding buildings is shown in Fig. 5. The stadium geometry
is modelled in detail, including the geometry of the deck, the gates, the retractable roof, the small buildings attached to the stadium and the stadium interior. The explicitly modelled buildings are the stadium itself and the surrounding buildings in a radius of 300 m around the stadium, according to the guidelines by NEN (2006a), which are similar to those by Franke et al. (2007). The surrounding buildings are only modelled with their main shape (Fig. 5). The wider surroundings are not modelled explicitly, but only by means of rough surfaces with a specified equivalent sand-grain roughness height kS and roughness constant CS. These are the parameters in the roughness modification of the wall functions in the commercial CFD code Fluent 6.3.26 used in this study. They

6
are determined based on the aerodynamic roughness length y0 of the terrain in and beyond the computational domain (Fig. 6) and on the relationship between kS, y0 and the roughness constant CS for Fluent 6.3 (see Blocken et al. 2007a). The stadium and the surrounding buildings are placed in a computational domain with dimensions LD x WD x HD = 3000 x 3000 x 900 m³. The maximum blockage ratio is 1.5 %. 6.2. Computational grid
Due to the complex geometry of the football stadium and the large difference between the smallest (0.1 m)
and largest (3000 m) length scales in the domain, special attention was given to generating a computational grid with good quality. This was done based on geometrical translation and rotation operations of pre-meshed 2D cross-sections. The resulting grid consists of hexahedral and prismatic cells, and does not contain any tetrahedral cells. The highest grid resolution has been applied at the deck of the stadium, while a lower resolution has been used near the surrounding buildings. Figs. 8a and b illustrate part of the grid on the building surfaces for the current and the future situation, respectively. Fig. 9 shows some details of the surface grid at the deck and near one of the gates. The total number of cells is 2,812,028 for the current situation and 2,784,300 for the situation with newly planned buildings.
Grid-sensitivity analysis is performed for the current situation by constructing two additional grids, a coarser grid with 1,805,338 cells and a finer grid with 3,574,104 cells. The wind speed amplification factors U/Uref,num for the three grids are compared along four horizontal lines at a height of 2 m above the deck (Fig. 10), for the prevailing SW wind direction. Uref,num is the simulated mean wind speed at the location of the corresponding reference measurement position (top of ABN-Amro tower in Fig. 5). Figs. 11a and b illustrate the differences between the coarse and the basic grid and between the basic grid and the fine grid, respectively. δavg is the average deviation between the results on two grids. The figure shows that the differences between the coarse grid and the basic grid are significant, while those between the basic grid and the fine grid are small. This indicates that the basic grid should be suitable, at least for the positions at the deck. 6.3. Boundary conditions
The inlet mean wind speed profile is a neutral logarithmic profile with aerodynamic roughness length as
indicated in Fig. 6. For y0 = 0.5 m, the inlet longitudinal turbulence intensity IU ranges from 30 % at pedestrian height (y = 2 m) to 5 % at gradient height. For y0 = 1 m, IU ranges from 40 % (y = 2 m) to 8% at gradient height. Turbulent kinetic energy k is calculated from the longitudinal turbulence intensity using k = 1.5(IUU)², assuming σu = σv = σw. Note that this yields a k-profile that is not constant with height, as will be shown in Fig. 13. The inlet turbulence dissipation rate profile is given by ε(y) = u*³/κ(y+y0), where κ is the von Karman constant (∼ 0.42). The sides and the top of the computational domain are modelled as slip walls (zero normal velocity and zero normal gradients of all variables). At the outlet, zero static pressure is specified.
For ground roughness specification, the standard wall functions by Launder and Spalding (1974) with the kS-type roughness modification by Cebeci and Bradshaw (1977) is used. kS is the equivalent sand-grain roughness height. Note that in Fluent 6.3, these kS-type wall functions are implemented, instead of the often used y0-type wall functions (Richards and Hoxey 1993). In y0-type wall functions, the roughness parameter is the aerodynamic roughness length y0 (see e.g., Richards and Hoxey 1993, Richards et al. 2002b; Mochida et al. 2002, Bitsuamlak et al., 2006). A discussion on kS and y0-type wall functions can be found in (Blocken et al. 2007a). For complex terrains in wind engineering, it is generally easier to estimate y0 than kS. For y0, the updated Davenport roughness classification can be used (Wieringa 1992). When using kS-type wall functions, first y0 can be estimated from this classification, after which it has to be converted to kS, which is a user input in the Fluent code. Another input parameter for the wall functions in Fluent is the roughness constant CS. Note that only the product kSCS appears in the wall functions for fully rough walls (Fluent Inc. 2006). This implies that the individual values of kS and CS in upstream (fully rough) regions are not important, only their product. For the Fluent 6.3 wall functions, the conversion equation between y0, kS and CS was derived by requiring first-order continuity matching of the kS-type wall function with the logarithmic law with parameter y0 (Blocken et al. 2007a):
SS C
y.k 07939
= (4)
In the upstream part of the computational domain, outside the influence of the explicitly modelled buildings,
generally the simulation of a horizontal homogeneous ABL is intended. Horizontal homogeneity refers to the

7
absence of streamwise gradients in the vertical profiles of mean wind speed and turbulence quantities (e.g., Richards and Hoxey 1993, Blocken et al. 2007a, 2007b, Franke et al. 2007, Yang et al. 2009). The requirements for horizontal homogeneity have been listed in (Blocken et al. 2007a). One of these requirements is satisfying Eq. (4), where y0 is the roughness length in the inlet logarithmic wind speed profile. However, it is generally not possible to satisfy all requirements, due to the inconsistency between turbulence model, wall function roughness modifications, inlet profiles and near-wall grid resolution (Blocken et al. 2007a). This is in particular the case with inlet turbulent kinetic energy profiles that deviate from k = (u*)²/Cμ
0.5, as in this study. The problem of horizontal inhomogeneity can then occur irrespective of whether kS or y0-type wall functions are used. This problem will be demonstrated below.
For specifying surface roughness, the bottom of the computational domain is divided into two zones, as indicated in Fig. 12. Zone 2 is the bottom of the region of the explicitly modelled buildings. In zone 1, the buildings are modelled implicitly by applying values for kS and CS corresponding to the upstream aerodynamic roughness lengths y0. Application of Eq. (4) with the restriction kS ≤ yP (Fluent Inc. 2006, Blocken et al. 2007a) yields: for y0 = 0.5 m: kS = 0.7 m, CS = 7; and for y0 = 1 m: kS = 0.9 m; CS = 10.9. The value of kS in zone 2 on the other hand should be the equivalent sand-grain roughness height of all non-explicitly modelled obstacles between the buildings, i.e. all features on the streets and squares. This local kS value is very difficult to estimate, and to the knowledge of the authors, no guidelines are available for this. The same holds for the value of the roughness constant CS. Earlier research indicated that the value of kS can have a large influence on pedestrian-level wind speed (Blocken et al. 2007b). The impact of the local ground roughness specification (choice of local kS and CS) on the ratio U/Uref,num in this study has been assessed and will be addressed in section 7. For now, the values kS = 0.6 m and CS = 0.5 are used. Note that Eq. (4) shows that these values correspond to about y0 = 0.03 m. Of all values in the updated Davenport roughness classification, this value is considered the best choice to represent the local ground roughness of the streets and squares, because they also include isolated objects such as local vegetation, benches, sculptures, etc. These features are not modelled explicitly (i.e. by their actual shape and size), and should therefore be included in the estimated y0 value and in the equivalent sand-grain roughness value. According to the roughness classification, y0 = 0.03 m corresponds to “level country with low vegetation (e.g. grass) and isolated obstacles with separations of at least 50 obstacle heights; e.g. grazing land without windbreaks, heather, moor and tundra, runway area of airports” (Wieringa 1992).
The occurrence of unintended streamwise gradients with these settings, for flow over zone 1, is tested in an empty computational domain with a similar grid distribution as the actual domain. Fig. 13 shows the results for the vertical profiles of mean wind speed and turbulent kinetic energy, for both y0 = 0.5 m and y0 = 1 m. While horizontal homogeneity is very good for U, the differences for k are considerable. These are due to the remaining inconsistency – as mentioned above – in spite of the application of Eq. (4). At least, Eq. (4) ensures good horizontal homogeneity for U. 6.4. Other computational parameters
The CFD simulations are conducted with the commercial code Fluent 6.3.26 and the 3D steady RANS
equations and isothermal conditions. Closure is provided by the realizable k-ε model (Shih et al. 1995). The governing equations are solved using the control volume method. Pressure-velocity coupling is taken care of by the SIMPLE algorithm. Pressure interpolation is second order. Second order discretisation schemes are used for both the convection terms and the viscous terms of the governing equations. Simulations are performed for the centre wind direction in each wind direction sector indicated in Fig. 6. 7. CFD simulations and validation 7.1. Sensitivity to local ground roughness specification
As mentioned in section 6.3, the local kS value (with default CS = 0.5) at the surrounding streets and squares
is difficult to estimate. The sensitivity of the amplification factor U/Uref,num at the deck and at the streets and squares to the local ground roughness specification is investigated by performing simulations for the situation with newly planned buildings and for wind direction θ = 240° with a range of different kS and CS values: (kS;CS) = (0;0.5); (0.3;0.5); (0.6;0.5); (0.6;1) and (0.6;2). Note that (0.6;1) corresponds to (1.2;0.5) for fully rough walls because then only the product kSCS is of importance. The simulation results indicate that the influence of local ground roughness is most pronounced near ground-level. U/Uref,num at the deck is not very sensitive to these values because pedestrian level at the deck is located at 10.5 m above ground-level. The maximum difference at the deck is only about 4%. The sensitivity of U/Uref,num at the surrounding streets and squares however is significant: Fig. 14 shows that for the highest amplification factors, differences along line AB go up to 20% and

8
along line CD up to 25%. A detailed analysis of the influence of these differences on the resulting wind comfort assessment is out of the scope of this paper, but will be addressed in future research. In the remainder of the paper, the local values kS = 0.6 m and CS = 0.5 (corresponding to y0 = 0.03 m) are used. Due to their sensitivity, the results at the surrounding streets and squares should primarily be interpreted qualitatively, i.e. for comparison of the situations with and without new buildings present. 7.2. Validation
The experimental and the numerical amplification factors (U/Uref,meas and U/Uref,num) are compared at several
positions at the deck. The measurements are clustered in wind direction intervals of 10°. Note that U/Uref,meas and U/Uref,num are defined in the same way, i.e. based on the reference value at the mast on the ABN-Amro tower (Fig. 5). Figure 15 compares the magnitude and direction of the amplification vectors for two wind directions. Note that in this figure, for visualisation purposes, the length of the vectors is not proportional to the magnitude of wind speed. Although the overall agreement is quite good for both cases, at some locations, considerable discrepancies exist for amplification vector magnitude and/or direction, e.g. in some of the gates. This is partly attributed to the fact that some geometrical details of the gates were simplified in the numerical model, and partly to the large wind speed gradients at these locations. Fig. 16 compares the measured and simulated amplification factor magnitude at the deck for reference wind directions 60°, 78°, 210°, 280° en 345°, illustrating an overall good agreement. 7.3. Results
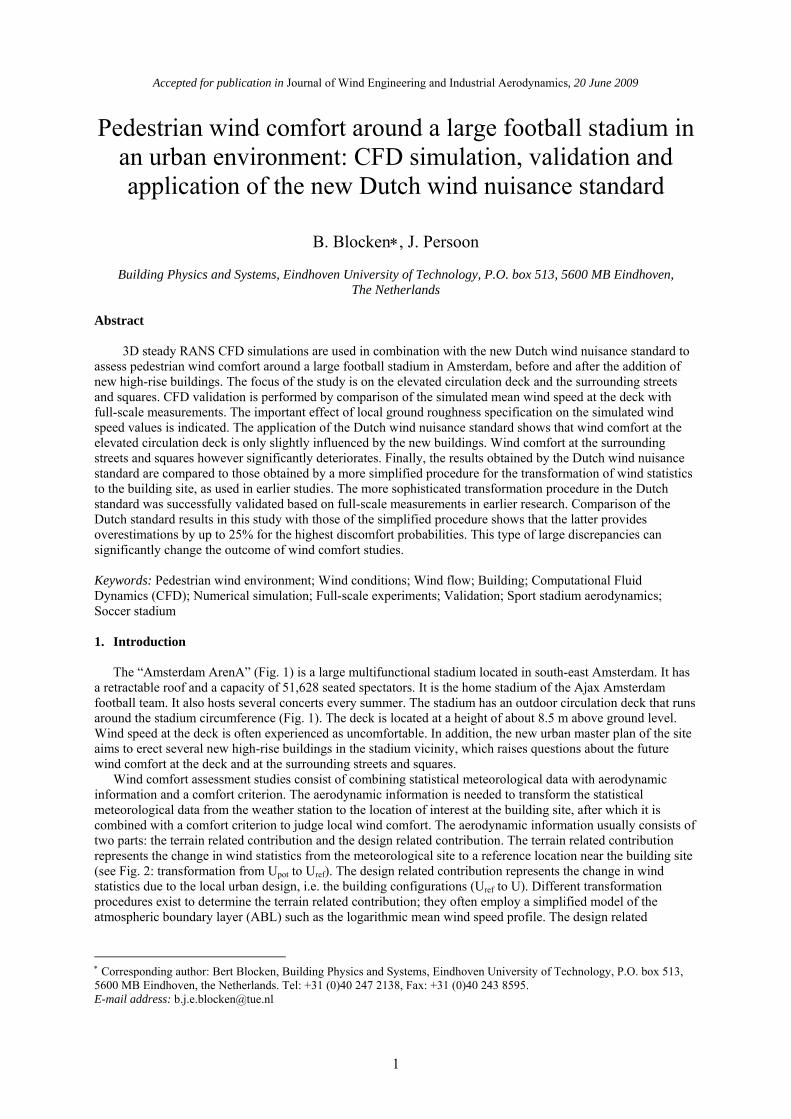
Fig. 17a presents contours of U/Uref,60 in a horizontal plane at 2 m above the deck, for the current situation
and for wind direction 240°, which is close to the prevailing SW wind direction. Note that U/Uref,60 is different from U/Uref,num. The latter is converted to the former by their relation as obtained from the CFD results. U/Uref,60 is the parameter that is needed as input for wind comfort assessment in the next section. A large part of the wind circulating over the deck results from the downflow of air along the windward stadium facade. A large region with high amplification factors exists at the north-west and north side of the deck. High amplification factors also occur in three of the gates (west, south and east gate), and in the vicinity of the gates. Amplification factors in the upstream stagnation region and in the wake are low. Figure 17b illustrates only a few changes in U/Uref,60 in the situation with the newly planned buildings. The reason is twofold: (1) the stadium is located in the wake of the newly added buildings for WSW wind; and (2) the main increase in pedestrian-level wind speed due to the new buildings occurs at street level, which is about 8.5 m below the deck.
Figure 18a illustrates U/Uref,60 at the surrounding streets and squares for the current situation and for wind direction 240°. High amplification factors are present near the corners of the high-rise buildings that are located at the WSW part of the site and between these buildings. Apart from the NW side, only rather low amplification factors occur in the immediate vicinity of the stadium. Figure 18b shows that while the new low-rise construction west of the stadium creates some additional shelter, the high-rise tower building (150 m) introduces corner streams with high amplification factors that extend to the stadium entrance. Note that the amplification factors in Fig. 14b-c are different from those in Fig. 18b, because the reference wind speed values are different (Uref,num on top of the ABN-Amro tower versus Uref,60 from the logarithmic inlet profile). 8. Comfort assessment by the Dutch wind nuisance standard
NPR 6097 provides the wind statistics at a height of 60 m at the building site. Figure 19 shows that the
prevailing wind direction is SW. The wind statistics are combined with the CFD amplification factors U/Uref,60 to determine the exceedence probabilities Pθ of the 5 m/s threshold value for each wind direction. Summing for the twelve wind direction sectors yields the total exceedence probability P.
Figs. 17c and d display P at the deck. The similarity with Fig. 17a and b demonstrates the dominant contribution of SW winds. The resulting quality classes are shown in Fig. 17e and f, which are combined with Table 1 to judge the wind climate. The deck is used for traversing and strolling. For traversing, the wind climate in quality class D is moderate, while it is good for classes A – C. For strolling, the wind climate in quality class D is poor, while it is moderate for class C and good for classes A and B. The newly added buildings appear to slightly improve rather than to deteriorate the wind climate, for the reasons mentioned earlier.
Fig. 18c and d display P at the surrounding streets and squares. While the addition of the new buildings decreases P at some locations, it firmly increases the values around the new tower building and along the west side of the stadium. Fig. 18e and f indicate that a larger part of the area around the stadium becomes a class B or class C area, and that the area directly north of the new tower building switches from class A to class C. While

9
class A indicates a good wind climate for traversing, strolling and sitting, class C is moderate for strolling and poor for sitting. 9. Dutch wind nuisance standard versus simplified procedure
The results by the Dutch standard are compared with those obtained by the more simplified procedure
described in section 2. For comparison purposes, in both procedures, the same comfort criterion and the same y0,DAV values (Fig. 6) are used. Table 2 summarizes the similarities and the differences between the two procedures. The two differences are the way in which the wind statistics are selected and the way in which they are transformed to the building site (i.e. the “meteorological data” and the “terrain related contribution”). In the Dutch standard, these tasks are taken care of by the more advanced and verified NPR 6097 procedure described in section 3. In the simplified procedure, the wind statistics from the nearest meteorological station are selected (no interpolation between stations). In this case, this is Schiphol International Airport, which is about 10 km west of the stadium site. These data are transformed to the building site by the terrain related contribution as determined by Eqs. (2-3), in which the y0,DAV values from Fig. 6 are used. These are referred to as “best estimates for y0,DAV”. Fig. 20a compares both procedures in terms of the exceedence probability P along the four lines at the deck (Fig. 10). The simplified procedure provides a significant overestimation of P compared to the NPR procedure, by up to 25% for the highest discomfort probabilities. Note that the NPR procedure has been verified in the past, as described in section 3, while this is not the case for the simplified procedure.
Estimating the most appropriate y0,DAV values from the updated roughness classification (Wieringa 1992) is not easy. It is not that difficult to be one class off. The influence of selecting an y0,DAV value from a higher or from a lower class is investigated. Therefore, two additional calculations are performed with the simplified procedure. In the first, the y0,DAV values are shifted up one class for every wind direction sector (one class rougher than the “best estimate” in Fig. 6). This means that the values 0.5 m and 1 m are replaced by 1 m and 2 m, respectively. In the second calculation, the values are shifted down one class (smoother than “best estimate”): 0.5 and 1 m are replaced by 0.25 m and 0.5 m, respectively. These different values are used to determine new terrain related contributions (Eqs. 2-3). Strictly, also new CFD simulations with inlet profiles based on the new y0,DAV values should be performed, resulting in new U/Uref,60 values to be used in both the assessment by the Dutch standard and by the simplified procedure. Since this will change P in the same way for both procedures, new CFD simulations have not been performed here. Fig. 20c shows that even when all y0,DAV values are taken one class higher than the “best estimate”, this procedure still provides a small overestimation compared to the NPR procedure. Given the proximity of the meteorological station to the site, these differences are attributed to the different transformation procedure, which includes the differences between y0,NPR and y0,DAV. It appears that the detailed regional aerodynamic roughness y0,NPR that is calculated and taken into account in NPR 6097 is considerably higher than the “best estimate” y0,DAV value from Fig. 6. 10. Discussion
Some limitations and uncertainties of this study are mentioned:
• Grid sensitivity analysis and validation have not been performed for the surrounding streets and squares of the stadium, at which the grid resolution is considerably lower than at the deck. On the other hand, the geometrical complexity is also lower at these locations.
• The local ground roughness specification in the CFD simulations has a negligible influence on mean wind speed at the deck, but a significant influence on mean wind speed at some locations at the streets and squares. For this study, the values kS = 0.6 m and CS = 0.5, corresponding to y0 = 0.03 m, have been selected for the simulations. Of all values in the updated Davenport roughness classification, y0 = 0.03 m is considered the best choice to represent the local ground roughness of the ensemble of streets and squares which include isolated objects such as local vegetation, benches, sculptures, etc. Nevertheless, the sensitivity of mean wind speed to local ground roughness contributes to the uncertainty of the wind comfort assessment results at the streets and squares, which should be interpreted qualitatively, rather than quantitatively.
• Horizontal homogeneity was good for the mean wind speed profile, but not for the turbulent kinetic energy profile. Nevertheless, a good agreement with the measurements has been obtained. Further research is needed to investigate the influence of inlet turbulent kinetic energy on mean wind speed amplification factors.
Concerning the comparison between the Dutch standard and the simplified procedure, two remarks are made: • The differences between both procedures are large and can significantly change the outcome of wind comfort
studies. This stresses the importance of improved and verified transformation procedures (meteorological data and terrain related contribution) such as NPR 6097.

10
• The Netherlands have a very dense network of meteorological stations, which is advantageous for pedestrian wind comfort studies. In the simplified procedure, the Schiphol meteorological station has been used which is very close to the building site (10 km). Often however, the distance between building site and meteorological station will be larger, and this can yield additional errors by the simplified procedure. One of the main advantages of the Dutch standard NEN 8100 and the associated practice guideline NPR
6097 is that future wind comfort assessment studies in the Netherlands will all be performed based on the same set of meteorological data, with the same transformation procedure and with the same comfort criterion. In the past, different research institutes and consultancy agencies used different and often simplified transformation procedures (NEN 2006b), such as the one outlined in section 2. The comparison in section 9 has shown that this can lead to considerably different exceedence probabilities.
The Dutch practice guideline NPR 6097 is provided as a software tool by which the statistics of hourly mean wind speed at every location in the Netherlands can be obtained. The transformation procedure embedded in this tool calculates the regional aerodynamic roughness lengths y0,NPR at the building site, for every wind direction sector, based on a high-resolution roughness map. It uses these values for the transformation of the wind statistics to the building site. These y0,NPR values can unfortunately not be retrieved from NPR 6097. This is a bit unfortunate, because they should also be used in the expressions of the inlet profiles of the ABL for the CFD simulations that are performed by the user. The reason that these values are not made available might be the fact that in wind tunnel modelling, often only a few types of ABL are generated; e.g. smooth, rural and urban. Further research should address the associated errors. 11. Conclusions
3D steady RANS CFD simulations have been used in combination with the new Dutch wind nuisance
standard to assess pedestrian wind comfort around a large football stadium, before and after the addition of new high-rise buildings. The results have been compared with those obtained by a more simplified procedure for the transformation of wind statistics to the building site. The following conclusions are made: • CFD validation has been performed by comparison of the simulated mean wind speed at the deck with full-
scale measurements, and a good agreement has been obtained. • Selecting appropriate values of kS and CS for local ground roughness specification is difficult. The sensitivity
of mean wind speed to these values is small (4%) at the elevated circulation deck – because of its elevation above-ground level - but it is large (20-25%) at some positions at the surrounding streets and squares.
• The wind comfort at the deck is slightly improved by the addition of the new high-rise buildings. Wind comfort at the streets and squares significantly deteriorates near the new high-rise building tower and the stadium entrance.
• The transformation procedure in the new Dutch wind nuisance standard is more advanced than the simplified procedure and has been successfully verified in the past. When the same wind comfort study is performed with both procedures, large differences are obtained. The simplified procedure overestimates the Dutch standard results by up to 25% for the highest discomfort probabilities. These differences can significantly change the outcome of wind comfort studies and stress the importance of improved and verified transformation procedures such as NPR 6097.
• The new Dutch wind nuisance standard and the associated practice guideline NPR 6097 are considered very useful tools. However, the accuracy of wind comfort assessment studies with these tools might be increased if the regional aerodynamic roughness lengths y0,NPR, embedded in the NPR 6097 software, are be made available to the user to construct more appropriate ABL inlet profiles for CFD simulations or wind tunnel testing.
Acknowledgements
The measurements reported in this paper were supported by the Laboratory of the Unit Building Physics and Systems (BPS). Special thanks go to Ing. Jan Diepens, head of LBPS, and Wout van Bommel and GeertJan Maas, members of LBPS, for their important contribution. We also thank Ir. Twan van Hooff for his help during the measurements. We are grateful for the valuable discussions with Dr. Alan Huber, Dr. Jörg Franke and Ir. Arnaud Boland on ground surface roughness specification in Computational Wind Engineering. We also thank the anonymous reviewers for their valuable comments. Nomenclature

11
CS roughness constant (-) Cμ parameter in realizable k-ε model and constant in wall function for k (-) Iu longitudinal turbulence intensity (-) k turbulent kinetic energy (m2/s2) kS equivalent sand-grain roughness height (m) LD, WD, HD length, width, height of computational domain (m) P centre point of the wall-adjacent cell (-) P exceedence probability (-) u*
friction velocity associated with the ABL inlet profiles (m/s) U local wind speed (magnitude of 3D wind-velocity vector) (m/s) Uref reference wind speed (m/s) Uref,60 reference wind speed at 60 m height (m/s) Uref, meas measured reference wind speed (m/s) Uref,num numerical reference wind speed (m/s) Upot potential wind speed (at 10 m height with y0 = 0.03 m) (m/s) WG, HG width and height of gate (m) x, y, z Cartesian co-ordinates (m) yP distance from the centre point P of the wall-adjacent cell to the wall (m) y0 aerodynamic roughness length (m) y0,DAV aerodynamic roughness length from updated Davenport roughness classification (m) y0,NPR aerodynamic roughness length in NPR procedure (m)
γ total wind amplification factor (-) δavg average relative difference (-) ε turbulence dissipation rate (m2/s3) θ wind direction (° from North) κ von Karman constant (≈ 0.42) σu, σv, σw standard deviation of turbulent fluctuations in x, y, z direction (m/s) ABL Atmospheric Boundary Layer CFD Computational Fluid Dynamics NEN Dutch Normalisation Institute NPR Dutch Practice Guideline RANS Reynolds-Averaged-Navier-Stokes (equations) References Asami, Y., Iwasa, Y., Fukao, Y., Kawaguchi, A., Yoshida, M., Sanada, S., Fujii, K., and Members of AIJ. 1978.
Full-scale measurement of environmental wind on New-Shinjuku-Center—characteristics of wind in built-up area (part 2). Proc. Fifth Symp. Wind Effects on Structures, pp. 83–90.
Baskaran, A., Kashef, A. 1996. Investigation of air flow around buildings using computational fluid dynamics techniques. Eng. Struct. 18 (11), 861-873.
Bitsuamlak, G., Stathopoulos, T., Bedard, C. 2006. Effects of upstream two-dimensional hills on design wind loads: a computational approach. Wind Struct. 9(1), 37–58.
Blocken, B., Roels, S., Carmeliet, J. 2004. Modification of pedestrian wind comfort in the Silvertop Tower passages by an automatic control system. J. Wind Eng. Ind. Aerodyn. 92 (10), 849-873.
Blocken, B., Carmeliet, J., 2004. Pedestrian wind environment around buildings: Literature review and practical examples. J. Thermal Env. Build. Sci. 28(2), 107-159.
Blocken, B., Stathopoulos, T., Carmeliet, J., 2007a. CFD simulation of the atmospheric boundary layer: wall function problems. Atmos. Environ. 41 (2), 238-252.
Blocken. B., Carmeliet, J., and Stathopoulos, T., 2007b. CFD evaluation of the wind speed conditions in passages between buildings – effect of wall-function roughness modifications on the atmospheric boundary layer flow. J. Wind Eng. Ind. Aerodyn. 95 (9-11), 941-962.
Blocken, B., Carmeliet, J., 2008. Pedestrian wind conditions at outdoor platforms in a high-rise apartment building: generic sub-configuration validation, wind comfort assessment and uncertainty issues, Wind Struct. 11 (1), 51-70.
Bottema, M., 1993. Wind climate and urban geometry. PhD thesis, Eindhoven University of Technology, 212p. Bottema, M., 2000. A method for optimisation of wind discomfort criteria. Build. Environ. 35(1), 1-18.

12
Cebeci, T., Bradshaw, P. 1977. Momentum transfer in boundary layers, Hemisphere Publishing Corporation, New York.
Ferreira, A.D., Sousa, A.C.M., Viegas, D.X. 2002. Prediction of building interference effects on pedestrian level comfort. J. Wind Eng. Ind. Aerodyn. 90 (4-5), 305-319.
Fluent Inc., 2006. Fluent 6.3 User’s Guide. Fluent Inc., Lebanon. Franke, J., Hirsch, C., Jensen, A.G., Krüs, H.W., Schatzmann, M., Westbury, P.S., Miles, S.D., Wisse, J.A.,
Wright, N.G. 2004. Recommendations on the use of CFD in wind engineering. Proc. Int. Conf. Urban Wind Engineering and Building Aerodynamics, (Ed. van Beeck JPAJ), COST Action C14, Impact of Wind and Storm on City Life Built Environment, von Karman Institute, Sint-Genesius-Rode, Belgium, 5 - 7 May 2004.
Franke, J., Hellsten, A., Schlünzen, H., Carissimo, B., 2007. Best practice guideline for the CFD simulation of flows in the urban environment. COST Action 732: Quality Assurance and Improvement of Microscale Meteorological Models.
Gadilhe, A., Janvier, L., Barnaud, G. 1993. Numerical and experimental modelling of the three-dimensional turbulent wind flow through an urban square. J. Wind Eng. Ind. Aerodyn. 46-47, 755-763.
He, J., Song, C.C.S., 1999. Evaluation of pedestrian winds in urban area by numerical approach. J. Wind Eng. Ind. Aerodyn. 81, 295–309.
Hirsch, C., Bouffioux, V., Wilquem, F. 2002. CFD simulation of the impact of new buildings on wind comfort in an urban area. Workshop Proceedings, Cost Action C14, Impact of Wind and Storm on City Life and Built Environment, Nantes, France.
Launder, B.E., Spalding, D.B. 1974. The numerical computation of turbulent flows. Comput. Methods Appl. Mech. Eng. 3, pp. 269-289.
Metje, N., Sterling, M., Baker C.J., 2008. Pedestrian comfort using clothing values and body temperatures. J. Wind Eng. Ind. Aerodyn. 96(4), 412-435.
Miles, S.D., Westbury, P.S. 2002. Assessing CFD as a tool for practical wind engineering applications. Proc. Fifth UK Conf. Wind Engineering, September.
Mochida, A., Tominaga, Y., Murakami, S., Yoshie, R., Ishihara, T., Ooka, R. 2002. Comparison of various k–ε models and DSM applied to flow around a high-rise building—report on AIJ cooperative project for CFD prediction of wind environment. Wind Struct. 5 (2–4), 227–244.
Mochida, A., Lun, I.Y.F. 2008. Prediction of wind environment and thermal comfort at pedestrian level in urban area. J. Wind Eng. Ind. Aerodyn. 96(10-11): 1498-1527.
Murakami, S. 1990. Computational wind engineering. J. Wind Eng. Ind. Aerodyn. 36 (1), 517-538. NEN 2006a. Wind comfort and wind danger in the built environment, NEN 8100 (in Dutch) Dutch Standard. NEN 2006b. Application of mean hourly wind speed statistics for the Netherlands, NPR 6097:2006 (in Dutch).
Dutch Practice Guideline. Richards, P.J., Hoxey, R.P. 1993. Appropriate boundary conditions for computational wind engineering models
using the k-ε turbulence model. J. Wind Eng. Ind. Aerodyn. 46&47, 145-153. Richards, P.J., Mallison, G.D., McMillan, D., Li, Y.F., 2002a. Pedestrian level wind speeds in downtown
Auckland. Wind Struct. 5 (2-4), 151-164. Richards, P.J., Quinn, A.D., Parker, S., 2002b. A 6m cube in an atmospheric boundary layer flow. Part 2.
Computational solutions. Wind Struct. 5 (2–4), 177–192. Shih, T.H., Liou, W.W., Shabbir, A., Zhu, J., 1995. A new k-ε eddy-viscosity model for high Reynolds number turbulent flows – model development and validation. Comput. Fluids 24 (3), 227-238. Simiu, E., Scanlan, R.H., 1986. Wind effects on structures. An introduction to wind engineering. Second Edition,
John Wiley and Sons, New York. Stathopoulos, T., Baskaran, A. 1996. Computer simulation of wind environmental conditions around buildings.
Eng. Struct. 18 (11), 876–885. Stathopoulos, T. 2002. The numerical wind tunnel for industrial aerodynamics: real or virtual in the new
millennium? Wind Struct. 5 (2–4), 193–208. Stathopoulos, T. 2006. Pedestrian level winds and outdoor human comfort. J. Wind Eng. Ind. Aerodyn. 94 (11),
769-780. Takakura, S., Suyama, Y., Aoyama, M. 1993. Numerical simulation of flowfield around buildings in an urban
area. J. Wind Eng. Ind. Aerodyn. 46-47, 765-771. Tominaga, Y., Mochida, A., Yoshie, R., Kataoka, H., Nozu, T., Yoshikawa, M., Shirasawa, T. 2008. AIJ
guidelines for practical applications of CFD to pedestrian wind environment around buildings. J. Wind Eng. Ind. Aerodyn. 96(10-11), 1749-1761.
Verkaik, J.W., 2000. Evaluation of two gustiness models for exposure correction calculations. J. Appl. Meteorol. 39(9), 1613-1626.

13
Verkaik, J.W., 2006. On wind and roughness over land. PhD thesis. Wageningen University. The Netherlands, 123 p.
Westbury, P.S., Miles, S.D., Stathopoulos, T., 2002. CFD application on the evaluation of pedestrian-level winds. Workshop on Impact of Wind and Storm on City Life and Built Environment, Cost Action C14, CSTB, June 3–4, Nantes, France.
Wieringa, J. 1992. Updating the Davenport roughness classification. J. Wind Eng. Ind. Aerodyn. 41-44, 357-368. Willemsen, E., Wisse, J.A., 2002. Accuracy of assessment of wind speed in the built environment. J. Wind Eng.
Ind. Aerodyn. 90, 1183-1190. Willemsen, E., Wisse, J.A., 2007. Design for wind comfort in The Netherlands: Procedures, criteria and open
research issues. J. Wind Eng. Ind. Aerodyn. 95 (9-11), 1541-1550. Wisse, J.A., Willemsen, E., 2003. Standardization of wind comfort evaluation in the Netherlands. 11th Int. Conf.
Wind Eng. (11ICWE), Lubbock, Texas. Wisse, J.A., Verkaik, J.W., Willemsen, E. 2007. Climatology aspects of a wind comfort code, 12th Int. Conf.
Wind Eng. (12ICWE), Cairns, Australia. Yang, Y., Gu, M., Chen, S., Jin, X. 2009. New inflow boundary conditions for modelling the neutral equilibrium
atmospheric boundary layer in computational wind engineering. J. Wind Eng. Ind. Aerodyn. 97(2), 88-95. Yoshida, M., Sanada, S., Fujii, K., Asami, Y., Iwasa, Y., Fukao, Y., Kawaguchi, A., and Members of AIJ. 1978.
Full-scale measurement of environmental wind on New-Shinjuku-Center—characteristics of wind in built-up area (part 1). Proc. Fifth Symp. Wind Effects on Structures, pp. 75–82.
Yoshie, R., Mochida, A., Tominaga, Y., Kataoka, H., Harimoto, K., Nozu, T., Shirasawa, T. 2007. Cooperative project for CFD prediction of pedestrian wind environment in the Architectural Institute of Japan. J. Wind Eng. Ind. Aerodyn. 95 (9-11), 1551-1578.
14
FIGURE CAPTIONS
Fig. 1. Amsterdam ArenA football stadium. (a) View from south. The roof is open in this picture; (b) Cross-section with indication of relevant pedestrian-level heights.
Fig. 2. Schematic representation of the wind speed at the meteorological station (Upot), the reference wind speed at the building site (Uref) and the wind speed at the location of interest (U).

15
Fig. 3. Stadium geometry: (a) horizontal cross-section AA’. The grey area is the ArenA deck. The arrows indicate the four gates. (b-c) Vertical cross-sections ββ’ and σσ’. Dimensions in meter.
Fig. 4. (a) Aerial view of part of the deck; (b) Gate in the corner of the stadium circumference, connecting the stadium interior with the deck around the stadium.
16
Fig. 5. Football stadium and surrounding buildings in a 300 m radius around the stadium. Blocks in grey: current situation; blocks in white: newly planned buildings. The reference measurement position (ABN-Amro tower) and the maximum height of each building are indicated.

17
Fig. 6. Terrain surrounding the stadium with a radius of 10 km and estimated aerodynamic roughness lengths y0. The white square represents the computational domain used in this study.
Fig. 7. Measured wind velocity vectors for three wind directions: 210°, 345° and 60°.

18
Fig. 8. Part of computational grid: (a) current situation; (b) situation with addition of newly planned buildings.

19
Fig. 9. Details of computational grid: (a,c) View from deck at gate in stadium corner; (b,d) Part of deck.
Fig. 10. Position of lines 1-4 at the deck for grid-sensitivity analysis. Dimensions in meter.

20
a b
0
0.1
0.2
0.3
0.4
0.5
0.6
0 0.1 0.2 0.3 0.4 0.5 0.6
U/Uref basic [-]
U/U
refcoars
e[-
]
δavg = 20 % 1:1
0
0.1
0.2
0.3
0.4
0.5
0.6
0 0.1 0.2 0.3 0.4 0.5 0.6
U/Uref basic [-]U
/Ure
ffine
[-]
δavg = 2 % 1:1
U/U basic [-]ref,numU/U basic [-]ref,num
U/U
coars
e[-
]re
f,num
U/U
fine
[-]
ref,num
Fig. 11. Results of grid-sensitivity analysis for the grid of the current situation, for SW wind. (a) Comparison between U/Uref,num along lines 1-4 (see Fig. 10) on coarse and basic grid. (b) Same for fine and basic grid.
Fig. 12. Division of the bottom of the computational domain into two different zones for roughness specification. Dimensions in meter.

21
0
40
80
120
160
200
240
0 4 8 12 16
U (m/s), k (m2/s
2)
y(m
)
0
40
80
120
160
200
240
0 4 8 12 16
U (m/s), k (m2/s
2)
y(m
) U
U
k
k
y = 0.5 m0 y = 1 m0
inlet (x = 0 m)incident (x = 1050 m)
inlet (x = 0 m)incident (x = 1050 m)
a b
Fig. 13. Inlet and incident profiles of mean wind speed and turbulent kinetic energy in an empty computational domain illustrating the degree of horizontal (in)homogeneity for (a) y0 = 0.5 m and (b) y0 = 1 m.

22
Fig. 14. Sensitivity of amplification factors U/Uref,num to local ground roughness specification by kS and CS for θ = 240°. (a) Two lines at pedestrian level along which results are given; (b) results along line AB; (c) results along line CD.

23
Fig. 15. Comparison of experimental (bold) and numerical (italics) results at the deck for two wind directions. Note: vectors are not to scale and only indicate local wind direction.
0
0.2
0.4
0.6
0.8
1
0 0.2 0.4 0.6 0.8 1
U/Uref measurement [-]
U/U
refsim
ula
tion
[-]
�avg = 12 %
-10%
+10%
1:1
Fig. 16. Comparison between numerical and experimental amplification factors at the deck.

24
Fig. 17. (a-b) Amplification factor U/Uref,60; (c-d) exceedence probability P; and (e-f) quality class. All values are taken in a horizontal plane at 2 m above the deck. Left: current situation; right: situation with newly planned buildings.

25
Fig. 18. (a-b) Amplification factor U/Uref,60; (c-d) exceedence probability P; and (e-f) quality class. All values are taken in a horizontal plane at 2 m above ground-level. Left: current situation; right: situation with newly planned buildings.

26
Fig. 19. Wind direction statistics (60 m height) obtained from NPR 6097 at the location of the building site.
0
4
8
12
16
20
24
28
0 4 8 12 16 20 24 28
P (NPR 6097) [%]
P(y
0-e
stim
ate
)[%
]
δavg = 58 %
0
4
8
12
16
20
24
28
0 4 8 12 16 20 24 28
P (NPR 6097) [%]
P(y
0lo
we
rcla
ss)
[%]x
x
δavg = 126 %
0
4
8
12
16
20
24
28
0 4 8 12 16 20 24 28
P (NPR 6097) [%]
P(y
0h
igh
er
cla
ss)
[%]
xx δavg = 33 %
a b
c
P(y
hig
her
cla
ss)
[%]
0,D
AV
P(y
low
er
cla
ss)
[%]
0,D
AV
P(y
estim
ate
)[%
]0
,DA
V
Fig. 20. Comparison of exceedence probabilities at the deck obtained with the Dutch standard (NPR) versus the more simplified procedure: (a) with “best estimate” for y0,DAV; (b) Same, for y0,DAV one class lower than “best estimate”; (c) Same, for y0,DAV one class higher than “best estimate”.