
Pedestrian Safety Engineering and ITS-Based ... · E-Mail: [email protected]. Executive...
117
Pedestrian Safety Engineering and ITS-Based Countermeasures Program for Reducing Pedestrian Fatalities, Injury Conflicts, and Other Surrogate Measures Final System Impact Report Contract No.: DTFH61-96-C-00098 Task No.: 9842 Submitted to United States Department of Transportation Submitted by Science Applications International Corporation (SAIC) January 30, 2009
Transcript of Pedestrian Safety Engineering and ITS-Based ... · E-Mail: [email protected]. Executive...

Pedestrian Safety Engineering and ITS-Based Countermeasures Program for Reducing Pedestrian
Fatalities, Injury Conflicts, and Other Surrogate Measures Final System Impact Report
Contract No.: DTFH61-96-C-00098 Task No.: 9842
Submitted to
United States Department of Transportation
Submitted by Science Applications International Corporation (SAIC)
January 30, 2009

ii
THIS PAGE INTENTIONALLY LEFT BLANK.

iii
1. Report No.
2. Government Accession No. 3. Recipient’s Catalog No.
5. Report Date January 30, 2009
4. Title and Subtitle: Pedestrian Safety and ITS-Based Countermeasures Program for Reducing Pedestrian Fatalities, Injury Conflicts, and Other Surrogate Measures Draft Zone/Area-Wide Evaluation Technical Memorandum 6. Performing Organization Code
7. Authors: K. Pécheux (SAIC); J. Bauer (SAIC); P. McLeod (Sprinkle Consulting, Inc.)
8. Performing Organization Report No. 10. Work Unit No. (TRAIS)
9. Performing Organization Name and Address: Science Applications International Corporation (SAIC) 1710 SAIC Drive, M/S T1-12-3 McLean, VA 22102 Sprinkle Consulting, Inc. 18115 US Highway 41 North, Suite 600 Lutz, FL 33549
11. Contract or Grant No. DTFH61-96-C-00098; Task 9842
13. Type of Report and Period Covered 12. Sponsoring Agency Name and Address: United States Department of Transportation ITS Joint Program Office, HVH-1 400 7th Street SW Washington, DC 20590
14. Sponsoring Agency Code HOIT-1
15. Supplementary Notes Tamara Redmon and Gabe Rousseau served as COTRs on this project. Morris Oliver served as COTR on the San Francisco Deployment 16. Abstract FHWA awarded three cooperative agreements to Las Vegas, NV; Miami-Dade, FL; and San Francisco, CA to demonstrate and evaluate the effectiveness of a combined pedestrian safety engineering and intelligent transportation systems (ITS)-based area-wide countermeasures program for reducing pedestrian fatalities, injuries, conflicts, and other surrogate measures of safety. Each of the field teams conducted two-phase studies, which included self-evaluations of the pedestrian countermeasures that were ultimately selected and deployed. The objectives of the evaluations were to assess the safety and mobility impacts of the pedestrian countermeasures deployed through the collection and analysis of quantitative data. A wide range of data was collected. Data included safety surrogate measures of effectiveness (MOEs) (e.g., driver and pedestrian behavioral data), driver mobility MOEs (e.g., travel times and speeds along corridors), and pedestrian mobility MOEs (e.g., average pedestrian delays). FHWA also sponsored an independent national evaluation of the countermeasures as well as a cross-cutting study of the teams’ findings. This report presents and discusses the evaluation results for 18 pedestrian safety countermeasures (or combination of countermeasures) and contains cross-cutting analyses, where possible, of those countermeasures that were deployed by more than one of the field teams. Lessons learned by the field teams throughout the course of the project are also synthesized and presented herein. Overall, the implementation and evaluation of a comprehensive pedestrian safety program proved to be a very challenging undertaking for each of the three field teams involved. There were many lessons learned over the course of the more than 6-year project, ranging from assembling and maintaining communications with a diverse set of project partners, to countermeasure selection and procurement, to the details associated with the successful application of particular countermeasures. The quantitative results are fairly mixed and in some cases inconsistent. Nonetheless, there were many notable and promising findings from the field tests and evaluations that might be applied by other jurisdictions in their efforts to improve the safety of pedestrians. 17. Key Words Pedestrian; Safety; ITS, Countermeasures; Surrogates; Injuries; Crashes; Vehicle; Conflicts; Speed; Delay; Customer; Satisfaction; National Test, Evaluation
18. Distribution Statement No restrictions. This document is available to the public from: The National Technical Information Service, Springfield, VA 22161.
19. Security Classif. (of this report) Unclassified
20. Security Classif. (of this page) Unclassified
21.No of Pages 117
22. Price N/A
Form DOT F1700.7 Reproduction of completed page authorized.

iv
NOTICE
This document is disseminated under the sponsorship of the Department of Transportation in the interest of information exchange. The United States
Government assumes no liability for its contents or use thereof.
This report does not constitute a standard, specification, or regulation.
The United States Government does not endorse products or manufacturers. Trade or manufacturers' names appear herein only because they are considered essential to the object of
this document.
NOTICE
For more information on this project please contact:
Kelley Klaver Pecheux, Ph.D. Science Applications International Corporation
1710 SAIC Drive, M/S T1-12-3 McLean, VA 22102
Phone: 703-676-2385 Fax: 703-676-2432
E-Mail: [email protected]

Executive Summary January 2009
v
Executive Summary In the spring of 2001, the Federal Highway Administration (FHWA) issued a Request for Applications (RFA) to select one or more local jurisdictions to demonstrate and evaluate the effectiveness of a comprehensive pedestrian safety countermeasures program. As a result, FHWA awarded three cooperative agreements to the following locations: Las Vegas, Nevada; Miami-Dade County, Florida; and San Francisco, California. The three study teams were charged with demonstrating and evaluating the effectiveness of a combined pedestrian safety engineering and intelligent transportation systems (ITS)-based area-wide countermeasures program for reducing pedestrian fatalities, injuries, conflicts, and other surrogate measures of safety.
Each of the field teams conducted two-phase studies. Phase I involved a detailed analysis of pedestrian crashes, the selection of appropriate countermeasures, the development of implementation and evaluation plans, and collection and analysis of baseline data. Phase II involved the actual implementation and assessment of the impacts of the countermeasures identified in Phase I. The project included self-evaluations conducted by each of the field teams, as well as an independent national evaluation and cross-cutting study conducted by an independent contractor.
As a result of the pedestrian safety analyses conducted in Phase I, each team selected a number of pedestrian safety countermeasures for deployment. Throughout the project, some of the selected countermeasures changed due to issues with vendors, procurement, or approval from location jurisdictions to install the countermeasures. Nevertheless, in the end, a wide range of traditional and ITS-based countermeasures were deployed at a large number of sites in the three locations.
EVALUATION OBJECTIVES The objectives of the evaluations were to assess the safety and mobility impacts of the pedestrian safety countermeasures selected for deployment. The evaluations involved collecting and analyzing quantitative data related to the safety and mobility impacts of the countermeasures.
The field teams collected and compared baseline and post-deployment data at the sites where countermeasures were deployed. A wide range of data was collected, depending on the countermeasures being deployed. Data collected included those associated with safety surrogate measures of effectiveness (MOEs) (e.g., driver and pedestrian behavioral data), driver mobility MOEs (e.g., travel times and speeds along corridors), and pedestrian mobility MOEs (e.g., pedestrian delays).
This report brings together the findings from the self-evaluations and contains cross-cutting analyses, where possible, of those countermeasures that were deployed by more than one of the field teams. Lessons learned by the field teams throughout the course of the project are also synthesized and presented herein.
RESULTS This report presents and discusses the evaluation results for 18 pedestrian safety countermeasures (or combination of countermeasures). Ten of the 18 countermeasures were deployed by more than one of the field teams, and the remaining seven countermeasures were deployed by only one of the three field teams. For the purposes of presenting and discussing the results, the countermeasures were grouped into the following six categories:
Executive Summary January 2009
vi
• Static signs • Active signs • Pavement markings • Signals and signal timing • Physical separation • Lighting
The findings are fairly mixed and in some cases inconsistent; however, this is not surprising considering the wide range of countermeasures installed, the various pedestrian safety problems at hand, the diverse locations and study sites at which the countermeasures were installed, and the somewhat different approaches to data collection and evaluation used by the three field teams. These were studies conducted in the field with real-world variables that cannot be controlled. Nonetheless, there were many notable and promising findings from the field tests and evaluations. A summary of the findings is as follows:
STATIC SIGNS
• TURNING TRAFFIC YIELD TO PEDESTRIANS signs. Installed at eight sites across the three field test locations, driver yielding behavior was the primary MOE for assessing the effectiveness of these signs. While there were a few significant changes found across the eight sites, there were inconsistencies in what changes were found and at which sites. These findings limit the conclusions that can be made regarding the effectiveness of these signs.
• In-street pedestrian signs. Installed at nine sites across the three field deployment locations, in-street pedestrian crossings signs appear to be highly effective at increasing driver yielding to pedestrians. The location at the roadway centerline appears to capture drivers’ attention more effectively than roadside signs, as evidenced by large increases in driver yielding at all but one of the nine sites. However, all three study teams noted that while these signs were effective at changing driver behaviors, they had a very short lifespan at the many of the sites. These issues can be overcome in a number of ways, including:
Placing the signs on raised medians as opposed to at street level Placing only one sign at the crosswalk as opposed to using multiple signs on the
approach Avoiding use of the signs in locations with high truck or bus traffic Carefully considering turning movements and lane width when determining
locations for sign installation
• Pedestrian zone signs. Installed at one site in Miami, the results indicate that the countermeasure was not effective in reducing speed or increasing driver yielding / braking in the presence of pedestrians. The researchers have suggested that this ineffectiveness may be related to the low speeds observed prior to deployment, and therefore there was not much margin for improvement.
Executive Summary January 2009
vii
ACTIVE SIGNS
• NO TURN ON RED (NTOR) sign. Tested in Miami, and compared with both the static NTOR and the static conditional NTOR, the effectiveness of the electronic NTOR sign was assessed by observing driver violations of the NTOR restriction, right-turn drivers making complete stops, and pedestrian-vehicle conflicts. Use of the electronic NTOR sign resulted in the fewest turning violations (32 percent overall) of the three signs tested as well as the highest percentage of those violators that made a complete stop before violating the turn restriction. This sign may be especially effective in visually cluttered areas where motorists are less likely to see and respond to a static sign.
• Portable speed trailers. Installed in all three field locations, the primary MOE for assessing the effectiveness of speed trailers was average vehicle speed and driver yielding. The San Francisco team measured significant reductions in speed at their two test sites, while the Miami team did not. Significant increases in driver yielding at the San Francisco sites translated into decreases in pedestrian delays. There was an increase in driver braking mid-block in Miami, and no significant increase in driver yielding in Las Vegas. Based on these findings, it appears that the speed trailers can impact drivers’ speeds and possibly increase their awareness of the presence of pedestrians at these locations.
PAVEMENT MARKINGS
• High visibility crosswalks. Tested at three locations in Las Vegas, there were no significant increases in driver yielding at any of the sites, and yielding distance results were inconsistent across the sites. There were significant reductions in drivers blocking the crosswalk at one of the sites. The results showed that high visibility crosswalks do not appear to be effective in changing driver behaviors in the vicinity of the crosswalks. This result could be due in part to the fact that the crosswalk markings deteriorated in a matter of weeks as a result of the heat causing a release of oils in the pavement.
• Advance stop lines. Installed at two locations in San Francisco, there were no significant changes in driver yielding, vehicle stop position, or pedestrian-vehicle conflicts at either site after installation of the advance stop lines. Based on these results, it appears that advance stop lines had no impacts on driver behavior or pedestrian safety.
• LOOK pavement stencils. Installed at four sites in San Francisco, there were few impacts on pedestrian looking behaviors and no impact on pedestrian-vehicle conflicts. Although the “LOOK” stencil markings are one of the least expensive countermeasures tested, the results indicate that this is not an effective countermeasure. Additionally, the San Francisco team noted that they were highly susceptible to fading and blemishes (similar to the high visibility crosswalk treatments in Las Vegas).
SIGNALS AND SIGNAL TIMING
• Pedestrian countdown signals. The findings from the Miami sites strongly point to overall increases in safe pedestrian behavior as a result of the pedestrian countdown signals, with significant and consistent positive results for all three critical MOEs: call button pressing, pedestrians in the crosswalk at the end of flashing DON’T WALK, and pedestrian signal violations. The results from the Las Vegas study team, however, were

Executive Summary January 2009
viii
mixed, possibly due to signal timing issues at the intersections. The Las Vegas team also found a large increase in the percent of pedestrians that looked before crossing the street, which may have resulted from the animated eyes display on the countdown signals installed in Las Vegas.
• Call buttons that confirm the press. Installed in both Miami and Las Vegas at a total of three intersections, call buttons that confirm the press show a fairly strong and consistent positive impact on pedestrian safety in terms of increasing use of the call buttons and, in turn, reducing pedestrian violations and pedestrians trapped in the roadway. Call button presses increased significantly and to above 50 percent at both Miami sites, and pedestrian signal violations decreased at all three sites (however, overall pedestrian signal violations remained above 50 percent at both Miami sites). It was, however, difficult to see the LED light in bright Florida sunlight, making the auditory feedback more critical to the efficacy of the device at the Miami sites.
• Automated pedestrian detection (to activate or extend pedestrian crossing phase). Installed in both San Francisco and Miami, the only significant finding was a 9 percent reduction in the percentage of pedestrians trapped in the roadway at the Miami site. While these results suggests that pedestrians may have been making safer crossings, there were no measurable impacts of the pedestrian detection systems on pedestrian clearance (those clearing before the end of the WALK or clearance phases) or conflicts with motor vehicles (which were generally low to begin with). The San Francisco team noted that the technology appeared to be a promising, but needed further testing and refinement.
• Activated flashing beacons. There were some clear increases in pedestrian safety where the activated flashing beacons were installed in San Francisco. There was a significant increase in driver yielding, corresponding decreases in pedestrian delay, and decreases in conflicts at both sites. There was an increase in yielding distance at one of the intersections in San Francisco and a decrease in pedestrians trapped at the other intersection. At the Las Vegas site, driver yielding did not change significantly, but this could have been a result of driver yielding improvements due to the installation of other countermeasures in earlier stages. For those drivers who yielded, yielding distances increased.
• Rectangular Rapid Flashing Beacons (RRFB). The results of the study showed clear safety benefits associated with the introduction of the pedestrian activated RRFB in Miami. After installation of the RRFBs, driver yielding to both staged pedestrians and local resident crossings increased at both deployment sites, the percentage of pedestrians trapped in the middle of the road decreased at one of the sites, and evasive conflicts decreased at both sites. At one of the sites, the number of conflicts decreased each time the RRFB treatment was introduced and increased each time it was removed. At the other site, the decrease in conflicts after the RRFB was introduced was maintained each time it was removed. This may have represented some type of learning effect on the part of motorists.
• Leading pedestrian interval. Installed at four sites in San Francisco and two sites in Miami, the findings indicate that the countermeasure was effective at increasing left-turn driver yielding to pedestrians in the crosswalk, although the magnitude of left-turn yielding was smaller in San Francisco than in Miami (likely because left-turn driver yielding was already very high in San Francisco and therefore there was less opportunity
Executive Summary January 2009
ix
for improvement). This effect does not appear to apply to right-turn driver yielding possibly due to the high frequency of right-turners who do not stop at a red light before turning. The Miami team also measured significant increases in pedestrian call button pushes and the number of pedestrians that start to cross at the beginning of the cycle.
• Prohibition of permissive left turns. Installed at one site in Miami, the data indicate that this countermeasure may be an effective way to improve pedestrian safety at intersections by reducing pedestrian-vehicle conflicts; however, the findings also indicate that there was a substantial portion of left-turners that violated the red signal. While this countermeasure has potential for increasing pedestrian safety, the signal configuration should be taken into consideration in order to mitigate left-turners violating the signal.
PHYSICAL SEPARATION
• Median refuge islands. Based on the results, it appears that the installation of a median refuge island at a mid-block location was effective in increasing driver yielding to pedestrians and reducing pedestrian delay, while the median refuge islands at the signalized intersections in San Francisco appear to be less effective at altering driver and pedestrian behaviors.
• Danish offset (in combination with high-visibility crosswalk, advance yield markings, and YIELD HERE TO PEDESTRIANS signs). Installed at two sites in Las Vegas (at one mid-block location and at one signalized intersection), this combination of countermeasures appears to have led to an increase in safe pedestrian and driver behaviors. The Las Vegas team measured significant increases in driver yielding and diverted pedestrians as well as significant decreases in trapped pedestrians. Pedestrian delay was significantly reduced at the mid-block location where a designated crossing area had not previously existed, although pedestrian delay increased at signalized intersection. There was no significant impact on vehicle delay at Lake Mead even though there was an increase in yielding. While driver yielding did increase significantly at the two locations, only 40 percent of drivers yielded at the mid-block location after installation of the countermeasures, while 76 percent of drivers yielded at the signalized intersection after installation of the countermeasures. This could be a result of the location of the Danish offset, the type of Danish offset that was installed, and/or whether or not a crosswalk existed in the baseline condition. At the signalized intersection site, the Danish offset was made more visible with the use of bright yellow bollards and there was a crosswalk in the baseline condition. At the mid-block location, the Danish offset was perhaps less visible and was located where there was not previously a crosswalk. In addition, vehicle speed could also play a role in the results. At the midblock location, there was a posted speed limit of 45 mph, while the posted speed limit through the signalized intersection was 30 mph. Drivers may be more willing and able to yield on the lower speed roadway. In general, though, the suite of countermeasures appears to have made pedestrian crossings safer.
LIGHTING
• Dynamic lighting. The findings from the Las Vegas team that tested the impacts of dynamic lighting at a high-visibility crosswalk location suggest that dynamic lighting used with automatic pedestrian detection increases pedestrian safety. Driver yielding and

Executive Summary January 2009
x
pedestrian diversion increased significantly while the percent of trapped pedestrians significantly decreased. While driver yielding increased, its prevalence was still low at 35 percent. In Miami, the addition of dynamic lighting to a crosswalk that had a rectangular rapid flashing beacon did not appear to further improve driver yielding or pedestrian-vehicle conflicts. The Miami researchers suggested that this may have occurred because the dynamic lighting is not very noticeable in the presence of the highly intense flashing beacons.
LESSONS LEARNED Implementation and evaluation of the Pedestrian Safety Engineering and ITS-Based Countermeasures Program was challenging. The major steps in the project included:
• Establishing and maintaining a multi-agency pedestrian safety team to oversee and guide the project
• Identifying pedestrian safety and mobility problems, including potential contributing factors to crashes
• Selecting pedestrian safety countermeasures corresponding to the problems identified • Obtaining funding and support for pedestrian safety improvements • Procuring, deploying, and maintaining the countermeasures • Evaluating the effectiveness of the countermeasures
Each step of the project offered new challenges to the project partners that are presented here as lessons learned. The lessons learned include general lessons learned and countermeasure-specific lessons learned. General lessons learned include the following:
• Assemble a diverse set of project partners to address the range of issues that might arise during the study.
• Implement regular communication and participation mechanisms for project partners from project kick-off.
• Use a variety of methods/sources to understand problems and to determine causes of crashes at prominent pedestrian crash locations.
• Begin the program by implementing low-cost countermeasures for the greatest potential of widespread use.
• Pursue a variety of funding sources for the pedestrian safety program. • Do not underestimate the complexity of procurement. • Budget ample time for deployment and coordinate with the appropriate jurisdictions. • Consider how the timing of countermeasure deployment may impact the experimental
design and evaluation. • Consider the unique aspects of collecting and reducing pedestrian safety data.
Countermeasure-specific lessons learned include the following:
• Strategically place in-street pedestrian signs to reduce the chance of them being hit by vehicles and to maximize their effectiveness.
• Consider the technical issues surrounding the use of automated pedestrian detection and activated flashing beacons.

Executive Summary January 2009
xi
• Translate public service messages into multiple languages in order to conduct a successful outreach to non-English speaking populations.
• Be prepared to demonstrate to concerned traffic engineers that the electronic NTOR sign will not significantly disrupt traffic progression along a corridor. Work with the local electrical department and vendors to make sure everything is in place for success.
CONCLUSIONS Overall, the implementation and evaluation of a comprehensive pedestrian safety program proved to be a very challenging undertaking for each of the three field teams involved. There were many lessons learned over the course of the 6-year project, ranging from assembling and maintaining communications with a diverse set of project partners, to countermeasure selection and procurement, to the details associated with the successful application of particular countermeasures.
For the purposes of this summary and cross-cutting analysis report, the 18 countermeasures were classified according their effectiveness in producing measurable changes in driver and/or pedestrian behaviors as hypothesized for the evaluations. While it is recognized that other factors can certainly impact overall countermeasure effectiveness, the classification of the countermeasures in this way was done in an attempt to give the reader an idea as to which countermeasures may have the most promise in ultimately impacting pedestrian safety and which others may not. Countermeasures were classified in one of the following four categories: high effectiveness, moderate effectiveness, low effectiveness, or effectiveness depends on application.
Seven of the countermeasures were classified as being highly effective in impacting behaviors related to pedestrian safety. These seven countermeasures cover a range of applications, including signal timing, active and in-street signs, call buttons that provide feedback, and roadway design elements. Each of the countermeasures offers something unique over traditional countermeasures, whether it provides additional information to pedestrians, is highly visible to pedestrians or motorists, or gives an advantage to pedestrians when crossing. Therefore, it is not surprising that these countermeasures resulted in the most positive impacts. They include:
• Leading pedestrian interval • Pedestrian countdown signals • In-street pedestrian signs • Activated flashing beacons • Rectangular rapid flashing beacons (RRFB) • Call buttons that confirm the press • Danish offset combined with high-visibility crosswalk, advance yield markings, and
YIELD HERE TO PEDESTRIANS signs
Four of the countermeasures were classified as being moderately effective in impacting behaviors related to pedestrian safety. These countermeasures were the most difficult to classify in that there were positive findings, yet the findings were either mixed, inconsistent, or inconclusive either within or across the field locations. They include:
• Electronic No Turn on Red (NTOR) sign • Prohibition of permissive left turns • Portable speed trailers

Executive Summary January 2009
xii
• Automated pedestrian detection (to activate or extend pedestrian crossing phase)
Five of the countermeasures were classified as having low effectiveness in impacting behaviors related to pedestrian safety. Three of these countermeasures were pavement markings and two of the countermeasures were static signs. These five countermeasures are static and it is not surprising that they did not produce more significant results when compared against the active and more innovative devices. The low effectiveness countermeasures include:
• High visibility crosswalks • Advance yield markings • LOOK pavement stencils • TURNING TRAFFIC YIELD TO PEDESTRIANS signs • Pedestrian zone signs
The effectiveness of two of the countermeasures seemed to depend mostly on the application, with positive impacts in one application and less positive impacts in another application. These countermeasures include:
• Median refuge island • Dynamic lighting
Table of Contents January 2009
xiii
Table of Contents
INTRODUCTION .......................................................................................................................................................1 PEDESTRIAN SAFETY COUNTERMEASURES UNDER INVESTIGATION ..........................................................................1 EVALUATION OF COUNTERMEASURES .......................................................................................................................3 PRESENTATION OF FINDINGS .....................................................................................................................................3
RESULTS.....................................................................................................................................................................4 STATIC SIGNS ............................................................................................................................................................4
TURNING TRAFFIC YIELD TO PEDESTRIANS Signs......................................................................................4 In-street Pedestrian Crossing Signs...................................................................................................................12 Pedestrian Zone Signs........................................................................................................................................17
ACTIVE SIGNS..........................................................................................................................................................18 NO TURN ON RED (NTOR) Signs ....................................................................................................................18 Portable Radar Speed Trailers ..........................................................................................................................22
PAVEMENT MARKINGS ............................................................................................................................................26 High Visibility Crosswalk ..................................................................................................................................27 Advanced Stop Lines ..........................................................................................................................................31 LOOK Pavement Stencils...................................................................................................................................33
SIGNALS AND SIGNAL TIMING .................................................................................................................................36 PEDESTRIAN COUNTDOWN SIGNALS........................................................................................................................36
Call Buttons that Confirm the Press ..................................................................................................................40 Automated Pedestrian Detection........................................................................................................................45 Activated Flashing Beacons...............................................................................................................................47 Rectangular Rapid Flashing Beacon .................................................................................................................56 Leading Pedestrian Interval (Pedestrian Head Start)........................................................................................60 Prohibition of Permissive Left Turns .................................................................................................................65
PHYSICAL SEPARATION ...........................................................................................................................................67 Median Refuge Islands.......................................................................................................................................68 Danish Offset, High-Visibility Crosswalk, Median Refuge, Advance Yield Markings, and Yield to Pedestrian Signs...................................................................................................................................................................71
LIGHTING.................................................................................................................................................................77 Dynamic Lighting...............................................................................................................................................77
LESSONS LEARNED...............................................................................................................................................81 GENERAL LESSONS LEARNED..................................................................................................................................81
Lesson #1—Assemble a Diverse Set of Project Partners to Address the Range of Issues That Might Arise During the Study ................................................................................................................................................81 Lesson #2—Implement Regular Communication and Participation Mechanisms for Project Partners from Project Kick-Off .................................................................................................................................................83 Lesson #3—Use a Variety of Methods/Sources to Understand Problems and to Determine Causes of Crashes at Prominent Pedestrian Crash Locations .........................................................................................................84 Lesson #4—Begin the Program by Implementing Low-cost Countermeasures for the Greatest Potential of Widespread Use .................................................................................................................................................85 Lesson #5—Pursue a Variety of Funding Sources for the Pedestrian Safety Program .....................................86 Lesson #6—Do Not Underestimate the Complexity of Procurement .................................................................87 Lesson #7—Budget Ample Time for Deployment and Coordinate with the Appropriate Jurisdictions .............87 Lesson #8—Consider How the Timing of Countermeasure Deployment May Impact the Experimental Design and Evaluation ...................................................................................................................................................88 Lesson #9—Consider the Unique Aspects of Collecting and Reducing Pedestrian Safety Data .......................89
COUNTERMEASURE-SPECIFIC LESSONS LEARNED ...................................................................................................91 Lesson #1—Strategically Place In-street Pedestrian Signs to Reduce the Chance of Them Being Hit by Vehicles and to Maximize Their Effectiveness ...................................................................................................91

Table of Contents January 2009
xiv
Lesson #2—Consider the Technical Issues Surrounding the Use of Automated Pedestrian Detection .............92 CONCLUSIONS........................................................................................................................................................94
HIGH EFFECTIVENESS..............................................................................................................................................94 MEDIUM EFFECTIVENESS ........................................................................................................................................96 LOW EFFECTIVENESS...............................................................................................................................................97 EFFECTIVENESS DEPENDS ON APPLICATION ............................................................................................................98
REFERENCES ..........................................................................................................................................................99

List of Figures January 2009
xv
List of Figures FIGURE 1. SIGNS USED IN LAS VEGAS AND SAN FRANCISCO (LEFT) AND SIGN USED IN MIAMI (RIGHT) ......................5 FIGURE 2. SIGN AT GUERRERO & 16TH IN SAN FRANCISCO ............................................................................................5 FIGURE 3. DRIVER YIELDING DISTANCES AT MISSION & AVALON................................................................................8 FIGURE 4. DRIVER YIELDING DISTANCES AT GUERRERO & 16TH ...................................................................................9 FIGURE 5. DRIVER YIELDING DISTANCES AT MISSION & OCEAN (SIGNIFICANT CHANGES) ..........................................9 FIGURE 6. DRIVER YIELDING DISTANCES AT MISSION & PERSIA (SIGNIFICANT CHANGES) ........................................10 FIGURE 7. IN-STREET PEDESTRIAN SIGN IN SAN FRANCISCO.......................................................................................12 FIGURE 8. IN-STREET PEDESTRIAN SIGNS IN SOUTH MIAMI BEACH.............................................................................13 FIGURE 9. IN-STREET SIGNS ALONG BONANZA BETWEEN D AND F STREETS IN LAS VEGAS........................................13 FIGURE 10. MODIFIED VERSION OF IN-STREET PEDESTRIAN SIGN INSTALLED ALONG TWAIN AVENUE IN LAS VEGAS
............................................................................................................................................................................14 FIGURE 11. YIELDING DISTANCES AT LAS VEGAS SITE BEFORE AND AFTER INSTALLATION OF IN-STREET PEDESTRIAN
SIGNS...................................................................................................................................................................16 FIGURE 12. MUTCD W11-2 PEDESTRIAN WARNING SIGN AND SUPPLEMENTAL DISTANCE PLAQUE .........................17 FIGURE 13. STATIC AND ACTIVE NTOR SIGNS TESTED IN MIAMI...............................................................................19 FIGURE 14. STOPPING BEHAVIOR OF DRIVER VIOLATORS AT MIAMI SITE ..................................................................21 FIGURE 15. PORTABLE RADAR SPEED TRAILERS (LEFT: SIGNS USED IN LAS VEGAS; RIGHT: SIGNS USED IN SAN
FRANCISCO).........................................................................................................................................................23 FIGURE 16. EXAMPLE OF HIGH-VISIBILITY CROSSWALKS TESTED IN LAS VEGAS .......................................................27 FIGURE 17. DISTRIBUTION OF DRIVER YIELDING DISTANCES AT MARYLAND PARKWAY & SIERRA VISTA ................30 FIGURE 18. DISTRIBUTION OF DRIVER YIELDING DISTANCES AT FLAMINGO & KOVAL ..............................................30 FIGURE 19. DISTRIBUTION OF DRIVER YIELDING DISTANCES AT LAKE MEAD & LAS VEGAS BOULEVARDS ..............31 FIGURE 20. ADVANCE STOP LINES TESTED IN SAN FRANCISCO ..................................................................................32 FIGURE 21. LOOK PAVEMENT STENCILS TESTED IN SAN FRANCISCO ........................................................................33 FIGURE 22. PEDESTRIAN COUNTDOWN SIGNAL WITH ANIMATED EYES ......................................................................36 FIGURE 23. CALL BUTTONS TESTED IN MIAMI ............................................................................................................40 FIGURE 24. CAMERA USED FOR AUTOMATED PEDESTRIAN DETECTION......................................................................45 FIGURE 25. OVERHEAD FLASHING BEACONS TESTED IN LAS VEGAS ..........................................................................48 FIGURE 26. ACTIVATED FLASHING BEACONS USED IN LAS VEGAS (LEFT) AND SAN FRANCISCO (RIGHT) .................48 FIGURE 27. IN-SURFACE (LEFT) AND ABOVE GROUND BOLLARD (RIGHT) SENSORS USED IN SAN FRANCICSO ..........48 FIGURE 28. DRIVER YIELDING AT 16TH & CAPP ...........................................................................................................52 FIGURE 29. DRIVER YIELDING AT MISSION & SANTA ROSA........................................................................................52 FIGURE 30. DRIVER YIELDING DISTANCES AT MARYLAND PARKWAY & DUMONT.....................................................53 FIGURE 31. DRIVER YIELDING DISTANCES AT 16TH & CAPP ........................................................................................54 FIGURE 32. DRIVER YIELDING DISTANCE AT MISSION & SANTA ROSA.......................................................................54 FIGURE 33. RRFB IN MIAMI........................................................................................................................................56 FIGURE 34. LEADING PEDESTRIAN INTERVAL..............................................................................................................61 FIGURE 35. STATIC SIGN SUPPORTING THE PROHIBITION OF PERMISSIVE LEFT TURNS ...............................................65 FIGURE 36. MEDIAN REFUGE ISLAND AT A SAN FRANCISCO INTERSECTION ...............................................................68 FIGURE 37. MEDIAN REFUGE ISLAND AT MID-BLOCK LOCATION IN LAS VEGAS ........................................................69 FIGURE 38. DANISH OFFSET AT MARYLAND PARKWAY AND DUMONT STREET ..........................................................71 FIGURE 39. LAKE MEAD BOULEVARD: BELMONT STREET TO MCCARRAN STREET ....................................................71 FIGURE 40. ADVANCE YIELD MARKINGS AND YIELD HERE TO PEDESTRIANS SIGN BEFORE DANISH OFFSET AT
MARYLAND PARKWAY AND DUMONT STREET ....................................................................................................72 FIGURE 41. ADVANCED YIELD MARKINGS INSTALLED AT LAKE MEAD BOULEVARD: BELMONT STREET TO
MCCARRAN STREET ............................................................................................................................................72 FIGURE 42. DRIVER YIELDING DISTANCES ON LAKE MEAD: BELMONT TO MCCARRAN .............................................76 FIGURE 43. DYNAMIC LIGHTING ON POLE IN LAS VEGAS............................................................................................77

List of Tables January 20009
xvi
List of Tables TABLE 1. PEDESTRIAN SAFETY COUNTERMEASURES SELECTED FOR DEPLOYMENT......................................................2 TABLE 2. TURNING TRAFFIC YIELD TO PEDESTRIANS SIGNS STUDY SITES ......................................................6 TABLE 3. MEASURES OF EFFECTIVENESS FOR TURNING TRAFFIC YIELD TO PEDESTRIANS SIGNS ...................6 TABLE 4. TURNING DRIVER YIELDING IN MIAMI...........................................................................................................7 TABLE 5. RIGHT-TURN DRIVER YIELDING IN LAS VEGAS..............................................................................................7 TABLE 6. RTOR DRIVERS THAT COME TO A COMPLETE STOP AT LAS VEGAS STUDY SITES ......................................10 TABLE 7. DRIVERS BLOCKING CROSSWALK AT LAS VEGAS STUDY SITES ..................................................................10 TABLE 8. PEDESTRIAN-VEHICLE CONFLICTS ...............................................................................................................11 TABLE 9. STUDY SITES FOR IN-STREET PEDESTRIAN CROSSING SIGNS........................................................................13 TABLE 10. MEASURES OF EFFECTIVENESS FOR IN-STREET PEDESTRIAN CROSSING SIGNS ..........................................14 TABLE 11. DRIVER YIELDING ......................................................................................................................................15 TABLE 12. PEDESTRIAN ZONE SIGN STUDY SITE .........................................................................................................17 TABLE 13. NO TURN ON RED SIGNS STUDY SITE.........................................................................................................19 TABLE 14. DRIVERS VIOLATING NTOR ......................................................................................................................20 TABLE 15. STOPPING BEHAVIOR OF DRIVER VIOLATORS MAKING RTOR ..................................................................21 TABLE 16. RTOR DRIVERS BLOCKING CROSSWALK....................................................................................................22 TABLE 17. PORTABLE RADAR SPEED TRAILER STUDY SITES ......................................................................................23 TABLE 18. MEASURES OF EFFECTIVENESS FOR PORTABLE RADAR SPEED TRAILERS ..................................................24 TABLE 19. VEHICLE SPEEDS ........................................................................................................................................24 TABLE 20. DRIVER BRAKING ON COLLINS AVENUE IN MIAMI ....................................................................................25 TABLE 21. DRIVER YIELDING ......................................................................................................................................25 TABLE 22. AVERAGE PEDESTRIAN DELAY ..................................................................................................................26 TABLE 23. HIGH VISIBILITY CROSSWALK STUDY SITES ..............................................................................................28 TABLE 24. TURNING DRIVER YIELDING TO PEDESTRIANS IN PARALLEL CROSSWALKS...............................................29 TABLE 25. DRIVERS BLOCKING CROSSWALK ..............................................................................................................29 TABLE 26. ADVANCE STOP LINE STUDY SITES............................................................................................................32 TABLE 27. LOOK PAVEMENT STENCILS STUDY SITES................................................................................................34 TABLE 28. PEDESTRIAN LOOKING BEHAVIOR..............................................................................................................35 TABLE 29. PEDESTRIAN COUNTDOWN SIGNALS STUDY SITES.....................................................................................37 TABLE 30. MEASURES OF EFFECTIVENESS FOR PEDESTRIAN COUNTDOWN SIGNALS ..................................................38 TABLE 31. CALL BUTTON PRESSES..............................................................................................................................38 TABLE 32. PEDESTRIANS IN THE CROSSWALK AFTER FLASHING DON’T WALK........................................................38 TABLE 33. PEDESTRIANS VIOLATING THE SIGNAL.......................................................................................................39 TABLE 34. PEDESTRIANS BEGINNING THEIR CROSSINGS DURING THE WALK.............................................................39 TABLE 35. PEDESTRIANS THAT LOOK FOR VEHICLES BEFORE CROSSING....................................................................39 TABLE 36. CALL BUTTONS THAT CONFIRM THE PRESS STUDY SITES ..........................................................................41 TABLE 37. MEASURES OF EFFECTIVENESS FOR CALL BUTTONS THAT CONFIRM THE PRESS .......................................41 TABLE 38. PERCENT OF SIGNAL CYCLES CALL BUTTON WAS PRESSED .......................................................................42 TABLE 39. PERCENT OF PEDESTRIANS VIOLATING SIGNAL .........................................................................................42 TABLE 40. PEDESTRIANS CROSSING DURING THE WALK PHASE ................................................................................43 TABLE 41. PEDESTRIANS TRAPPED IN THE ROADWAY.................................................................................................44 TABLE 42. AUTOMATED PEDESTRIAN DETECTION STUDY SITES.................................................................................45 TABLE 43. MEASURES OF EFFECTIVENESS FOR AUTOMATED PEDESTRIAN DETECTION ..............................................46 TABLE 44. PEDESTRIANS TRAPPED IN THE ROADWAY.................................................................................................47 TABLE 45. ACTIVATED FLASHING BEACONS STUDY SITES..........................................................................................49 TABLE 46. MEASURES OF EFFECTIVENESS FOR ACTIVATED FLASHING BEACONS .......................................................50 TABLE 47. DIVERTED PEDESTRIANS ............................................................................................................................51 TABLE 48. TRAPPED PEDESTRIANS..............................................................................................................................51 TABLE 49. DRIVERS YIELDING TO PEDESTRIANS.........................................................................................................52 TABLE 50. AVERAGE PEDESTRIAN DELAY ..................................................................................................................55 TABLE 51. AVERAGE VEHICLE DELAY .......................................................................................................................55 TABLE 52. PEDESTRIAN-VEHICLE CONFLICTS .............................................................................................................55

List of Tables January 20009
xvii
TABLE 53. RRFB STUDY SITES ...................................................................................................................................57 TABLE 54. MEASURES OF EFFECTIVENESS FOR ACTIVATED FLASHING BEACONS .......................................................57 TABLE 55. STAGED DAYTIME CROSSINGS ...................................................................................................................58 TABLE 56. STAGED NIGHTTIME CROSSINGS ................................................................................................................58 TABLE 57. RESIDENT CROSSINGS ................................................................................................................................59 TABLE 58. LEADING PEDESTRIAN INTERVAL STUDY SITES ..........................................................................................61 TABLE 59. MEASURES OF EFFECTIVENESS FOR LEADING PEDESTRIAN INTERVAL.......................................................62 TABLE 60. LEFT-TURN DRIVER YIELDING ...................................................................................................................63 TABLE 61. RIGHT-TURN DRIVER YIELDING .................................................................................................................64 TABLE 62. PEDESTRIANS PUSHING CALL BUTTON ......................................................................................................64 TABLE 63. PEDESTRIANS CROSSING DURING BEGINNING OF WALK CYCLE...............................................................65 TABLE 64. PROHIBITION OF PERMISSION LEFT TURNS STUDY SITE .............................................................................66 TABLE 65. PEDESTRIANS CROSSING DURING WALK ..................................................................................................67 TABLE 66. VEHICLES TURNING DURING PROTECTED LEFT-TURN PHASE.....................................................................67 TABLE 67. CONFLICTS .................................................................................................................................................67 TABLE 68. MEDIAN REFUGE ISLAND STUDY SITES......................................................................................................68 TABLE 69. MEASURES OF EFFECTIVENESS FOR MEDIAN REFUGE ISLANDS .................................................................69 TABLE 70. DRIVERS YIELDING TO PEDESTRIANS.........................................................................................................70 TABLE 71. AVERAGE PEDESTRIAN DELAY ..................................................................................................................70 TABLE 72. DANISH OFFSET STUDY SITES ....................................................................................................................73 TABLE 73. DIVERTED PEDESTRIANS ............................................................................................................................74 TABLE 74. PEDESTRIAN LOOKING BEHAVIOR..............................................................................................................74 TABLE 75. TRAPPED PEDESTRIANS..............................................................................................................................75 TABLE 76. DRIVERS YIELDING TO PEDESTRIANS.........................................................................................................75 TABLE 77. AVERAGE PEDESTRIAN DELAY ..................................................................................................................76 TABLE 78. DYNAMIC LIGHTING STUDY SITES .............................................................................................................78 TABLE 79. MEASURES OF EFFECTIVENESS FOR DYNAMIC LIGHTING...........................................................................79 TABLE 80. DRIVER YIELDING ......................................................................................................................................79 TABLE 81. DIVERTED PEDESTRIANS ............................................................................................................................80 TABLE 82. PEDESTRIANS TRAPPED IN THE ROADWAY.................................................................................................80 TABLE 83. COUNTERMEASURE-SPECIFIC LESSONS LEARNED ......................................................................................93

Abbreviations January 2009
xviii
Abbreviations ADA Americans with Disabilities Act
FHWA Federal Highway Administration
ITS Intelligent Transportation Systems
JPO Joint Program Office
LED Light-Emitting Diode
LPI Leading pedestrian interval
MOEs Measures of Effectiveness
NTOR No Turn on Red
RFA Request for Applications
RTOG Right Turn on Green
RTOR Right Turn on Red
USDOT United States Department of Transportation

Final System Impact Report January 2009
1
INTRODUCTION In the spring of 2001, the Federal Highway Administration (FHWA) issued a Request for Applications (RFA). The intent of the RFA was to select one or more local jurisdictions to demonstrate and evaluate the effectiveness of a comprehensive pedestrian safety countermeasures program for reducing pedestrian fatalities, injuries, and conflicts. By spring of 2002, FHWA awarded three cooperative agreements to the following locations: Las Vegas, Nevada; Miami-Dade County, Florida; and San Francisco, California.
Through this program, the FHWA sought to demonstrate and evaluate the effectiveness of a combined pedestrian safety engineering and intelligent transportation systems (ITS)-based area-wide countermeasures program for reducing pedestrian fatalities, injuries, conflicts, and other surrogate measures of safety. The countermeasures included traditional safety engineering design-based countermeasures, as well as ITS-based countermeasures. Traditional pedestrian safety engineering countermeasures included: signs and markings, eliminating permissive left-turns, leading pedestrian intervals, medians, roadway lighting, overall safety improvements at intersections, and other efforts to slow travel speeds in pedestrian-traveled areas. Examples of ITS technologies included: pedestrian countdown signals, ITS push buttons that confirm the press, automatic detection of pedestrians, and dynamic signs restricting right-turn-on-red.
The pedestrian countermeasure studies conducted at each of the three locations noted above were conducted in two phases. Phase I involved the following elements:
• Provide a detailed analysis of the pedestrian problem. • Identify areas that have a particularly high number of pedestrian crashes. • Perform an analysis of potential countermeasures for reducing pedestrian crashes. • Develop a detailed implementation and evaluation plan. • Collect and analyze baseline data at the evaluation sites.
Phase II involved the implementation and evaluation of the countermeasures identified in Phase I. The project included self-evaluations conducted by each of the field teams, as well as an independent national evaluation and cross-cutting study conducted by an independent contractor. The self-evaluations focused on the impacts of the individual countermeasures, while the national evaluation focused on the zone-wide and area-wide impacts of the countermeasures program. The results of the national zone-/area-wide evaluation were summarized in a technical memorandum to FHWA. This report brings together the findings from the self-evaluations and contains cross-cutting analyses, where possible, of those countermeasures that were deployed by more than one of the three field teams.
PEDESTRIAN SAFETY COUNTERMEASURES UNDER INVESTIGATION As noted above, each of the field teams employed a systematic process to pedestrian problem identification and countermeasure selection. As a result of these safety analyses, each team selected a number of pedestrian safety countermeasures for deployment. Throughout the project, some of the selected countermeasures changed due to issues with vendors, procurement, or approval from location jurisdictions to install the countermeasures. Nevertheless, in the end, a wide range of traditional and ITS-based countermeasures were deployed at a large number of sites in the three locations. This system impact and cross-cutting study report focuses on the findings for 18 countermeasures, which have been grouped into the following 6 categories:

Final System Impact Report January 2009
2
• Static signs • Active signs • Pavement markings • Signals and signal timing • Physical separation • Lighting
The countermeasures are listed in Table 1, where the shaded areas illustrate the countermeasures identified as “cross-cutting,” meaning they were deployed by more than one of the field teams. The last column indicates the page number within the report where the results for each countermeasure can be found.
Table 1. Pedestrian Safety Countermeasures Selected for Deployment
Countermeasures Miami LV SF Page #Static Signs
TURNING TRAFFIC YIELD TO PEDESTRIANS signs X X X 4 In-street pedestrian signs X X X 12 Pedestrian zone signs X 17
Active Signs NO TURN ON RED (NTOR) signs X 18 Portable radar speed trailers X X X 22
Pavement Markings High visibility crosswalk treatment X 26 Advance stop lines X 31 LOOK pavement stencils X 33
Signals and Signal Timing Pedestrian countdown signals X X 36 Call buttons that confirm the press X X 40 Automated pedestrian detection X X 45 Activated flashing beacons X X 47 Rectangular rapid flashing beacon1 X 56 Leading pedestrian interval (Pedestrian head start) X X 60 Prohibition of permissive left turns X 65
Physical Separation Median refuge island X X 68 Danish offset (with high visibility crosswalk, advance yield markings and YIELD HERE TO PEDESTRIANS signs)
X 71
Lighting Dynamic lighting X X 77
1This countermeasure was installed in Las Vegas, but results were not available at the time of this report.

Final System Impact Report January 2009
3
EVALUATION OF COUNTERMEASURES The impacts of the countermeasures were assessed through self evaluations by the individual field teams. Full documentation of the self evaluations can be found in each team’s Phase II Final Report(s) (1,2,3,4). The deployment strategies and experimental designs developed by each team took into account the need to assess the site-specific impacts of the countermeasures, albeit somewhat differently. While the San Francisco and Miami field teams deployed many of the countermeasures at multiple sites, these teams selected one or more “study” or evaluation sites for each countermeasure. It was at these sites where they collected data for the evaluation of the countermeasures. At these sites, the countermeasure under study was always the first and only countermeasure deployed so as to allow a before and after comparison of the data. The Miami team also conducted a few studies where they varied the “treatments” at the study sites. For example, while testing the impacts of the electronic NO TURN ON RED (NTOR) sign, they also tested and compared the impacts of the static NTOR and conditional NTOR signs.
By contrast, the Las Vegas team used a staged approach to countermeasure deployment and evaluation at a more limited number of study sties. At each study site, a variety of countermeasures were deployed in a series of stages. As such, each stage allowed for a before and after analysis of the impacts of the countermeasure(s) installed in that stage; however, only in the first stage were the impacts of the countermeasure(s) compared to the true baseline. In each subsequent stage, only the incremental impacts could be measured.
PRESENTATION OF FINDINGS The primary purpose of this System Impact Report is to bring together, summarize, and discuss the findings of the evaluations of the individual countermeasures conducted by the three field teams. In cases where a countermeasure was deployed by more than one of the three field teams, as much as possible, the results are presented in a cross-cutting manner. Where a countermeasure was deployed by only one of the three field teams, the results are summarized from the corresponding findings report from that deployment team.
Regarding the cross-cutting analyses, there were a number of challenges encountered that limited the comparability of some of the findings across the field deployment locations. One challenge was that there were variations in the countermeasures or the manner in which they were deployed by the field teams. In some cases, the field teams deployed variations of the same countermeasure. For example, the San Francisco and Las Vegas teams deployed a text sign reading “Turning Traffic Yield to Pedestrians” while the Miami team deployed a mixed text-symbol sign with the same message. In other cases, the countermeasure was the same, but was applied differently in the different cities. For example, the San Francisco team deployed median refuge islands at signalized intersections, while the Las Vegas team deployed median refuge islands at mid-block crosswalk locations.
Another challenge was that there were variations in the MOEs that were used to test the impacts of the countermeasures. In some cases, the same MOE was used, but the data were collected somewhat differently. For example, for the MOE, “frequency of pedestrian violations,” the Miami team observed and recorded those pedestrians that crossed outside of the WALK phase, while the Las Vegas team observed and recorded those pedestrians that crossed only during the DON’T WALK phase. For the MOE, “pedestrians trapped in the roadway,” the Miami team measured the percentage of cycles in which a pedestrian was trapped, while the Las Vegas team measure the percentage of pedestrians trapped. In other cases the field teams did not collect the same MOEs with which to compare in a cross-cutting analysis.

Final System Impact Report January 2009
4
Based on these issues, the cross-cutting analyses presented in this report are somewhat limited, and these issues should be considered when interpreting the results and conclusions.
RESULTS Results are presented for each of the 18 countermeasures (or combination of countermeasures) separately. For each countermeasure or group of countermeasures, the following information is presented:
• Description of the countermeasure as it was deployed in each city • Brief description of the sites and manner in which the countermeasure was deployed • Measures of effectiveness used to assess the impacts of the countermeasure on pedestrian
and / or driver behavior and / or mobility • A summary and cross-cutting analysis (if applicable) of the findings from the
evaluation(s) • Discussion
STATIC SIGNS Several static signs were installed and tested for their impact on pedestrian safety. These signs included:
• TURNING TRAFFIC YIELD TO PEDESTRIANS Signs • In-street pedestrian signs • Pedestrian zone signs
The findings for the site-specific evaluations for each of these signs are presented below.
TURNING TRAFFIC YIELD TO PEDESTRIANS Signs TURNING TRAFFIC YIELD TO PEDESTRIANS (R10-5 MUTCD 2003) signs are used to remind drivers who are making turns that they must yield to pedestrians in the crosswalks, particularly at signalized intersections where right turns on red (RTOR) are permitted.
These signs were installed by all three field teams. In Las Vegas and San Francisco, the text version of the sign, as shown in Figure 1, was installed at multiple intersections. In Miami, the signs used were symbol versions of the text signs installed in San Francisco and Las Vegas. These signs retained the text message TURNING VEHICLES and TO and substituted the yield symbol for the word YIELD and the pedestrian symbol for the word PEDESTRIAN (as illustrated in Figure 1). The purpose of using this symbol sign in place of the text message sign was to make the sign more comprehensible to tourists that were not native speakers of English and to increase the recognition distance of the sign.

Final System Impact Report January 2009
5
Figure 1. Signs used in Las Vegas and San Francisco (Left) and Sign Used in Miami (Right)
Deployment Locations
In Miami, symbol versions of the signs were tested at two intersections along Collins Avenue in Miami Beach. These signs were placed on the mast arm next to the traffic signals and were intended for both left-turn and right-turn drivers. In Las Vegas, text signs were tested at two different positions at two high crash locations: at one intersection the sign was placed next to the traffic signal (on the far side of the intersection), while at the other intersection the sign was placed on a sign pole 50 feet ahead of the intersection. In both cases, the signs were placed on the right and were intended for drivers making right turns. At both sites, a pedestrian crossing warning sign was installed at the same time as the turning sign. In San Francisco the signs were installed at four intersections with similar characteristics. At three of the four sites, the signs were positioned in one quadrant of the intersection and were directed at left-turn drivers on one approach (Figure 2). At the fourth site, the sign was directed at drivers making right turns on one approach. These locations are identified in Table 2.
Figure 2. Sign at Guerrero & 16th in San Francisco
Final System Impact Report January 2009
6
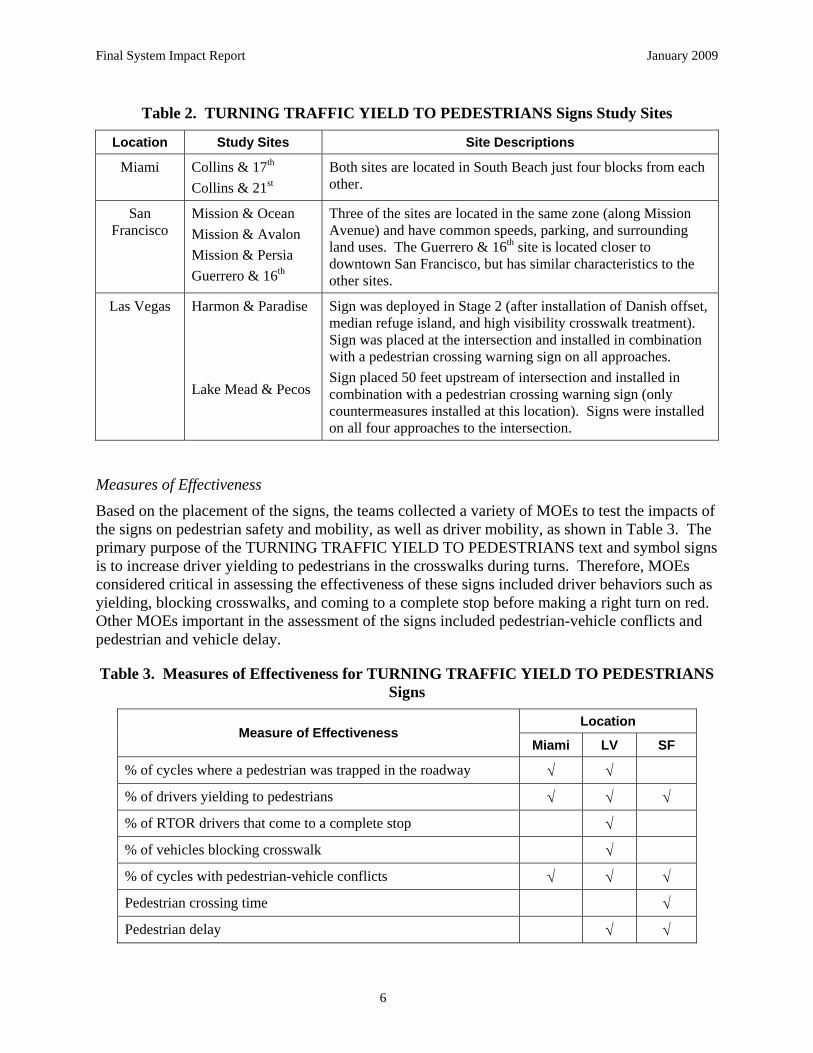
Table 2. TURNING TRAFFIC YIELD TO PEDESTRIANS Signs Study Sites
Location Study Sites Site Descriptions
Miami Collins & 17th Collins & 21st
Both sites are located in South Beach just four blocks from each other.
San Francisco
Mission & Ocean Mission & Avalon Mission & Persia Guerrero & 16th
Three of the sites are located in the same zone (along Mission Avenue) and have common speeds, parking, and surrounding land uses. The Guerrero & 16th site is located closer to downtown San Francisco, but has similar characteristics to the other sites.
Las Vegas Harmon & Paradise Lake Mead & Pecos
Sign was deployed in Stage 2 (after installation of Danish offset, median refuge island, and high visibility crosswalk treatment). Sign was placed at the intersection and installed in combination with a pedestrian crossing warning sign on all approaches. Sign placed 50 feet upstream of intersection and installed in combination with a pedestrian crossing warning sign (only countermeasures installed at this location). Signs were installed on all four approaches to the intersection.
Measures of Effectiveness
Based on the placement of the signs, the teams collected a variety of MOEs to test the impacts of the signs on pedestrian safety and mobility, as well as driver mobility, as shown in Table 3. The primary purpose of the TURNING TRAFFIC YIELD TO PEDESTRIANS text and symbol signs is to increase driver yielding to pedestrians in the crosswalks during turns. Therefore, MOEs considered critical in assessing the effectiveness of these signs included driver behaviors such as yielding, blocking crosswalks, and coming to a complete stop before making a right turn on red. Other MOEs important in the assessment of the signs included pedestrian-vehicle conflicts and pedestrian and vehicle delay.
Table 3. Measures of Effectiveness for TURNING TRAFFIC YIELD TO PEDESTRIANS Signs
Location Measure of Effectiveness
Miami LV SF
% of cycles where a pedestrian was trapped in the roadway √ √
% of drivers yielding to pedestrians √ √ √
% of RTOR drivers that come to a complete stop √
% of vehicles blocking crosswalk √
% of cycles with pedestrian-vehicle conflicts √ √ √
Pedestrian crossing time √
Pedestrian delay √ √

Final System Impact Report January 2009
7
Summary/Analysis of Results
To test the effectiveness of the signs in increasing driver yielding during turns, the teams measured a variety of driver behaviors. Due to the sign placement on the mast arm in Miami and the intention for the sign to be directed at both left- and right-turning drivers, the Miami team measured yielding separately for drivers making left turns and for those making right turns. These results are presented in Table 4. The results in the table show that there was a highly significant increase in both left-turn and right-turn driver yielding at Collins & 21st, while there was an unexplained decrease in left-turn driver yielding at Collins & 17th.
Table 4. Turning Driver Yielding in Miami
% of Left-turning Drivers Yielding Site
Before After % Change p-value
Collins & 17th 59
(n = 188) 51
(n = 370) -8 >0.05
Collins & 21st 50
(n = 487) 77
(n = 207) +27 0.01
% of Right-turning Drivers YieldingSite
Before After % Change p-value
Collins & 21st 63
(n = 371) 79
(n = 132) +16 0.01
Due to the sign placement on the right in Las Vegas and the intention for the sign to be directed at right-turning drivers, the Las Vegas team measured yielding for drivers making right turns on red (RTOR) separately from drivers making right turns on green (RTOG). These results are shown in Table 5.
Table 5. Right-turn Driver Yielding in Las Vegas
% of RTOR Drivers Yielding Site
Before After % Change p-value
Harmon & Paradise 61.3
(n = 31) 73.3
(n = 30) +12 0.156
Lake Mead & Pecos 51.3
(n = 76) 90.9
(n = 55) +39.7 <0.001
% of RTOG Drivers Yielding Site
Before After % Change p-value
Harmon & Paradise 73.5
(n = 102) 76.7
(n = 90) +3.2 0.615
Lake Mead & Pecos 81.9
(n = 73) 79.7
(n = 64) -2.2 0.566

Final System Impact Report January 2009
8
The only significant impact on right-turn driver yielding at the two sites in Las Vegas was at Lake Mead & Pecos, where the sign was installed 50 feet upstream of the intersection. At this site, there was a highly significant increase in RTOR driver yielding. There was no significant change in yielding by drivers making RTOG. While there was an increase in driver yielding at Harmon & Paradise, it was not highly significant. This could be due to the fact that the sign was installed in Stage 2 following installation of a Danish offset, median refuge island, and high visibility crosswalk treatment. Over 60 and 70 percent of RTOR and RTOG drivers, respectively, were already yielding to pedestrians before installation of the signs in Stage 2.
The San Francisco team found no significant impacts on the percentage of drivers yielding to pedestrians during turns.
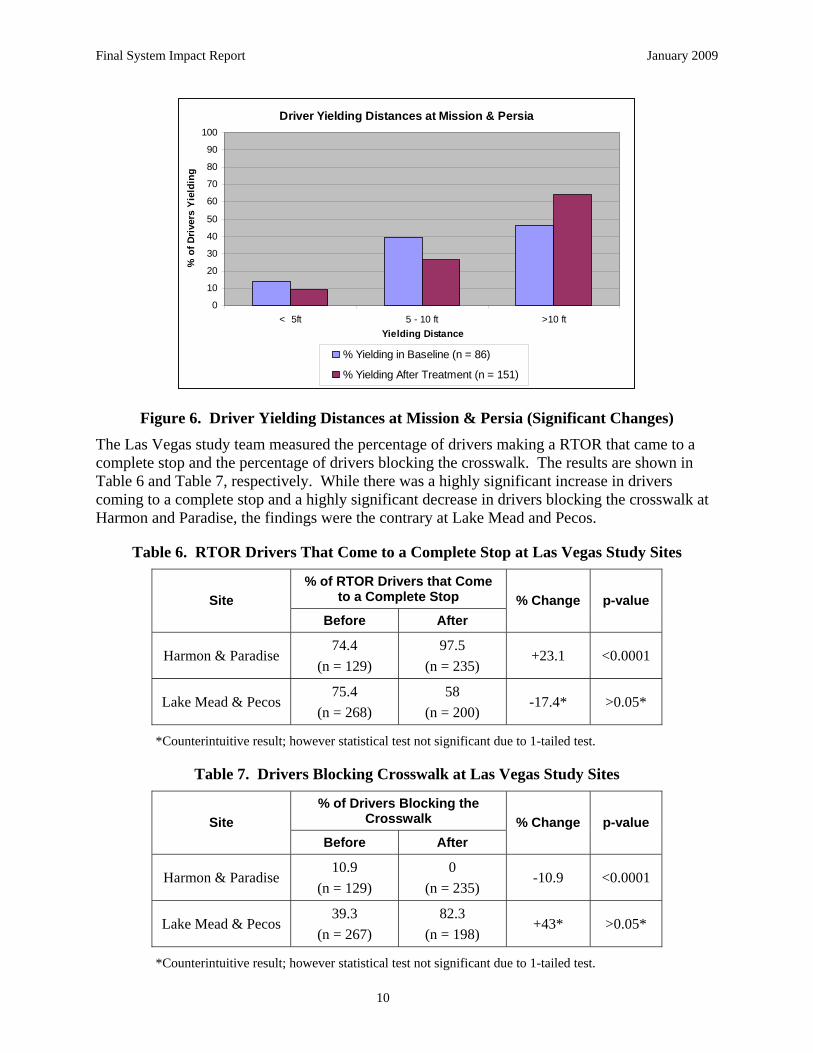
In addition to driver yielding, the San Francisco team also measured the distance drivers yielded before the crosswalk at each of the four sites where the signs were tested. The hypothesis was that the presence of the signs would encourage drivers to yield further away from the crosswalk. The team observed driver yielding and recorded whether drivers yielded within 5 feet of the crosswalk, between 5 and 10 feet of the crosswalk, or more than 10 feet from the crosswalk. The before and after distributions for each of the four test sites are shown in Figure 3 through Figure 6.
While the figures show that yielding distances after installation of the signs tended to increase at Mission & Avalon and at Guerrero & 16th, these changes were not statistically significant due to the small sample sizes. There were significant changes in driver yielding distance at Mission & Ocean and at Mission & Persia. At Mission & Ocean after installation of the signs, more drivers yielded within 5 feet of the crosswalk and fewer drivers yielded more than 10 feet from the crosswalk, a counterintuitive result. At Mission & Persia, there was a decrease in the number of drivers yielding within 5 feet of the crosswalk and more drivers yielding more than 10 feet from the crosswalk.
Driver Yielding Distances at Mission & Avalon
0
10
20
30
40
50
60
70
80
90
100
< 5ft 5 - 10 ft >10 ftYielding Distance
% o
f Driv
ers
Yiel
ding
% Yielding in Baseline (n = 13)
% Yielding After Treatment (n = 16)
Figure 3. Driver Yielding Distances at Mission & Avalon

Final System Impact Report January 2009
9
Driver Yielding Distances at Guerrero & 16th
0
10
20
30
40
50
60
70
80
90
100
< 5ft 5 - 10 ft >10 ft
Yielding Distance
% o
f Dri
vers
Yie
ldin
g
% Yielding in Baseline (n = 58)
% Yielding After Treatment (n = 9)
Figure 4. Driver Yielding Distances at Guerrero & 16th
Driver Yielding Distances at Mission & Ocean
0102030405060708090
100
< 5ft 5 - 10 ft >10 ftYielding Distance
% o
f Driv
ers
Yiel
ding
% Yielding in Baseline (n = 407)
% Yielding After Treatment (n = 470)
Figure 5. Driver Yielding Distances at Mission & Ocean (Significant Changes)
Final System Impact Report January 2009
10
Driver Yielding Distances at Mission & Persia
0
10
20
30
40
50
60
70
80
90
100
< 5ft 5 - 10 ft >10 ftYielding Distance
% o
f Driv
ers
Yiel
ding
% Yielding in Baseline (n = 86)
% Yielding After Treatment (n = 151)
Figure 6. Driver Yielding Distances at Mission & Persia (Significant Changes) The Las Vegas study team measured the percentage of drivers making a RTOR that came to a complete stop and the percentage of drivers blocking the crosswalk. The results are shown in Table 6 and Table 7, respectively. While there was a highly significant increase in drivers coming to a complete stop and a highly significant decrease in drivers blocking the crosswalk at Harmon and Paradise, the findings were the contrary at Lake Mead and Pecos.
Table 6. RTOR Drivers That Come to a Complete Stop at Las Vegas Study Sites
% of RTOR Drivers that Come to a Complete Stop Site
Before After % Change p-value
Harmon & Paradise 74.4
(n = 129) 97.5
(n = 235) +23.1 <0.0001
Lake Mead & Pecos 75.4
(n = 268) 58
(n = 200) -17.4* >0.05*
*Counterintuitive result; however statistical test not significant due to 1-tailed test.
Table 7. Drivers Blocking Crosswalk at Las Vegas Study Sites
% of Drivers Blocking the Crosswalk Site
Before After % Change p-value
Harmon & Paradise 10.9
(n = 129) 0
(n = 235) -10.9 <0.0001
Lake Mead & Pecos 39.3
(n = 267) 82.3
(n = 198) +43* >0.05*
*Counterintuitive result; however statistical test not significant due to 1-tailed test.
Final System Impact Report January 2009
11
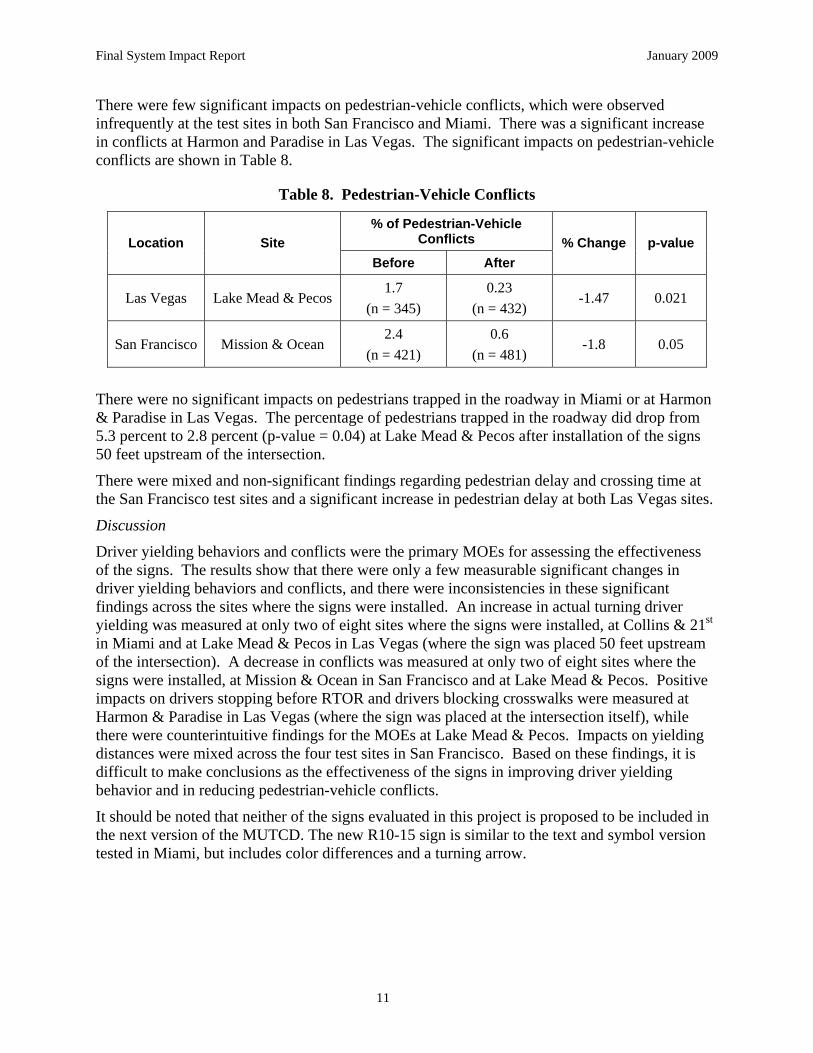
There were few significant impacts on pedestrian-vehicle conflicts, which were observed infrequently at the test sites in both San Francisco and Miami. There was a significant increase in conflicts at Harmon and Paradise in Las Vegas. The significant impacts on pedestrian-vehicle conflicts are shown in Table 8.
Table 8. Pedestrian-Vehicle Conflicts
% of Pedestrian-Vehicle Conflicts Location Site
Before After % Change p-value
Las Vegas Lake Mead & Pecos 1.7
(n = 345) 0.23
(n = 432) -1.47 0.021
San Francisco Mission & Ocean 2.4
(n = 421) 0.6
(n = 481) -1.8 0.05
There were no significant impacts on pedestrians trapped in the roadway in Miami or at Harmon & Paradise in Las Vegas. The percentage of pedestrians trapped in the roadway did drop from 5.3 percent to 2.8 percent (p-value = 0.04) at Lake Mead & Pecos after installation of the signs 50 feet upstream of the intersection.
There were mixed and non-significant findings regarding pedestrian delay and crossing time at the San Francisco test sites and a significant increase in pedestrian delay at both Las Vegas sites.
Discussion
Driver yielding behaviors and conflicts were the primary MOEs for assessing the effectiveness of the signs. The results show that there were only a few measurable significant changes in driver yielding behaviors and conflicts, and there were inconsistencies in these significant findings across the sites where the signs were installed. An increase in actual turning driver yielding was measured at only two of eight sites where the signs were installed, at Collins & 21st in Miami and at Lake Mead & Pecos in Las Vegas (where the sign was placed 50 feet upstream of the intersection). A decrease in conflicts was measured at only two of eight sites where the signs were installed, at Mission & Ocean in San Francisco and at Lake Mead & Pecos. Positive impacts on drivers stopping before RTOR and drivers blocking crosswalks were measured at Harmon & Paradise in Las Vegas (where the sign was placed at the intersection itself), while there were counterintuitive findings for the MOEs at Lake Mead & Pecos. Impacts on yielding distances were mixed across the four test sites in San Francisco. Based on these findings, it is difficult to make conclusions as the effectiveness of the signs in improving driver yielding behavior and in reducing pedestrian-vehicle conflicts.
It should be noted that neither of the signs evaluated in this project is proposed to be included in the next version of the MUTCD. The new R10-15 sign is similar to the text and symbol version tested in Miami, but includes color differences and a turning arrow.

Final System Impact Report January 2009
12
In-street Pedestrian Crossing Signs In-street pedestrian crossing signs (2003 MUTCD R1-6 and R1-6a signs) are intended for use at uncontrolled (unsignalized) crosswalks to remind drivers of laws regarding pedestrians’ rights-of-way (Figure 7). They are more noticeable than roadside signs and may also exert a minor traffic-calming effect by effectively narrowing the inside lanes slightly on roads with no raised median. The signs can be installed with either a portable or fixed base. The dimensions of the signs are 12” x 44”, and the color is a fluorescent yellow-green diamond sheeting with 10” x 24” white high intensity sheeting inserts. The overall height of the signs is 47 inches.
Figure 7. In-Street Pedestrian Sign in San Francisco In-street pedestrian crossing signs were installed and tested in Miami, Las Vegas, and San Francisco. According to the Miami team, the cost for each sign was $225.00. The installation cost was $50.00 per sign for a total cost of $275.00 per installed sign.
Deployment Locations
The study sites for in-street pedestrian crossing signs are shown in Table 9. In Miami, in-street pedestrian signs were placed at three unsignalized intersections along Collins Avenue in South Beach (Figure 8). Two signs were installed at each of the three intersections, one for the northbound Collins approach and one for the southbound Collins approach. In San Francisco, in-street pedestrian signs were placed at four intersections. In Las Vegas, eight in-street pedestrian signs were placed along Bonanza in between D and F Street (Figure 9). A modified version of the sign stating, “watch for pedestrians,” was used along Twain Avenue, and four of these signs were installed along Twain between Cambridge and Swenson Streets (Figure 10). Signs used in San Francisco and those used along Twain in Las Vegas did not include the STATE LAW or WITHIN CROSSWALK text associated with the MUTCD signs.

Final System Impact Report January 2009
13
Table 9. Study Sites for In-street Pedestrian Crossing Signs
Location Study Sites Site Descriptions
Miami Collins & 6th Collins & 9th Collins & 13th
This section of Collins Avenue is a 2-lane, 2-way roadway with parking on both sides of the roadway. The posted speed limit is 25 mph.
San Francisco 16th & Capp (marked crosswalk) 16th & Capp (unmarked crosswalk) Mission & France Mission & Admiral
The treatment intersections are medium-sized, low-speed intersections, located in institutional, commercial, or industrial areas. Street parking is present at all intersections. Two intersections are four-legged; Mission and Admiral is a skewed intersection, while Mission and France is a T-intersection. All intersections are stop-controlled and have two-way flow.
Las Vegas Bonanza between D and F
Twain Avenue between Cambridge and Swenson
This section of Bonanza is a multi-lane, 2-way roadway.
This section of Twain is a multi-lane, 2-way roadway.
Figure 8. In-street Pedestrian Signs in South Miami Beach
Figure 9. In-street Signs along Bonanza between D and F Streets in Las Vegas

Final System Impact Report January 2009
14
Figure 10. Modified Version of In-street Pedestrian Sign Installed along Twain Avenue in Las Vegas
Measures of Effectiveness
The primary purpose of the in-street pedestrian signs is to increase driver awareness and yielding to pedestrians. Thus, MOEs considered critical in assessing the effectiveness of the in-street pedestrian signs included driver yielding, pedestrians trapped, and pedestrian-vehicle conflicts. These and other MOEs collected by the teams are shown in Table 10.
Table 10. Measures of Effectiveness for In-street Pedestrian Crossing Signs
Location Measure of Effectiveness
Miami LV SF
% of drivers yielding to pedestrians √ √ √
Distance drivers yielded to pedestrians in crosswalk √
% of cycles where a pedestrian was trapped in the roadway √ √ √
% pedestrian-vehicle conflicts √ √
Average pedestrian delay √ √
Summary/Analysis of Results
The primary MOE used to assess the effectiveness of the in-street pedestrian signs was driver yielding. The Las Vegas team measured driver yielding to those pedestrians outside, but within 200 feet of the crosswalks on Bonanza at D and F Streets. Along Twain, driver yielding was measured for pedestrians crossing mid block between Cambridge and Swenson.
While the three field teams used different applications of the in-street pedestrian signs in terms of location and number of signs used, the signs proved to be very effective in increasing driver yielding. These results are shown in Table 11. Driver yielding increased from between about 13 percent and 46 percent depending on the location and the level of driver yielding measured in the baseline.

Final System Impact Report January 2009
15
Table 11. Driver Yielding
% of Drivers Yielding to Pedestrians Location Site
Before After % Change p-value
Collins & 6th 32
(n = 400) 78
(n = 440) +46 0.01
Collins & 9th 21
(n = 400) 65
(n = 240) +44 0.01
Miami
Collins & 13th 34
(n = 1200) 69
(n = 200) +35 0.01
16th & Capp (marked crosswalk)
60.5 (n = 519)
73.6 (n = 447
+13.1 <0.01
16th & Capp (unmarked crosswalk)
39.6 (n = 96)
59.6 (n = 109)
+20 <0.01
Mission & France 43
(n = 164) 78
(n = 91) +35 <0.01
San Francisco
Mission & Admiral 22
(n = 41) 57.4
(n = 47) +35.4 <0.01
Bonanza between D and F 74
(n = 89) 47
(n = 106) -27* >0.05
Las Vegas Twain between Cambridge
and Swenson 7
(n = 141) 35
(n = 79) +18 <0.001
*Counterintuitive result; results are not significant due to 1-tailed test.
In addition to the percentage of drivers that yielded to pedestrians, the Las Vegas team measured the distance at which drivers yielded to pedestrians. The hypothesis was that the signs would increase yielding distances. The team observed driver yielding and recorded whether drivers yielded within 10 feet of the pedestrian, between 10 and 20 feet of the pedestrian, or more than 20 feet from the pedestrian. The before and after distributions for yielding distances are shown in Figure 11. Statistical comparisons were made for each of the three yielding distances, and the results showed that there was a significant increase in drivers yielding between 10 and 20 feet (15% increase, p < 0.05) and in drivers yielding more than 20 feet (15% increase, p < 0.05).

Final System Impact Report January 2009
16
Driver Yielding Distances on Bonanza between D St. and F St.
0
10
20
30
40
50
60
70
80
90
100
< 10ft 10 - 20 ft >20 ftYielding Distance
% o
f Driv
ers
Yie
ldin
g
% Yielding in Baseline (n = 66)
% Yielding After Treatment (n = 50)
Figure 11. Yielding Distances at Las Vegas Site Before and After Installation of In-street Pedestrian Signs
While all three teams measured the percent of pedestrians trapped in the roadway at the test sites, there were no significant changes in this MOE at any of the sites.
There were no significant changes in the percentage of pedestrian-vehicle conflicts at the Miami sites or at two of the three sites in San Francisco. Only at Mission & Admiral in San Francisco was there a significant decrease in pedestrian-vehicle conflicts. Conflicts were reduced from 17.1 percent in the baseline to 2.1 percent after installation of the knockdown signs (p = 0.02).
There were no significant changes in average pedestrian delay in Las Vegas or at two of the three sites in San Francisco. Only at one of the sites in San Francisco (Mission & France) was there a significant change in average pedestrian delay after installation of the in-street pedestrian signs. Average pedestrian delay decreased from 7.9 seconds in the baseline to 5 seconds after installation of the knockdown signs (p = 0.02).
Discussion
Based on the results of these studies, in-street pedestrian crossings signs are highly effective at increasing driver yielding to pedestrians. The location at the roadway centerline appears to capture drivers’ attention more effectively than roadside signs. However, all three teams noted that while these signs were effective at increasing driver yielding, they had a very short lifespan at the many of the sites. In Miami, the test sites were narrow streets and did not have a median island to protect the signs. In Las Vegas, the signs were destroyed by trucks making turns at the test sites. Therefore, placement of the signs is critical to their continued effectiveness in increasing driver yielding and potentially improving pedestrian safety.

Final System Impact Report January 2009
17
Pedestrian Zone Signs This countermeasure is intended to alert motorists that the upcoming section of roadway is associated with frequent pedestrian crossings. It includes a W11-2 pedestrian warning sign with a supplemental distance plaque (2 miles in the case of this deployment) that gives the distance that pedestrians may be encountered (Figure 12). The pedestrian warning sign is yellow in the shape of a diamond with a figure of a person walking. The Miami team acquired the signs for $25 each and installed them for $45 each.
Deployment Locations
Pedestrian zone signs were deployed at nine locations in the Miami area, approximately 30 feet from a crosswalk at an intersection. The signs were tested at a mid-block section of Collins Avenue between 10th Street and 11th Street, which is described in Table 12. The pedestrian zone warning sign was installed on Collins Avenue 10 meters north of 10th Street facing northbound traffic.
Figure 12. MUTCD W11-2 Pedestrian Warning Sign and Supplemental Distance Plaque
Table 12. Pedestrian Zone Sign Study Site
Location Study Sites Site Descriptions
Miami Collins Avenue between 10th and 11th Street
Midblock location in the heart of the South Beach entertainment area. Collins Avenue is 2-lanes at this area and on-street parking with an ADT of 29,500 and a speed limit of 30 mph. Area has high density of pedestrians and high incidence of pedestrian crashes.
Measures of Effectiveness The Miami study team used the following four MOEs to assess the impacts of the pedestrian zone signs on driver and pedestrian behavior:
• Vehicle speed

Final System Impact Report January 2009
18
• % driver braking
• % of pedestrians trapped in the crosswalk
• % of pedestrian-vehicle conflicts
The team measured driver speed prior to passing a pedestrian and the percent of pedestrians crossing when a vehicle was present that a conflict occurred. The percent of drivers who applied their brakes in the vicinity of a pedestrian was measured as a way to capture driver yielding behavior. Additionally, the Miami team collected data on the percent of pedestrians that were trapped in the crosswalk. It was expected that the pedestrian zone signs would increase driver braking for pedestrians and decrease vehicle speed, trapped pedestrians, and pedestrian-vehicle conflicts because drivers would be more cautious and alert to pedestrians in the area of the sign.
Summary/Analysis of Results
Following the deployment of the pedestrian zone signs, vehicle speeds when pedestrians were present did not change significantly. Before the sign was installed, driver speed averaged around 19 mph which was 10 mph below the posted speed limit of 30 mph. Driver speed probably did not decrease with the addition of the sign because speed was already so low.
There were no significant changes in average vehicle speed, the percentage of drivers braking when a pedestrian was present, or in the percentage of pedestrians trapped in the roadway at the study site. No conflicts were observed in the before or after conditions.
Discussion
Collectively, these observations seem to indicate that the countermeasure was ineffective at altering driver behavior at this location. The researchers have suggested that this ineffectiveness may be related to the low speeds observed prior to deployment, which creates a “floor effect” in the data whereby there is not much margin for improvement. Also, the static nature of this warning sign against other signs may not draw the attention of many drivers.
ACTIVE SIGNS Two types of active signs were installed and tested for their impact on pedestrian safety. These signs included:
• NO TURN ON RED (NTOR) signs
• Portable radar speed trailers
The findings for the site-specific evaluations of these signs are presented below.
NO TURN ON RED (NTOR) Signs NO TURN ON RED (NTOR) signs are placed on signal mast arms as an indication to motorists that right turns on red are prohibited. The Miami team evaluated the relative effectiveness of three different types of NTOR signs was analyzed: 1) a static NO TURN ON RED (R10-11a 2003 MUTCD) sign, 2) a static and conditional NO TURN ON RED WHEN PEDESTRIANS IN CROSSWALK sign (the pre-existing sign) (not in the existing or proposed MUTCD), and 3) an electronic NO TURN ON RED SIGN that is illuminated only during the phases when right turns are prohibited and a pedestrian has pushed the call button. Each of these signs is shown in Figure 13. The electronic sign used by the Miami study team displayed a “YIELD TO

Final System Impact Report January 2009
19
PEDESTRIANS” message during the green phase for right-turners and was dark during the protected right turn phase.
Figure 13. Static and Active NTOR Signs Tested in Miami
Deployment Locations
NTOR signs were deployed at one site in Miami (Table 13). In Miami, the three different types of NTOR signs mentioned above were deployed in phases at the intersection of 41st and Pine Tree. The intersection was chosen for deployment because it is within a high crash zone. The study team collected data on drivers using a dedicated right turn lane on Pine Tree Drive with a right turn indication that preceded the pedestrian WALK phase. The crosswalk observed for the study was across the south leg of Pine Tree Drive at 41st Street. At the beginning of the study, the data were collected with the conditional NO TURN ON RED WHEN PEDESTRIANS IN CROSSWALK sign installed. In the next phase, the conditional sign was replaced with a NO TURN ON RED sign. For the following phase, the static sign was replaced with the electronic sign. Finally, the electronic sign was removed and the conditional “NO TURN ON RED” sign was used again.
Table 13. No Turn on Red Signs Study Site
Location Study Site Site Description Miami 41st & Pine Tree Intersection of 2-way, four-lane arterials. Primary street is 41st with
an ADT of 39,000 vehicles per day. Location with history of motorist-pedestrian crashes wherein motorist turned right on red into a crossing pedestrian. Prior to study, intersection had a conditional NTOR (when pedestrians in crosswalk).
Measures of Effectiveness
The purpose of NTOR signs is to reduce conflicts between right-turn vehicles and pedestrians by eliminate right turns during the red signal phase. Miami used the following four MOEs for the NTOR countermeasures:
• Drivers violating NTOR
• Drivers making stop before right turn
• % pedestrian-vehicle conflicts
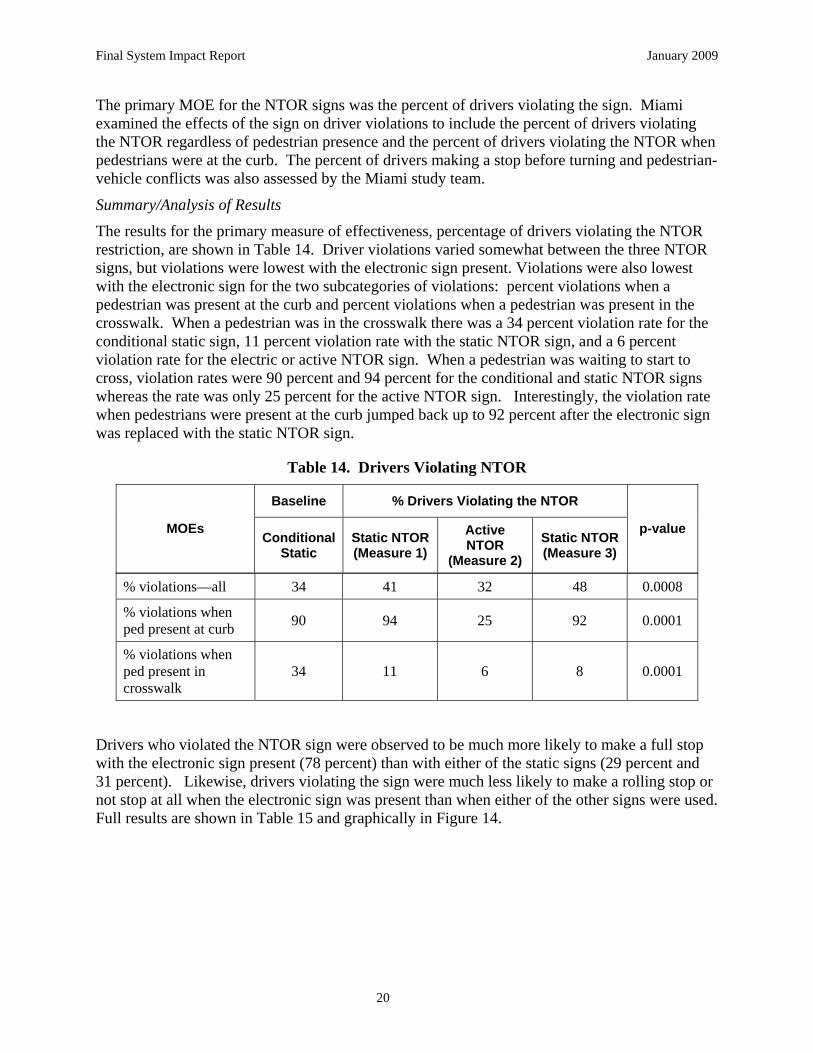
Final System Impact Report January 2009
20
The primary MOE for the NTOR signs was the percent of drivers violating the sign. Miami examined the effects of the sign on driver violations to include the percent of drivers violating the NTOR regardless of pedestrian presence and the percent of drivers violating the NTOR when pedestrians were at the curb. The percent of drivers making a stop before turning and pedestrian-vehicle conflicts was also assessed by the Miami study team.
Summary/Analysis of Results
The results for the primary measure of effectiveness, percentage of drivers violating the NTOR restriction, are shown in Table 14. Driver violations varied somewhat between the three NTOR signs, but violations were lowest with the electronic sign present. Violations were also lowest with the electronic sign for the two subcategories of violations: percent violations when a pedestrian was present at the curb and percent violations when a pedestrian was present in the crosswalk. When a pedestrian was in the crosswalk there was a 34 percent violation rate for the conditional static sign, 11 percent violation rate with the static NTOR sign, and a 6 percent violation rate for the electric or active NTOR sign. When a pedestrian was waiting to start to cross, violation rates were 90 percent and 94 percent for the conditional and static NTOR signs whereas the rate was only 25 percent for the active NTOR sign. Interestingly, the violation rate when pedestrians were present at the curb jumped back up to 92 percent after the electronic sign was replaced with the static NTOR sign.
Table 14. Drivers Violating NTOR
Baseline % Drivers Violating the NTOR
MOEs Conditional Static
Static NTOR (Measure 1)
Active NTOR
(Measure 2) Static NTOR (Measure 3)
p-value
% violations—all 34 41 32 48 0.0008
% violations when ped present at curb 90 94 25 92 0.0001
% violations when ped present in crosswalk
34 11 6 8 0.0001
Drivers who violated the NTOR sign were observed to be much more likely to make a full stop with the electronic sign present (78 percent) than with either of the static signs (29 percent and 31 percent). Likewise, drivers violating the sign were much less likely to make a rolling stop or not stop at all when the electronic sign was present than when either of the other signs were used. Full results are shown in Table 15 and graphically in Figure 14.
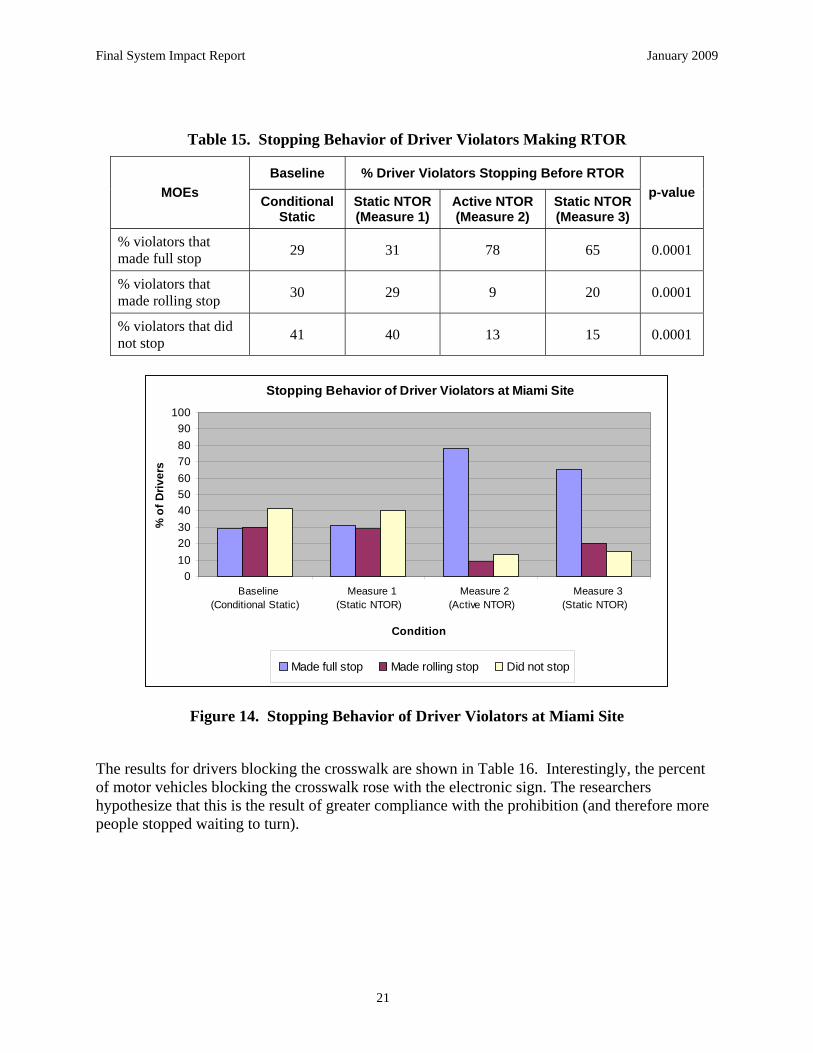
Final System Impact Report January 2009
21
Table 15. Stopping Behavior of Driver Violators Making RTOR
Baseline % Driver Violators Stopping Before RTOR MOEs Conditional
Static Static NTOR (Measure 1)
Active NTOR (Measure 2)
Static NTOR (Measure 3)
p-value
% violators that made full stop 29 31 78 65 0.0001
% violators that made rolling stop 30 29 9 20 0.0001
% violators that did not stop 41 40 13 15 0.0001
Stopping Behavior of Driver Violators at Miami Site
0102030405060708090
100
Baseline (Conditional Static)
Measure 1 (Static NTOR)
Measure 2 (Active NTOR)
Measure 3 (Static NTOR)
Condition
% o
f Driv
ers
Made full stop Made rolling stop Did not stop
Figure 14. Stopping Behavior of Driver Violators at Miami Site
The results for drivers blocking the crosswalk are shown in Table 16. Interestingly, the percent of motor vehicles blocking the crosswalk rose with the electronic sign. The researchers hypothesize that this is the result of greater compliance with the prohibition (and therefore more people stopped waiting to turn).

Final System Impact Report January 2009
22
Table 16. RTOR Drivers Blocking Crosswalk
Baseline % RTOR Drivers Blocking Crosswalk MOEs Conditional
Static Static NTOR (Measure 1)
Active NTOR (Measure 2)
Static NTOR (Measure 3)
p-value
% drivers that blocked crosswalk 1.7 0 20.8 20.2 <0.0001
The frequency of evasive conflicts was small, but easily the lowest with the electronic sign (1 percent for conditional static sign, 2 percent for the static NTOR sign, and 0.1 percent for the electronic NTOR sign).
Discussion
The results of this study indicate that the electronic NTOR sign was relatively effective in decreasing unsafe driver behaviors in the presence of pedestrians. Following installation of the electronic sign, there was a moderate reduction in overall turning violations (only 32 percent as compared to 41 percent with the static NTOR sign and 34 percent with the static conditional NTOR sign). Perhaps more importantly, there was a large reduction in turning violations when a pedestrian was present at the curb following installation of the electronic NTOR sign (only 25 percent as compared to over 90 percent with the static signs). There was also an increase in complete stops made prior to violating the turn prohibition and a reduction in conflicts. This sign may be especially effective in visually cluttered areas where motorists are less likely to see and respond to a static sign.
Portable Radar Speed Trailers Portable radar speed trailers are used to deter speeding. These devices can be installed along the side of the road - typically in parking areas - and display the speed of each approaching vehicle. Above a user-selected maximum, the signs “blank out” to avoid enticing drivers into exhibitions of speed. A computer within the device records speed data.
Portable speed trailers were installed by all three field teams. In Miami and San Francisco, a speed limit sign was included on the trailer. In Las Vegas, the speed trailer display provided feedback on the fine associated with the speed, if applicable (Figure 15). In Miami, the speed trailers were furnished by the City of Miami Beach. The estimated cost for each trailer was $25 per day. The estimated installation cost was $45 per trailer.

Final System Impact Report January 2009
23
Figure 15. Portable Radar Speed Trailers (Left: Signs used in Las Vegas; Right: Signs used in San Francisco)
Deployment Locations
In Miami, a speed trailer was tested at a mid-block location in Miami Beach. The speed trailer was parked beside the road on Collins Avenue just beyond 38th Street in advance of an uncontrolled mid-block crosswalk. In Las Vegas, a speed trailer was tested at a mid-block location along Fremont between 6th and 7th Streets. In San Francisco, speed trailers were tested at four different locations. The study sites are described in Table 17.
Table 17. Portable Radar Speed Trailer Study Sites
Location Study Sites Site Descriptions
Miami Collins between 38th and 39th
This segment of Collins runs one-way northbound with three lanes and parking on both sides of the road. The posted speed limit is 30 mph.
Las Vegas Fremont between 6th and 7th
Fremont Street is classified as a minor arterial and the posted speed limit is 25 mph. First 15 days was installed on the north side of street. Then speed trailer was installed on south side of street (for eastbound traffic).
San Francisco 16th & Capp1 Mission & France Mission & Admiral1 Geary & 11th
All intersections carry 2-way traffic on both streets. Side street traffic is controlled by stop signs. Posted speed limit at Mission & France and Geary & 11th is 40 mph. Posted speed limit at Mission & Admiral is 25 mph.
1 Note, speed trailers were towed away during data collection at these sites; therefore, results are not presented for these sites.
Application of the speed trailers varied between the three locations. In Miami, the speed trailer was placed just downstream of a signalized intersection in advance of an uncontrolled mid-block crosswalk. At this site, pedestrians were observed crossing mid-block, outside of the designated uncontrolled midblock crosswalk. This site was selected to manage drivers’ speeds prior to this mid-block crossing area. In San Francisco, speed trailers were placed along streets in areas

Final System Impact Report January 2009
24
where the cross streets were controlled by stops signs only. These sites were selected to manage drivers’ speeds along these uncontrolled sections of roadway and to increase driver yielding to pedestrians attempting to cross the major streets in the crosswalks at the unsignalized intersections.
Measures of Effectiveness
The teams collected a variety of MOEs to test the impacts of the speed trailers on pedestrian safety and mobility, as shown in Table 18. The purpose of portable radar speed trailers is to deter speeding. Therefore, the most critical MOE in assessing the effectiveness of the speed trailers was vehicle speed in the vicinity of the speed trailers. Other MOEs important in the assessment of the speed trailers included driver yielding to pedestrians at mid-block locations, pedestrians trapped in the roadway, pedestrian-vehicle conflicts, and pedestrian delay.
Table 18. Measures of Effectiveness for Portable Radar Speed Trailers
Location Measure of Effectiveness
Miami LV SF
Vehicle speed √ √
% of drivers yielding to pedestrians √ √ √
% of cycles where a pedestrian was trapped in the roadway √ √
% of pedestrian-vehicle conflicts √ √
Pedestrian delay √
Summary/Analysis of Results
Both the Miami and San Francisco teams measured vehicle speeds in the vicinity of the speed trailers. In Miami, speeds were measured for vehicles that were observed during a sample of 30 pedestrians crossing outside of the crosswalk between 38th and 39th Streets. In San Francisco, vehicle speeds were measured in the vicinity of the speed trailers, which were placed upstream of crosswalks at 2-way stopped controlled intersections. These results are presented in Table 19.
Table 19. Vehicle Speeds
Vehicle Speed Location Site
Before After %
Change p-value
Miami Collins between 38th and 39th
25.9 (n = 3301)
26.2 (n = 3001)
+0.30 0.05
Mission & France
26 (n = 642)
24 (n = 462)
-2 <0.01 San Francisco
Geary & 11th 29
(n = 802) 25
(n = 492) -4 <0.01
1 Number of pedestrian crossings observed 2 Number of vehicle-pedestrian interactions

Final System Impact Report January 2009
25
There was a statistically significant, albeit not practically significant, increase in mean speed measured on Collins Avenue. In San Francisco, there was a small but significant decrease in mean speed measured at both sites.
In addition to measuring vehicle speeds, the teams measured driver yielding. The Miami team measured a surrogate for driver yielding by recording the percentage of drivers who applied the brakes when a pedestrian was crossing outside of the mid-block crosswalk. These results are presented in Table 20. The results show that the average number of drivers braking during mid-block pedestrian crossings increased by about 10 percent while the speed trailer was at the site.
The San Francisco team measured driver yielding to pedestrians in the crosswalks at the 2-way stop controlled intersections just downstream of the portable speed trailers. The Las Vegas team measured driver yielding to pedestrians crossing Fremont midblock between 6th and 7th Streets. The results are shown in Table 21. The results show that driver yielding increased significantly at Geary & 11th, and while there was an increase in yielding at Mission & France, it was not statistically significant. The Las Vegas team measured a large decrease in driver yielding.
Table 20. Driver Braking on Collins Avenue in Miami
% Driver Braking Site
Before After % Change p-value
Collins between 38th and 39th 44
(n = 3301) 54
(n =3001) +10 0.05
1 Number of pedestrian crossings observed
Table 21. Driver Yielding
% of Drivers Yielding to Pedestrians Location Site
Before After
% Change p-value
Mission & France 78.1
(n = 641) 89.1
(n = 461) +11 0.20
San Francisco Geary & 11th
37.5 (n = 801)
59.2 (n = 491)
+21.7 0.01
Las Vegas Fremont between 6th and 7th 67
(n = 96) 43
(n = 28) -232 >0.052
1Vehicle-pedestrian interactions 2Counterintuitive result; not significant due to 1-tailed test.
There were almost no pedestrians trapped in the roadway before or after installation of the speed trailer at the Miami or Las Vegas sites.
The San Francisco team also measured average pedestrian delay. The hypothesis was that if the speed trailers increased driver yielding to pedestrians mid-block that there would be a corresponding decrease in pedestrian delay. The average pedestrian delays before and after installation of the speed trailers are shown in Table 22. The results show that there was a significant decrease in average pedestrian delay at both sites, and these decreases correspond to the increases in driver yielding shown in Table 21. At Geary and 11th, average pedestrian delay

Final System Impact Report January 2009
26
decreased by about 4 seconds per pedestrian, which corresponds to the nearly 22 percent increase in the percentage of drivers yielding to pedestrians at this site after installation of the speed trailer. At Mission & France, average pedestrian delay decreased by 1.35 seconds. This smaller decrease corresponds to the 11 percent, albeit not statistically significant, increase in driver yielding at this site after installation of the speed trailer.
Table 22. Average Pedestrian Delay
Average Pedestrian Delay (sec) Site Location
Before After
Change (sec) p-value
Mission & France San Francisco 13.4
(n = 113) 12
(n = 114) -1.4 0.01
Geary & 11th San Francisco 14.6
(n = 71) 10.5
(n = 52) -4.1 0.01
Vehicle-pedestrian conflicts were measured by the Miami and San Francisco teams. No vehicle-pedestrian conflicts were observed in Miami either before or after installation of the speed trailers. In San Francisco, there were no significant changes in vehicle-pedestrian conflicts after installation of the speed trailers. There were also no significant impacts on pedestrians trapped in the roadway in Miami as a result of the speed trailer.
Discussion
Average vehicle speed and driver yielding were the primary MOE for assessing the effectiveness of the speed trailers. The results show only small reductions in average speeds at the San Francisco sites and no measurable changes in average speeds at the Miami sites. There were significant increases in the percentage of drivers yielding / braking during the presence of pedestrians at the Miami site and at one of the San Francisco sites, and this increase in yielding also resulted in significant decreases in pedestrian delay at both sites in San Francisco. There were no significant changes in the other MOEs measured by the teams in the assessment of portable speed trailers. Based on these findings, it appears that the speed trailers can impact drivers’ speeds and possibly increase their awareness of the presence of pedestrians at these locations.
PAVEMENT MARKINGS Several types of pavement markings were installed and tested for their impact on pedestrian safety. These pavement markings included:
• High visibility crosswalk treatment
• Advance stop lines
• “LOOK” pavement stencils
The findings for the site-specific evaluations for each of these pavement markings are presented below.
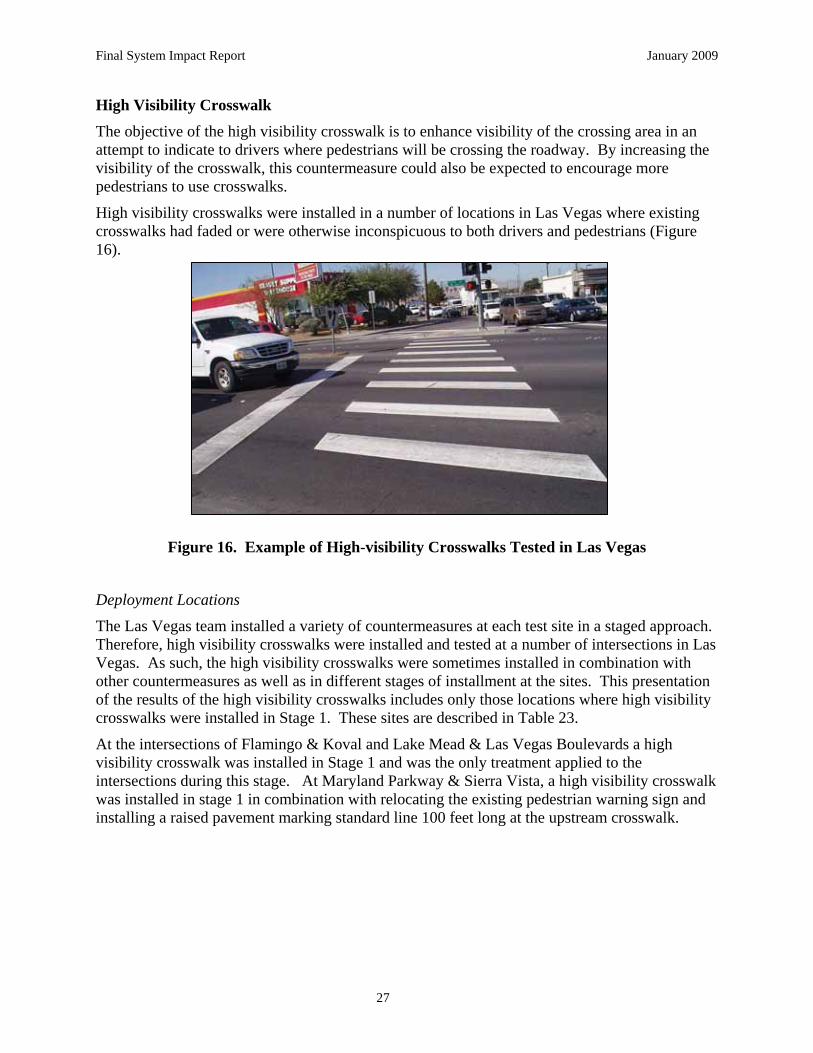
Final System Impact Report January 2009
27
High Visibility Crosswalk The objective of the high visibility crosswalk is to enhance visibility of the crossing area in an attempt to indicate to drivers where pedestrians will be crossing the roadway. By increasing the visibility of the crosswalk, this countermeasure could also be expected to encourage more pedestrians to use crosswalks.
High visibility crosswalks were installed in a number of locations in Las Vegas where existing crosswalks had faded or were otherwise inconspicuous to both drivers and pedestrians (Figure 16).
Figure 16. Example of High-visibility Crosswalks Tested in Las Vegas
Deployment Locations
The Las Vegas team installed a variety of countermeasures at each test site in a staged approach. Therefore, high visibility crosswalks were installed and tested at a number of intersections in Las Vegas. As such, the high visibility crosswalks were sometimes installed in combination with other countermeasures as well as in different stages of installment at the sites. This presentation of the results of the high visibility crosswalks includes only those locations where high visibility crosswalks were installed in Stage 1. These sites are described in Table 23.
At the intersections of Flamingo & Koval and Lake Mead & Las Vegas Boulevards a high visibility crosswalk was installed in Stage 1 and was the only treatment applied to the intersections during this stage. At Maryland Parkway & Sierra Vista, a high visibility crosswalk was installed in stage 1 in combination with relocating the existing pedestrian warning sign and installing a raised pavement marking standard line 100 feet long at the upstream crosswalk.

Final System Impact Report January 2009
28
Table 23. High Visibility Crosswalk Study Sites
Study Sites Site Descriptions Flamingo & Koval
Lake Mead & Las Vegas Blvds.
Maryland Pkwy & Sierra Vista
Installed in Stage 1 (only countermeasure)
Installed in Stage 1 (only countermeasure)
Installed in Stage 1 in combination with relocating the existing pedestrian warning sign and installing an RPM standard line from the crosswalk 100 feet upstream on the Maryland Pkwy approaches to the intersection.
Measures of Effectiveness
As the purpose of high visibility crosswalks is to enhance the visibility of the crossing area so that drivers are aware of where the pedestrians are crossing, the primary MOEs in assessing the effectiveness of the crosswalks include:
• % of drivers yielding to pedestrians
• Distance drivers yield before crosswalk
• % drivers blocking crosswalk
Summary/Analysis of Results
The Las Vegas team measured driver yielding at the test sites both before and after installation of the high visibility crosswalks. Drivers that were observed were those making right turns on green on all four approaches to the intersections at Flamingo & Koval and Lake Mead & Las Vegas Blvds and those drivers making right turns on green and permissive left turns from Maryland Parkway onto Sierra Vista. The results are shown in Table 24. It can be seen that in all three locations there was actually a decrease in driver yielding after installation of the crosswalk treatments.

Final System Impact Report January 2009
29
Table 24. Turning Driver Yielding to Pedestrians in Parallel Crosswalks
% of Drivers Yielding to Pedestrians Site
Before After % Change p-value
Maryland Pkwy & Sierra Vista (right turn on green and permissive left turn drivers from Maryland Pkwy onto Sierra Vista)
63 (n = 30)
38 (n = 158) -25* >0.05
Flamingo & Koval (right turn on green yielding on all four approaches)
89 (n = 164)
7 (n = 278) -82* >0.05
Lake Mead & Las Vegas Blvds. (right turn on green yielding on four approaches)
35 (n = 68)
27 (n = 247) -8* >0.05
* Counterintuitive result; results are not significant due to 1-tailed test.
The before and after measurements of the percentage of drivers blocking the crosswalks at each of the three test sites are shown in Table 25. These results are mixed, with a very large increase in drivers blocking the crosswalk at Maryland Parkway & Sierra Vista. The only significant decrease in the percentage of drivers blocking the crosswalk occurred at Flamingo & Koval, where the percentage dropped from 21 to 3 percent after installation of the high visibility crosswalk treatment.
Table 25. Drivers Blocking Crosswalk
% of Drivers Blocking Crosswalk Site
Before After % Change p-value
Maryland Pkwy & Sierra Vista 1
(n = 89) 61
(n = 158) +60* >0.05
Flamingo & Koval 21
(n = 105) 3
(n = 88) -18 <0.0001
Lake Mead & Las Vegas Blvds. 21
(n = 68) 19
(n = 247) -2 >0.05
* Counterintuitive result; results are not significant due to 1-tailed test.
The Las Vegas team also measured the distance that drivers yielded in advance of the crosswalk during their turns. The before and after distributions of driver yielding are shown in Figure 17 through Figure 19. At Maryland Parkway & Sierra Vista (Figure 17) there was a significant shift in drivers yielding less than 5 feet from the crosswalk to drivers yielding 5 to 10 feet before the crosswalk. At Lake Mead & Las Vegas Boulevards (Figure 18) there was a similar shift, but the change was not statistically significant. At Flamingo & Koval (Figure 19) there was actually a significant increase (14 percent) in drivers yielding less than 5 feet from the crosswalk after the high visibility crosswalk treatment was installed.
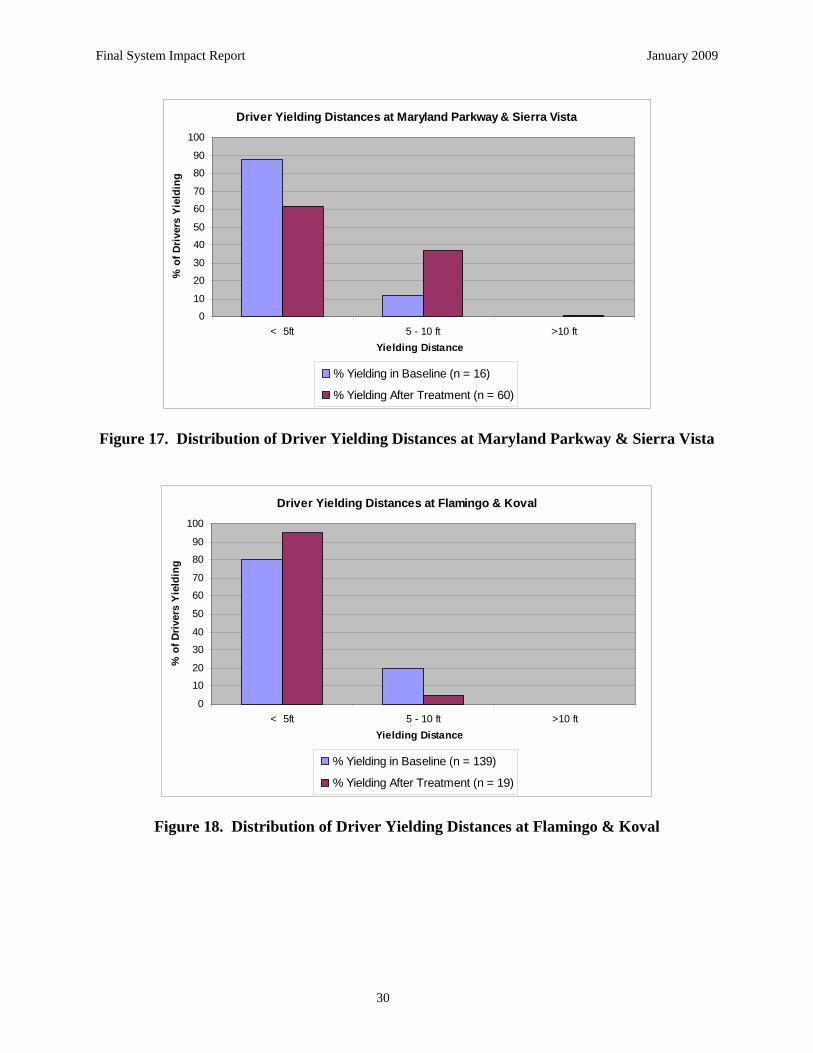
Final System Impact Report January 2009
30
Driver Yielding Distances at Maryland Parkway & Sierra Vista
0
10
20
30
40
50
60
70
80
90
100
< 5ft 5 - 10 ft >10 ftYielding Distance
% o
f Dri
vers
Yie
ldin
g
% Yielding in Baseline (n = 16)
% Yielding After Treatment (n = 60)
Figure 17. Distribution of Driver Yielding Distances at Maryland Parkway & Sierra Vista
Driver Yielding Distances at Flamingo & Koval
0
10
20
30
40
50
60
70
80
90
100
< 5ft 5 - 10 ft >10 ftYielding Distance
% o
f Driv
ers
Yiel
ding
% Yielding in Baseline (n = 139)
% Yielding After Treatment (n = 19)
Figure 18. Distribution of Driver Yielding Distances at Flamingo & Koval

Final System Impact Report January 2009
31
Driver Yielding Distances at Lake Mead Blvd & Las Vegas Blvd
0
10
20
30
40
50
60
70
80
90
100
< 5ft 5 - 10 ft >10 ftYielding Distance
% o
f Driv
ers
Yiel
ding
% Yielding in Baseline (n = 24)
% Yielding After Treatment (n = 67)
Figure 19. Distribution of Driver Yielding Distances at Lake Mead & Las Vegas Boulevards
Discussion
Based on these results, high visibility crosswalks do not appear to be effective in changing driver behaviors in a desirable way. This result could be due in part to the fact that the crosswalk markings deteriorated in a matter of weeks as a result of the heat causing a release of oils in the pavement.
Advanced Stop Lines Vehicles often encroach into crosswalks while waiting either to make a right turn on red or for the signal to change. This behavior can prevent pedestrians from having a clear path to cross the street in the crosswalk. Advanced stop lines are pavement markings at intersections in advance of the crosswalk that indicate to motorists where they should stop at the intersection. They are intended to reduce the occurrence of motorists blocking the crosswalk and to reduce conflicts between pedestrians and vehicles.
Advance stop lines were installed and tested in San Francisco, as shown in Figure 20. A supplemental countermeasure, red visibility curb zones, was evaluated concurrently. These red lines prohibit on-street parking in the immediate vicinity of the intersection, thereby improving the visibility between pedestrians and motorists.

Final System Impact Report January 2009
32
Figure 20. Advance Stop Lines Tested in San Francisco
Deployment Locations
Advance stop lines were installed and tested at two locations, one signalized intersection and one unsignalized intersection, in San Francisco. These study sites are described in Table 26.
Table 26. Advance Stop Line Study Sites
Study Sites Site Descriptions
Geary & 11th Stop-controlled, major street with posted speed limit of 30 mph, on-street parking, four legs, mixed residential land use
Market & Noe Signalized, major street with posted speed limit of 25 mph, on-street parking, six legs, residential land use
Measures of Effectiveness
The purposes of advance stop lines are to remind drivers to stop before the crosswalk area, requiring drivers to yield the right-of-way to pedestrians to cross the road unimpeded by vehicles, and reducing pedestrian-vehicle conflicts. Thus, the MOEs critical to assessing the effectiveness of the advance stop lines include:
• % of drivers yielding to pedestrians
• Distance drivers yield (at Geary & 11th)
• Vehicle stop position (at Market & Noe)
• % of cycles pedestrian-vehicle conflicts
Summary/Analysis of Results
There were no significant changes in driver yielding, vehicle stopped position, or pedestrian-vehicle conflicts at either site after installation of the advance stop lines.

Final System Impact Report January 2009
33
Discussion
Based on these results, it appears that advance stop lines had no impacts on driver behavior.
LOOK Pavement Stencils LOOK pavement stencils are pavement markings designed to remind pedestrians to look for vehicles before crossing, as shown in Figure 21. These markings were tested in San Francisco as an inexpensive alternative to incorporating animated eyes in the countdown pedestrian signal. Originally, the San Francisco study team intended to use the countdown signal with animated eyes but was unable to due to lack of product availability.
Figure 21. LOOK Pavement Stencils Tested in San Francisco The pavement markings used in San Francisco were three feet long and one foot wide, and were made using white thermoplastic material. The word LOOK was shown between two arrows pointing toward the directions of cross traffic. Eyeballs were added inside the Os to enhance the message. These pavement markings were applied to the roadbed facing the sidewalk along the gutter line. San Francisco also used bilingual, custom-made LOOK signs with both English words and Chinese characters in certain locations.
Deployment Locations
The LOOK pavement stencils were studied at four intersections in San Francisco (Table 27). Pedestrian and driver behaviors were observed at Harrison & 4th, Mission & 17th, and Geary & 6th.whereas only customer satisfaction surveys were conducted at the Columbus & Broadway site.

Final System Impact Report January 2009
34
Table 27. LOOK Pavement Stencils Study Sites
Study Sites Site Descriptions
Harrison & 4th 4-leg signalized intersection with low traffic speeds (25-30 mph) and on-street parking. Located in primarily commercial district. Consists of one-way streets and includes turn lanes for a freeway on-ramp.
Columbus & Broadway
4-leg signalized intersection with low traffic speeds (25-30 mph) and on-street parking. Located in primarily commercial district. Skewed intersection
Mission & 17th 4-leg signalized intersection with low traffic speeds (25-30 mph) and on-street parking. Located in primarily residential district.
Geary & 6th 4-leg signalized intersection with low traffic speeds (25-30 mph) and on-street parking. Located in primarily residential district. Raised median present on Geary
Measures of Effectiveness
The pavement stencils were expected to increase the number of pedestrians that look for vehicles before entering the crosswalk and to reduce vehicle-pedestrian conflicts. The following MOEs were used by San Francisco to test the effectiveness of the pavement stencils in meeting these objectives:
• % of pedestrians that look before crossing
• % of pedestrians that look towards intersection
• % of pedestrians that look over shoulder
• % of cycles with pedestrian-vehicle conflicts
Summary/Analysis of Results
The results for the primary MOE, pedestrian looking behavior, are shown in Table 28. The results show that the LOOK pavement stencils were not effective in increasing pedestrian looking behavior. The overall incidence of pedestrian looking actually decreased (increases were observed at one site), though the local data collection team cautions that this MOE was difficult to observe given the video data collection methodology.

Final System Impact Report January 2009
35
Table 28. Pedestrian Looking Behavior
% Pedestrians that Look Before Crossing Site
Before After
% Change p-value
Harrison & 4th 58.6
(n = 232) 49.1
(n = 281) -9.5* 0.12
Mission & 17th 70.6
(n = 506) 53.3
(n = 1410) -17.3* <0.01
Geary & 6th 57.4
(n = 418) 55.3
(n = 331) -2.1* 0.69
% Pedestrians that Look Toward Intersection Site
Before After
% Change p-value
Harrison & 4th 37.9
(n = 136) 24.6
(n = 138) -13.3* 0.02
Mission & 17th 57.9
(n = 357) 43.8
(n = 752) -14.1* <0.01
Geary & 6th 34.7
(n = 240) 43.8
(n = 180) +9.1 0.06
% Pedestrians that Look Over Shoulder Site
Before After
% Change p-value
Harrison & 4th 1.3
(n = 136) 0
(n = 138) -1.3* 0.25
Mission & 17th 20.6
(n = 357) 12.3
(n = 752) -8.3* <0.01
Geary & 6th 4.8
(n = 240) 22.7
(n = 180) +17.9 <0.01
* Counterintuitive result
Regarding the occurrence of pedestrian-vehicle conflicts, there were no significant changes after installation of the pavement stencils.
Discussion
It is not believed that the stencils were responsible for the changes in pedestrian looking behavior, but rather data collection inconsistencies or some other outside factor. Given the difficulty experienced by the data collection team, it is recommended that video camera angles

Final System Impact Report January 2009
36
and placements should be pilot tested to ensure that the MOEs are easily observable. Although the LOOK stencil markings are one of the least expensive countermeasures tested, the results indicate that this may not be an effective countermeasure. Additionally, the San Francisco team noted that they were highly susceptible to fading and blemishes.
SIGNALS AND SIGNAL TIMING A range of signals and signal timing strategies was implemented and tested for their impact on pedestrian safety. These signals and signal timing strategies included:
• Pedestrian countdown signals • Call buttons that confirm the press • Automated pedestrian detection • Activated flashing beacons • Rapid flash beacon • Leading pedestrian interval (pedestrian head start) • Prohibition of permissive left turns
The findings for the site-specific evaluations for these countermeasures are presented below.
PEDESTRIAN COUNTDOWN SIGNALS This treatment consisted of a pedestrian countdown signal that displayed a walking person symbol during the WALK indication. It then counted down the seconds in the clearance phase along with the flashing hand display and finally, displayed the solid hand during the DON’T WALK indication which began during the all red phase. The signals were programmed to begin the countdown at the start of the pedestrian clearance (flashing hand) phase and counted down to 0 at the end of the yellow phase.
In Las Vegas, the signal also displayed “animated eyes” to remind pedestrians to look left and right for vehicles before crossing the street (Figure 22).
Figure 22. Pedestrian Countdown Signal with Animated Eyes

Final System Impact Report January 2009
37
Deployment Locations
Pedestrian countdown signal study sites are shown in Table 29. In Miami, pedestrian countdown signals were installed and tested at two sites just four blocks from each other in South Beach. Pedestrians were observed crossing Alton Road, a multi-lane arterial road in Miami Beach at Lincoln in the first site and at 16th at the second site. Pedestrian-vehicle collisions are more likely to occur among older pedestrians in this location than in other parts of Miami.
In Las Vegas, pedestrian countdown signals were installed and tested at the intersection of Flamingo Road and Koval Lane. The countdown signals were deployed at all four crosswalks. At this intersection, there were three stages of pedestrian safety countermeasure deployment. The countdown signals were installed in the second stage following high-visibility crosswalks, which were geared more toward drivers.
Table 29. Pedestrian Countdown Signals Study Sites
Location Study Sites Site Descriptions Alton & Lincoln Alton is a multi-lane arterial with ADT of 46,000. Miami
Alton & 16th Alton is a multi-lane arterial with ADT of 46,000.
Las Vegas Flamingo & Koval Flamingo Road is a major arterial with an ADT of 40,500 near Koval Lane.
Measures of Effectiveness
The Miami and Las Vegas study teams used a variety of measures focused on pedestrian behavior to gauge the effectiveness of the pedestrian countdown signal in increasing pedestrian compliance with the signal and assisting pedestrians in making informed decisions about crossing so that they are less likely to be still be in the crosswalk at the end of the crossing phase. These MOEs are shown in Table 30. Two of the MOEs considered critical for assessing this countermeasure were the percent of pedestrians violating the signal and the percent of pedestrians in the crosswalk at the end of the flashing DON’T WALK. Other important MOEs were used by the teams to look at other aspects of pedestrian signal compliance such as the percent of cycles in which the call button was pressed.
At Alton and Lincoln, there was a long delay between the collection of baseline data and the installation of the countdown signals. At the other Miami site, Alton and 16th, the countdown signals were installed in the second phase of a two phase pedestrian safety countermeasure deployment at that intersection. During the first phase, call buttons that confirm the press were installed and the data collected at this phase were used as the baseline data for the next countermeasure that was installed, countdown pedestrian signals.

Final System Impact Report January 2009
38
Table 30. Measures of Effectiveness for Pedestrian Countdown Signals
Location Measure of Effectiveness
Miami LV % of cycles the call button was pressed √
% of pedestrians in the crosswalk at the end of the flashing DON’T WALK √
% of pedestrians violating the signal √
% of pedestrians beginning their crossings during the WALK √
% of pedestrians in the crosswalk at the end of the all red √
% of pedestrians who look for vehicles before crossing √
Summary/Analysis of Results
The Miami study team observed the percent of cycles where a pedestrian was present that the call button was pressed. The sites saw large, significant increases in call button presses as shown in Table 31.
Table 31. Call Button Presses
% of Cycles the Call Button was Pressed Location Site Before After
% Change p-value
Miami Alton & Lincoln 35
(n = 450) 95
(n = 450) +60 0.01
Miami Alton & 16th 62.7
(n = 810) 79.7
(n = 300) +17 0.01
The Las Vegas team measured a 19 percent increase in pedestrians still in the crosswalk at the end of the flashing DON’T WALK (Table 32), which was a counter-intuitive finding.
Table 32. Pedestrians in the Crosswalk after Flashing DON’T WALK
% Pedestrians in the Crosswalk at the End of the
Flashing DON’T WALK Location Site
Before After
% Change p-value
Las Vegas Flamingo & Koval
31 (n = 455)
50 (n = 544)
+19* >0.05*
*Counterintuitive result; not significant due to 1-tailed test.

Final System Impact Report January 2009
39
In Las Vegas, the percent of pedestrians violating the signal remained the same at the low level of 5 percent (Table 33). The lack of decrease with the introduction of countdown pedestrian signals may be due to the already low level of violators. Las Vegas’ definition of signal violation includes only those pedestrians who step into or near the crosswalk during the solid red hand.
Table 33. Pedestrians Violating the Signal
% Pedestrians Violating the Signal Location Site
Before After % Change p-value
Las Vegas Flamingo & Koval 5
(n = 303) 5
(n = 235) 0 NA
Results from Las Vegas in Table 34 show that there was a large and significant increase in the percent of pedestrians that began their crossing during the WALK phase. This increase corresponds to the increase in the percent of signal cycles that the call button was pushed, but does not seem to align with the increase in pedestrians in the crosswalk at the end of the flashing red hand, presumably because the increase in pedestrians entering the crosswalk earlier in the phase should mean a decrease in pedestrians still in the crosswalk late in the phase.
Table 34. Pedestrians Beginning their Crossings during the WALK
% Pedestrians Beginning their Crossings during the WALK Location Site
Before After % Change p-value
Las Vegas Flamingo & Koval 51
(n = 455) 80
(n = 544) +29 <0.001
The Las Vegas team measured a significant increase in the percent of pedestrians that looked for vehicles before crossing at the study site (Table 35).
Table 35. Pedestrians that Look for Vehicles Before Crossing
% of Pedestrians who Look for Vehicles Before Crossing Location Site
Before After % Change p-value
Las Vegas Flamingo & Koval 63
(n = 380) 86
(n = 235) +23 <0.001
There were no significant impacts of the pedestrian countdown signal countermeasure on the percentage of pedestrians in the crosswalk at the end of the all red in Las Vegas.
Discussion
The increased use of the call buttons after installation of the countdown signals points to an increase in safe pedestrian behavior as a result of the pedestrian countdown signals. The increase in call button pushing was anticipated because the pedestrians receive more feedback when they press the button.

Final System Impact Report January 2009
40
The results from the Las Vegas study team were mixed. While Las Vegas found a 29 percent increase in pedestrians beginning their crossings during the WALK phase and a consistent low level of pedestrians violating the signal (5 percent), they measured a substantial (19 percent) increase in pedestrians that were still in the crosswalk at the end of the flashing DON’T WALK. Two of the crosswalks at this intersection were very long, requiring pedestrians to cross 10 lanes within 22 seconds. The Las Vegas researchers noted that this was not enough time for some pedestrians to cross which may account for some of the high percent of pedestrians in the crosswalk at the end of the flashing DON’T WALK in the before (31 percent) and after cases (50 percent), but it is still unknown what the reasons were for the combination of shifts seen in pedestrian crossings between the before and after conditions.
The Las Vegas study team also measured pedestrians’ looking behavior before crossing and found a large (23 percent) increase in the percent of pedestrians that looked before crossing the street. It is possible that the animated eyes incorporated into the countdown signal deployed by Las Vegas led pedestrians to be more watchful when crossing the street.
In summary, the pedestrian countdown signal appears to be an effective and low cost way to increase safe pedestrian behavior.
Call Buttons that Confirm the Press Call buttons that confirm the press consist of a pedestrian stainless steel push button with a piezo driven solid state switch that provides two types of feedback when the push button is pressed. First, the button is illuminated with a 1200 millicandela red light emitting diodes (LED) for 0.1 second (Figure 23). Second, a 2.6 kHz tone is sounded simultaneously with the LED flash when the button is pressed and a 2.3kHz tone is sounded when the button is released. The device could also be modified so the light remains on until the onset of the “WALK” indication. The audio and visual feedback helps to ensure that the feedback will be detected by pedestrians even with bright sunlight.
As reported by the Miami team, the cost for each pedestrian push button was $105.00. The installation cost was $40.00 per call button for a total cost of $145.00 per installed button.
Figure 23. Call Buttons Tested in Miami

Final System Impact Report January 2009
41
Deployment Locations
The Las Vegas study team deployed the push button that confirms press at all four crosswalks of the intersection of Fremont Street and 7th Street. Fremont Street is a minor arterial where pedestrian safety issues include not using the crosswalks, a high percentage of elderly pedestrians involved in crashes, and pedestrians failing to yield. In Miami, the buttons were installed at 17 intersections but data were collected at only two intersections: 41st Street & Pine Tree Drive and Alton Road & 16th Street. Call buttons that confirm the press were installed only at the crosswalks across 41st Street and Alton Road, whereas in Las Vegas, call buttons that confirm the press were installed for all four crosswalks at the study site. The study sites are summarized in Table 36.
Table 36. Call Buttons that Confirm the Press Study Sites
Location Study Sites Site Description
41st St. and Pine Tree Dr.
Multilane arterial with bi-directional ADT of 39,000 . Miami
Alton Road and 16th St. Multilane arterial with bidirectional ADT of 46,000.
Las Vegas Fremont St and 7th St. Minor arterial, commercial land use area with hotels and casinos. Speed limit of 25 mph on Freemont. 4-legged intersection. ADT on Fremont Street is 13,800 (2006).
Measures of Effectiveness (MOEs)
The teams used a variety of MOEs to assess the effectiveness of the call buttons that confirm the press. Call buttons that confirm the press give pedestrians feedback to let them know that the button is operating and that the signal is responding to their request. This is likely to increase confidence in pedestrians that the signal system is serving their needs as well as the motorists’ needs. This is expected to lead to an increase in push button use by pedestrians as well as fewer signal violations by pedestrians. Because pedestrians are waiting for the WALK to cross, there should also be fewer pedestrians trapped in the roadway.
The specific MOEs used to assess the effectiveness of the call buttons that confirm the press are shown in Table 37. MOEs considered to be critical in assessing the effectiveness of the buttons include the frequency of pedestrian signal violations and the percent of cycles in which the button had been pushed. Other important MOEs include the frequency of pedestrians crossing during the WALK and pedestrians trapped.
Table 37. Measures of Effectiveness for Call Buttons that Confirm the Press
Location Measure of Effectiveness
Miami LV
% of cycles in which call button has been pushed √
Frequency of pedestrian signal violation √ √
Pedestrians crossing during the WALK √ √
Pedestrians trapped √ √

Final System Impact Report January 2009
42
Summary/Analysis of Results
The Miami study team measured the percent of signal cycles in which the call button was pressed when there was a pedestrian present with the opportunity to press the button. The results in Table 38 below show a significant increase in the call button presses across both Miami sites.
Table 38. Percent of Signal Cycles Call Button was Pressed
% Cycles Call Button Pressed Location Site
Before After
% Change p-value
41st St. and Pine Tree Dr. 33.8
(n = 420) 58.1
(n = 570) +24.3 0.01
Miami Alton Road and 16th St.
41.8 (n = 600)
54.2 (n = 810)
+12.4 0.01
The percent of pedestrian signal violations was defined differently in Miami and Las Vegas. The Miami study team used a stricter definition of pedestrian signal violation such that any crossing that began outside of the WALK phase was considered a violation. In Las Vegas, a violation was recorded only when the pedestrian began crossing when the solid red hand was displayed on the pedestrian head. The before and after results of the pedestrian signal violations are shown in Table 39. The results below show significant decreases in the percentage of pedestrians violating the signal across both definitions of violation in both Miami and Las Vegas.
Table 39. Percent of Pedestrians Violating Signal
% Pedestrians that Began Their Crossing outside of
the WALK Phase Location Site
Before After
% Change p-value
41st St. and Pine Tree Dr. 70.4
(n = 879) 52.6
(n = 1044) -17.8 0.01
Miami Alton Road and 16th St.
59.7 (n = 1577)
51.7 (n = 2490)
-8 0.01
% Pedestrians that Began Their Crossing during the Solid DON’T WALK Phase Location Site
Before After
% Change
p-value
Las Vegas Fremont St.: 6th St. to 8th St. 14
(n = 437) 9
(n = 275) -5 <0.05

Final System Impact Report January 2009
43
The Miami and Las Vegas study teams both looked at the impact that the call buttons that confirm press had on pedestrians beginning to cross during the WALK phase. This is a similar measure to the percent of pedestrians violating the signal, although it is not quite the inverse of this measure in either the Miami or Las Vegas studies. Miami measured the percent of pedestrians who pushed the call button that waited to cross during the WALK phase. This is more restrictive than the measure used by the Las Vegas team where any pedestrian crossing during the WALK phase was counted, not just those that pushed the button. The results are shown in Table 40.
The results from Miami show a significant increase in the percent of pedestrians who press the button that wait to cross until the WALK phase. Las Vegas actually measured an insignificant decrease in the percent of pedestrians that crossed during the WALK phase. The percent of pedestrians beginning to cross during the WALK phase was fairly high (79 percent) before the push button was installed, so it may be that all of the pedestrians that would be persuaded to push the button by this new countermeasure were already doing so.
Table 40. Pedestrians Crossing during the WALK Phase
% Pedestrians who Pressed Button that
Waited for WALK Phase Location Site
Before After
% Change p-value
41st St. and Pine Tree Dr. 51.2
(n = 142) 72.5
(n = 331) +21.3 0.01
Miami Alton Road and 16th St.
82.1 (n = 248)
85.9 (n = 439)
+3.8 0.05
% Pedestrians that Begin Crossing during the
WALK Phase Location Site
Before After
% Change p-value
Las Vegas Fremont St.: 6th St. to 8th St. 79
(n = 202) 71
(n = 248) -8 >0.05
Both study teams found a small decrease in the percent of signal cycles that pedestrians were trapped in the roadway although that decrease was significant in only two of the three intersections studied (Table 41). Since pedestrians get trapped in the roadway often when they begin crossing late in the cycle, a decrease would be reasonable given the corresponding increase in pedestrians beginning their crossings during the WALK phase.
For this MOE, both the Miami and Las Vegas research teams scored a pedestrian as trapped if the pedestrian had to wait at least 5 seconds before finishing crossing in the middle of the road, at the centerline, or between lanes because of through traffic or a string of turning vehicles. Miami measured the percent of cycles in which a pedestrian crossed that a pedestrian was trapped. In Miami, the percentage of cycles that a pedestrian was trapped was computed by dividing the number of times a pedestrian was trapped in the road by the number of cycles that a

Final System Impact Report January 2009
44
pedestrian crossed. Alternatively, Las Vegas looked at the percent of crossing pedestrians that were trapped.
Table 41. Pedestrians Trapped in the Roadway
% Cycles Pedestrians Trapped in the Roadway Location Site
Before After
% Change p-value
Miami 41st St. and Pine Tree Dr. 3.8
(n = 420) 3.1
(n = 570) -0.7 >0.05
Miami Alton Road and 16th St. 4.7
(n = 600) 2.4
(n = 810) -2.3 0.025
% Pedestrians Trapped in the Roadway Location Site
Before After
% Change p-value
Las Vegas Fremont St.: 6th St. to 8th St. 2
(n = 437) 0.4
(n = 275) -1.6 <0.05
Discussion
The call button that confirms press shows a fairly strong positive impact on safe pedestrian behaviors in both Miami and Las Vegas. Out of all three intersections tested, the data indicate a significant decrease in pedestrian signal violations. The Miami study team found a significant increase in button pushing behavior and the percent of pedestrians who pushed that call button that waited to cross until the WALK phase. Additionally, two out of three intersections studied showed a significant decrease in pedestrians trapped in the roadway. Given these findings, the call button that confirms press has been demonstrated to be a cost-effective way to increase safe pedestrian behavior. It was difficult to see the LED light in bright Florida sunlight. It appeared that the auditory feedback was more critical to the efficacy of the device. In areas with less bright sunlight the pilot light might be more salient. These buttons might also be useful to visually impaired pedestrians because they confirm the button press. However, accessible call buttons with a locator tone would be preferred when taking into account the needs of visually impaired pedestrians.
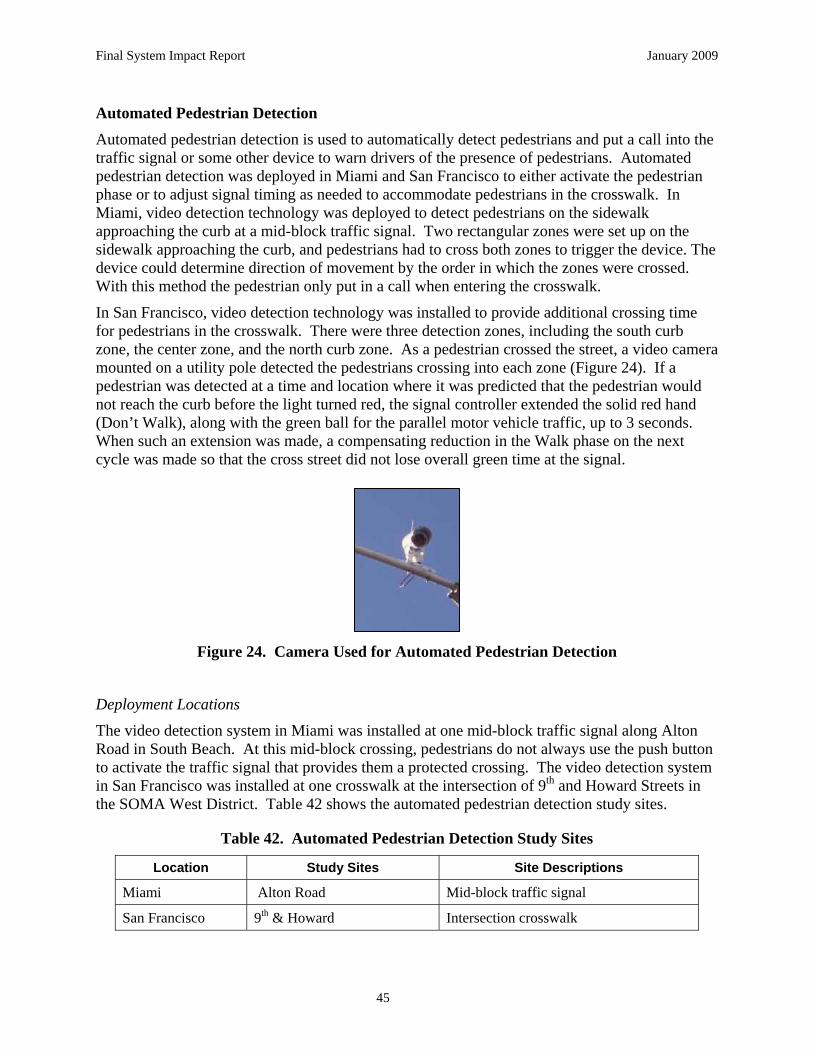
Final System Impact Report January 2009
45
Automated Pedestrian Detection Automated pedestrian detection is used to automatically detect pedestrians and put a call into the traffic signal or some other device to warn drivers of the presence of pedestrians. Automated pedestrian detection was deployed in Miami and San Francisco to either activate the pedestrian phase or to adjust signal timing as needed to accommodate pedestrians in the crosswalk. In Miami, video detection technology was deployed to detect pedestrians on the sidewalk approaching the curb at a mid-block traffic signal. Two rectangular zones were set up on the sidewalk approaching the curb, and pedestrians had to cross both zones to trigger the device. The device could determine direction of movement by the order in which the zones were crossed. With this method the pedestrian only put in a call when entering the crosswalk.
In San Francisco, video detection technology was installed to provide additional crossing time for pedestrians in the crosswalk. There were three detection zones, including the south curb zone, the center zone, and the north curb zone. As a pedestrian crossed the street, a video camera mounted on a utility pole detected the pedestrians crossing into each zone (Figure 24). If a pedestrian was detected at a time and location where it was predicted that the pedestrian would not reach the curb before the light turned red, the signal controller extended the solid red hand (Don’t Walk), along with the green ball for the parallel motor vehicle traffic, up to 3 seconds. When such an extension was made, a compensating reduction in the Walk phase on the next cycle was made so that the cross street did not lose overall green time at the signal.
Figure 24. Camera Used for Automated Pedestrian Detection
Deployment Locations
The video detection system in Miami was installed at one mid-block traffic signal along Alton Road in South Beach. At this mid-block crossing, pedestrians do not always use the push button to activate the traffic signal that provides them a protected crossing. The video detection system in San Francisco was installed at one crosswalk at the intersection of 9th and Howard Streets in the SOMA West District. Table 42 shows the automated pedestrian detection study sites.
Table 42. Automated Pedestrian Detection Study Sites
Location Study Sites Site Descriptions
Miami Alton Road Mid-block traffic signal
San Francisco 9th & Howard Intersection crosswalk

Final System Impact Report January 2009
46
Measures of Effectiveness
The field teams collected a variety of MOEs to test the impacts of the pedestrian detection technology on pedestrian safety and mobility, depending on the purpose of the pedestrian detection. These MOES are shown in Table 43. In Miami, the purpose of the pedestrian detection was to detect pedestrians at the curb before they entered the crosswalk, putting a call into the traffic signal controller to provide a WALK for the pedestrians and a red light for the roadway motor vehicle traffic.
In San Francisco, the purpose of the pedestrian detection was to extend the walk time for pedestrians still in the crosswalk late in the clearance phase. MOEs considered to be critical to assessing the automated pedestrian detection in this study were pedestrian clearance and pedestrian-vehicle conflicts.
Table 43. Measures of Effectiveness for Automated Pedestrian Detection
Location Measure of Effectiveness
Miami SF
% of cycles where a pedestrian was trapped in the roadway √ √
% of pedestrians crossing entire crosswalk during the WALK √ √
% of pedestrians that cleared crosswalk during flashing DON’T WALK √
% of pedestrians that cleared crosswalk during red hand √
% of pedestrians pressing the call button √
% of pedestrians crossing during the WALK √
% of pedestrians crossing 2nd half of crosswalk during the WALK √
% of pedestrians crossing none of the crosswalk during the WALK √
% vehicle-pedestrian interactions √
% of cycles with pedestrian-vehicle conflicts √ √
Pedestrian delay √
% of diverted pedestrians √
Note: Miami broke down those pedestrians not crossing entirely on the WALK into two groups: 1) those that benefited from the WALK call put in by automatic detection for the second half of the crossing (last two lanes), and 2) those that did not benefit at all because they finished the crossing before the WALK (crossed none of the crosswalk during the WALK).

Final System Impact Report January 2009
47
Summary/Analysis of Results
There were no significant impacts on pedestrian clearance at the intersection crosswalk in San Francisco or at the mid-block crosswalk in Miami where pedestrian detection was installed. There were significant reductions in pedestrians being trapped in the roadway in the mid-block crosswalks in Miami, as shown in Table 44, but not in San Francisco (there were no pedestrians trapped in either the baseline or post deployment in San Francisco). After the pedestrian detection was installed, the Miami team measured a 9 percent reduction in the percentage of cycles where a pedestrian was trapped.
Table 44. Pedestrians Trapped in the Roadway
% of Cycles Where Pedestrian is Trapped / % Pedestrians Trapped Location Site
Before After
% Change p-value
Miami Alton Road mid-block crossing (cycles) 17 8 -9 0.0453
San Francisco 9th & Howard (pedestrians) 0 0 0 NA
There was a very low incidence of pedestrian-vehicle conflicts both before and after installation of the pedestrian detection in Miami and San Francisco, and there were no significant impacts of the pedestrian detection systems on the other MOEs collected by the teams.
Discussion
The only significant finding, a 9 percent reduction in the percentage of pedestrians trapped in the roadway at the Miami study intersection, suggests that pedestrians may have been making safer crossings; however, there were no measurable impacts of the pedestrian detection systems on pedestrian clearance or conflicts with motor vehicles. The San Francisco team did note that the technology appeared to be a promising, but needed further testing and refinement
Activated Flashing Beacons
Activated flashing beacons are used to alert drivers to a pedestrian crossing in the crosswalk ahead and to encourage pedestrians to cross at the crosswalk. This countermeasure consists of flashing yellow lights at a crosswalk that are either activated by the pedestrian pushing a button at the curb or by an automated pedestrian detection device. In Las Vegas, the flashing yellow lights were over the crosswalk on a mast arm and included downward lighting above the crosswalk, as shown in Figure 25. The lights were activated by a pedestrian pushing a button at the curb. The flashing yellow lights used in San Francisco were mounted on poles located on the side of the road at the crosswalk, as shown in Figure 26. A push button was used for activation at one site (16th & Capp) in San Francisco and automated detection with infrared sensors was used for the other site (Mission & Santa Rosa). The infrared sensors were installed on the curb using both an above ground bollard and an in-surface activation device, as shown in Figure 27.
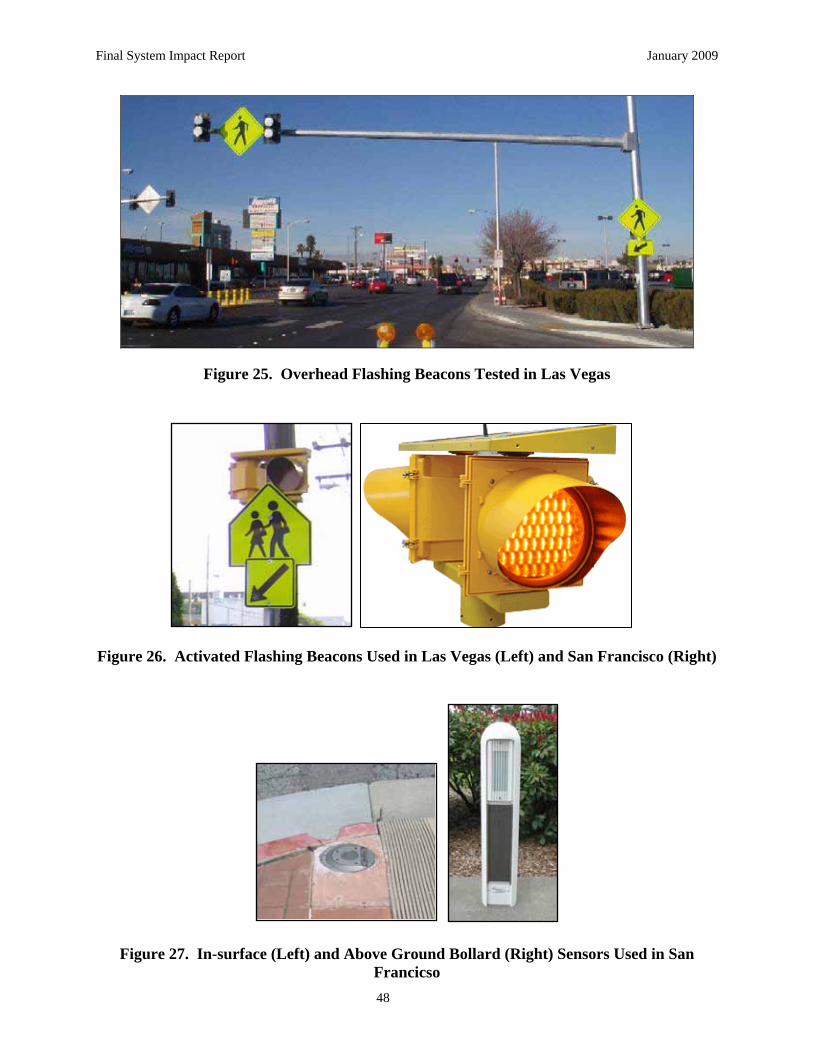
Final System Impact Report January 2009
48
Figure 25. Overhead Flashing Beacons Tested in Las Vegas
Figure 26. Activated Flashing Beacons Used in Las Vegas (Left) and San Francisco (Right)
Figure 27. In-surface (Left) and Above Ground Bollard (Right) Sensors Used in San Francicso

Final System Impact Report January 2009
49
Deployment Locations
The activated flashing beacon study sites are described in Table 45. In Las Vegas, the activated flashing beacon was deployed at the unsignalized intersection of Maryland Parkway and Dumont Street, a primarily commercial area with shopping complexes and a shopping mall. Maryland Parkway is a major arterial with a speed limit of 30 mph and an ADT of 43,000. Dumont Street is a minor arterial with a posted speed limit of 25 mph. The activated flashing beacons and push buttons were installed for pedestrians crossing either direction across Maryland Parkway.
The flashing beacons were installed in the third stage of a three-stage pedestrian safety improvement effort at that intersection. Prior to the installation of flashing beacons, the following countermeasures were deployed: Danish offset, median refuge, high-visibility crosswalk, and advance yield markings with a vehicles-must-yield-to-pedestrians sign.
In San Francisco, the activated flashing beacon was tested at two intersections. Two types of flashing beacons were studied at two intersections. At 16th & Capp, the beacon was push button activated and at Mission & Santa Rosa it was activated by infrared automatic detection.
The countermeasure was deployed at 16th and Capp for pedestrians crossing 16th at a marked intersection on the west side. The second deployment site was Mission and Santa Rosa for the marked crosswalk over Mission on the north side of the intersection. Advanced stop lines were also installed at both sites in San Francisco. The lines were installed on at the Mission and 16th approaches. The intersection of 16th and Capp additionally received an in-street pedestrian yield sign.
Table 45. Activated Flashing Beacons Study Sites
Location Study Sites Site Descriptions
Las Vegas Maryland Pkwy & Dumont
A 4-legged intersection in a commercial area. Maryland Parkway is a major arterial with a speed limit of 30 mph and an ADT of 43,000.
16th & Capp A 4-legged intersection in a mixed land use area near a transit station and school. Capp is stop-controlled. There are 3 through lanes on 16th and 2 through lanes on Capp at the intersection. The speed limit is 25 mph.
San Francisco
Mission & Santa Rosa
A 3-legged intersection in a mixed residential and commercial area with a 25 mph speed limit. There are 4 through lanes on Mission and 2 through lanes on Santa Rosa at the intersection.

Final System Impact Report January 2009
50
Measures of Effectiveness
The Las Vegas and San Francisco study teams collected a variety of MOEs to test the impacts of the activated flashing beacons on pedestrian safety and mobility, as well as driver mobility, as shown in Table 46. Activated flashing beacons were expected to reduce vehicle-pedestrian conflicts, to increase the number of drivers that yield to pedestrians, as well as to increase the number of pedestrians that cross within the designated crosswalk. It was also expected that this countermeasure would help reduce pedestrian delay due to increase driver yielding. The countermeasure was not expected to significantly increase driver delays. Measures of effectiveness considered critical for assessing activated flashing beacons were percent of pedestrian-vehicle conflicts, percent of drivers yielding to pedestrians, distance drivers yield before crosswalks, and percent of diverted pedestrians. Other important MOEs are also included in Table 46.
Table 46. Measures of Effectiveness for Activated Flashing Beacons
Location Measure of Effectiveness
LV SF % of diverted pedestrians √ √
% of pedestrians trapped in the roadway √ √
% of drivers yielding to pedestrians √ √
Distance drivers yield before crosswalk √ √
Average pedestrian delay √ √
Average vehicle delay √
% pedestrian-vehicle conflicts √
Summary/Analysis of Results
To assess the effectiveness of the activated flashing beacons on pedestrian safety, the teams measured the percent of diverted pedestrians, or the percentage of pedestrians that modified their paths to use the crossing with the flashing beacons, and that walked out of their way to do so. The results of this measure are presented in. The only significant result shows a decrease in the percent of diverted pedestrians, a counterintuitive result. Table 47.

Final System Impact Report January 2009
51
Table 47. Diverted Pedestrians
% of Diverted Pedestrians Location Site
Before After % Change p-value
Las Vegas Maryland Pkwy & Dumont
11 (n = 198)
23 (n = 452)
+12 <0.01
San Francisco 16th & Capp 16.1
(n = 372) 16.4
(n = 324) -0.3 0.92
San Francisco Mission & Santa Rosa 19.1
(n = 319) 9.5
(n = 327) -9.6* <0.01
*Counterintuitive result
The study teams also measured the percent of pedestrians that were trapped in the roadway before and after the flashing beacons were installed. Although all three sites showed a decrease, only one site had a statistically significant decrease in the percent of pedestrians trapped as presented in Table 48.
Table 48. Trapped Pedestrians
% of Pedestrians Trapped in the Roadway Location Site
Before After % Change p-value
Las Vegas Maryland Pkwy & Dumont
4 (n = 198)
1.3 (n = 452)
-2.7 >0.05
San Francisco 16th & Capp 1.3
(n = 372) 0
(n = 120) -1.3 0.34
San Francisco Mission & Santa Rosa 4.1
(n = 319) 0
(n = 327) -4.1 <0.01
The study teams also assessed the impact of the activated flashing beacons on driver yielding, and the results are shown in Table 49. The Las Vegas study team measured no change in the percent of drivers yielding to pedestrians; however, this follows several increases in yielding measured in the first two phases of pedestrian safety countermeasure installations at the Maryland Parkway and Dumont intersection. Figure 28 and Figure 29 show the results of the driver yielding measured at the two San Francisco sites. At these sites, the San Francisco team recorded drivers yielding to all pedestrians (“full yield), drivers yielding to some, but not all pedestrians (“partial yield”), and drivers not yielding. At both sites there was a significant increase in the percent of drivers fully yielding to pedestrians and a corresponding drop in drivers that did not yield.
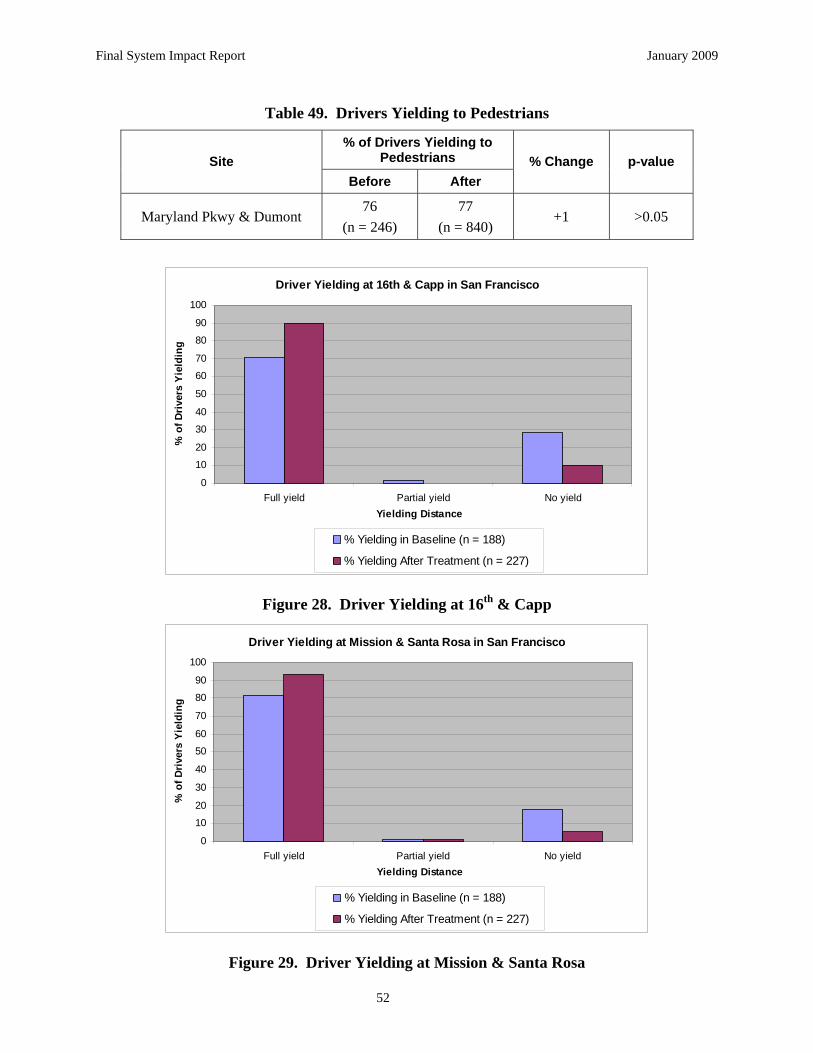
Final System Impact Report January 2009
52
Table 49. Drivers Yielding to Pedestrians
% of Drivers Yielding to Pedestrians Site
Before After % Change p-value
Maryland Pkwy & Dumont 76
(n = 246) 77
(n = 840) +1 >0.05
Driver Yielding at 16th & Capp in San Francisco
0
10
20
30
40
50
60
70
80
90
100
Full yield Partial yield No yieldYielding Distance
% o
f Dri
vers
Yie
ldin
g
% Yielding in Baseline (n = 188)
% Yielding After Treatment (n = 227)
Figure 28. Driver Yielding at 16th & Capp
Driver Yielding at Mission & Santa Rosa in San Francisco
0
10
20
30
40
50
60
70
80
90
100
Full yield Partial yield No yieldYielding Distance
% o
f Dri
vers
Yie
ldin
g
% Yielding in Baseline (n = 188)
% Yielding After Treatment (n = 227)
Figure 29. Driver Yielding at Mission & Santa Rosa

Final System Impact Report January 2009
53
The effects of the activated flashing beacon on the distance from the crosswalk that drivers yielded are shown in Figure 30. The Las Vegas team grouped drivers yielding less than 10 feet from the crosswalk, between 10 and 20 feet, and greater than 20 feet from the crosswalk. The Las Vegas results show a substantial decrease in the percentage of drivers yielding closer to the crosswalk (less than 10 feet) (p<0.001). The results also show significant increases in the percentage of drivers yielding 10 to 20 feet away and in drivers yielding more than 20 feet away (p<0.001 and p<0.05, respectively).
Driver Yielding Distances at Maryland Parkway & Dumont
0
10
20
30
40
50
60
70
80
90
100
< 10ft 10 - 20 ft >20 ftYielding Distance
% o
f Driv
ers
Yie
ldin
g
% Yielding in Baseline (n = 188)
% Yielding After Treatment (n = 645)
Figure 30. Driver Yielding Distances at Maryland Parkway & Dumont The San Francisco team looked at drivers yielding less than 5 feet from the crosswalk, between 5 and 10 feet, and greater than 10 feet from the crosswalk. The team’s results are presented in Figure 31 and Figure 32. At the intersection of 16th and Capp, there were significant increases in yielding farther from the crosswalk, whereas at Mission and Santa Rosa, there were significant increases in yielding closer to the crosswalk. Data collected at Mission and Santa Rosa may have been impacted by observation errors due to a poor camera angle.

Final System Impact Report January 2009
54
Driver Yielding Distances at 16th & Capp in San Francisco
0
10
20
30
40
50
60
70
80
90
100
< 5ft 5 - 10 ft >10 ftYielding Distance
% o
f Dri
vers
Yie
ldin
g
% Yielding in Baseline (n = 332)
% Yielding After Treatment (n = 273)
Figure 31. Driver Yielding Distances at 16th & Capp
Driver Yielding Distances at Mission & Santa Rosa in San Francisco
0
10
20
30
40
50
60
70
80
90
100
< 5ft 5 - 10 ft >10 ftYielding Distance
% o
f Driv
ers
Yie
ldin
g
% Yielding in Baseline (n = 257)
% Yielding After Treatment (n = 317)
Figure 32. Driver Yielding Distance at Mission & Santa Rosa
Significant decreases were measured in pedestrian delay at both study intersections in San Francisco as shown in Table 50. There was a non-significant increase in pedestrian delay at the Las Vegas site.

Final System Impact Report January 2009
55
Table 50. Average Pedestrian Delay
Average Pedestrian Delay (sec) Location Site
Before After Change p-value
Las Vegas Maryland Pkwy & Dumont
7.46 (n = 198)
8.12 (n = 452)
+0.66 >0.05
San Francisco 16th & Capp 4.8
(n = 372) 3.2
(n = 365) -1.6 <0.01
San Francisco Mission & Santa Rosa 4.4
(n = 319) 2.9
(n = 327) -1.5 <0.01
The Las Vegas team measured vehicular delay at the activated flashing beacon site. The results are shown in Table 51. Overall, vehicle delay was reduced by almost 3 seconds at the Maryland Parkway and Dumont intersection.
Table 51. Average Vehicle Delay
Average Vehicle Delay (sec) Location Site
Before After Change p-value
Las Vegas Maryland Pkwy & Dumont
3.81 (n = 246)
1.25 (n = 1633)
-2.56 <0.01
The percent of pedestrian-vehicle conflicts decreased significantly after the activated flashing beacon was implemented at both intersections in San Francisco as shown in Table 52.
Table 52. Pedestrian-Vehicle Conflicts
% Pedestrian-Vehicle Conflicts Location Site
Before After Change p-value
San Francisco 16th & Capp 6.7
(n = 372) 0.8
(n = 120) -5.9 <0.01
San Francisco Mission & Santa Rosa 6.1
(n = 312) 2.9
(n = 335) -3.2 0.05
Discussion
Results from the San Francisco and Las Vegas study teams show mixed impacts from the deployment of activated flashing beacons. There were some clear improvements in safe driver behaviors in San Francisco. Driver yielding increased significantly at both intersections, and pedestrian-vehicles conflicts decreased. Pedestrian mobility, as measured through pedestrian delay, improved significantly. At Mission and Santa Rosa, there were some counterintuitive results such as a decrease in yielding distance and a decrease in the percentage of pedestrians that walk out of their way to use the crosswalk.

Final System Impact Report January 2009
56
In Las Vegas, the activated flashing beacons generally did not result in significant changes in driver behaviors. Driver yielding decreased by a surprising 62% along with a significant decrease in driver delay. Those drivers that did yield, yielded at a greater distance from the crosswalk.
Rectangular Rapid Flashing Beacon The rectangular rapid flashing beacon (RRFB) is used to supplement standard pedestrian warning signs. The apparatus tested consisted of two LED flashers placed on either side of the pedestrian warning sign, as shown in Figure 33. The flashers were each 6 inches wide and 2.5 inches high, were placed 9 inches apart, and were visible to both directions of traffic. The two LEDs flashed in a wig-wag (left-right) pattern. The flash pattern consisted of the left LED flashing two times (in a slower type of a rapid flash). Each time the left LED was energized, it was followed by the right LED, which flashed in a very fast rapid three flash volley. There were a total of 190 flashes per 30-second cycle. The device was activated by pedestrians pushing call buttons. Four signs were installed at each crosswalk, and the devices were linked by radio frequency transponders so a depression of any of the pedestrian call buttons activated the flashers on all four signs. A separate LED facing the pedestrian notifies him or her that the device has been activated, and an audible message reinforces the visual cue to the pedestrian.
Figure 33. RRFB in Miami
Deployment Locations
The Miami team evaluated the RRFB at two multilane crosswalks in Miami, Florida under FHWA permission to experiment (Table 53). A reversal design was employed in this experiment to demonstrate experimental control at each site. At the South Bayshore Drive crosswalk a sign was placed on the left side of each approach and on the right side of each approach at the median island. At the NW 67th Street site a sign along with beacons was placed on the left side of each approach and on the right side at a median just after the crosswalk on the northbound approach and before the crosswalk on the southbound approach.

Final System Impact Report January 2009
57
Table 53. RRFB Study Sites
Location Study Sites Site Descriptions
NW 67th St. & Main Street
The crosswalk on NW 67th Street in Miami Lakes traversed two lanes in the southbound direction and two lanes and a turning lane in the northbound direction. There was no median island at this location. The two-way ADT on NW 67th Street was 25,215. The posted speed limit at the crosswalk was 40 mph.
Miami
South Bayshore Drive & Darwin
The crosswalk on South Bayshore Drive in Coconut Grove traversed two lanes in the southbound direction and two lanes in the northbound direction. A median island that included a cut for pedestrians separated traffic in both directions at this location. The two-way ADT on South Bayshore Drive was 38,996. The posted speed limit at the crosswalk was 35 mph.
Measures of Effectiveness
The Miami study team collected a variety of MOEs to test the impacts of RRFBs on pedestrian safety, as shown in Table 54. RRFBs were expected to reduce vehicle-pedestrian conflicts, to increase the number of drivers that yield to pedestrians, as well as to increase the number of pedestrians that cross within the designated crosswalk. Measures of effectiveness considered critical for assessing RRFBs are percent of pedestrian-vehicle conflicts, percent of drivers yielding to pedestrians, and percent of pedestrians trapped, as shown in Table 54.
Table 54. Measures of Effectiveness for Activated Flashing Beacons
Measure of Effectiveness Miami
% of pedestrians trapped in the roadway √
% of drivers yielding to pedestrians √
% pedestrian-vehicle conflicts √
The Miami team observed local resident crossings as well as staged crossings. Staged crossings always followed a specific crossing protocol. First, the pedestrian placed one foot in the crosswalk when an approaching vehicle was just beyond the cone placement distance (this is the measured distance for the vehicle speed, which ensures a safe stopping distance for vehicles traveling at the posted speed). If the vehicle made no attempt to stop, the pedestrian did not proceed to cross and scored the vehicle and any subsequent vehicles as not yielding. If the vehicle clearly began to yield and the next lane was free, the staged pedestrian would begin crossing. The staged pedestrian always stopped at the lane line and make sure the next lane was clear. If a large gap appeared the staged pedestrian finished the crossing. This is essentially the protocol followed by police officers when they conduct pedestrian crossing enforcement sting operations. This protocol insures the safety of the staged pedestrians. Residents were only scored if they initiated a crossing in the same manner as the staged pedestrian by placing at least one foot in the crosswalk. Pedestrians that did not place a foot into the crosswalk were not scored

Final System Impact Report January 2009
58
because according to the Florida Statutes, drivers are not required to yield unless the pedestrian is in the crosswalk.
Summary / Analysis of Results
The results showed that the RRFBs produced a marked increase in yielding behavior at both crosswalks and that similar data were collected from staged pedestrians and local residents using the crosswalks (Table 55 through Table 57). Data also indicated that the use of the device produced a reduction in evasive conflicts between drivers and pedestrians at both sites and a reduction in the percentage of pedestrians trapped in the center of the road at the crosswalk without a median island.
Table 55. Staged Daytime Crossings
% Drivers Yielding Location Site
Before After % Change
Miami NW 67th & Main Street 4.2
(n = 2330) 55.2
(n = 2131) +51
Miami S Bayshore & Darwin 4.1
(n = 2075) 60.1
(n = 1361) +56
Table 56. Staged Nighttime Crossings
% Drivers Yielding Location Site
Before After % Change
Miami NW 67th & Main Street 4.4
(n = 703) 69.8
(n = 223) +65.4
Miami S Bayshore & Darwin 2.5
(n = 139) 66
(n = 225) +63.5
Combining the daytime and nighttime measured yielding at NW 67th & Main Street, an analysis of variance showed a p-value of 0.01 (F = 256.12) (a significant increase in driver yielding). Combining the daytime and nighttime measured yielding at S. Bayshore & Darwin, an analysis of variance showed a p-value of 0.01 (F = 467.9) (a significant increase in driver yielding).

Final System Impact Report January 2009
59
Table 57. Resident Crossings
% Drivers Yielding Location Site
Before After % Change p-value
Miami NW 67th & Main Street 12.5
(n = 137) 73.7
(n = 259) +61.2 0.001
Miami S Bayshore & Darwin 5.4
(n = 200) 83.4
(n = 111) +78 0.001
An analysis of variance of the resident crossings at NW 67th & Main Street showed a p-value of 0.01 (F = 53.18), a significant increase in driver yielding to local resident crossings. An analysis of variance of the resident crossings S Bayshore & Darwin showed a p-value of 0.01 (F = 148.85), a significant increase in driver yielding to local resident crossings.
The percentage of evasive conflicts at the crosswalk on NW 67th Street averaged 11 percent during the baseline condition and declined to 2.5 percent during the first treatment condition and tended to remain lower for the remainder of the study independent of the condition. The percentage of evasive conflicts at the crosswalk on South Bayshore Drive averaged 5.5 percent at the crosswalk at this site during the baseline condition and declined to 0 percent during the first treatment condition. In general returns to baseline were associated with increased conflicts while returns to the treatment condition were associated with declines in conflicts at this site. An analysis of variance of the conflicts showed a p-value < 0.05 (F = 6.63) and < 0.01 (F = 13.85) for NW 67th & Main and at Bayshore & Darwin, respectively, which indicates a significant decrease in evasive conflicts was observed in the flasher condition at both sites.
Pedestrians were trapped at the centerline at NW 67th Street during 44 percent of the crossing during the baseline condition. The percentage of pedestrians trapped declined to 0.5 percent after the rapid flash beacon treatment was introduced. This change was replicated each time treatment was introduced and removed at this site, with a high percentage of pedestrians trapped when the treatment was absent and few pedestrians trapped when the treatment was present. An analysis of variance shows a p-value of < 0.01, which indicates that a significant decrease in trapped pedestrians was observed in the flasher condition
Discussion
The results of this study showed that the use of the RRFBs increased yielding to staged pedestrians and local residents. The similar results for staged and resident pedestrians validated the use of staged pedestrian methodology to determine levels of yielding and to evaluate the efficacy of treatments designed to increase yielding behavior. It was interesting that yielding to local residents was somewhat higher than yielding to staged pedestrians. This may be because staged pedestrians’ protocol was somewhat less assertive than the crossing method used by local residents.
The results of the study also showed clear safety benefits associated with the introduction of the pedestrian activated RRFB. One change was a reduction in the number of pedestrians trapped in the middle of the road at the crosswalk on NW 67th Street. Increases in driver yielding should be related to reductions in the number of pedestrians trapped in the center of the road. When drivers are forced to cross busy roads in gaps because of poor yielding behavior they often can only get a gap to cross the first half. Once they are trapped in the roadway with vehicles passing

Final System Impact Report January 2009
60
in front and behind them they are likely to become uncomfortable and may as a result be less likely to select as good a gap to finish crossing.
The RRFB treatment reduces the percentage of people trapped by increasing driver yielding. The percentage of pedestrians trapped in the middle of the road was not measured at South Bayshore Drive because there was a wide median island in place. Essentially, crossing the second half of South Bayshore Drive was like beginning a new crossing from a place of relative safety.
The reduction of evasive conflicts at both sites was another safety finding. At the crosswalk on South Bayshore Drive the number of conflicts decreased each time the RRFB treatment was introduced and increased each time it was removed. At NW 67th Street the decrease in conflicts after the RRFB was introduced was maintained each time it was removed. This may have represented some type of learning effect on the part of motorists.
One reason why this device was so effective may be related to the salience of the flashing sequence. Another reason may be related to the direct correlation between the pedestrian sign and the flashing device. The flashing device likely produces driver orientation to the pedestrian sign and making it stand out from the clutter. The correlation between the flashing light and sign with the presence of a pedestrian crossing the street likely helps establish and maintain control of the sign over driver behavior.
While the RRFB treatment did not make it into the MUTCD Notice of Proposed Amendments, it has been given interim approval by FHWA.
Leading Pedestrian Interval (Pedestrian Head Start) The leading pedestrian interval is an exclusive pedestrian phase that gives pedestrians a small head start before vehicular turning movements begin (Figure 34). The pedestrian walk symbol is given a few seconds prior to the green light for parallel vehicle traffic. It is designed to give pedestrians a chance to enter the intersection before turning motorists, thereby increasing pedestrian visibility and correspondingly increasing driver yielding behavior and reducing conflicts. The leading pedestrian interval is thought to be most useful in intersections with high turning volumes and long crossing distances. The countermeasure may offer pedestrians more protection from left-turning vehicles rather than right-turning vehicles if right turn on red is permitted.
Leading pedestrian intervals were tested in both San Francisco and Miami. The length of the head start tested in San Francisco was 4 seconds, and the length of the head start tested in Miami was 3 seconds.

Final System Impact Report January 2009
61
Figure 34. Leading Pedestrian Interval Deployment Locations
The leading pedestrian interval study sites are shown in Table 58. San Francisco deployed and tested the leading pedestrian interval at four intersections with the leading interval given to pedestrians crossing a four-lane secondary street at all four intersections. Vehicles observed for the study were turning from the primary street onto the secondary street. In San Francisco, the primary streets that were studied were one-way with the exception of Mission. The Mission & 6th intersection was an intersection between two, two-way streets.
In Miami, the leading pedestrian interval was deployed at one 4-legged intersection, Alton & Lincoln, and one 3-legged intersection, Collins & 16th, in the South Beach area. At Collins & 16th, drivers frequently do not stop on red before turning right. Along Alton Road, turning drivers often do not yield to pedestrians in the crosswalk that have begun crossing at the WALK.
Table 58. Leading Pedestrian Interval Study Sites
Location Study Sites Site Descriptions Alton & Lincoln
4-legged intersection located in South Beach. Alton Rd. is 4-lane, with 35 mph speed limit and has approximately twice the traffic volumes than Collins Ave. Predominantly residential.
Miami
Collins & 16th 3-legged intersection located in the South Beach entertainment district. Collins is 4-lane, with 35 mph speed limit.
San Francisco Howard & 6th Howard & 8th Harrison & 10th Mission & 6th
All sites are located in commercial land use areas at 4-legged signalized intersections on streets with speed limits ranging from 25 – 30 mph on the primary street.

Final System Impact Report January 2009
62
Measures of Effectiveness
A variety of MOEs were used by the Miami and San Francisco study teams to assess the impact of the leading pedestrian interval on pedestrian and driver behavior. The primary purpose of the leading pedestrian interval is to increase driver yielding, a critical MOE used by both study teams. The leading pedestrian intervals are expected to have other benefits as well. By allowing pedestrians the opportunity to enter the crosswalk before vehicles begin turning, the leading pedestrian interval is expected to reduce vehicle-pedestrian conflicts, allow pedestrians to clear the crosswalk on time, improve pedestrian compliance with signals, increase the number of drivers that yield to pedestrians, and reduce pedestrian delay. These MOEs are shown in Table 59.
Table 59. Measures of Effectiveness for Leading Pedestrian Interval
Location Measure of Effectiveness
Miami SF
% of drivers yielding to pedestrians √ √
% of pedestrians in crosswalk after all-red phase √ √
% of cycles call button pressed √
% of cycles pedestrian-vehicle conflicts √
% of pedestrians crossing during first 4 seconds of WALK √
Pedestrian delay √
Pedestrian crossing time √
Summary/Analysis of Results
The San Francisco and Miami study teams both assessed left-turn driver yielding to pedestrians in the crosswalk although the measure used was slightly different between the two teams. In San Francisco, left turn yielding was measured by examining the percent of vehicles that turned left in front of pedestrians (i.e., non-yielding). In Miami, a driver was scored as yielding on a left-turn if he or she stopped or slowed and allowed the pedestrian to cross before completing his turn.
The results as shown in Table 60 indicate that there was a small, but significant decrease in drivers turning left in front of pedestrians in two of the three intersections in San Francisco. The lack of significant reduction in vehicles making left turns in front of pedestrians at Howard and 8th may be due to a couple of factors. Left-turners at this intersection share a lane with through vehicles which will cause left-turners some delay in making a left turn after the light has turned green if they are not first in line at a red light. This delay may already give pedestrians an advantage in crossing even without the leading pedestrian interval. Additionally, the Howard and 8th intersection experiences a low volume of vehicles allowing traffic queues to clear the intersection before the next phase. This may allow some pedestrians to start to cross before their walk signal.

Final System Impact Report January 2009
63
At both intersections in Miami, significant increases in drivers yielding on left-turns were measured.
Table 60. Left-turn Driver Yielding
% Vehicles Turning Left in Front of Pedestrians (those not yielding) Location Site
Before After % Change p-value
Howard & 6th 5.6
(n = 1083) 1.5
(n = 1310) -4.1 <0.01
Howard & 8th 16.8
(n = 416) 15.4
(n = 488) -1.4 0.59
San Francisco
Harrison & 10th 4.1
(n = 1716) 2.5
(n = 836) -1.6 0.05
% of Left-turning Drivers Yielding During WALK Location Site Before After
% Change p-value
Alton & Lincoln 40
(n = 46) 58
(n = 194) +18 0.01
Miami Collins & 16th
22 (n = 59)
31 (n = 18)
+9 0.05
Both the San Francisco and Miami study teams assessed right-turn driver yielding to pedestrians in the crosswalk but in slightly different ways as was done with left turns. These results are shown in Table 61. The San Francisco team measured the percent of vehicles turning right in front of pedestrians at two intersections: Harrison & 10th and Mission & 6th. At Harrison & 10th, drivers on Harrison Street, a one-way street, turned right onto 10th Street, another one-way street. At Mission & 6th, drivers were observed turning right from Mission onto 6th Street. The Miami team measured the percent of right-turning drivers yielding to pedestrians in the crosswalk during the WALK phase at one 4-legged intersection of two-way roads. There was a significant increase in right-turn driver yielding at only one out of three sites observed for that measure.
The Miami and San Francisco teams both measured pedestrian clearance but the San Francisco team recorded pedestrians who were in the crosswalk after 3.5 seconds of all red whereas the Miami team recorded pedestrians who were in the crosswalk at the end of the all red phase. There were no statistically significant differences found between the before and after conditions. A mix of small increases and decreases in pedestrian clearance was measured for all of the intersections scored.

Final System Impact Report January 2009
64
Table 61. Right-turn Driver Yielding
% Vehicles Turning Right in Front of Pedestrians Location Site Before After
% Change p-value
Harrison & 10th 3.6
(n = 665) 6.2
(n = 321) +2.6* 0.07
San Francisco Mission & 6th
9.6 (n = 691)
5.2 (n = 290)
-4.4 0.02
*Counterintuitive result
% of Right-turning Drivers Yielding During WALK Location Site Before After
% Change p-value
Miami Alton & Lincoln 15
(n = 15) 15
(n = 45) 0 NA
The Miami study team measured the percent of cycles when a pedestrian was present that the call button was pressed, and the results are shown in Table 62. Significant increases in pedestrian push button pressing were observed within both study corridors, likely because pedestrians had learned that pressing the button would lead to the exclusive pedestrian phase.
Table 62. Pedestrians Pushing Call Button
% of Cycles Call Button Pressed Location Site
Before After % Change p-value
Alton & Lincoln 69
(n = 169) 76
(n = 431) +7 0.05
Miami Collins & 16th
36 (n = 781)
51 (n = 185)
+15 0.01
The Miami study team also examined the impact of the leading pedestrian interval on the percent of pedestrians crossing during the first 4 seconds of the WALK phase. The results are shown in Table 63. The results show a large, significant increase in the percent of pedestrians crossing in the beginning of the WALK phase (31 percent at Alton and Lincoln and 21 percent at Collins and 6th). The reason for the increase of pedestrians in the crosswalk at the start of the walk cycle is likely because the leading pedestrian interval eliminates left turning vehicles for the first few seconds of the walk phase reducing the number of pedestrians giving up the right of way to turning vehicles.

Final System Impact Report January 2009
65
Table 63. Pedestrians Crossing during Beginning of WALK Cycle
% of Pedestrians Crossing during first 4 sec of WALK Location Site
Before After % Change p-value
Alton & Lincoln 45.3
(n = 858) 76.5
(n = 1121) +31.2 0.01
Miami Collins & 16th
38 (n = 300)
59 (n = 109)
+21 0.01
The incidence of pedestrian and vehicle conflicts in Miami was very rare and there was no significant change in conflicts at the sites studied in San Francisco. There were no significant impacts on pedestrian delay or crossing time in San Francisco.
Discussion
The data from intersections in both San Francisco and Miami indicate that this is an effective countermeasure for increasing left-turn driver yielding to pedestrians in the crosswalk, although the magnitude of left-turn yielding was smaller in San Francisco than in Miami. This may be because yielding violations appear to be smaller in San Francisco and therefore there was less opportunity for improvement. This effect does not appear to carry over for right-turn driver yielding. The results also show that the leading pedestrian interval increases pedestrian call button pushes and the number of pedestrians that start to cross at the beginning of the cycle.
As noted by the Miami team, it is possible that the lack of increase in right-turn yielding may be due to the high frequency of right-turners who do not stop at a red light before turning in Miami and so the lengthened red time may not impact their yielding.
Prohibition of Permissive Left Turns This treatment involved reconfiguring the signal heads to eliminate permissive left turns. Two new signals were installed to show the additional phases, the signal timing needed to be adjusted, and a static sign indicating LEFT ON GREEN ARROW ONLY (R5-10 2003 MUTCD) (Figure 35) was installed. The approximate cost of deploying this countermeasure in Miami was $4000.
Figure 35. Static Sign Supporting the Prohibition of Permissive Left Turns

Final System Impact Report January 2009
66
Deployment Locations
One intersection in Miami, 41st and Pine Tree, received the treatment of prohibition of permissive left turns (Table 64). The prohibition was put into effect on the east and west directions of the intersection. The intersection is in a commercial area just west of the oceanfront. This location was chosen because of a history of motorist-pedestrian crashes wherein the motorist turned left into a crossing pedestrian. The primary street, 41st Street, is a two way street with two lanes in each direction and an ADT of 39,000 vehicles per day. Observations of this intersection were restricted to one leg, the westbound motorists turning left/south across the south crosswalk.
Table 64. Prohibition of Permission Left Turns Study Site
Location Study Site Site Descriptions Miami 41st & Pine Tree Four-legged, signalized intersection in a commercial land use area
close to the oceanfront. Primary street, 41st, has an ADT of 39,000 and has four lanes, with parking lanes on both sides of the street. History of motorist-pedestrian crashes wherein the motorist turned left into a crossing pedestrian.
Measures of Effectiveness The Miami study team collected data on the three countermeasures listed below to assess the effectiveness of prohibiting permissive left turns on pedestrian safety. Since the purpose of eliminating the permissive left turn is to reduce pedestrian and vehicle conflicts that occur when vehicles make left turns as pedestrians are crossing, the MOE considered most critical is the percent of cycles in which there are pedestrian-vehicle conflicts.
• % of pedestrians crossing during WALK
• % pedestrian-vehicle conflicts
Summary/Analysis of Results
Pedestrian signal compliance improved slightly following the elimination of the permissive left-turn phase (Table 65). However, the prevalence of left-turning motorists turning during the prohibited phase is a concern. These motorists, 15 percent of all left turners, turned after the left turn indication changed to red. The motorists were presumably more likely to violate the signal because they would have to wait until the next cycle as a result of the elimination of the permissive left turn phase. The researchers suggest that a lagging protected left turn phase may be more effective because it would allow many queued pedestrians to clear the intersection prior to the beginning of the protected left turn movement. One other important consideration regarding this countermeasure, motorist delay, was not measured.
The incidence of motorist-pedestrian conflicts was reduced at a statistically significant level following the elimination of the permissive left-turn phase (7 percent to 2 percent, p=0.014) (Table 67).

Final System Impact Report January 2009
67
Table 65. Pedestrians Crossing during WALK
% Pedestrians Crossing during WALK Site
Before After % Change p-value
41st & Pine Tree 84
(n = 2166) 86.7
(n = 789) +2.7 <0.001
Table 66. Vehicles Turning during Protected Left-turn Phase
% of Vehicles Turning during Protected Left-turn Phase Site Before After
% Change p-value
41st & Pine Tree 66
(n = 4644) 85
(n = 1625) +19 <0.001
Table 67. Conflicts
% Pedestrian-vehicle Conflicts Site
Before After % Change p-value
41st & Pine Tree 7.2
(n = 2166) 2
(n = 789) -5.2 0.014
Discussion
The data indicate that prohibiting permissive left-turns may be an effective way to improve pedestrian safety at intersections by reducing conflicts between pedestrians and vehicles, however, the researchers also found that there was a substantial portion of left-turners that violated the red signal. While this countermeasure has potential for increasing pedestrian safety, the signal configuration should be taken into consideration in order to mitigate left-turners violating the signal.
PHYSICAL SEPARATION Two types of physical separation were installed and tested for their impact on pedestrian safety. These countermeasures included:
• Median refuge islands
• Danish offsets (in combination with refuge island and high visibility crosswalk)
The findings for the site-specific evaluations for these physical separation countermeasures are presented below.

Final System Impact Report January 2009
68
Median Refuge Islands Median refuge islands provide a safe, raised area in the center portion of the roadway for pedestrians when crossing wide, multilane streets. They can be provided at mid-block crossings or at intersections (Figure 36). The islands allow pedestrians to cross the first half of the roadway and then to wait before crossing the second half of the roadway, rather than forcing them to find sufficient gaps in both directions of traffic to make their crossing. The islands also act as a traffic calming device by reducing the speed of vehicles at mid-block locations and by forcing left-turning motorists to reduce their speeds to make shorter radius turns at intersections.
Figure 36. Median Refuge Island at a San Francisco Intersection
Deployment Locations
In San Francisco, median refuge islands were installed at two signalized intersections along Geary (Figure 36). At Stanyan, the refuge island was installed on the west crosswalk on Geary. At 6th, the refuge island was installed on the east and west crosswalks on Geary. In Las Vegas, a median refuge island was installed at a mid-block crosswalk along Harmon between Paradise Road and Tropicana Boulevard (Figure 37). The refuge island was installed at the same time as a high-visibility crosswalk. The study sites are described in Table 68.
Table 68. Median Refuge Island Study Sites
Location Study Sites Site Descriptions San Francisco Geary & Stanyan
Geary & 6th 3-leg intersection. 7 lanes on Geary at intersection. 4-leg intersection. 6 lanes on Geary at intersection. Both sites have standard crosswalks, 2-way traffic, signalized intersections, street parking, mixed land use, and 25 mph speed limits.
Las Vegas Harmon: Paradise Rd. to Tropicana Blvd.
Mid-block crosswalk. Installed with a high-visibility crosswalk.
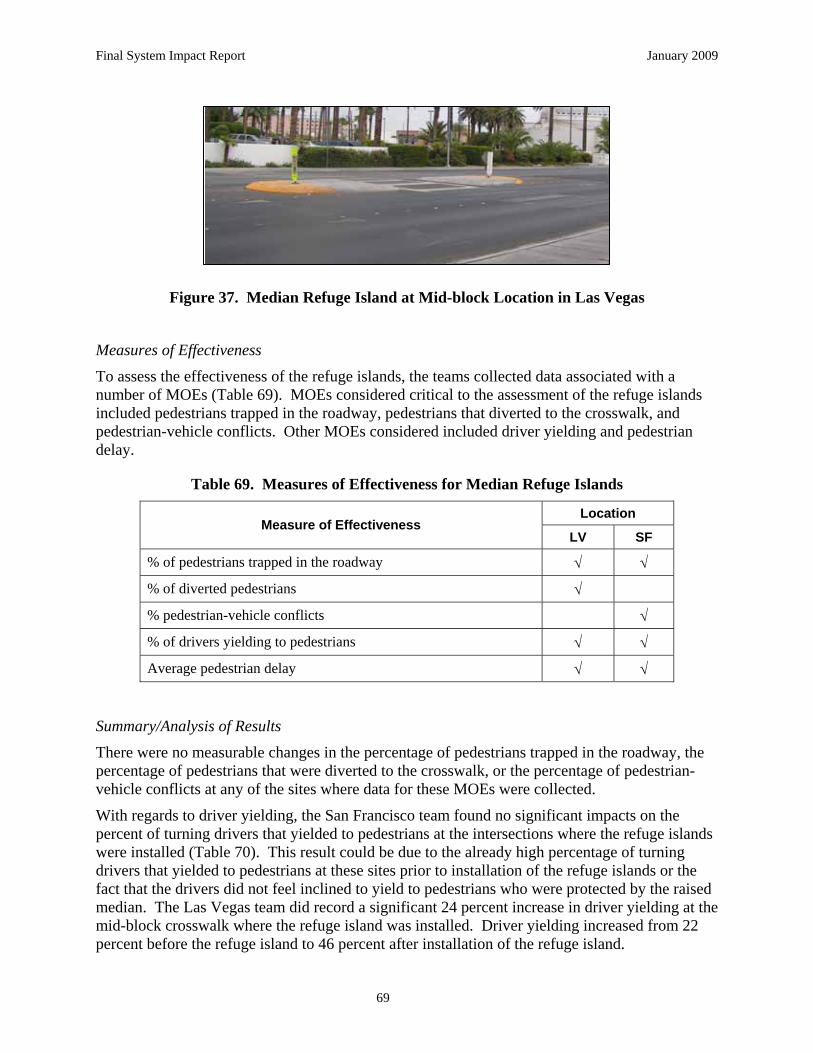
Final System Impact Report January 2009
69
Figure 37. Median Refuge Island at Mid-block Location in Las Vegas
Measures of Effectiveness
To assess the effectiveness of the refuge islands, the teams collected data associated with a number of MOEs (Table 69). MOEs considered critical to the assessment of the refuge islands included pedestrians trapped in the roadway, pedestrians that diverted to the crosswalk, and pedestrian-vehicle conflicts. Other MOEs considered included driver yielding and pedestrian delay.
Table 69. Measures of Effectiveness for Median Refuge Islands
Location Measure of Effectiveness
LV SF
% of pedestrians trapped in the roadway √ √
% of diverted pedestrians √
% pedestrian-vehicle conflicts √
% of drivers yielding to pedestrians √ √
Average pedestrian delay √ √
Summary/Analysis of Results
There were no measurable changes in the percentage of pedestrians trapped in the roadway, the percentage of pedestrians that were diverted to the crosswalk, or the percentage of pedestrian-vehicle conflicts at any of the sites where data for these MOEs were collected.
With regards to driver yielding, the San Francisco team found no significant impacts on the percent of turning drivers that yielded to pedestrians at the intersections where the refuge islands were installed (Table 70). This result could be due to the already high percentage of turning drivers that yielded to pedestrians at these sites prior to installation of the refuge islands or the fact that the drivers did not feel inclined to yield to pedestrians who were protected by the raised median. The Las Vegas team did record a significant 24 percent increase in driver yielding at the mid-block crosswalk where the refuge island was installed. Driver yielding increased from 22 percent before the refuge island to 46 percent after installation of the refuge island.

Final System Impact Report January 2009
70
Table 70. Drivers Yielding to Pedestrians
% of Drivers Yielding to Pedestrians Location Site
Before After % Change p-value
Geary & Stanyan 80.4
(n = 158) 86.6
(n = 164) +6.2 0.18
San Francisco Geary & 6th
96.1 (n = 186)
89.7 (n = 262)
-6.4 0.15
Las Vegas Harmon: Paradise Rd. to Tropicana Blvd.
22 (n = 77)
46 (n = 284)
+24 <0.001
Both teams measured pedestrian delay in the crosswalks before and after installation of the median refuge islands, and the results are shown in Table 71. While there was no change in average pedestrian delay at Geary & Stanyan, there was a significant increase in average pedestrian delay at Geary & 6th of 4.2 seconds. This increase in pedestrian delay corresponds to a decrease, albeit not significant, in driver yielding at this site. At the mid-block crosswalk in Las Vegas, there was a 12.3 second decrease in pedestrian delay corresponding to the increase in driver yielding at this site.
Table 71. Average Pedestrian Delay
Average Pedestrian Delay (sec) Location Site
Before After
Change (sec) p-value
Geary & Stanyan 19.8
(n = 107) 19.1
(n = 104) -0.7 0.80
San Francisco Geary & 6th
14.3 (n = 350)
18.5 (n = 595)
+4.2* <0.01
Las Vegas Harmon: Paradise Rd. to Tropicana Blvd.
19.3 (n = 1951)
6.98 (n = 388)
-12.3 <0.001
*Counterintuitive result
Discussion
Based on the results, it appears that the installation of a median refuge island at a mid-block location was effective in increasing driver yielding to pedestrians and reducing pedestrian delay, while the median refuge islands at the signalized intersections in San Francisco appear to be less effective at altering driver and pedestrian behaviors.

Final System Impact Report January 2009
71
Danish Offset, High-Visibility Crosswalk, Median Refuge, Advance Yield Markings, and Yield to Pedestrian Signs The Las Vegas team deployed a Danish offset at two locations. A Danish offset is an offset at the middle of a multilane crossing that provides refuge for pedestrians in terms of physical separation from traffic and ensures they are facing the traffic before crossing the second half of the roadway. The offset is a type of channelization that encourages pedestrians to turn and walk parallel to the traffic they are crossing. At the Maryland Parkway and Dumont Street site (Figure 38), the channelized offset was created using waist-high bollards and raised medians. At the Lake Mead Boulevard site, the offset was developed with median cutouts (Figure 39). At the Maryland and Dumont site, a sign with the words LOOK BEFORE CROSSING and an arrow pointing the direction of oncoming traffic was also installed. At both sites, the Danish offset was combined with other pedestrian safety countermeasures including high-visibility crosswalks, advance yield markings, and YIELD HERE TO PEDESTRIANS (R1-5a 2003 MUTCD) signs, as shown in Figure 40 and Figure 41.
Figure 38. Danish Offset at Maryland Parkway and Dumont Street
Figure 39. Lake Mead Boulevard: Belmont Street to McCarran Street

Final System Impact Report January 2009
72
Figure 40. Advance Yield Markings and YIELD HERE TO PEDESTRIANS Sign Before Danish Offset at Maryland Parkway and Dumont Street
Figure 41. Advanced Yield Markings installed at Lake Mead Boulevard: Belmont Street to McCarran Street
Deployment Locations
In Las Vegas, the Danish offset and supporting countermeasures were deployed at two sites, one under the jurisdiction of Clark County and the other in the City of North Las Vegas (Table 72). The intersection of Maryland Parkway and Dumont Street in Clark County is primarily a commercial area with shopping complexes and a shopping mall. Maryland Parkway is a major arterial with a speed limit of 30 mph and an ADT of 43,000. Dumont Street is a minor arterial

Final System Impact Report January 2009
73
with a posted speed limit of 25 mph. In addition to these countermeasures, the east approach at the Maryland and Dumont intersection was redesigned to permit only right turns.
The second location that received the Danish offset was in the City of North Las Vegas on Lake Mead Boulevard between Belmont Street and McCarran Street. Land use in that area is primarily residential. Lake Mead Boulevard is a major arterial with a speed limit of 45 mph and has an annual average daily traffic (AADT) level of 44,000 vehicles per day. Changes to the site also included relocating bus stops and crosswalks.
Table 72. Danish Offset Study Sites
Location Study Sites Site Descriptions
Maryland Pkwy & Dumont Street
A four-legged intersection in a commercial shopping area. The primary street, Maryland Parkway, is a major arterial with a speed limit of 30 mph and an ADT of 43,000.
Las Vegas
Lake Mead Boulevard: Belmont Street to McCarran Street
A mid-block location on Lake Mead Boulevard, a major arterial in a primarily residential area. Lake Mead has a speed limit of 45 mph and an AADT of 44,000.
Measures of Effectiveness
The Las Vegas study team used a variety of MOEs to assess the impacts of the Danish offset and supporting countermeasures. The percent of diverted pedestrians, percent of pedestrians trapped, and percent of drivers yielding to pedestrians were considered to be critical in determining the effectiveness of these countermeasures in increasing pedestrian safety. Other important MOEs considered by the Las Vegas team are also listed below. It was anticipated that these countermeasures would increase the percent of pedestrians that crossed within the designated crosswalk, increase the percent of pedestrians that looked before crossing, decrease the incidence of pedestrian trapped in the roadway, and increase driver yielding.
• % of diverted pedestrians
• % of pedestrians that look for vehicles before beginning to cross
• % of pedestrians that look for vehicles before crossing the second half of the street
• % of pedestrians trapped in the roadway
• % of drivers yielding to pedestrians
• Distance drivers yield before crossing pedestrian
• Average pedestrian delay
• Average vehicle delay

Final System Impact Report January 2009
74
Summary/Analysis of Results
At the Maryland and Dumont site, the Las Vegas study team measured significant increases in pedestrians that diverted their paths to use the new countermeasures (Table 73). Because there was no marked crosswalk at the Lake Mead location, there was no baseline data for comparison and so this site was left out of this table.
Table 73. Diverted Pedestrians
% of Diverted Pedestrians Location Site
Before After % Change p-value
Las Vegas Maryland Pkwy & Dumont
0 (n = 631)
11 (n = 198)
+11 <0.001
There was already a very high percentage of pedestrians looking before beginning to cross the street and before crossing the second half of the street and so there was little room to improve, as shown in Table 74. The changes measured by the Las Vegas team were small and mixed.
Table 74. Pedestrian Looking Behavior
% of Pedestrians That Look before Beginning
to Cross Location Site
Before After
% Change p-value
Las Vegas Maryland Pkwy & Dumont
100 (n = 631)
93 (n = 198)
-7 >0.05
Las Vegas Lake Mead: Belmont to McCarran
96 (n = 61)
100 (n = 123)
+4 >0.05
% of Pedestrians That Look before Crossing Second Half of Street Location Site
Before After
% Change p-value
Las Vegas Maryland Pkwy & Dumont
100 (n = 631)
91 (n = 198)
-9 >0.05
Las Vegas Lake Mead: Belmont to McCarran
92 (n = 61)
100 (n = 123)
+8 <0.05
At both locations the percent of pedestrians trapped in the roadway fell significantly, particularly at the Lake Mead site with a 57 percent decrease (Table 75). The large percentage of pedestrians trapped at the Lake Mead site in the before condition is likely caused by the absence of a crosswalk.

Final System Impact Report January 2009
75
Table 75. Trapped Pedestrians
% of Pedestrians Trapped in the Roadway Location Site
Before After % Change p-value
Las Vegas Maryland Pkwy & Dumont
12 (n = 631)
4 (n = 198)
-8 <0.001
Las Vegas Lake Mead: Belmont to McCarran
62 (n = 61)
5 (n = 123)
-57 <0.001
The Las Vegas study team measured large, significant increases in driver yielding at both sites (Table 76). There was a 37 percent increase in driver yielding at the Lake Mead site, but the resulting prevalence in yielding was still relatively low at just 40 percent.
The increase in yielding was larger at the Maryland Parkway & Dumont location and resulted in a higher frequency of driver yielding in the after condition at 76 percent.
Table 76. Drivers Yielding to Pedestrians
% of Drivers Yielding to Pedestrians Location Site
Before After % Change p-value
Las Vegas Maryland Pkwy & Dumont
32 (n = 432)
76 (n = 246)
+44 <0.001
Las Vegas Lake Mead: Belmont to McCarran
3 (n = 296)
40 (n = 117)
+37 <0.001
The Las Vegas team also measured the change in yielding distances at the Lake Mead location. The team examined the percent of drivers that yielded less than 10 feet away from the crossing pedestrian, between 10 and 20 feet from the pedestrian, and more than 20 feet away. The before and after distributions of driver yielding distances are shown in Figure 42. There appears to have been a shift from yielding in the mid-range distance category to either the short range yielding or long range yielding. Because the sample size is so small (n = 8) in the baseline condition, it is difficult to make any conclusions based on the data. Yielding in the baseline condition was not measured for the Maryland and Dumont site so results are not available for that site for this MOE.

Final System Impact Report January 2009
76
Driver Yielding Distances Lake Mead: Belmont to McCarran
0102030405060708090
100
< 10ft 10 - 20 ft >20 ftYielding Distance
% o
f Driv
ers
Yiel
ding
% Yielding in Baseline (n = 8)
% Yielding After Treatment (n = 46)
Figure 42. Driver Yielding Distances on Lake Mead: Belmont to McCarran
Average pedestrian delay at Maryland and Dumont increased, while delay measured at Lake Mead decreased by 11.9 percent, a statistically significant difference (Table 77).
Table 77. Average Pedestrian Delay
Average Pedestrian Delay (sec) Location Site
Before After
Change (sec) p-value
Las Vegas Maryland Pkwy & Dumont
3.82 (n = 631)
7.46 (n = 198)
+3.64 >0.05
Las Vegas Lake Mead: Belmont to McCarran
21.4 (n = 61)
9.5 (n = 84)
-11.9 0.001
There was not a statistically significant change in average vehicle delay at the Lake Mead location. A change in delay was not assessed at the Maryland and Dumont location.
Discussion
In summary, the Danish offset and supporting countermeasures appear to have led to an increase in safe pedestrian and driver behaviors. The Las Vegas team measured significant increases in driver yielding and diverted pedestrians as well as significant decreases in trapped pedestrians. Pedestrian looking behavior was high in the baseline and so the lack of increase there may be due to the ceiling effect. Yielding distance measurements were inconclusive and this was likely caused by the very low number of measurements made in the before condition. Pedestrian delay was significantly reduced at the Lake Mead location where a designated crossing area had not

Final System Impact Report January 2009
77
previously existed while it rose slightly at Maryland and Dumont. Vehicle delay at Lake Mead rose likely due to an increase in yielding and more cautious driving allowing pedestrians to have the right of way. The yielding only rose to 40 percent at Lake Mead whereas it reached 76 percent at Maryland and Dumont. This may be due to the difference in speed limits along the two roads. Lake Mead has a 45 mph speed limit while Maryland and Dumont is at 30 mph. With such a high speed limit, drivers on Lake Mead are possibly less likely to slow down or stop for pedestrians. In general, though, the suite of countermeasures appears to have made pedestrian crossings safer.
LIGHTING Only one type of lighting, dynamic lighting, was installed to test its impact on pedestrian safety; however, the application of the dynamic lighting was different in each deployment location. The findings from the site-specific evaluations are discussed below.
Dynamic Lighting Dynamic lighting is the increased illumination of the crosswalk while a pedestrian is present. The implementation of this countermeasure was slightly different in the two locations where it was installed.
In Miami, dynamic lighting consisted of an LED white lighting pad that illuminated the departure portion of the curb face and the first 4 feet of the crosswalk. This dynamic pad lighting consisted of four 2.5 by 1.25 inch housings each containing 3 LEDs. The lighting was deployed in Miami at a location where rectangular LED rapid flashing beacons had been previously installed. The Miami study team was interested in finding out if additional dynamic lighting increased pedestrian safety. When a pedestrian pressed the call button to activate the beacon at night, the rapid flashing beacon and LED white lighting was activated.
In Las Vegas, increased lighting of the crosswalk came from one or more lights attached to the top of poles on the side of the road, as shown in Figure 43. Automatic pedestrian detection was installed along with the lighting to detect pedestrians crossing and trigger an increase in the intensity of the lighting at the crosswalk. The high intensity lighting was in effect only when pedestrians were present in the crosswalk.
.
Figure 43. Dynamic Lighting on Pole in Las Vegas
Final System Impact Report January 2009
78
Deployment Locations
The deployment locations are presented in Table 78. The Las Vegas team deployed the dynamic lighting countermeasure along Charleston Boulevard at a mid-block location between Spencer Street and 17th Street. Land use in that area is mixed and includes office complexes, several small commercial activity units, restaurants, and apartments. The posted speed limit is 35 mph and the ADT is 37,500. A review of pedestrian safety issues in the area shows a high proportion of nighttime crashes involving pedestrians. The dynamic lighting was installed in conjunction with automatic pedestrian detection in the last phase of a two-phase effort to install pedestrian safety countermeasures at the mid-block location. During the first phase a high-visibility crosswalk was installed.
Dynamic lighting in Miami was installed at a crosswalk that traversed four lanes on South Bayshore Drive at Darwin. The crosswalk has a median refuge island for pedestrians between the two directions of travel. The average daily traffic on South Bayshore Drive was 38,996 and the speed limit was 35 mph.
Table 78. Dynamic Lighting Study Sites
Location Study Sites Site Descriptions
Miami South Bayshore Drive & Darwin Crosswalk over a 4-lane road with pedestrian refuge island cut in the median. At intersection of South Bayshore and Darwin. The ADT for South Bayshore was 38,996 with speed limit of 35 mph. Deployed at location containing rapid flash beacon.
Las Vegas Charleston: Spencer to 17th Crosswalk over approximately a 4-lane road in a mixed commercial/residential area. The speed limit on Charleston was 35 mph and the ADT was 37,500. Deployed at a location that had a high-visibility crosswalk.
Measures of Effectiveness
The Las Vegas and Miami study teams assessed the impact of dynamic lighting on pedestrian safety and mobility using a variety of measures of effectiveness. Two MOEs considered critical to evaluating the effectiveness of dynamic lighting were the percent of drivers yielding to pedestrians and the frequency of pedestrian-vehicle conflicts. Dynamic lighting was expected to increase driver yielding, decrease pedestrian-vehicle conflicts, reduce pedestrian delay, and not significantly impact driver delay. Table 79 contains a list of MOEs used by the Las Vegas and Miami teams.
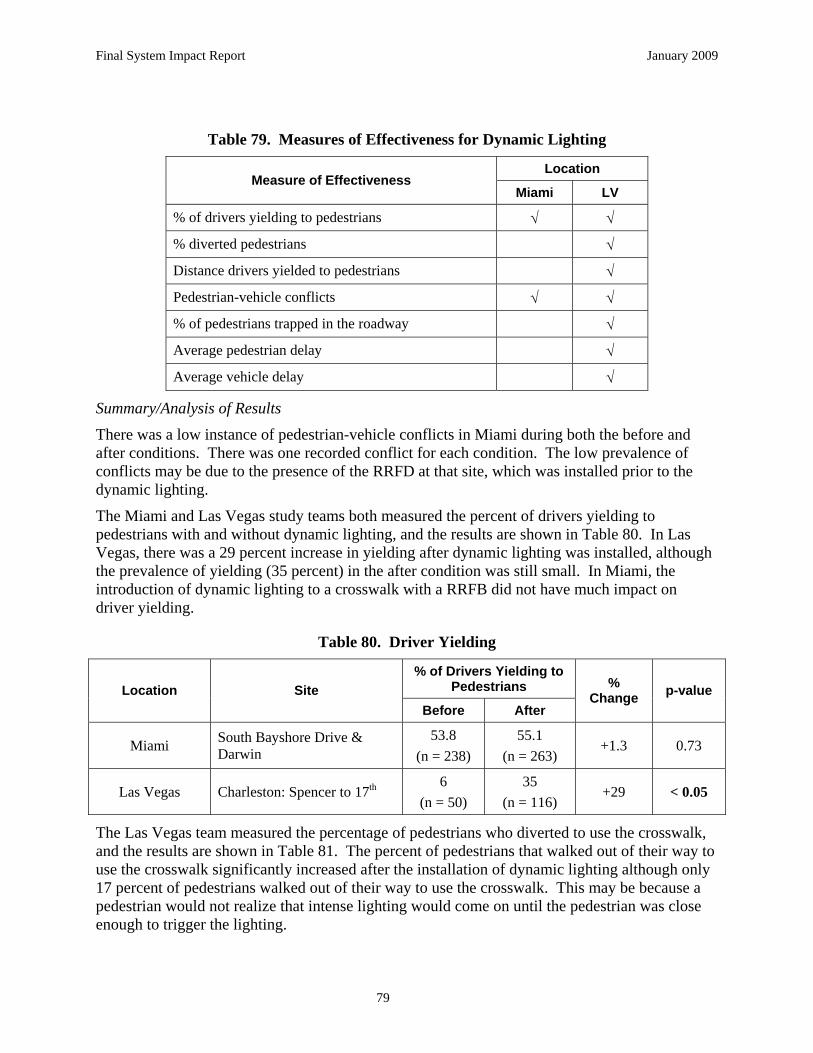
Final System Impact Report January 2009
79
Table 79. Measures of Effectiveness for Dynamic Lighting
Location Measure of Effectiveness
Miami LV
% of drivers yielding to pedestrians √ √
% diverted pedestrians √
Distance drivers yielded to pedestrians √
Pedestrian-vehicle conflicts √ √
% of pedestrians trapped in the roadway √
Average pedestrian delay √
Average vehicle delay √
Summary/Analysis of Results
There was a low instance of pedestrian-vehicle conflicts in Miami during both the before and after conditions. There was one recorded conflict for each condition. The low prevalence of conflicts may be due to the presence of the RRFD at that site, which was installed prior to the dynamic lighting.
The Miami and Las Vegas study teams both measured the percent of drivers yielding to pedestrians with and without dynamic lighting, and the results are shown in Table 80. In Las Vegas, there was a 29 percent increase in yielding after dynamic lighting was installed, although the prevalence of yielding (35 percent) in the after condition was still small. In Miami, the introduction of dynamic lighting to a crosswalk with a RRFB did not have much impact on driver yielding.
Table 80. Driver Yielding
% of Drivers Yielding to Pedestrians Location Site
Before After
% Change p-value
Miami South Bayshore Drive & Darwin
53.8 (n = 238)
55.1 (n = 263)
+1.3 0.73
Las Vegas Charleston: Spencer to 17th 6
(n = 50) 35
(n = 116) +29 < 0.05
The Las Vegas team measured the percentage of pedestrians who diverted to use the crosswalk, and the results are shown in Table 81. The percent of pedestrians that walked out of their way to use the crosswalk significantly increased after the installation of dynamic lighting although only 17 percent of pedestrians walked out of their way to use the crosswalk. This may be because a pedestrian would not realize that intense lighting would come on until the pedestrian was close enough to trigger the lighting.
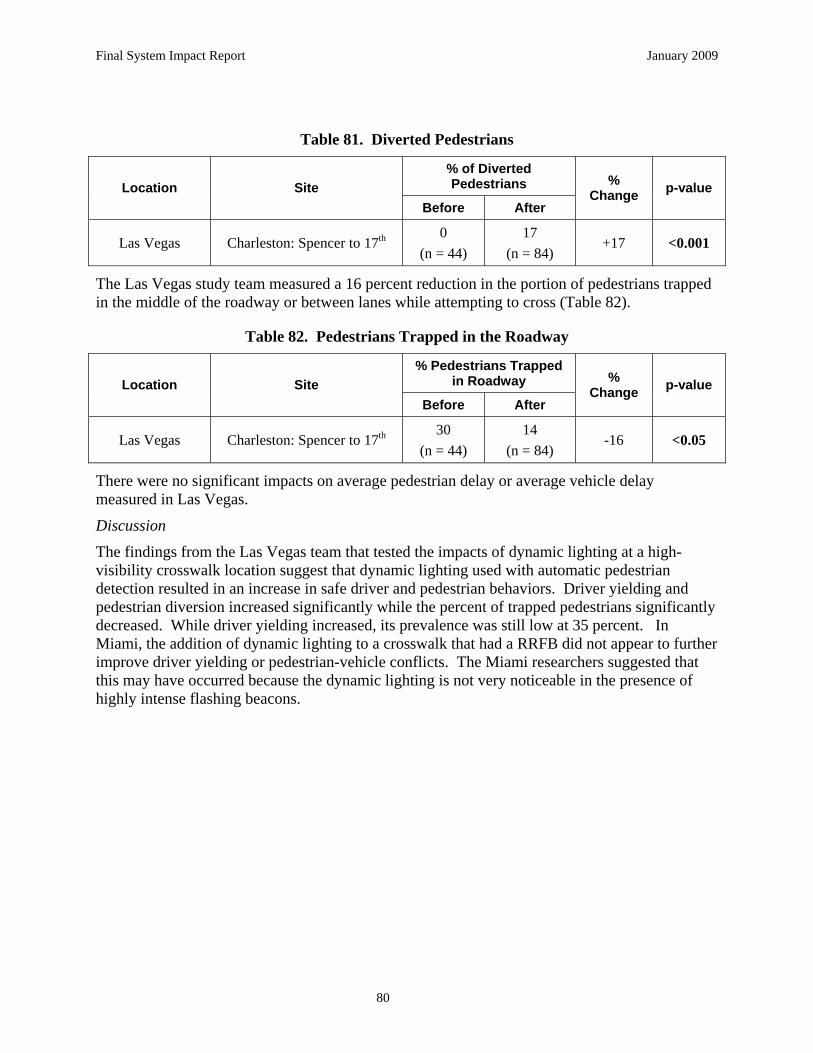
Final System Impact Report January 2009
80
Table 81. Diverted Pedestrians
% of Diverted Pedestrians Location Site
Before After
% Change p-value
Las Vegas Charleston: Spencer to 17th 0
(n = 44) 17
(n = 84) +17 <0.001
The Las Vegas study team measured a 16 percent reduction in the portion of pedestrians trapped in the middle of the roadway or between lanes while attempting to cross (Table 82).
Table 82. Pedestrians Trapped in the Roadway
% Pedestrians Trapped in Roadway Location Site
Before After
% Change p-value
Las Vegas Charleston: Spencer to 17th 30
(n = 44) 14
(n = 84) -16 <0.05
There were no significant impacts on average pedestrian delay or average vehicle delay measured in Las Vegas.
Discussion
The findings from the Las Vegas team that tested the impacts of dynamic lighting at a high-visibility crosswalk location suggest that dynamic lighting used with automatic pedestrian detection resulted in an increase in safe driver and pedestrian behaviors. Driver yielding and pedestrian diversion increased significantly while the percent of trapped pedestrians significantly decreased. While driver yielding increased, its prevalence was still low at 35 percent. In Miami, the addition of dynamic lighting to a crosswalk that had a RRFB did not appear to further improve driver yielding or pedestrian-vehicle conflicts. The Miami researchers suggested that this may have occurred because the dynamic lighting is not very noticeable in the presence of highly intense flashing beacons.

Final System Impact Report January 2009
81
LESSONS LEARNED Implementation and evaluation of the Pedestrian Safety Engineering and ITS-Based Countermeasures Program was challenging. The major steps in the project included:
• Establishing and maintaining a multi-agency pedestrian safety team to oversee and guide the project
• Identifying pedestrian safety and mobility problems, including potential contributing factors to crashes
• Selecting pedestrian safety countermeasures corresponding to the problems identified
• Obtaining funding and support for pedestrian safety improvements
• Procuring, deploying, and maintaining the countermeasures
• Evaluating the effectiveness of the countermeasures
Each step of the project offered new challenges to the project partners that are presented here as lessons learned. The lessons learned presented and discussed in this document include two primary types of lessons:
• General lessons learned
• Countermeasure-specific lessons learned
The lessons learned are detailed in the following sections.
GENERAL LESSONS LEARNED General lessons learned include those relating to the major project steps, as listed above. Nine specific lessons learned are discussed in detail in this section of the report.
Lesson #1—Assemble a Diverse Set of Project Partners to Address the Range of Issues That Might Arise During the Study As part of their contractual agreements, each of the field teams was to assemble a diverse group, consisting of traditional and non-traditional partners, which would support the project by providing financial support and/or “in-kind” support through staff time and unique support. This task was deemed an important one for the projects’ success.
Each of the field teams did initially establish a diverse set of project partners. Traditional partners included representatives from metropolitan planning organizations (MPOs), city and county departments of public works, State departments of transportation (DOTs), State departments of public safety, university research centers, and consultants. The teams were also able to include a wide range of non-traditional partners, including representatives from local police departments, local health districts, local school districts, community outreach programs, local advocacy groups, medical trauma centers, and local food and drug stores.
While there were a range of partners included on the project teams, a number of issues arose during the course of the project that necessitated specific personnel. In some cases, the teams were prepared to address the issues, and in some cases, the needed personnel were not always available.

Final System Impact Report January 2009
82
Below are specific lessons regarding project partners:
• Recruit and actively engage a partner with experience facilitating public participation to ensure that the team is responsive to citizens’ needs. The Miami team included the region’s MPO, specifically the MPO’s bicycle/pedestrian coordinator as an active partner. One of the primary benefits of this inclusion was the MPO’s ability to handle public participation through its existing well-developed public involvement procedure. In this regard, the MPO was a natural fit and helped other team members focus on other project tasks. The MPO staff person also possessed a well-developed network of other individuals who could assist with public aspects of the project. The team cautions that this may not have been the case with a newer MPO staff member. A larger overarching agency, such as a MPO, is a useful partner in a pedestrian safety program in order to match needs with resources, gather input from citizens, and delegate concerns to proper personnel.
• The Las Vegas team included Clark County Safe Communities, an ongoing outreach program of the University of Nevada Las Vegas (UNLV) Transportation Research Center. The mission of Clark County Safe Communities is to reduce traffic crashes, and they regularly bring together a variety of agencies and other groups to address traffic safety needs. By involving this group, the Las Vegas team was able to reach the elderly and disadvantaged populations and to get public feedback on their countermeasures.
• Maintain as an active member of the pedestrian safety project team a representative from the agency responsible for installing roadway countermeasures to facilitate procurement and deployment. The San Francisco team found it helpful to have a representative from the City of San Francisco traffic engineering department as a primary team member for communication with engineers who were responsible for implementation. In Las Vegas, regular communication with project partners enabled the City and Clark County to assist UNLV in acquiring supplies through vendors. At times, UNLV would receive little response from countermeasure vendors. By going through the City or County, the requests to vendors received greater attention perhaps because the City and County were larger customers. This helped the project to stay more on schedule and allowed the team to acquire the needed countermeasures.
• Coordinate improvements with other agencies. The San Francisco team found that it was critical to coordinate improvements with agencies involved in roadway construction.
• Be sure to include public safety officials, as they can be effective advocates for pedestrian safety. The Las Vegas team found the local sheriff to be a key supporter for the pedestrian safety program, and over time, this has become a mutually beneficial relationship. The sheriff enabled the Las Vegas team to obtain detailed crash data from a local police department to supplement data provided by the Nevada Department of Transportation (NDOT). With the support of the sheriff, UNLV has joined monthly meetings of public works, law enforcement, and departments of transportation to gain acceptance and support for countermeasure deployment. During the meetings, UNLV can give the region’s public safety agencies advance notice when and where collecting data will be taking place. This helps alleviate any suspicion when police spot the data collectors. In addition, the increased communication with public safety provides the team with external feedback on the effectiveness of the countermeasures. As an example, two

Final System Impact Report January 2009
83
to three weeks after the Danish offset was implemented, local police reported during a meeting that the countermeasure was having a noticeable improvement on safety.
• Do not hesitate to include multiple members from the same organization who work in different divisions. The range of pedestrian safety countermeasures being deployed necessitated a range of expertise not usually housed within a single division at an agency. Required expertise included traffic engineering, roadway design, electrical power supply, lighting, and communications. In the City of San Francisco, street lighting is under the control of the Public Works Department, while Traffic Engineering is in the Municipal Transportation Agency. Including staff from various divisions within the same agency will help with countermeasure approval, procurement, and deployment.
• Dedicate safety staff to the pedestrian program/project. Dedicated staff members are helpful in designing and implementing the program. The City of San Francisco Department of Parking and Traffic employs two full-time transportation engineers and one full-time planner in their program, and these staff members spent a considerable amount of time on the project. The Las Vegas team did not dedicate full-time staff to the program because they did not anticipate needing that level of effort. Looking back, they frequently wished that they had more staff help, particularly during the deployment and evaluation phases. They primarily needed more staff assistance with administering and coordinating tasks. Much time and attention was required to manage vendors and sequence deployments in multiple jurisdictions.
Lesson #2—Implement Regular Communication and Participation Mechanisms for Project Partners from Project Kick-Off While there were a range of partners included on the project teams, in some cases there was active participation by particular partners, while in other cases there was lack of participation by the partners throughout the course of the project.
Below are specific lessons regarding contact and communication with project partners:
• Provide all partners with regular status reports and conduct regular team meetings and teleconferences to keep partners informed and engaged and to facilitate an efficient flow of communication. In Miami, agencies were busy and as the project moved into its later stages, did not want to schedule calls each week. Upon reflection, a web site or some other cost-effective means for keeping everyone up-to-date would have been helpful. This would have been perceived as a less intrusive way of keeping people involved and would have allowed for partner feedback to be elicited only on an as-needed basis. While this would be effective, some project budget would need to be reserved for initial setup of this forum.
• Keep a written record of key inter-agency agreements and events in order to preserve progress made in the case of personnel changes. Support from partnering agencies significantly waned during staff turnover in Las Vegas. Often, there was no written record of the promises or intentions of the previous staff members who were supportive of pedestrian safety. Within one partner agency, the participating staff member changed three times. Bringing the new staff members up to speed and re-establishing agreement on details of the program caused a project delay of a month or two.

Final System Impact Report January 2009
84
• Strive to keep key players actively involved throughout the project. The City of San Francisco formed a pedestrian safety interdepartmental working group, but in hindsight, this was insufficient. Even though there was participation through this working group, it was not extensive enough. The Department of Parking and Traffic needed better coordination with public works and transit. They needed key players from public works and transit to be more intensively involved in the project, as opposed to just participating in meetings every few months. The consequences were that the team got the Phase I report approved by the working group but ran into opposition during implementation. In the end, they were not able to implement smart lighting or the pedestrian scramble due to resistance from public works and transit, respectively.
In Las Vegas, an executive advisory committee was formed of the primary project partners, the Regional Transportation Commission, the Nevada Office of Traffic Safety, the City of Las Vegas, Clark County, the Nevada Department of Transportation, and the City of Henderson. The coordination of these six invested parties was made possible through the monthly executive advisory committee meetings. The team was described as “incredibly useful,” particularly in the initial phase of the program. Because there were multiple partners representing multiple jurisdictions, the project schedule needed to accommodate extra time to gain agreement with each agency.
Lesson #3—Use a Variety of Methods/Sources to Understand Problems and to Determine Causes of Crashes at Prominent Pedestrian Crash Locations As part of the project, teams were to identify and characterize pedestrian safety problem zones or areas through comprehensive data collection in the local jurisdiction, including traffic and pedestrian volumes, gap selection, vehicular speed, pedestrian behavior and crash type. Pedestrian and Bicycle Crash Analysis Tool (PBCAT) software was used to analyze crash patterns.
The teams found the best way to identify and characterize pedestrian safety problems was to use a variety of methods/sources:
• Review police crash reports and crash diagrams. The Miami team reported that without reading the police reports, and specifically the crash diagrams, it was not clear whether the pedestrian was in the crosswalk, some distance from the crosswalk, and/or from what direction the pedestrian was coming, and specific information of this type can have a large bearing on the selection of countermeasures. The crash reports helped the team identify true causation of particular crashes.
The Las Vegas team suggested using data from police to get pedestrian safety information that traffic engineers may not have. Because the data from NDOT were not available for a certain time period, the Las Vegas team turned to alternative sources for crash data. The team found much more detailed crash data and crash diagrams from a local police department. The DOT crash data had around 100 different attributes for each crash whereas the police data had approximately 750 attributes per crash. While, most of the attributes were not used in this study, Las Vegas did benefit from the crash diagrams and the elaborate road characteristics data.
• Review crash records from at least the previous five years. Looking at too few crashes might be misleading. The San Francisco team found a great deal of variability from year to year in the types of pedestrian collisions that occurred at the sites. For

Final System Impact Report January 2009
85
example, during a five-year period at one site a large majority of the pedestrian collisions occurred late at night. Comparing that five-year period to the next five years (or even a rolling five-year period), there was a dramatic change in the number of pedestrian injuries late at night that could not be otherwise explained.
• Visit high crash locations with crash data in hand. The Miami team visited each of the corridors to observe drivers, pedestrians, and pedestrian facilities. The members used a book with the specifics of each crash at each location including information on demographics, temporal variables, crash severity, and crash type. Simultaneously looking at the data and the crash location was helpful in determining the causes of the crashes. Additionally, the Miami team found site visits helpful because they were able to roughly assess driver and pedestrian behavior and examine existing engineering devices.
The Miami team reported that the visits allowed them to confirm or disprove hypotheses that had been generated about the cause of crashes in each corridor based on their initial use of the PBCAT. PBCAT is a crash typing software that can assist state and local pedestrian/bicycle coordinators, planners and engineers improve walking and bicycling safety through the development and analysis of a database containing details of crashes between motor vehicles and pedestrians or bicyclists.
• Use surrogate measures when pedestrian volumes are not available. Surrogate indicators of pedestrian volume may include tourism data, bar or restaurant service volume, and others and can provide a more accurate picture of the number of pedestrians and related safety problems.
• Seek input from the project’s advisory committee. UNLV presented their project’s executive advisory committee with data to review and the partners provided a valuable non-technical perspective regarding the placement of countermeasures.
Lesson #4—Begin the Program by Implementing Low-cost Countermeasures for the Greatest Potential of Widespread Use As with many programs, starting off with “quick wins” builds momentum and support for the program overall. In the case of these pedestrian safety programs, the countermeasures varied greatly in terms of price, procurement difficulty, ability to receive approval, and ease of deployment. The Las Vegas team found it beneficial to implement several low-cost, easy-to-deploy countermeasures early in their program, which allowed them to show results to their partners during the monthly executive advisory meetings. Countermeasures such as high-visibility crosswalk pavement treatments, in-street pedestrian signs, and pedestrian push buttons that confirm press were relatively easy to deploy because the local agencies could perform the labor without having to use a vendor.
For the most potential success:
• Promote wide-scale dissemination and adoption of the countermeasures. The strategy of initially deploying low-cost countermeasures has the greatest likelihood of wide scale dissemination and adoption, because countermeasures tend to be most effective when applied in multiple locations and in combination with other treatments.
• Do not deploy initial countermeasures sparingly. Because most treatments work best when applied at multiple locations and in combination with other treatments, it is

Final System Impact Report January 2009
86
important that the initial treatments are not so expensive that they can only be used sparingly.
• Help the program conserve its momentum. The high cost/effectiveness ratio of the low-cost initial applications will help ensure a series of “quick wins.” The San Francisco team found that low-cost but effective measures have the advantages of quick implementation and the potential to draw support and funding for further improvements.
• Introduce more expensive interventions over time using a phased approach. Starting off with low-cost countermeasures allows the time required to budget for and procure more costly interventions, should they be required.
Lesson #5—Pursue a Variety of Funding Sources for the Pedestrian Safety Program The local deployment teams were tasked with obtaining matching funds for their pedestrian safety projects. As pedestrian issues are not always the top priority of state and local transportation agencies, often falling behind roadway construction and maintenance projects, obtaining funding for pedestrian safety countermeasures can be challenging. Therefore, it is advantageous to pursue a variety of funding sources for pedestrian safety countermeasures:
• Gain political support and funding through high-profile demonstrations. The Miami team gained the support of the mayor by involving him in a public demonstration of a rectangular rapid flashing beacon at a pedestrian crossing, which has led to him trying to get more of them installed in the city. In Las Vegas, the MPO was impressed by the RRFD and supports additional installations.
• Bring together funding from several agencies. The Las Vegas team pieced together funding from five different partners, including NDOT, the Nevada Office of Traffic Safety, the City of Las Vegas, the local MPO, and Clark County Department of Public Works. In addition to funding, many of these agencies provided the labor necessary to install countermeasures, which conserved funds for other project needs.
• Apply for grants. The San Francisco team received a grant for pedestrian countdown signals on two corridors through the Safe Routes to School program.
• Consider funding from taxes. In San Francisco, there is funding available annually for “Pedestrian Circulation and Safety” projects from sales tax funds, and the San Francisco team was able to secure some of these funds for installing countermeasures.
• Assure sufficient staff labor. For a major metropolitan city, the staff labor to implement innovative pedestrian safety countermeasures can be far greater than the cost of the equipment and materials. This time includes:
Planning and designing installations
Coordinating with other departments/agencies
Obtaining legal approvals
Coordinating shop work or contracts
Managing interdepartmental financial arrangements
Purchasing equipment

Final System Impact Report January 2009
87
Installing countermeasures
Lesson #6—Do Not Underestimate the Complexity of Procurement The procurement of innovative countermeasures presented several obstacles for the pedestrian safety teams. Lessons regarding procurement include:
• Be aware of which vendors are approved by your department. For one of their relatively inexpensive countermeasures, the San Francisco team had to go through a distributor because the manufacturer was not an approved vendor. The use of a distributor added complications as well as costs to the project.
• Establish policies and procedures for procurement as early as possible in the program. Because the Las Vegas team was working with multiple jurisdictions, the approval process was complex. It often took much more time than anticipated because the steps were not always clear from the onset. With regard to the rapid flash beacons, Las Vegas had to obtain a permit from NDOT to install the beacons on an experimental basis. This was necessary because the beacons were not yet in the Manual on Uniform Traffic Control Devices (MUTCD) and the partners did not want to be held liable if the countermeasure showed adverse effects.
• Be prepared that vendors may have challenges producing new countermeasures. In Las Vegas, they were unable to find a vendor that was willing to produce enlarged pedestrian signal heads because of the expense and risk involved in creating a new design. If there does not appear to be a high demand for a product, a vendor may not be willing to risk a new design. In the case of pedestrian countdown signals with “animated eyes,” Las Vegas experienced substantial procurement delays. Although the vendor was very helpful, they had to ship the system back and forth to the vendor due to software issues. Las Vegas also experienced a delay in schedule while working to get permission from the patent holders of this countermeasure.
Lesson #7—Budget Ample Time for Deployment and Coordinate with the Appropriate Jurisdictions Developing and implementing a comprehensive pedestrian safety program and plan requires a multi-year time frame. Deployment of a wide variety of countermeasures in numerous locations across an extended period of time presented a challenge to the field teams. The Las Vegas team faced additional challenges, as the deployments spanned three separate jurisdictions, including the City of Las Vegas, Clark County, and the Nevada Department of Transportation. Several ways to mitigate project delays due to deployment and coordination include:
• Coordinate deployment activities with local intersection construction plans. The San Francisco team had to repair countermeasures damaged by major intersection construction that occurred just following countermeasure deployment.
• Budget additional time for implementation when deploying on roads owned by the State but operated and maintained by the city or county. The Las Vegas team needed to have designs approved by NDOT and then deployment scheduled with the city or county.

Final System Impact Report January 2009
88
• Maintain persistence when obtaining permits to deploy pedestrian safety improvements. The Las Vegas team faced unexpected obstacles in obtaining a permit from NDOT for a pedestrian refuge island. The team had to address multiple objections but eventually received the permit after six months. The Las Vegas team was able to overcome the objections by contracting with a private engineering firm to produce the needed drawings. This increased the project cost and added four to five months to the schedule.
• Consider the trade-offs of deploying in-house versus using an outside contractor. The Miami team had a hard time getting the local agencies to install various countermeasures when they were supposed to. The team thought that having its own contractor for deployment would be more effective, but it proved to have its own problems. As a result of these difficulties, schedule adherence suffered.
The San Francisco team also considered some of the trade-offs. Overall, they felt it was better to handle the deployment in-house, but contracting would have had some advantages. There are many traffic engineering and public work projects going on in a city like San Francisco, and it can get very complicated. When a project like this is managed in-house, it is easy to get caught up with other priorities and project needs, and turn-over in staff can cause further complications and delays due to the time needed to replace staff. As they moved into implementation, the San Francisco team needed an engineer to manage the project. While getting a contract in place for an outside contractor offers complications and takes time, once a contract was in place, a consulting firm could have handled the deployment faster that the City was able to.
Lesson #8—Consider How the Timing of Countermeasure Deployment May Impact the Experimental Design and Evaluation As part of the project, the field teams were required to conduct an evaluation of the countermeasures they deployed. To do so, the teams selected experimental designs for their evaluation. The Las Vegas team’s deployment plan involved implementing a variety of countermeasures at particular sites in a staged approach, and their evaluation plan involved evaluating the impacts of each deployment. The San Francisco and Miami teams’ deployment evaluation plans involved using a staggered approach to evaluation. This staggered approach made use of two deployment sites, each serving as a “control” site for the next at different points in the evaluation process.
• Consider a quasi-experimental design if the installation of the countermeasure cannot be controlled. The San Francisco team had planned to use a staggered design but ended up using a before and after design. First, they found it was difficult to get an exact timing for the installation of countermeasures at the two deployment sites for each countermeasure. When the agency was putting in the countermeasure at one site, they generally wanted to put the countermeasure in at the other site at the same time. In effect, the team asked the agency to delay installation at one site for six weeks, which created an extra burden on them. Therefore, the team had difficulty controlling the amount of time that elapsed between when the before data were collected and the installation of the countermeasures. Perhaps more important, the San Francisco team suggests that even if they could have pulled off the staggered design, they are not sure how much it would have worked. Their experience was that the real “control” was what

Final System Impact Report January 2009
89
was going on in the city in general, not at an intersection across town that was selected as the control. A single intersection might not always help control for confounding factors.
• The Las Vegas team’s deployment plan involved implementing a variety of countermeasure at a particular site in a staged approach, evaluating the impacts of each new deployment. The team was initially going to deploy in five different stages; however, much time and attention was required to manage vendors and sequence the staged deployments in multiple jurisdictions. As a result of the deployment delays, they had to combine countermeasure deployments, which impacted their ability to evaluate the individual countermeasures. If multiple countermeasures were inadvertently deployed within the same time period, the team had to scramble to meet the data collection needs. In the end, they were able to evaluate the individual countermeasures only because early in the project they had deployed some of the countermeasures separately.
Lesson #9—Consider the Unique Aspects of Collecting and Reducing Pedestrian Safety Data When safety evaluations are conducted over time periods too short to rely on crash data, it is necessary to use surrogate measures of safety to determine the impacts of the deployments. In this study, the field teams used a variety of safety surrogates, including: pedestrian behaviors (e.g., violating the pedestrian signal, crossing against traffic, looking before crossing) and driver behaviors (e.g., blocking the crosswalk, yielding, coming to a complete stop). In addition to the safety surrogates, teams collected data related to pedestrian mobility (e.g., pedestrian volumes, traffic volumes, pedestrian delay), customer satisfaction, and demographic information associated with observed pedestrians. Collecting this amount of data, including behavioral data of both pedestrians and drivers, presents some unique challenges. Lessons learned during their data collection activities include:
• Remember that vehicle and pedestrian peak periods do not necessarily coincide. When planning data collection activities that involve observing both driver and pedestrian behaviors, it is important to consider the peak periods for both vehicular traffic and pedestrian traffic. Collecting data only during the peak periods for vehicular traffic may not result in the optimal observations of pedestrians.
• Keep MOEs simple and repeatable. Clear, consistent definitions of MOEs are helpful, but difficult to achieve. In particular, there is no universal, accepted definition of “vehicle/pedestrian conflict.” When assessing the effectiveness of the countermeasures or pedestrian safety program, select MOEs that can be defined and for which data can be collected consistently across staff, locations, and time. Regardless of what MOEs are selected, a data collection protocol and corresponding training should be developed and implemented.
• Provide field data collection personnel with a formal letter explaining their purpose and contact information. Collecting behavioral data in the field can require multiple personnel, video cameras, and other equipment. Police in Las Vegas received a call from a citizen concerned with the “suspicious” activities of several individuals with clipboards and video cameras on a street corner. When the police came to investigate, the Las Vegas team was able to produce a letter that instructed the officer to call a lead researcher at the university. The lead researchers confirmed the names of the individuals participating in the data collection, which relieved suspicion.

Final System Impact Report January 2009
90
• Consider the advantages and disadvantages of using field data collection versus video data collection. Pedestrian safety data can be collected by observers in the field, or using video cameras, and there are advantages and disadvantages to both:
While video data may allow for greater accuracy by giving precise time stamps of events and allowing analysts repeated viewings, it requires substantially more time to analyze. The labor requirements for tabulating video recorded events were several times greater than for manual data collection.
The San Francisco team reported that while using video data complicated the project, it made it more interesting.
Video is very good in allowing for review and in obtaining precision, but is not as good at observing subtle details like gender and age and whether people are looking left or right. In addition, the video field of vision was often restricted.
• Pre-plan and pilot test the location and angles of the video cameras. The San Francisco team had difficulty selecting locations that were well-suited for a particular countermeasure and getting the right camera angles. As a result, they recommend developing a protocol for pilot testing the video data at each location, including site review for optimal camera placement, obtaining video, and spending some time analyzing the pilot version to make sure the camera angles are appropriate for obtaining the MOEs for the countermeasure. While this process may add one to two days of work per location, in the long run it saves time and resources.
The Miami team experienced similar difficulties with video data collection. Their initial test of the technology happened to be done at a location conducive to this type of data gathering, while most study locations proved much more difficult and complex. In retrospect, a more detailed field review would have been advisable and, given the difficulties experienced, using observers may have been preferable to using video.
• Allot extra time for reducing video data. The San Francisco team estimated that they needed four to five hours to reduce one hour of video data. They further estimated that the decision to use video added 20 – 30 percent to the costs and time needed to complete the project, adding nearly one year to the schedule.
The field teams had a large amount of data to collect at a variety of different sites. Each team considered live, on-site data collection, as well as the use of video cameras. There are a number of advantages and disadvantages associated with both data collection approaches. Each team used video to some extent to collect data, and they found a number of ways to expedite the reduction of the video data:
• Develop a customized/automated video analysis software tool to extract data from video images. The San Francisco team developed a customized video analysis software tool. Users type F keys to mark different events, and the tool records the events with timestamps directly into a spreadsheet. The tool allows users to play the video at different speeds and to go frame by frame. The tool greatly improved the ability to extract data from the video images. The Las Vegas team found that one hour of video required analyzers to rewind the video 8 to 10 times. Automated templates offered a more efficient process for data analysis.

Final System Impact Report January 2009
91
• Link signal cycles to video time stamps with automated methods. Linking the signal cycles to the video time stamps was necessary to record several of the measures of effectiveness. For a couple of reasons, the signal timing information was incorporated once the video data were collected, rather than have the data recorders observe both the signal and the pedestrian/driver behaviors. First, it was difficult to position the camera so as to see the signals and the roadway behaviors. Second, even when the cameras could be positioned to see the traffic signals, it was difficult for data recorders to judge who was where and during which signal phase. To link the signal cycle information to the video data time stamps, the San Francisco team developed a computer program which saved the team a lot of time. Once it was set up, which added about one week to the schedule, it allowed a good deal of precision and took burden off of the observer.
COUNTERMEASURE-SPECIFIC LESSONS LEARNED This section presents lessons learned regarding specific countermeasures. Lessons learned associated with two countermeasures in particular are highlighted below.
Lesson #1—Strategically Place In-street Pedestrian Signs to Reduce the Chance of Them Being Hit by Vehicles and to Maximize Their Effectiveness In-street pedestrian signs are placed in the center of the roadway prior to or at the crosswalk. Their purpose is to alert drivers that they must yield to pedestrians. The placement of the signs in the roadway, close to drivers, was expected to increase yielding behaviors over the more traditional signs that are placed on the side of the roadway.
All three field teams installed and evaluated in-street pedestrian signs, and all had issues with the signs being hit and destroyed in many locations. There are a number of ways to reduce the occurrence of the signs being destroyed by vehicles:
• Place signs on medians to reduce damage by motorists. The Miami and San Francisco teams recommend placing the signs on raised medians, and the Miami team suggests using low-level foliage on the medians to reduce the percentage of motorists that strike them. Locations with a pedestrian median or refuge are likely to be most effective.
• Place only one sign per approach and at the crosswalk. The Miami team conducted a parametric analysis of the relationship between sign location and yielding behavior to determine if placing multiple signs along an approach would lead to larger increases in driver yielding behavior. The team placed signs in multiple locations on the uncontrolled approaches to three two-way stop-controlled intersections. Based on the results, the Miami team recommends using only one sign per approach, as well as placing the sign at the crosswalk. Overall it appears that installing the signs at the crosswalk line is as effective as or more effective than any other location along the approach or than installing three signs on one approach.
• Do not use signs in locations with high truck or bus traffic. At locations with high truck traffic in Las Vegas, the signs lasted between 48 hours and 2 weeks. For example, the Las Vegas team deployed a sign near a cement mixing plant where cement trucks were frequently turning. The lifespan of the signs at that location was less than 24 hours. At locations with fewer trucks, the signs remained intact. The San Francisco team recommends considering bus routes when determining where to install the signs.

Final System Impact Report January 2009
92
• Carefully consider turning movements and lane width when determining locations for sign installation. The San Francisco team experienced high damage rates to signs located near left-turn paths at intersections. They recommend placing the signs carefully by taking into account car and truck turning movements as well as lane widths in order to reduce damage to the signs.
Lesson #2—Consider the Technical Issues Surrounding the Use of Automated Pedestrian Detection Pedestrian detection technologies, including microwave and infrared detection devices, provide the means to automatically detect the presence of pedestrians in the targeted curbside area. Technologies may also be used to detect pedestrians moving in the crosswalk. When used at the curbside area, pedestrian detection may either replace or augment the standard push button used to activate the pedestrian call. When pedestrian detection is used to detect pedestrians in the crosswalk, the purpose is to detect the presence of individuals requiring additional time to cross and, accordingly, to extend the clearance interval and to provide more time to cross.
Both the San Francisco and Las Vegas teams implemented pedestrian detection technologies in their studies and offer some lessons regarding the technology:
• Consider In-Surface Activation Devices (ISADs) as an alternative to bollards for infrared pedestrian detection at busy street corners. San Francisco used ISADs instead of two waist-high bollards to activate flashing beacons at a corner where there were a lot of crossings.
• Keep corners with automated pedestrian detection clear of parked cars to avoid false detections. In Las Vegas, parked cars were detected by the pedestrian detection device. To mitigate this issue, the team made the no parking zone near the detectors more obvious by painting the curbs red.
• Ensure that the signal control logic and the detection device are configured for proper communication. San Francisco had significant issues to overcome in making the signal controller logic compatible with the notification to extend the green from the pedestrian detection device.
• Consider building the detection equipment in-house. The Las Vegas team had difficulty getting responses from vendors for automated pedestrian detection systems. As a result, UNLV worked with its partner, the City of Las Vegas Department of Public Works, to build the detection equipment in-house. The sensors and radio transmitters were purchased.
Additional lessons learned regarding other countermeasures are shown in Table 83.

Final System Impact Report January 2009
93
Table 83. Countermeasure-specific Lessons Learned
Countermeasure Lesson(s) Learned
Public outreach and education Translate public service messages into multiple languages in order to conduct a successful outreach to non-English speaking populations.
Electronic No Turn on Red (NTOR) signs
Be prepared to demonstrate to concerned traffic engineers that the electronic NTOR sign will not significantly disrupt traffic progression along a corridor. Work with the local electrical department and vendors to make sure everything is in place for success.
Automated detection of pedestrians to extend crossing time
With the installation of an innovative use of the technology such as automated pedestrian detection comes the need for customization. The San Francisco team had to develop, test, and refine a customized detection zone scheme and logic for adjusting the signal timing. The detection software also needed to be coordinated with the traffic signal controller software.
Activated flashing beacons with infrared bollards
The flashing beacons with infrared bollards required the most substantial construction of any countermeasure, and included installation of conduit and wiring the device across a four-lane arterial. This required investigation of possible conflicts with high-risk utilities. While individual components (the detection bollards and the beacons themselves) were commercially available, the combination had to be custom-designed.

Final System Impact Report January 2009
94
CONCLUSIONS Overall, the implementation and evaluation of a comprehensive pedestrian safety program proved to be a very challenging undertaking for each of the three field teams involved. There were many lessons learned over the course of the 6-year project, ranging from assembling and maintaining communications with a diverse set of project partners, to countermeasure selection and procurement, to the details associated with the successful application of particular countermeasures.
Considering the wide range of countermeasures installed, the various pedestrian safety problems at hand, the diverse locations and study sites at which the countermeasures were installed, and the somewhat different approaches to data collection and evaluation used by the three field teams, it is not surprising that the findings are fairly mixed and in some cases counterintuitive. These were studies conducted in the field with real-world variables that could not be controlled. Nonetheless, there were many notable and promising findings from the field tests and evaluations.
For the purposes of this summary and cross-cutting analysis report, the 18 countermeasures have been classified according their effectiveness in producing measurable changes in driver and/or pedestrian behaviors, as hypothesized for the evaluations. While it is recognized that other factors can certainly impact overall countermeasure effectiveness, the classification of the countermeasures in this way was done in an attempt to give the reader an idea as to which countermeasures may have the most promise in ultimately impacting pedestrian safety and which others may not. Countermeasures were classified in one of the following four categories: high effectiveness, moderate effectiveness, low effectiveness, or effectiveness depends on application.
HIGH EFFECTIVENESS Seven of the countermeasures were classified as being highly effective in impacting behaviors related to pedestrian safety. These seven countermeasures cover a range of applications, including signal timing, active and in-street signs, call buttons that provide feedback, and roadway design elements. Each of the countermeasures offers something unique over traditional countermeasures, whether it provides additional information to pedestrians, is highly visible to pedestrians or motorists, or it gives an advantage to pedestrians when crossing. Therefore, it is not surprising that these countermeasures resulted in the most positive impacts. They include:
Leading pedestrian interval. Installed at four sites in San Francisco and two sites in Miami, the findings indicate that this countermeasure was effective at increasing left-turn driver yielding to pedestrians in the crosswalk, although the magnitude of left-turn yielding was smaller in San Francisco than in Miami (likely because left-turn driver yielding was already very high in San Francisco and therefore there was less opportunity for improvement). This effect does not appear to apply to right-turn driver yielding possibly due to the high frequency of right-turners who do not stop at a red light before turning. The Miami team also measured significant increases in pedestrian call button pushes and the number of pedestrians that started crossing at the beginning of the cycle.
Pedestrian countdown signals. The findings from the Miami sites strongly point to overall increases in safe pedestrian behavior as a result of the pedestrian countdown signals, with significant and consistent positive results for all three critical MOEs: call button pressing, pedestrians in the crosswalk at the end of flashing DON’T WALK, and pedestrian signal violations. The results from the Las Vegas study team, however, were mixed possibly due to

Final System Impact Report January 2009
95
signal timing issues at the intersections. The Las Vegas team also found a large increase in the percent of pedestrians that looked before crossing the street, which may have resulted from the animated eyes display on the countdown signal.
In-street pedestrian signs. Installed at nine sites across the three field deployment locations, in-street pedestrian crossings signs appear to be highly effective at increasing driver yielding to pedestrians. The location at the roadway centerline appears to capture drivers’ attention more effectively than roadside signs, as evidenced by large increases in driver yielding at all but one of the nine sites. However, all three study teams noted that while these signs were effective in changing behaviors, they had a very short lifespan that ultimately impacted their long-term effectiveness at many of the sites. These issues, however, can be overcome in a number of ways, including:
• Placing the signs on raised medians as opposed to at street level
• Placing only one sign at the crosswalk as opposed to using multiple signs on the approach • Avoiding use of the signs in locations with high truck or bus traffic
• Carefully considering turning movements and lane width when determining locations for sign installation
Activated flashing beacons. There were some clear increases in pedestrian safety in San Francisco. There was a significant increase in drivers yielding, corresponding decreases in pedestrian delay, and decreases in conflicts at both sites. There was an increase in yielding distance at 16th & Capp and a decrease in pedestrians trapped at Mission & Santa Rosa. Driver yielding did not change significantly at the Las Vegas site, but this could have been a result of driver yielding improvements due to the installation of other countermeasures in earlier stages. For those drivers who yielded, yielding distances increased.
Rectangular rapid flashing beacons (RRFB). There were also clear safety benefits associated with the introduction of the pedestrian activated RRFB in Miami. After installation of the RRFBs, driver yielding to both staged pedestrians and local resident crossings increased at both deployment sites, the percentage of pedestrians trapped in the middle of the road decreased at one of the sites, and evasive conflicts decreased at both sites. At one of the sites, the number of conflicts decreased each time the RRFB treatment was introduced and increased each time it was removed. At the other site, the decrease in conflicts after the RRFB was introduced was maintained each time it was removed.
Call buttons that confirm the press. Installed in both Miami and Las Vegas at a total of three intersections, this countermeasure showed a fairly strong and consistent impact on an increased use of call buttons and, in turn, a reduction in pedestrian violations and pedestrians trapped in the roadway. Call button presses increased significantly and to above 50 percent at both Miami sites, and pedestrian signal violations decreased at all three sites (however, overall pedestrian signal violations remained above 50 percent at both Miami sites). It could be difficult, however, to see the LED light in bright sunlight, making the auditory feedback more critical to the efficacy of the device.
Danish offset combined with high-visibility crosswalk, advance yield markings, and YIELD HERE TO PEDESTRIANS signs. Installed at two sites in Las Vegas, this combination of countermeasures appears to have led to an increase in safe pedestrian and driver behaviors. The Las Vegas team measured significant increases in driver yielding and diverted pedestrians as well as significant decreases in trapped pedestrians. Pedestrian delay was significantly reduced

Final System Impact Report January 2009
96
at the Lake Mead location where a designated crossing area had not previously existed, although pedestrian delay increased at Maryland and Dumont. There was no significant impact on vehicle delay at Lake Mead even though there was an increase in yielding. While driver yielding did increase significantly at the two locations, only 40 percent of drivers on Lake Mead Boulevard (mid-block location) yielded after installation of the countermeasures, while 76 percent of drivers on Maryland Parkway (signalized intersection) yielded after installation of the countermeasures. This could be a result of the location of the Danish offset, the type of Danish offset, and/or whether or not a crosswalk existed in the baseline condition. At the signalized intersection location at Maryland Parkway and Dumont, the Danish offset was made more visible with the use of bright yellow bollards and there was a crosswalk in the baseline condition. At the mid-block location along Lake Mead Boulevard, the Danish offset was perhaps less visible and was located where there was not previously a crosswalk. In addition, vehicle speed could also play a role in the results. Lake Mead Boulevard has a posted speed limit of 45 mph, while the posted speed limit on Maryland Parkway is 30 mph. Drivers may be more willing and able to yield on the lower speed roadway. In general, though, this suite of countermeasures appears to have made pedestrian crossings safer.
MEDIUM EFFECTIVENESS Four of the countermeasures were classified as being of medium effectiveness in impacting behaviors related to pedestrian safety. These countermeasures were the most difficult to classify in that there were positive findings, yet the findings were either mixed, inconsistent, or inconclusive either within or across the field locations. They include:
Electronic No Turn on Red (NTOR) sign. Tested in Miami, and compared with both the static NTOR and the static conditional NTOR, the effectiveness of the electronic NTOR sign was assessed by observing driver violations of the NTOR restriction, right-turn drivers making complete stops, and pedestrian-vehicle conflicts. Use of the electronic NTOR sign resulted in the fewest turning violations overall (32 percent) of the three signs tested and markedly fewer turning violations when a pedestrian was present at the curb (only 25 percent as compared to over 90 percent with the static signs). Following installation of the electronic sign, there was also a large increase in the percentage of violators who came to a complete stop before violating the turn restriction.
Prohibition of permissive left turns. Installed at one site in Miami, the data indicate that this countermeasure may be an effective way to improve pedestrian safety at intersections by reducing pedestrian-vehicle conflicts; however, the findings also indicate that there was a substantial portion of left-turners that violated the red signal. While this countermeasure has potential for increasing pedestrian safety, the signal configuration should be taken into consideration in order to mitigate left-turners violating the signal.
Portable speed trailers. Installed in all three field locations, the primary MOE for assessing the effectiveness of speed trailers was average vehicles speed and driver yielding. The San Francisco team measured significant reductions in speed at their two test sites, while the Miami team did not. Significant increases in driver yielding at the San Francisco sites translated into decreases in pedestrian delays. There was an increase in driver braking mid-block in Miami, but no significant increase in driver yielding in Las Vegas. Based on these findings, it appears that the speed trailers can impact drivers’ speeds and possibly increase their awareness of the presence of pedestrians at these locations, but it is unlikely that these impacts will remain once the signs are removed.

Final System Impact Report January 2009
97
Automated pedestrian detection (to activate or extend pedestrian crossing phase). Installed in both San Francisco and Miami, the only significant finding was a 9 percent reduction in the percentage of pedestrians trapped in the roadway at the Miami site (where the automated pedestrian detection was used to initiate the pedestrian crossing phase). While these results suggest that pedestrians may have been making safer crossings, there were no measurable impacts of the pedestrian detection systems on pedestrian clearance (those clearing before the end of the WALK or clearance phases) or conflicts with motor vehicles (which were generally low to begin with). In San Francisco, where the automated pedestrian detection was used to extend the pedestrian crossing phase, the team noted promise for the technology, but recommends further testing and refinement.
LOW EFFECTIVENESS Five of the countermeasures were classified as having low effectiveness in impacting behaviors related to pedestrian safety. Three of these countermeasures were pavement markings and two were static signs. These five countermeasures are relatively static and it is not surprising that they did not produce more significant results. The low effectiveness countermeasures include:
High visibility crosswalks. Tested at three locations in Las Vegas, there were no significant increases in driver yielding at any of the sites, and yielding distance results were inconsistent across the sites. There were significant reductions in drivers blocking the crosswalk at one of the sites. The results showed that high visibility crosswalks do not appear to be effective in changing driver behaviors in the vicinity of the crosswalks. This result could be due in part to the fact that the crosswalk markings deteriorated in a matter of weeks as a result of the heat causing a release of oils in the pavement.
Advance yield markings. Installed at two locations in San Francisco, there were no significant changes in driver yielding, vehicle stop position, or pedestrian-vehicle conflicts at either site after installation of the advance stop lines. Based on these results, it appears that advance stop lines had no impacts on driver behavior or pedestrian safety.
LOOK pavement stencils. Installed at four sites in San Francisco, there were few impacts on pedestrian looking behaviors and no impact on pedestrian-vehicle conflicts. Although the LOOK stencil markings are one of the least expensive countermeasures tested, the results indicate that this is not an effective countermeasure. Additionally, the San Francisco team noted that they were highly susceptible to fading and blemishes (similar to the high visibility crosswalk treatments in Las Vegas).
TURNING TRAFFIC YIELD TO PEDESTRIANS signs. Installed at eight sites across the three field test locations, driver yielding behavior was the primary MOE for assessing the effectiveness of these signs. While there were a few significant changes found across the eight sites, there were inconsistencies in what changes were found and at which sites. These findings limit the conclusions that can be made regarding the effectiveness of these signs.
Pedestrian zone signs. Installed at one site in Miami, the results indicate that the countermeasure was not effective in reducing speed or increasing driver yielding / braking in the presence of pedestrians. The researchers have suggested that this ineffectiveness may be related to the low speeds observed prior to deployment, and therefore there was not much margin for improvement.

Final System Impact Report January 2009
98
EFFECTIVENESS DEPENDS ON APPLICATION The effectiveness of two of the countermeasures seemed to depend mostly on the application, with positive impacts in one application and less positive impacts in another application. These countermeasures include:
Median refuge island. Based on the results, it appears that the installation of a median refuge island at a mid-block location was effective in increasing driver yielding to pedestrians and reducing pedestrian delay, while the median refuge islands at the signalized intersections in San Francisco appear to be less effective at altering driver and pedestrian behaviors.
Dynamic lighting. The findings from the Las Vegas team that tested the impacts of dynamic lighting at a high-visibility crosswalk location suggest that dynamic lighting used with automatic pedestrian detection increases safe driver and pedestrian behaviors. Driver yielding and pedestrian diversion increased significantly while the percent of trapped pedestrians significantly decreased. While driver yielding increased, its prevalence was still low at 35 percent. In Miami, the addition of dynamic lighting to a crosswalk that had a RRFB did not appear to further improve driver yielding or pedestrian-vehicle conflicts. The Miami researchers suggested that this may have occurred because the dynamic lighting is not very noticeable in the presence of highly intense flashing beacons.

Final System Impact Report January 2009
99
REFERENCES 1. San Francisco PedSafe Phase II Data Analysis Report, Federal Highway Administration,
U.S. Department of Transportation, Washington, DC, January 31, 2008.
2. Working Draft, San Francisco PedSafe Phase II, Final Report and Executive Summary, http://safety.fhwa.dot.gov/ped_bike/ped/ped_scdproj/sf/pedsafety_sf.pdf, Federal Highway Administration, U.S. Department of Transportation, Washington, DC, January 11, 2008.
3. Miami-Dade Pedestrian Safety Project: Phase II FINAL IMPLEMENTATION REPORT AND EXECUTIVE SUMMARY, http://safety.fhwa.dot.gov/ped_bike/ped/ped_scdproj/miami/pedsafety_miami.pdf, Federal Highway Administration, U.S. Department of Transportation, Washington, DC, August 25, 2008.
4. Pedestrian Safety Engineering and Intelligent Transportation System-Based Countermeasures Program For Reducing Pedestrian Fatalities, Injuries, Conflicts, and Other Surrogate Measures, Las Vegas Phase II Final Technical Report, Federal Highway Administration, U.S. Department of Transportation, Washington, DC, September 2, 2008.


![Food security and nutrition: building a global narrative ... · EXECUTIVE SUMMARY EXECUTIVE SUMMARY EXECUTIVE SUMMARY EXECUTIVE SUMMAR Y [ 2 ] This document contains the Summary and](https://static.fdocuments.in/doc/165x107/5ff5433612d22125fb06e6b5/food-security-and-nutrition-building-a-global-narrative-executive-summary-executive.jpg)