
Pedagogical study of an electric bike with low energy ... · stand the meaning of torque, speed and...
12
Pedagogical study of an electric bike with low energy consumption, management and dimensioning of onboard energy : eco marathon ARNAUD SIVERT 1 , FRANCK BETIN 1 , THIERRY LEQUEU 2 : [email protected], [email protected], [email protected] (1) Institut Universitaire de Technologie de l’Aisne Département Génie Electrique SOISSONS Laboratory for Innovative Technologies (L.T.I), Team Energy Electric and Associated System (2) Institut Universitaire de Technologie de Tours, Département GEII, 37200 TOURS. Abstract: - The electric bike is a very good educational system because it can be used by all students without problem of safety. When pedaling on the electric bike, the student can identify with the motor drive and under- stand the meaning of torque, speed and power. This educational system uses many modules of Electrical Engi- neering: power converter, battery, motor, controller, electronics, lights, instrumentation, sensors, mathematical modeling, mechanics... Thus, many technologies can be presented. These vehicles have a difficult compromise between weight, power, battery life, and price. These vehicles could be implemented using new composite materials and new Lithium batteries. But to increase the lifespan of the batteries, which represent 35 % of the electric vehicle price, we will demonstrate the benefits of a control with constant power through the motor, compared to a control with a con- stant force. This paper will outline the resistive power, as a function of vehicle speed and the state of energy consumption. A comparison of energy prices between different kinds of electric vehicle will be presented. The advantages and disadvantages of using super capacitors will be presented, as well as energy management on board the motor speed controller. Then, an overview of the regulation of a fast charger with current control and voltage control will be presented. Finally, many educational applications will be presented around the electric vehicle realized. Key-Words - Challenge Eco Marathon, motor control constant power, Lithium battery, motorized electrical cycle, project-based teaching, battery charger, super capacity, energy management. 1 INTRODUCTION Vehicles with low electric power consumption [1, 2, 3, 4] are becoming new actors for transport in our congested cities. This type of vehicle meets the demand of minimizing the production of CO2 and responds also to the future energy transitions. We will see that it is possible to build vehicles traveling at 80 km/h maximum with a engine power of less than 4000 W. We will see that the energy consumption can reach a value of 560 Wh/100km at an average speed of 50 km/h, with a autonomy of 180km, so a consumption of 1600 km with the equivalent of a liter of petrol. The electric bike is a very good educational sys- tem because it can be used by all students without problem of safety. When pedaling, the student can identify with the motor drive and understand the meaning of torque, speed and power. This educa- tional system uses many modules of Electrical Engineering: power converters, battery, motor, controllers, electronics, lights, instrumentation, sensor, mathematical modeling, mechanics... We will now define the vehicle mathematically to understand its characteristics (maximum speed, size, acceleration...). For the sake of simplicity, we will not go into detail regarding the mechani- cal losses of the engine, the control (speed control and/or current), the power electronics... Firstly, we will briefly present the resistant power as a function of the vehicle speed and then present the dimensioning of the vehicle, the control of electric motors and finally the cost of this trans- portation way. 2 FORCE AND RESITIVE POWER AT A FIXED SPEED The resistive force [5] depends on the rolling re- sistance, the gradient of the road and air resis- tance. Their respective equations are: Air slope Rolling resistive F F F ) N ( F + + = (1) (%) Slope g ) kg ( M ) N ( F Slope ⋅ ⋅ = (2) [ ] 2 wind air Air S ) s / m ( S f ) N ( F + ⋅ = = 2 wind ) S S ( Cx S 2 1 + ⋅ ⋅ ⋅ ρ ⋅ WSEAS TRANSACTIONS on ADVANCES in ENGINEERING EDUCATION Arnaud Sivert, Franck Betin, Thierry Lequeu E-ISSN: 2224-3410 54 Volume 11, 2014
Transcript of Pedagogical study of an electric bike with low energy ... · stand the meaning of torque, speed and...
Pedagogical study of an electric bike with low energy consumption, management and dimensioning of onboard energy : eco marathon
ARNAUD SIVERT1, FRANCK BETIN1, THIERRY LEQUEU2 :
[email protected], [email protected], [email protected] (1) Institut Universitaire de Technologie de l’Aisne Département Génie Electrique SOISSONS
Laboratory for Innovative Technologies (L.T.I), Team Energy Electric and Associated System (2) Institut Universitaire de Technologie de Tours, Département GEII, 37200 TOURS.
Abstract: - The electric bike is a very good educational system because it can be used by all students without problem of safety. When pedaling on the electric bike, the student can identify with the motor drive and under-stand the meaning of torque, speed and power. This educational system uses many modules of Electrical Engi-neering: power converter, battery, motor, controller, electronics, lights, instrumentation, sensors, mathematical modeling, mechanics... Thus, many technologies can be presented. These vehicles have a difficult compromise between weight, power, battery life, and price. These vehicles could be implemented using new composite materials and new Lithium batteries. But to increase the lifespan of the batteries, which represent 35 % of the electric vehicle price, we will demonstrate the benefits of a control with constant power through the motor, compared to a control with a con-stant force. This paper will outline the resistive power, as a function of vehicle speed and the state of energy consumption. A comparison of energy prices between different kinds of electric vehicle will be presented. The advantages and disadvantages of using super capacitors will be presented, as well as energy management on board the motor speed controller. Then, an overview of the regulation of a fast charger with current control and voltage control will be presented. Finally, many educational applications will be presented around the electric vehicle realized. Key-Words - Challenge Eco Marathon, motor control constant power, Lithium battery, motorized electrical cycle, project-based teaching, battery charger, super capacity, energy management.
1 INTRODUCTION Vehicles with low electric power consumption [1, 2, 3, 4] are becoming new actors for transport in our congested cities. This type of vehicle meets the demand of minimizing the production of CO2 and responds also to the future energy transitions. We will see that it is possible to build vehicles traveling at 80 km/h maximum with a engine power of less than 4000 W. We will see that the energy consumption can reach a value of 560 Wh/100km at an average speed of 50 km/h, with a autonomy of 180km, so a consumption of 1600 km with the equivalent of a liter of petrol. The electric bike is a very good educational sys-tem because it can be used by all students without problem of safety. When pedaling, the student can identify with the motor drive and understand the meaning of torque, speed and power. This educa-tional system uses many modules of Electrical Engineering: power converters, battery, motor, controllers, electronics, lights, instrumentation, sensor, mathematical modeling, mechanics...
We will now define the vehicle mathematically to understand its characteristics (maximum speed, size, acceleration...). For the sake of simplicity, we will not go into detail regarding the mechani-cal losses of the engine, the control (speed control and/or current), the power electronics... Firstly, we will briefly present the resistant power as a function of the vehicle speed and then present the dimensioning of the vehicle, the control of electric motors and finally the cost of this trans-portation way.
2 FORCE AND RESITIVE POWER AT A FIXED SPEED The resistive force [5] depends on the rolling re-sistance, the gradient of the road and air resis-tance. Their respective equations are:
AirslopeRollingresistive FFF)N(F ++= (1) (%)Slopeg)kg(M)N(FSlope ⋅⋅= (2)
[ ]2windairAir S)s/m(Sf)N(F +⋅= = 2
wind )SS(CxS21
+⋅⋅⋅ρ⋅
WSEAS TRANSACTIONS on ADVANCES in ENGINEERING EDUCATION Arnaud Sivert, Franck Betin, Thierry Lequeu
E-ISSN: 2224-3410 54 Volume 11, 2014
The rolling forces depend on the kind, and width of tires and of kind the road. They are represented by the coefficient krolling. But, the width of the tire depends on the maximum speed, acceleration, and braking of the vehicle mass. For the speed superior at 25 km/h, the rolling forces are very small compared to the aerodynam-ic force of the air, which depends on the surface area S, turbulence and therefore Cx. To model the resistive power of a vehicle, it is easier to use the speed (S in km/h) with the fol-lowing equation:
)h/km(S)kk(Sk)W(P sloperolling3
aeroresistive ⋅++⋅= (4) With kslope in Watt/(km/h) and kaero in Watt/(km/h)3 The order of magnitude of these coefficients for the vehicles tested is: Type de cycle / coef kaero krolling weight kg Mountain e-bike 0,0066 7,30 25 e-Tricycle 0,0051 7,50 30 e-Bent rider 0,0040 5,00 25 e-Velomobile [12] 0,0018 4,06 50 Small car 0,05 100,00 1000
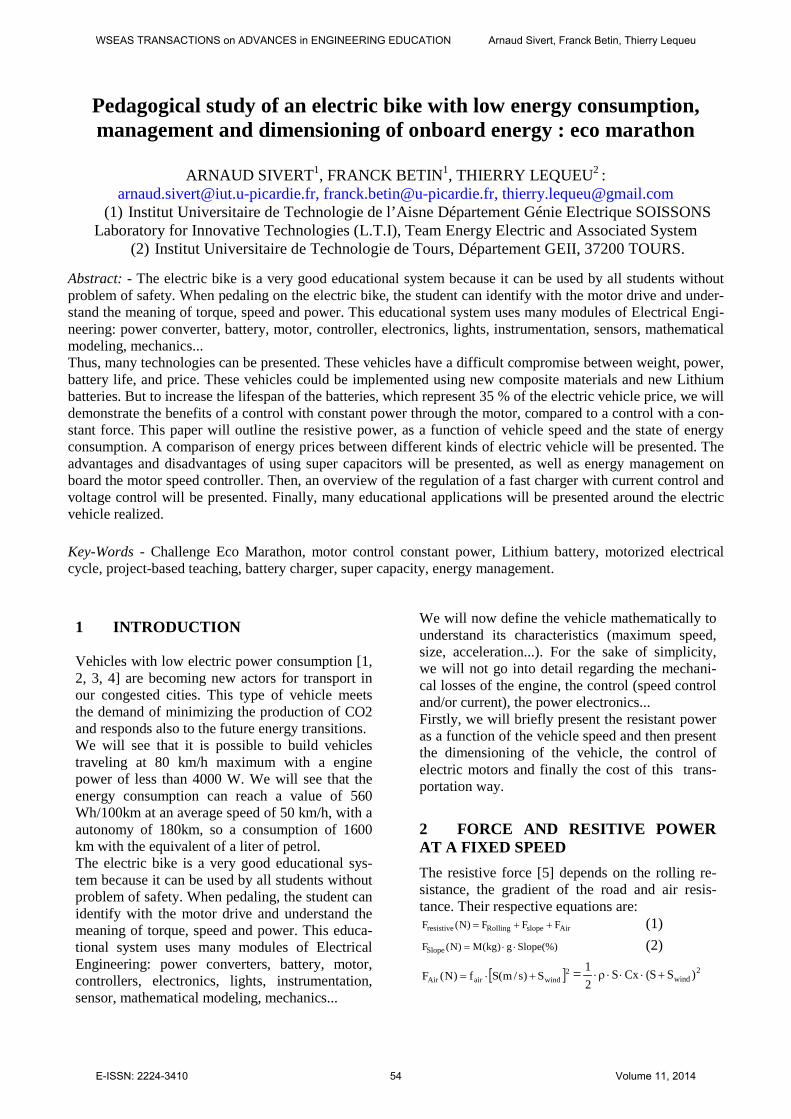
Table 1 : power coefficient of vehicles [12] With of low value coefficients, there are of low consumption. Due to the slope force caused the weight of the vehicle, the energy consumption will increase in daily use. From the typical energy consumption of vehicles, the graph in Figure 1 shows the average speed as a function of energy consumption per 100km and per person.
Fig. 1. Average speed based on energy consumption
per 100 km and per person [12]. Figure 1 shows us that only light vehicles lead to low energy consumption. Similarly, electric ve-hicles have a lower consumption than those of petrol because the efficiency of the electrical mo-
tors is 90 %, while the petrol vehicles are around 30 %. Therefore, the streamlined tricycle, called velo-mobile [14], has low energy consumption with respectable speeds. In addition, the streamlining reduces the impact of bad weather conditions and insulates during cold winters. This type of vehicle is made for challenges such as the Eco-Marathon [15, 16] but with low aver-age speeds (30 km/h) and ergonomics that do not allow daily use. In this Challenge, electric motors have supplanted combustion engines with a record consumption of 7000 km for the equivalent of one liter of petrol. We will see the dimensioning of a streamlined electric tricycle that can be used daily and find out whether muscular strength is relevant. To conduct this dimensioning, we must answer the following questions:
• What is the mass of the vehicle and what will it transport?
• What speed and maximum acceleration will the vehicle have? (this will determine the pow-er of the motor)
• What is the objective of vehicle autonomy and consumption? (which defines the energy ca-pacity of the battery and hence its weight)
• What is the budget for the designed vehicle? Finding the perfect compromise is not an easy thing, because all these specifications are related. For example, if you want to go faster then the motor power will be larger, so the engine will be heavier. You will have to use more energy for your battery capacity or more efficient technolo-gies and your budget will increase. We will im-pose a specification for the vehicle, which is to use city and country roads without interfering with traffic.
3 CONSUMPTION OF A ELECTRIC E-VELOMOBILE
The vehicle shall carry a person who weighs 80 kg and is 1.8 m tall, with 15 kg of luggage (vo-lume 20 liters) on the classic road. The vehicle must be less than 50 kg when empty and have a low consumption. The maximum speed it will reach is 80 km/h, with a range of 200 km. The dimensions of the vehicle must be less than 2.7 m in length, a width of 0.8 m and a height of 1
WSEAS TRANSACTIONS on ADVANCES in ENGINEERING EDUCATION Arnaud Sivert, Franck Betin, Thierry Lequeu
E-ISSN: 2224-3410 55 Volume 11, 2014

m. The ergonomics of the vehicle will allow of pedaling for long journeys and easy entry. From the coefficients in table 1, the power versus a speed can be seen in the following figure:
Fig. 2. Motor power vs the speed and the slope. [10,11] In this figure, we can see that the fairing allows very low power consumption of a velomobile compared to a regular bike, but requires 40 kg extra. Therefore, for a power of 3 kW and a slope of 5%, the consumption is identical to 40 km/h. The average power of a person pedaling is 150 W to 300 W at a pedal speed of 30 rev/min to 100 rev/min. However, on the flat, for a velomobile up to 50 km/h, resistive power is 430 W, so muscle power human can provide 50% of the power required. Therefore, muscle power human strongly increas-es autonomy and provides exercise. However, muscle power is derisory on uphill roads. Now that the resistive power is known, it is neces-sary to know the power required for respectable acceleration. The motors are often controlled us-ing constant force. We will look at the vehicle performance with this type of command [6].
4 MOTOR WITH CONTROL CON-STANT FORCE
Constant motor force during dynamic phases is ensured by limitation of the motor current, which in our case is 80 A. Therefore, the driving force during acceleration will be 328 Nm, since the torque constant of our engine is 4.1 Nm/A. With a 72 V battery, the maximum power is 5700W this voltage allows us to reach the speed of 17.5 m/s or 63 km/h. Constant force causes a constant acceleration and linear speed increase corresponding to the follow-ing equation if we neglect the air resistive force:
(5) With Fm(N) representing the motor force, t the time (s). During acceleration, operation at constant force causes a significant peak of current to be supplied from the batteries. For a vehicle mass of 100 kg, and flat road, the acceleration and deceleration will be 6 seconds both to reach 17.5 m/s and get back to stationary. In Figure 3b, the speed and energy consumption can be observed without neglecting the force of air resistance. This energy is composed of the kinetic energy and the energy required by the resistive force. The energy corresponds to the following equation:
(6) For example, during acceleration, the energy re-quired (7) is equal to:
= 4,7Wh It may be noted that the energy recovered during deceleration corresponds almost to the energy of acceleration to the resistance force nearly. It may be noted in figure 3a, the high peak current supplied by the battery during acceleration and during regeneration.
Fig. 3a. Limiting the motor current at 80A.
Fig. 3b. Speed performance and energy consumption
with constant force control.
3600 1 )
2 t
t S F S M
2 1 ( ) H . W ( E
2
acc tive resis 2 ⋅ ⋅ ⋅ + ⋅ =
dt ) t ( S ) t ( F E E ) J ( E m tive resis force kinetic ⋅ ⋅ = + = ∫
) 0 t ( S t ) kg ( M
) F F ( ) s / m ( S tive resis m = + ⋅ − =
Power motor (Watt )
speed (km/h)
velomobile slope 0%
Mountain bike 0%
Mountain bike 110 kg slope 5%
velomobile slope 5% 150kg
WSEAS TRANSACTIONS on ADVANCES in ENGINEERING EDUCATION Arnaud Sivert, Franck Betin, Thierry Lequeu
E-ISSN: 2224-3410 56 Volume 11, 2014
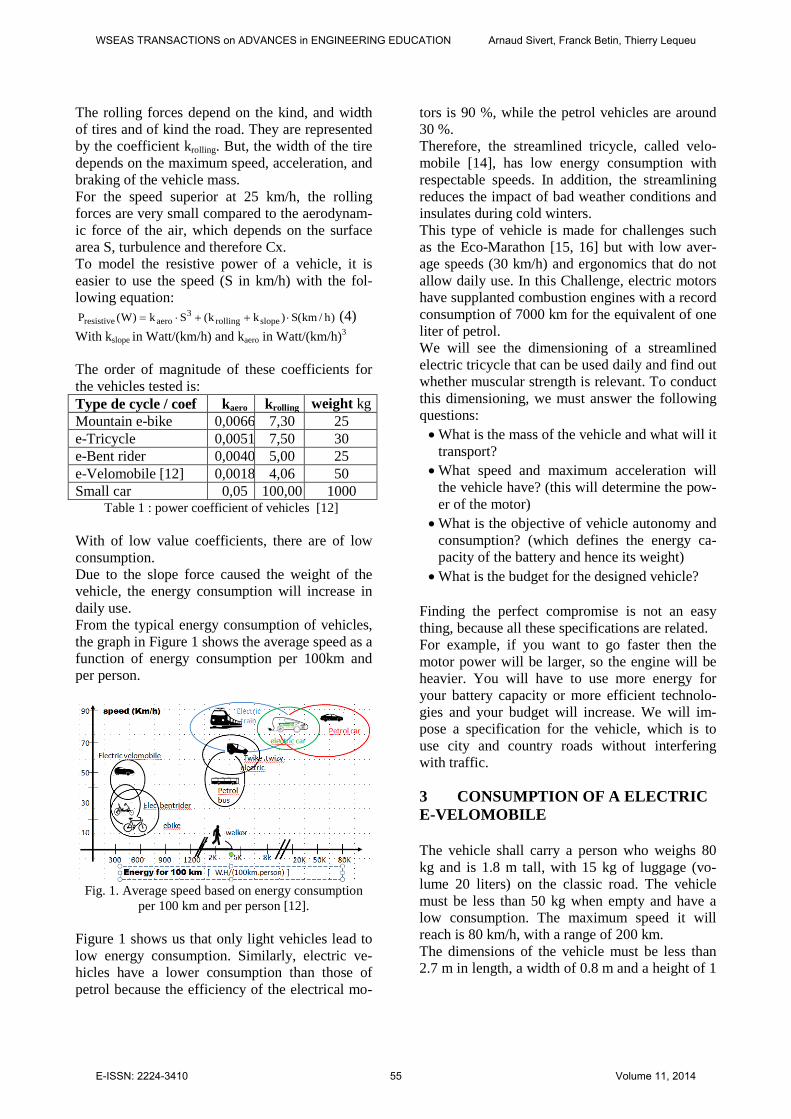
But all batteries are limited by the rate of dis-charge currents and the charging rate to avoid damage. So there is a compromise between the desired performance and maximum current al-lowed by the battery.
The following table shows the price of batteries according to discharge rates and their type [12].
types of batteries Size & Volume cm3 Weight Price 2013
Rate charge max
rate discharge max,
Rtotal
li-po 20 Ah 18S (0.8*20.6*10) 3000 7.5 kg 620 € 20 A = 1C 60 A = 3C 1 mΩ li-po 20 Ah 18S (1*22*10) 3960 9 kg 1000 € 50A = 2.5C 360 A = 15 C 0.5mΩ Li-fer 20 Ah 22S (0.8*22.8*16) 6600 11 kg 650 € 20 A = 1C 60 A = 3C 5 mΩ Super capa 30S 58 F/75 V 1.6Wh
(Ø4*7.6) 3650 maxwell
3.7 kg 900 € 20 A 200A max 20 A
10 mΩ
Super capa 30S 1600F/75 V 45Wh
(Ø6.0*8.5) 9100 samwha
10.5 kg 1100€ 60A 1240 A max 60A
1.8 mΩ
Super capa 30S 50F/75 V 1.4Wh
(Ø1.8*4) 400 samxon
0.6 kg 90 € 14A 70 A max 14 A
6 mΩ
Table 2 : Comparison of different types of batteries 72V/20Ah ( 1440Wh)
In this table, it can be observed that the weight, the volume and, especially the price, increase when the rate of discharge is large. In addition, the regeneration current must be limited by the rate of battery charging. We can observe that the price of super-capacitors is relatively high compared to batteries. Supercaps can withstand a very large current discharge and charge but they have low energy content. They accept a large number of cycles of charge and discharge 1000 times more than a battery. To minimize the discharge and charge battery current, we will see that constant power control is more appropriate than constant force.
5 CONSTANT POWER MOTOR COMMAND
When the battery power is limited, the engine will run at constant power Pm limit. To establish the performance of the vehicle, it is necessary to solve the differential equation (8). Neglecting the resis-tive force, the resolution of the equation (8) gives the speed (9) and displacement (10):
ttansisReitlimm F
dtdVM
VP
+= (8)
2/1itlimm tM
P2)s/m(S ⋅
⋅=
(9)
2/3itlimm t32
MP2
)m(D ⋅⋅⋅
=
(10)
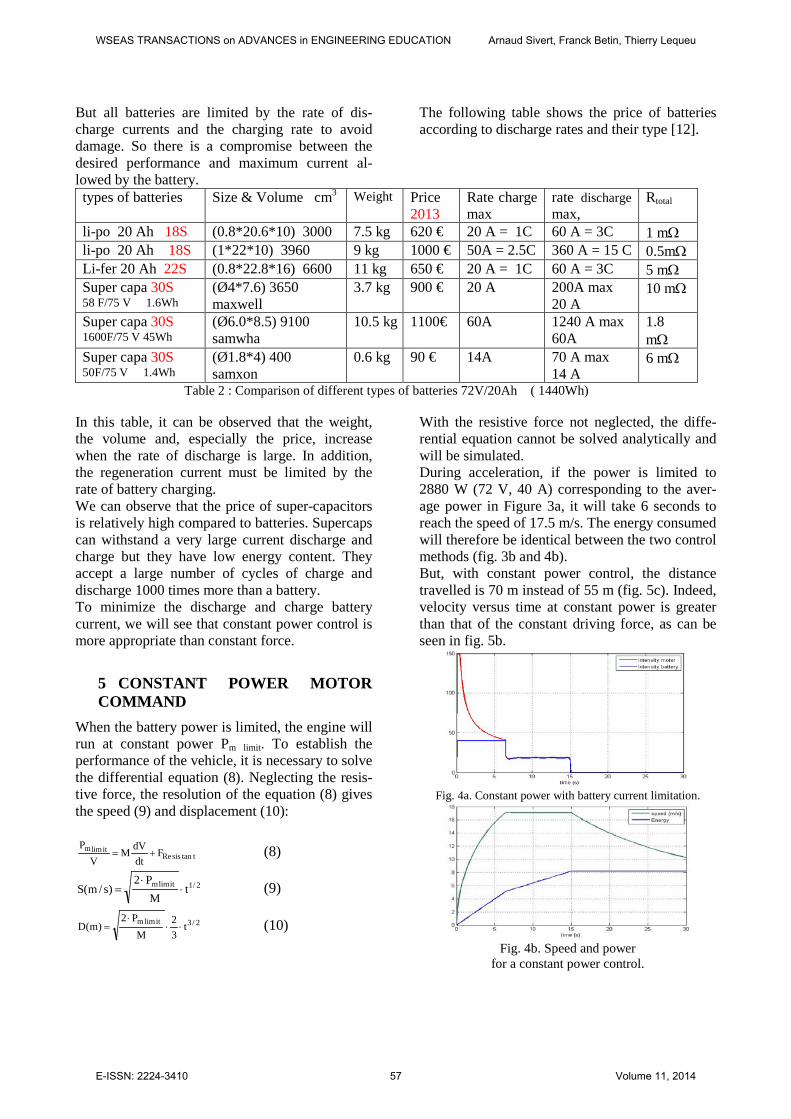
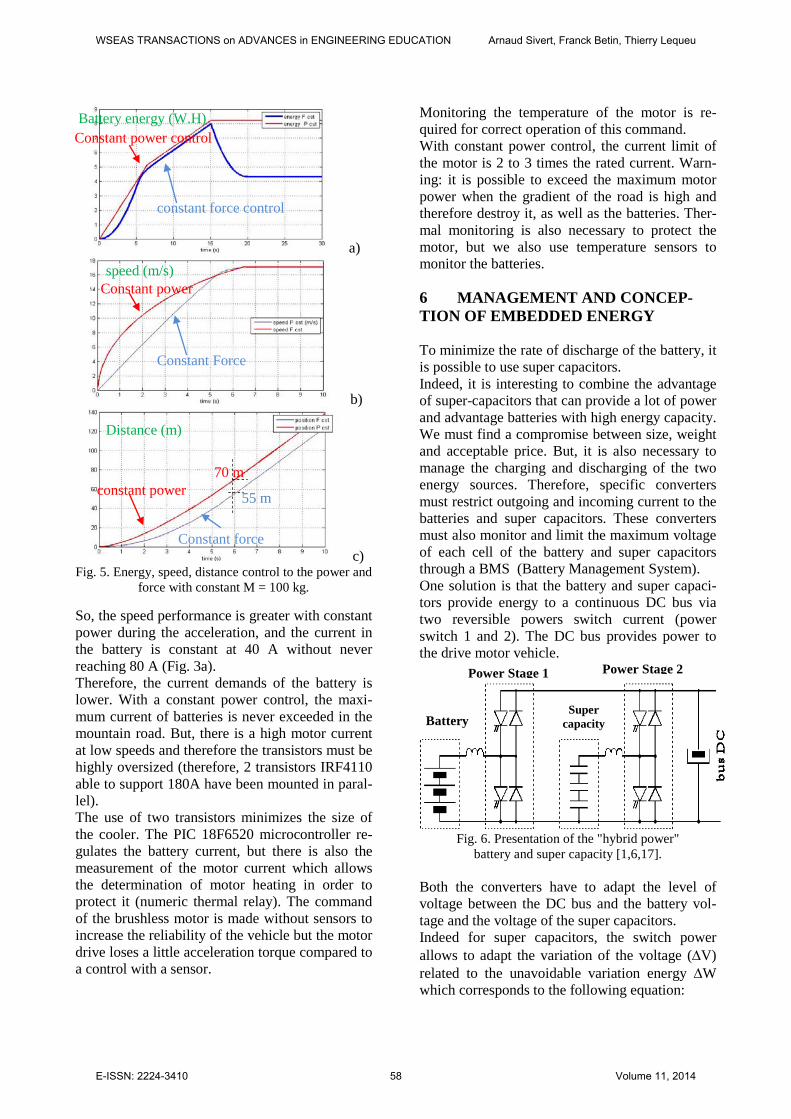
With the resistive force not neglected, the diffe-rential equation cannot be solved analytically and will be simulated. During acceleration, if the power is limited to 2880 W (72 V, 40 A) corresponding to the aver-age power in Figure 3a, it will take 6 seconds to reach the speed of 17.5 m/s. The energy consumed will therefore be identical between the two control methods (fig. 3b and 4b). But, with constant power control, the distance travelled is 70 m instead of 55 m (fig. 5c). Indeed, velocity versus time at constant power is greater than that of the constant driving force, as can be seen in fig. 5b.
Fig. 4a. Constant power with battery current limitation.
Fig. 4b. Speed and power
for a constant power control.
WSEAS TRANSACTIONS on ADVANCES in ENGINEERING EDUCATION Arnaud Sivert, Franck Betin, Thierry Lequeu
E-ISSN: 2224-3410 57 Volume 11, 2014
a)
b)
c) Fig. 5. Energy, speed, distance control to the power and
force with constant M = 100 kg.
So, the speed performance is greater with constant power during the acceleration, and the current in the battery is constant at 40 A without never reaching 80 A (Fig. 3a). Therefore, the current demands of the battery is lower. With a constant power control, the maxi-mum current of batteries is never exceeded in the mountain road. But, there is a high motor current at low speeds and therefore the transistors must be highly oversized (therefore, 2 transistors IRF4110 able to support 180A have been mounted in paral-lel). The use of two transistors minimizes the size of the cooler. The PIC 18F6520 microcontroller re-gulates the battery current, but there is also the measurement of the motor current which allows the determination of motor heating in order to protect it (numeric thermal relay). The command of the brushless motor is made without sensors to increase the reliability of the vehicle but the motor drive loses a little acceleration torque compared to a control with a sensor.
Monitoring the temperature of the motor is re-quired for correct operation of this command. With constant power control, the current limit of the motor is 2 to 3 times the rated current. Warn-ing: it is possible to exceed the maximum motor power when the gradient of the road is high and therefore destroy it, as well as the batteries. Ther-mal monitoring is also necessary to protect the motor, but we also use temperature sensors to monitor the batteries.
6 MANAGEMENT AND CONCEP-TION OF EMBEDDED ENERGY To minimize the rate of discharge of the battery, it is possible to use super capacitors. Indeed, it is interesting to combine the advantage of super-capacitors that can provide a lot of power and advantage batteries with high energy capacity. We must find a compromise between size, weight and acceptable price. But, it is also necessary to manage the charging and discharging of the two energy sources. Therefore, specific converters must restrict outgoing and incoming current to the batteries and super capacitors. These converters must also monitor and limit the maximum voltage of each cell of the battery and super capacitors through a BMS (Battery Management System). One solution is that the battery and super capaci-tors provide energy to a continuous DC bus via two reversible powers switch current (power switch 1 and 2). The DC bus provides power to the drive motor vehicle.
Fig. 6. Presentation of the "hybrid power"
battery and super capacity [1,6,17]. Both the converters have to adapt the level of voltage between the DC bus and the battery vol-tage and the voltage of the super capacitors. Indeed for super capacitors, the switch power allows to adapt the variation of the voltage (∆V) related to the unavoidable variation energy ∆W which corresponds to the following equation:
speed (m/s) Constant power
Constant Force
Battery energy (W.H)
Distance (m)
Constant power control
constant force control
constant power
Constant force
70 m
55 m
Battery Super
capacity
Power Stage 1 Power Stage 2
WSEAS TRANSACTIONS on ADVANCES in ENGINEERING EDUCATION Arnaud Sivert, Franck Betin, Thierry Lequeu
E-ISSN: 2224-3410 58 Volume 11, 2014
( ) 2
SC2
min2
maxSC)Joule( VC21VVC
21W ∆⋅⋅=−=∆ (11)
with, Csc as the value of the super capacitor. The principle behind the control of the 2 switch power is to maintain constant voltage on the DC bus which supplies the drive of the vehicle. Regu-lation of the two switch power can be done with a cheap microcontroller using simple fuzzy logic controller [8]. The brake levers are equipped with switches to cut off the motor, control the choppers and the rear brake light. When the mechanical front brakes are activated, there is an electric braking of 10A (1C for 10Ah batteries and a recovery of 720W). If the throttle handle is at 0%, without pedaling there is light electric braking of only 5A (360W) on the batteries. All our motorized cycles are rear wheel drive (rear motor) which does not allow high braking at the rear. Indeed, we must provide 70% braking at the front and 30% rear, otherwise over steer is assured (rear drift). If you’ve just fully charged the batteries and begin a long des-cent, the battery will be soon be full, and BMS stops regeneration. There won’t be any braking in these circumstances; this is detrimental to driving. Therefore, super capacitors will be size only to minimize the rate of discharge to 20A when the battery also provides 20A. The voltage of the su-percaps was chosen to be 24V to minimize the price and size, with 9 supercaps in series of 500F. The acceleration phase energy is 4.7Wh from equations (6 and 7). With hybrid power, the su-percaps will recharge as soon as the battery cur-rent is less than 20A and will depend on the speed that you go at. The problem of managing the super capacitors is that after an initial acceleration of 2880W, it takes some time for them to be charged to 100%. So the driver sometimes has slower ac-celeration and this is also problematic for driving. Another, much simpler, solution than hybrid pow-er is to put 2 super capacitors in parallel on each battery element. Indeed, in recent years the price of super capacitors has declined sharply with in-ternal resistances much lower than that of the battery. Therefore, the peak current will be pro-vided by super capacitors. Note: the super capaci-tor voltage will never be exceeded due to the vol-tage threshold of the battery cells which is much lower than the voltage of 2 super capacitors in series.
We will now see how the controller handles the control of a motor cycle.
7 DYNAMIC EXPERIMENTAL AND CONTROL ELECTRIC CYCLE
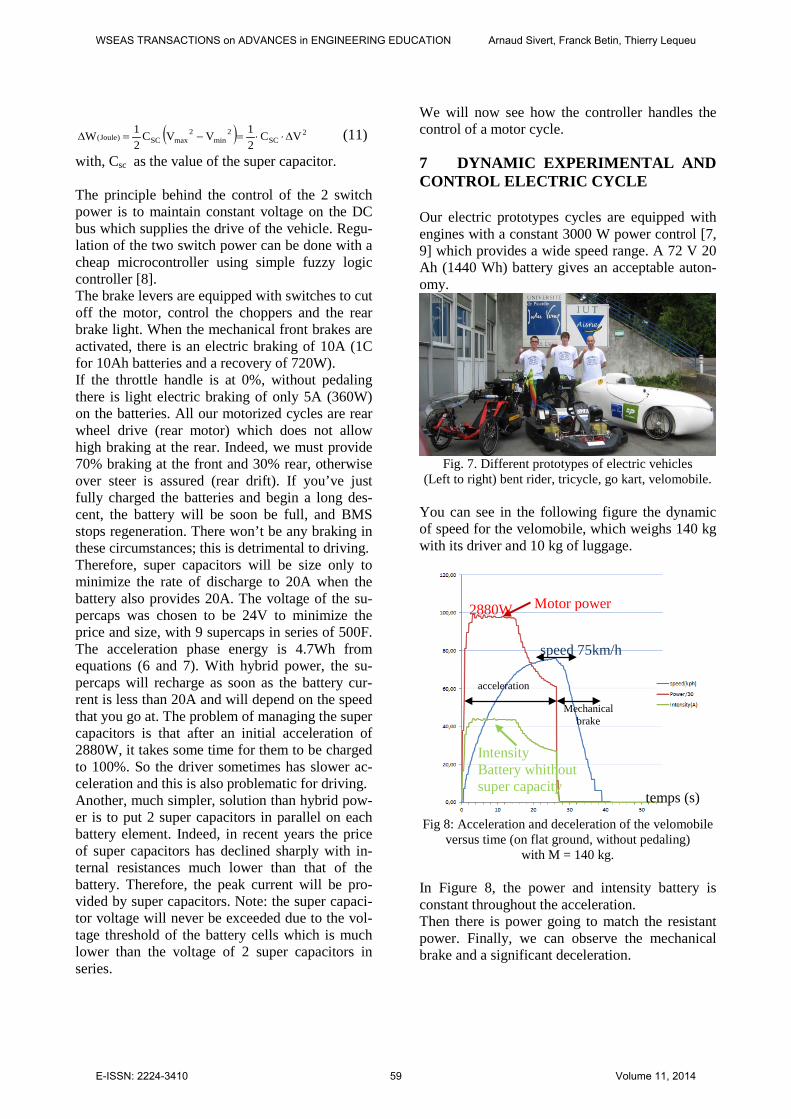
Our electric prototypes cycles are equipped with engines with a constant 3000 W power control [7, 9] which provides a wide speed range. A 72 V 20 Ah (1440 Wh) battery gives an acceptable auton-omy.
Fig. 7. Different prototypes of electric vehicles
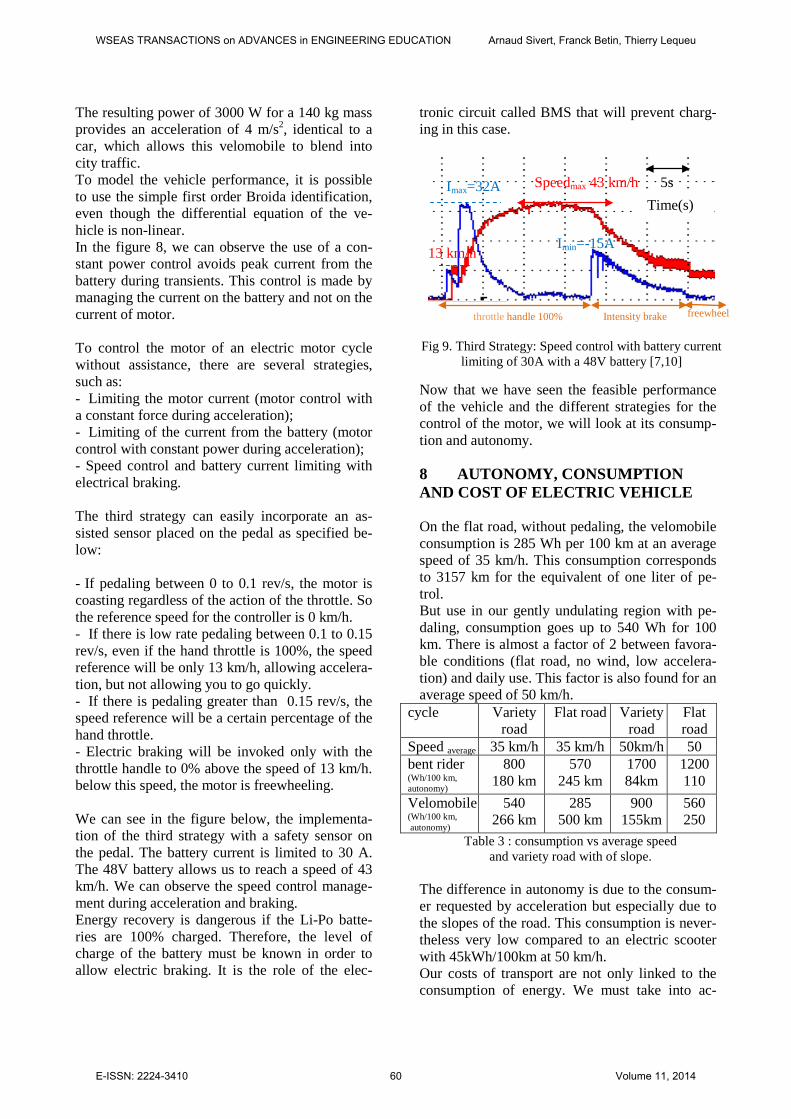
(Left to right) bent rider, tricycle, go kart, velomobile. You can see in the following figure the dynamic of speed for the velomobile, which weighs 140 kg with its driver and 10 kg of luggage.
Fig 8: Acceleration and deceleration of the velomobile
versus time (on flat ground, without pedaling) with M = 140 kg.
In Figure 8, the power and intensity battery is constant throughout the acceleration. Then there is power going to match the resistant power. Finally, we can observe the mechanical brake and a significant deceleration.
speed 75km/h
Motor power
Intensity Battery whithout super capacity
2880W
temps (s)
acceleration
Mechanical brake
WSEAS TRANSACTIONS on ADVANCES in ENGINEERING EDUCATION Arnaud Sivert, Franck Betin, Thierry Lequeu
E-ISSN: 2224-3410 59 Volume 11, 2014
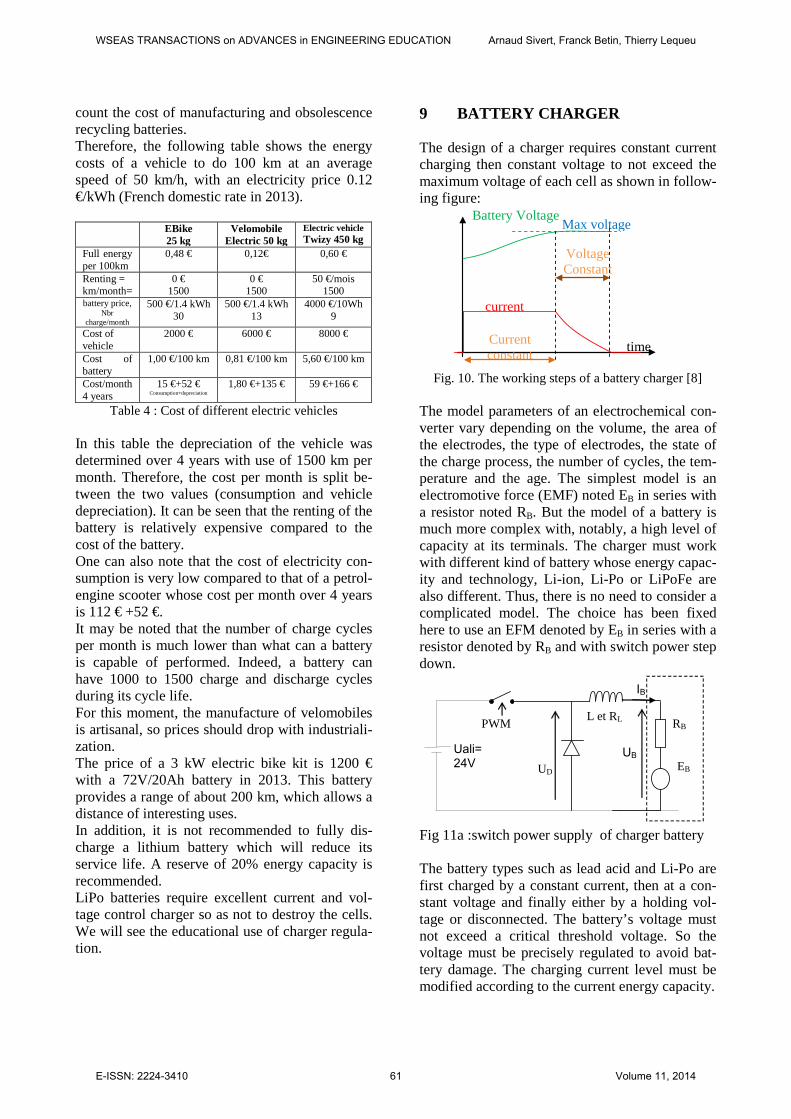
The resulting power of 3000 W for a 140 kg mass provides an acceleration of 4 m/s2, identical to a car, which allows this velomobile to blend into city traffic. To model the vehicle performance, it is possible to use the simple first order Broida identification, even though the differential equation of the ve-hicle is non-linear. In the figure 8, we can observe the use of a con-stant power control avoids peak current from the battery during transients. This control is made by managing the current on the battery and not on the current of motor. To control the motor of an electric motor cycle without assistance, there are several strategies, such as: - Limiting the motor current (motor control with a constant force during acceleration); - Limiting of the current from the battery (motor control with constant power during acceleration); - Speed control and battery current limiting with electrical braking. The third strategy can easily incorporate an as-sisted sensor placed on the pedal as specified be-low: - If pedaling between 0 to 0.1 rev/s, the motor is coasting regardless of the action of the throttle. So the reference speed for the controller is 0 km/h. - If there is low rate pedaling between 0.1 to 0.15 rev/s, even if the hand throttle is 100%, the speed reference will be only 13 km/h, allowing accelera-tion, but not allowing you to go quickly. - If there is pedaling greater than 0.15 rev/s, the speed reference will be a certain percentage of the hand throttle. - Electric braking will be invoked only with the throttle handle to 0% above the speed of 13 km/h. below this speed, the motor is freewheeling. We can see in the figure below, the implementa-tion of the third strategy with a safety sensor on the pedal. The battery current is limited to 30 A. The 48V battery allows us to reach a speed of 43 km/h. We can observe the speed control manage-ment during acceleration and braking. Energy recovery is dangerous if the Li-Po batte-ries are 100% charged. Therefore, the level of charge of the battery must be known in order to allow electric braking. It is the role of the elec-
tronic circuit called BMS that will prevent charg-ing in this case.
Fig 9. Third Strategy: Speed control with battery current limiting of 30A with a 48V battery [7,10]
Now that we have seen the feasible performance of the vehicle and the different strategies for the control of the motor, we will look at its consump-tion and autonomy.
8 AUTONOMY, CONSUMPTION AND COST OF ELECTRIC VEHICLE On the flat road, without pedaling, the velomobile consumption is 285 Wh per 100 km at an average speed of 35 km/h. This consumption corresponds to 3157 km for the equivalent of one liter of pe-trol. But use in our gently undulating region with pe-daling, consumption goes up to 540 Wh for 100 km. There is almost a factor of 2 between favora-ble conditions (flat road, no wind, low accelera-tion) and daily use. This factor is also found for an average speed of 50 km/h.
cycle Variety road
Flat road Variety road
Flat road
Speed average 35 km/h 35 km/h 50km/h 50 bent rider (Wh/100 km, autonomy)
800 180 km
570 245 km
1700 84km
1200 110
Velomobile (Wh/100 km, autonomy)
540 266 km
285 500 km
900 155km
560 250
Table 3 : consumption vs average speed and variety road with of slope.
The difference in autonomy is due to the consum-er requested by acceleration but especially due to the slopes of the road. This consumption is never-theless very low compared to an electric scooter with 45kWh/100km at 50 km/h. Our costs of transport are not only linked to the consumption of energy. We must take into ac-
freewheel
Speedmax 43 km/h Imax=32A
Imin=-15A
Intensity brake throttle handle 100%
5s Time(s)
13 km/h
WSEAS TRANSACTIONS on ADVANCES in ENGINEERING EDUCATION Arnaud Sivert, Franck Betin, Thierry Lequeu
E-ISSN: 2224-3410 60 Volume 11, 2014
count the cost of manufacturing and obsolescence recycling batteries. Therefore, the following table shows the energy costs of a vehicle to do 100 km at an average speed of 50 km/h, with an electricity price 0.12 €/kWh (French domestic rate in 2013).
EBike 25 kg
Velomobile Electric 50 kg
Electric vehicle Twizy 450 kg
Full energy per 100km
0,48 € 0,12€ 0,60 €
Renting = km/month=
0 € 1500
0 € 1500
50 €/mois 1500
battery price, Nbr
charge/month
500 €/1.4 kWh 30
500 €/1.4 kWh 13
4000 €/10Wh 9
Cost of vehicle
2000 € 6000 € 8000 €
Cost of battery
1,00 €/100 km 0,81 €/100 km 5,60 €/100 km
Cost/month 4 years
15 €+52 € Consumption+depreciation
1,80 €+135 € 59 €+166 €
Table 4 : Cost of different electric vehicles In this table the depreciation of the vehicle was determined over 4 years with use of 1500 km per month. Therefore, the cost per month is split be-tween the two values (consumption and vehicle depreciation). It can be seen that the renting of the battery is relatively expensive compared to the cost of the battery. One can also note that the cost of electricity con-sumption is very low compared to that of a petrol-engine scooter whose cost per month over 4 years is 112 € +52 €. It may be noted that the number of charge cycles per month is much lower than what can a battery is capable of performed. Indeed, a battery can have 1000 to 1500 charge and discharge cycles during its cycle life. For this moment, the manufacture of velomobiles is artisanal, so prices should drop with industriali-zation. The price of a 3 kW electric bike kit is 1200 € with a 72V/20Ah battery in 2013. This battery provides a range of about 200 km, which allows a distance of interesting uses. In addition, it is not recommended to fully dis-charge a lithium battery which will reduce its service life. A reserve of 20% energy capacity is recommended. LiPo batteries require excellent current and vol-tage control charger so as not to destroy the cells. We will see the educational use of charger regula-tion.
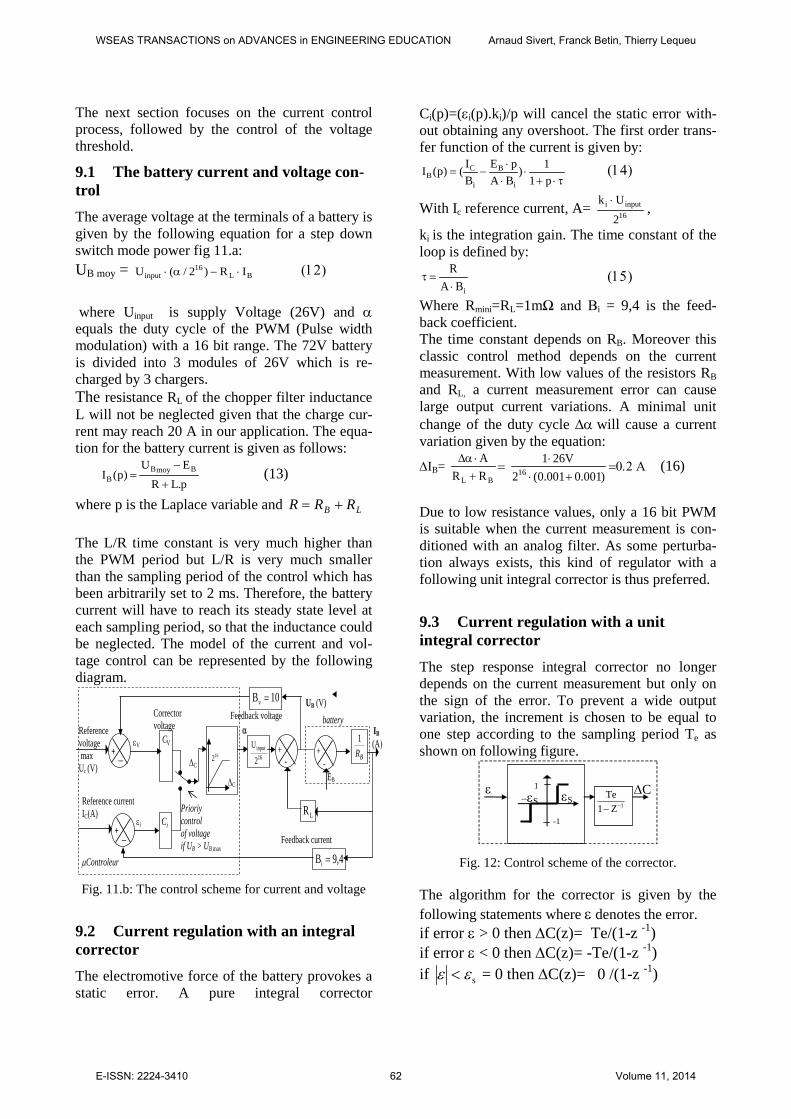
9 BATTERY CHARGER The design of a charger requires constant current charging then constant voltage to not exceed the maximum voltage of each cell as shown in follow-ing figure:
Battery Voltage
current
Current constant
Voltage Constant
Max voltage
time
Fig. 10. The working steps of a battery charger [8]
The model parameters of an electrochemical con-verter vary depending on the volume, the area of the electrodes, the type of electrodes, the state of the charge process, the number of cycles, the tem-perature and the age. The simplest model is an electromotive force (EMF) noted EB in series with a resistor noted RB. But the model of a battery is much more complex with, notably, a high level of capacity at its terminals. The charger must work with different kind of battery whose energy capac-ity and technology, Li-ion, Li-Po or LiPoFe are also different. Thus, there is no need to consider a complicated model. The choice has been fixed here to use an EFM denoted by EB in series with a resistor denoted by RB and with switch power step down.
UB
IB
Uali= 24V EB
RB
UD
PWM L et RL
Fig 11a :switch power supply of charger battery The battery types such as lead acid and Li-Po are first charged by a constant current, then at a con-stant voltage and finally either by a holding vol-tage or disconnected. The battery’s voltage must not exceed a critical threshold voltage. So the voltage must be precisely regulated to avoid bat-tery damage. The charging current level must be modified according to the current energy capacity.
WSEAS TRANSACTIONS on ADVANCES in ENGINEERING EDUCATION Arnaud Sivert, Franck Betin, Thierry Lequeu
E-ISSN: 2224-3410 61 Volume 11, 2014
The next section focuses on the current control process, followed by the control of the voltage threshold.
9.1 The battery current and voltage con-trol
The average voltage at the terminals of a battery is given by the following equation for a step down switch mode power fig 11.a: UB moy = BL
16input IR)2/(U ⋅−α⋅ (12)
where Uinput is supply Voltage (26V) and α equals the duty cycle of the PWM (Pulse width modulation) with a 16 bit range. The 72V battery is divided into 3 modules of 26V which is re-charged by 3 chargers. The resistance RL of the chopper filter inductance L will not be neglected given that the charge cur-rent may reach 20 A in our application. The equa-tion for the battery current is given as follows:
p.LR
EU)p(I BmoyB
B +
−= (13)
where p is the Laplace variable and LB RRR += The L/R time constant is very much higher than the PWM period but L/R is very much smaller than the sampling period of the control which has been arbitrarily set to 2 ms. Therefore, the battery current will have to reach its steady state level at each sampling period, so that the inductance could be neglected. The model of the current and vol-tage control can be represented by the following diagram.
VC 16
input
2
U
10Bv =
4,9Bi =
iC
BR1
LR
εV
Reference voltage max Uc (V)
Corrector voltage
+
−
α
UB (V) Feedback voltage
µControleur
IB (A)
εi
Reference current IC(A)
+
−
Prioriy control of voltage if UB > UB max
EB -
battery
- + +
∆C
Feedback current
∆C
216
Fig. 11.b: The control scheme for current and voltage
9.2 Current regulation with an integral corrector
The electromotive force of the battery provokes a static error. A pure integral corrector
Ci(p)=(εi(p).ki)/p will cancel the static error with-out obtaining any overshoot. The first order trans-fer function of the current is given by:
τ⋅+⋅
⋅⋅
−=p11)
BApE
BI()p(I
i
B
i
CB (14)
With Ic reference current, A= 16inputi
2
Uk ⋅ ,
ki is the integration gain. The time constant of the loop is defined by:
iBAR⋅
=τ (15)
Where Rmini=RL=1mΩ and Bi = 9,4 is the feed-back coefficient. The time constant depends on RB. Moreover this classic control method depends on the current measurement. With low values of the resistors RB and RL, a current measurement error can cause large output current variations. A minimal unit change of the duty cycle ∆α will cause a current variation given by the equation:
∆IB=BL RR
A +⋅α∆
=)001.0001.0(2
26V1 16 +⋅⋅
=0.2 Α (16)
Due to low resistance values, only a 16 bit PWM is suitable when the current measurement is con-ditioned with an analog filter. As some perturba-tion always exists, this kind of regulator with a following unit integral corrector is thus preferred.
9.3 Current regulation with a unit integral corrector
The step response integral corrector no longer depends on the current measurement but only on the sign of the error. To prevent a wide output variation, the increment is chosen to be equal to one step according to the sampling period Te as shown on following figure.
1Z1Te
−−
ε
∆C 1
-1
−εS
εS
Fig. 12: Control scheme of the corrector.
The algorithm for the corrector is given by the following statements where ε denotes the error. if error ε > 0 then ∆C(z)= Te/(1-z -1)
if error ε < 0 then ∆C(z)= -Te/(1-z -1) if sεε < = 0 then ∆C(z)= 0 /(1-z -1)
WSEAS TRANSACTIONS on ADVANCES in ENGINEERING EDUCATION Arnaud Sivert, Franck Betin, Thierry Lequeu
E-ISSN: 2224-3410 62 Volume 11, 2014

This corrector provides less dependence of the output measurements on any variations of EB and RB. Nevertheless, the output dynamics are very slow and satisfy the following equations:
BBB R/)E-ATe(n(n.Te)I ⋅⋅= (17) With a sampling period of 2ms, EB=23V, RB=1mΩ, it is necessary to wait 1.9s to reach the reference 20A, but this time is negligible com-pared to the charging time. Therefore, there is no need to ramp in the current demand.
The charger installation has been done on a PIC 16F6520 microcontroller where an LCD display displays the main information from the charger. The current is measured from the oscilloscope by using a Hall Effect sensor and a difference am-plifier. The microcontroller monitors the voltage of each cell and transfers all data to a PC, as can be seen in the following figure.
Fig. 13: Charging of 8 LiPoFe cells 40Ah to 25A (vol-tage, current, energy versus time) [13]
It can be seen in the previous figure, that when one of the cells has reached 3.7V, the current de-creases. But all cell voltages have not reached their threshold voltages. So the charger will bal-ance the cells with a current of 0.5A, routing the current through a 2 Watt resistor. The charger reacts like a BMS.
10 APPLICATION TO EDUCATION
This educational system requires us to examine all the possible motor technologies, with different solutions for drives and for batteries. We need to see the issues of on-board power management
(Battery Management Security) and to make tech-nical choices. Indeed, the electric vehicle is an excellent teach-ing aid to developing the electric converter and programming the microcontroller that controls the brushless motor. There is also all the electronics of the onboard instrumentation: speed and dis-tance measurement, measurement of current and voltage in order to determine the energy capacity, % of regeneration.... The current required by the motor creates elec-tromagnetic disturbances, so the study of this as-pect must be considered. Therefore, the currents must be filtered both digitally and analogically. In addition, the design of the display of low ve-hicle power consumption allows the use of power LEDs for illumination. Hence the design of a chopper circuit to convert the 72V battery voltage to the current control for lighting. This electric vehicle has to be charged daily and fairly quickly, so you have to design rapid 72V/20A chargers, which are not yet available commercially with a power factor near 1. Thus all of the topologies of electric converters can be implemented for this application. All problems regarding output control (paramete-rization, performance, instability) can be observed on the drive motor and the battery charger. In addition, you must know how to program these digital controllers. The working student working enters the course of the works construction of the technology institute. From project specification, students must con-struct the system. The teacher carries out the tech-nological choice and orders the equipment for a successful project in the year of cursus. The number of time about 150 hours throughout the year, is followed by a single-teacher in our small organization of 50 students in first and second year. But often students are passionate and come during their free time and some weekends to finish their tests and promote the project in different types of events. Students are divided into pairs with different ob-jectives (2 students website communication and signaling (LED lighting prototype), 2 for the pro-duction of chargers, 2 for instrumentation and measure vehicle dynamics et consumption, 2 to achieve inverters, two for mounting and battery test, 2 to an electrical circuit section and the wir-ing).
Current 25A
Battery Voltage
Energy capacity en A.H
Voltage 8 cells
Current 25A
Voltage batterie
Capacity energy en A.H
Voltage 8 cells
WSEAS TRANSACTIONS on ADVANCES in ENGINEERING EDUCATION Arnaud Sivert, Franck Betin, Thierry Lequeu
E-ISSN: 2224-3410 63 Volume 11, 2014

But often there is a mutual aid between pairs with an organization star, so a methodology a little bit “rock and roll”. Indeed, the organization is based on the progress of each student with the teacher who is the man-ager and conductor of the project. Student assessment is carried out with a table that considers each student on the following criteria (self-organization, dynamism, initiative, involve-ment, teamwork, research resources, methodolo-gy, and final results). Then, students are graded on a folder of 25 pages, a large poster and an oral presentation of 15 minutes and 15 minutes for questions. In other universities that have a number of 150 students, there are several teachers who supervise students in turn throughout the year and bring their expertise. The problem of students is often a prerequisite. So there is 15 hours of study at the beginning of the year for the whole class 50 students on how to make choices to achieve homogeneous electric bike. During the competitions, students are very mature and take a lot of initiatives in order to do their best. The students were very proud of themselves en-joying their work "this is me and my colleagues friends who make this prototype" but also explain-ing to competitors, their prototype. Students have an excellent state team, with respect for competitors. On the return trip, the students do positive and negative results of the prototype and think about the future prospects. For a new team and new teachers, the harder is to start from scratch to make a prototype. This is why a technical book was made to help people wanting to make all electric vehicles [1]. Participating in challenges is always a great ad-venture that requires us to surpass ourselves. Work on electric vehicle low consumption allows it to be useful to society in our world or energy transition of petrol will be inevitable. In addition of the technology, it is possible to add solar panels to have more autonomy. But a panel of 1.5 m2 can only provide 300 W in full sunlight and weighs 6 kg for Semiflexs [3]. For the mo-ment, the price of photovoltaic panels doesn’t allow them to be considered. And yet, there are different challenges in Europe such as the "Sun Trip", the "Solar Event", the "World Solar Challenge" in Australia or the eco-
marathon challenge [16] that exploit this possibili-ty. Similarly, a hydrogen fuel cell battery may re-place the battery. To minimize the peak current during acceleration, super capacitors can be used. The list of technical and educational possibilities is very large. Throughout the design of an electric vehicle, there are as many studies in mechanics as there are in electrics and therefore collaboration can be made between these two fields. The design of an electric vehicle motivates our students and gets them to use their minds. To help others who have the same project on the implementation of electric vehicles, the students completed a web site and communicated on forum and blog [12,13,14,15]. In addition, there are nu-merous articles in the local press, all serving to promote the university. The cost for the construction of a prototype is relatively large (7000€ for our case), but some of these finances are returned through publicity in the daily press to the university. Upon completion, it is possible to develop other types of vehicles, such as gokarts or a more stan-dard car [13].
11 CONCLUSION
The design and construction of an electric vehicle is a very good teaching project for our students of bachelor to Electrical Engineering and Mechani-cal Engineering. The constant power control method protects the battery. This control method has long been used for electric traction railways. The benefits of con-stant power control are obviously applicable to all electric vehicles; however, many manufacturers only offer variable speed constant torque drives. We also proved that it was possible to make moto-rized cycles with respectable speeds and autono-my. Some of our students enjoy extreme vehicles with a high acceleration. In this article, we have also demonstrated that the consumption of elec-trical energy depends greatly on the vehicle mass and Cx. If the price of electricity is low, one must take into account the cost of production and the life of the batteries in order to determine the over-all running cost of our vehicles. The electric velomobile will definitely be one of our alternative transport means in future of energy transitions.
WSEAS TRANSACTIONS on ADVANCES in ENGINEERING EDUCATION Arnaud Sivert, Franck Betin, Thierry Lequeu
E-ISSN: 2224-3410 64 Volume 11, 2014

The students are very motivated by this subject because they feel useful in responding to a de-mand of our society to minimize our impact on the planet. In addition, participation in the adven-ture of a challenge can motivate students and teachers on the completion of the project. References:
[1] A. Sivert, T. Lequeu “ I build my electric vehicle ”, Publishing
book french Dunod, 2013, 144 pages. [2] PANG-CHIA CHEN, CHIH-CHING HSIAO, SUN-LI WU,
SHYUE-BIN CHANG “The Torque Control with Multi-Objective Performance for E-Bike Systems with Human Power Assistance” WSEAS TRANSACTIONS on SYSTEMS and CONTROL, volume 6 october, 2011 pp361 to 370.
[3] M. S. Carmeli, F. Castelli Dezza, G.Galmarini, M. Mauri and L. Piehari, “A vehicle with very low fuel consumption; realization, analysis and optimization”, in XIX International Conference on Electrical Machines, Rome, Italy, 2010.
[4] José Fernández Ramos1, Juan Jesús Fernández Lozano 2, Alfonso Gago Calderón “Design of Electric Racing Vehicles: An experience of interdisciplinary project-based education in engineering” EVS 27, octobre 2013
[5] A. Sivert “Le vélo électrique » Revue des départements Génie électrique & informatique GESI N°80, décembre 2012, pp 26-33.
[6] A. Sivert, F. Betin, S. Carriere “Difference force and constant power control applied to electrical bike”, EVER ecologic ve-hicles & renewable energies de MONACO, mai 2012.
[7] A. Sivert, F. Betin, J. Becar “An Electrical Bike For Project Based Learning Platform”, EVER ecologic vehicles & renew-able energies de MONACO, avril 2011.
[8] A.Sivert, F.Betin, J.Becar “A Fuzzy Logic Application for charger of batteries : go-kart”, Conference EVER ecologic ve-hicles & renewable energies de MONACO, Avril 2011.
[9] S. Viollin « le vélo à assistance électrique » les cahiers de l’instrumentation N°9, Chauvin Arnoux, octobre 2010
[10] A. Sivert, “electric bike”, iut en ligne : http://public.iutenligne.net/etudes-et-realisations/sivert/veloelec/ 2011 (03.2014)
[11] Forum bentrider : (03.2014) http://velorizontal.bbfr.net/t15952-kit-3000w 2013.
[12] Etude de la consommation énergétique d’un vélo-mobile :
http://velorizontal.bbfr.net/t17956-leiba-x-stream-electric-iut-aisne 2013 (03.2014)
[13] Web site : Construction of Electric Vehicle: http://aisne02geii.e-kart.fr/. (03.2014)
[14] http://en.wikipedia.org/wiki/Velomobile (03.2014) [15] Site web : eco-marathon competition. http://www.educeco.net/ [16] http://fr.wikipedia.org/wiki/eco-marathon (03.2014) [17] E. Hoang, G. Feld, B. Revol, D. Penard, « Eléments d'étude d'un système de stockage de l'énergie électrique : le supercondensateur, La revue 3E.I, N°49, juin 2007, pp. 15-21 Biography
Arnaud.sivert was born in France. He obtained a Ph.D. degree from the University of Picardie Jules Verne, Sois-sons, France, in 2000. In 1994, he joined an Institute University of Technology in the Department of Electrical Engineering, as an Assistant Professor. His major research interests are the advanced control techniques for elec-trical machines and drives, especially using fuzzy logic algorithms and variable structure control.
Another interest is in producing many electric vehicle prototypes since 2008 and participating in the international challenge of electric go karts (www.e-kart.fr/2014/). In addition, since 2011, he partici-pated in the Challenge of French National Electric Bike and Chal-lenge Eco- marathon.
WSEAS TRANSACTIONS on ADVANCES in ENGINEERING EDUCATION Arnaud Sivert, Franck Betin, Thierry Lequeu
E-ISSN: 2224-3410 65 Volume 11, 2014