Pectoralis Major Myocutaneous Flap in Head and Neck Reconstruction

Pectoralis Muscle of Turkey Displays Divergent Function as Correlated with Meat Quality
Bly Addison Patterson
Thesis submitted to the faculty of the Virginia Polytechnic Institute and State University in
partial fulfillment of the requirements of degree of
Master of Science
In
Animal and Poultry Sciences
David E. Gerrard, Committee Chair
Robert P. Rhoads
Scott J. Eilert
April 30, 2015
Blacksburg, VA
Keywords: turkey quality, postmortem glycolysis, meat color
Copyright 2015 (Bly Patterson)

Pectoralis muscle of turkey displays divergent function as correlated with meat quality
Bly Addison Patterson
ABSTRACT
Fresh turkey meat color is influenced by a myriad of biological factors which include
muscle fiber type composition and heme protein concentrations. These factors either contribute
to or are subject to the biochemical events involved in the conversion of muscle to meat. Subtle
deviations in the processing environment can also result in aberrant fresh meat quality
development and may ultimately alter the quality characteristics of cooked product. Our
objective was to describe the underlying cause and significance of two-toning in fresh turkey
breast. In the first experiment, pectoralis muscles were collected and subjected to image
processing software to describe color of fresh turkey. In the second experiment, shackling time
was tested as an aggravator of fresh turkey color. Results showed turkey breast possess two-
lobes that differ in pH, drip loss, energy metabolism and muscle fiber type composition. Results
also showed fresh turkey color was enhanced during the time from stun to exsanguination (P <
0.05). These results suggest inherent differences in breast muscle are responsible for variations
in fresh turkey color.

iii
Dedication
This thesis is dedicated to all of the farmers, agriculture teachers, and community leaders at
home that supported me as a 4-H and FFA member and have helped shape me into the
agriculturalist that I am.

iv
Acknowledgements
This experience has been one for the books. I would not have survived any of it without the
support of mentors, family, and friends.
Many thanks to
Jesus Christ, my savior: when I felt as though nothing was going my way, I poured over your
scriptures and prayed. It is there that I found peace and understanding that through hard work
and faith, I would accomplish this task. I only hope that I can continue to honor you with the
skills and gifts you have given me. Perhaps I might touch a few lives along the way.
Dr. Dave Gerrard, my advisor: for challenging me to reach my greatest potential. You taught
me to think outside the box and look at problems from a multitude of angles. It is because of you
I can now think. I truly appreciate “the push” and am a better scientist because of it.
Dr. Scott Eilert: for your insight on meat quality problems in commercial processing and how to
address them in academic research. I am grateful to have had the opportunity to work with
Cargill on this project and cannot thank you enough for introducing me to the wonderful people
on the Dayton team.
Dr. Robert Rhoads: for bringing a different perspective to my project and providing me with
direction when it was needed.
Eric Stewart and the statisticians: for writing the Matlab software scripts and algorithms for
meat image analysis.
Eric England: for answering countless questions and teaching me the wonders of protein gel
electrophoresis and western blot.
Sulaiman Matarneh: for helping me with all things statistics.
To all of my labmates: Eric England, Sulaiman Matarneh, Kristen Stufft, Richard Preisser,
Amanda Fabi, and Jordan Wicks. Many thanks for the great laughs and conversation. From our
social nights to pipetting and crunching numbers, I will cherish the memories for a lifetime.
My undergraduate volunteer, Mallory White: Without you, I probably would not be finished
with this degree. Thank you for the late night company in the lab running assays and grinding
hundreds of tissue samples.

v
Derick Shank, my fiancé: There are not enough words to describe how much I appreciate you
being there for me through my undergraduate and graduate education. From sharing in my daily
joys to my most defining and devastating moments, you have seen it all. I cannot wait to marry
you in a few short months. I love you.
My family: for all of the love and support during this experience. Mom and Dad: thank you for
always being there when I needed someone to talk to and reminding me that I can do anything I
set my mind to.
The Dayton team: Keith Carter, Randy Batson, Malfred Shaw, and Christian Rodriguez. For
being so accommodating when I needed to collect samples and data. I could not have asked for
better help. Thank you.

vi
Table of Contents
Abstract…………………………………………………………………………………………..ii
Dedication…………………………………………………………………………………..……iii
Acknowledgements……………………………………………………………………………...iv
Table of Contents………………………………………………………………………………..vi
List of Figures...………………………………………………………………………………..viii
List of Tables…………………………………………………………………………………….ix
Chapter 1. Introduction and Literature Review-Meat Quality Development……………….1
Introduction……………………………………………………………………………….1
Meat Quality………………………………………………………………………………1
Meat Color………………………………………………………………………………...2
Heme Pigments…………………………………………………………………….…2
Myoglobin…………………………………………………………………………2
Hemoglobin………………………………………………………………….…….6
Cytochrome c…………………………………………………………………...…7
Muscle Fiber Type……………………………………………………………………7
Conversion of Muscle to Meat…………………………………………………………...10
Aberrations Affecting Postmortem Metabolism and Meat Quality……………………...11
Stun and Blood Removal………………………………………………………...13
Summary……………………………………………………………………………….... 15
References………………………………………………………………………………..16
Chapter 2. Pectoralis muscle of turkey displays divergent function as correlated with meat
quality…………………………………………………………………………………………..19
Abstract…………………………………………………………………………………..19
Introduction………………………………………………………………………………19
Materials and Methods…………………………………………………………………...21
Results and Discussion…………………………………………………………………..27
Conclusions………………………………………………………………………………35
References………………………………………………………………………………..54
Chapter 3. Future directions…………………………………………………………………...56
Appendix A……………………………………………………………………………………...59

vii
List of Figures
Chapter 1
Figure 1. Structure of the heme group of myoglobin…………………………………...………....3
Figure 2. Myoglobin redox forms of raw meat…………………………………………...……….4
Chapter 2
Figure 1. Sampling location of the large and small lobe of the pectoralis major muscle in adult
tom turkeys for experiment one and two………………………………………………………...36
Figure 2. Lightness (L*) color values and standard deviation as an expression of variability of the
large and small lobes and single-toned and two-toned populations of pectoralis major muscle in
adult tom turkeys…………………………………………………………………………………37
Figure 3. Redness (a*) color values and standard deviation as an expression of variability for the
large and small lobes and single-toned and two-toned populations of pectoralis major muscle of
adult tom turkeys………………………………………………………………………………....38
Figure 4. Relative myoglobin mRNA abundance of the small and large lobes of the pectoralis
major muscle in adult tom turkeys……………………………………………………………….39
Figure 5. Hemoglobin content of small and large lobes of the pectoralis major muscle in adult
tom turkeys…………………………………………………………………………………….…40
Figure 6. Ultimate pH of the small and large lobes of the pectoralis major muscle in adult tom
turkeys………………………………………………………………………………….…….......41
Figure 7. Lactate dehydrogenase content of the large and small lobes of the pectoralis major
muscle in adult tom turkeys………………………………………………………………….......43
Figure 8. Driploss of the small and large lobes of the pectoralis major muscle in adult tom
turkeys……………………………………………………………………………………............44
Figure 9. Soluble and total protein concentration of the large and small lobe of the pectoralis
major muscle in adult tom turkeys……………………………………………………….………45

viii
Figure 10. Sarcomere length of the large and small lobes of the pectoralis major muscle in adult
tom turkeys……………………………………………………………….………………………46
Figure 11. Large and small lobes of the pectoralis major muscle of adult tom turkeys shackled
first and lass from a transport truck exhibit color changes and increased variation with time…..47
Figure 12. Redness (a*) color values and variability for the large and small lobes and of the
pectoralis major muscle of adult tom turkeys shackled first and last from a transport truck…....48
Figure 13. Hemoglobin content of the small lobe of the pectoralis major muscle in adult tom
turkeys sampled first and last from a transport truck…………………………………….………49
Figure 14. Ultimate pH of large and small lobes of the pectoralis major muscle and first and last
shackled adult tom turkeys from a transport truck …………………………...……………….....51
Figure 15. Metabolite concentrations and glycolytic potential of the large and small lobe of the
pectoralis major muscle and first and last shackled adult tom turkeys from a transport truck.....52
Figure 16. Effect of stun to stick time on body temperature of adult tom turkeys………………53
Chapter 3
Figure 1. Sampling method for second study to test the effect of bird location during transport on
meat quality……………………………………………………...……………………………….57
Appendix A
Figure 1. Software script converting red, green, blue (RGB) color values to CIELAB color
space……………………………………………………………………………………………...59
Figure 2. Software script producing statistical parameters for the raw color distribution……….60
Figure 3. Software script truncating the original color distributions to eliminate values
representing background, outliers, and light scattering………………………………………….61

ix
List of Tables
Chapter 1
Table 1. Estimated Percentages of Type I, Type IIA, and Type IIB fibers in the proximal and
distal portions of five turkey muscles…………………………………………………………..…9
Chapter 2
Table 1. Metabolite concentrations and glycolytic potential of the large and small lobe of the
pectoralis major muscle of adult tom turkeys……………………………………...……………42
Table 2. Frequency of single-toned and two-toned pectoralis major muscles in tom turkeys
sampled first and last from a transport truck………………………………………………..... ...50

1
Chapter 1. Introduction and Literature Review-Meat Quality Development
Introduction
Over the past twenty years, consumer preferences and perception of meat has changed.
The meat industry has witnessed a shift toward more healthy, cost effective, and convenient
options due to consumer demand. In a U.S. survey, 55% of respondents classified convenience as
a ‘very important’ determinant of food purchases (Senauer, 2001). With an industry desire to
provide consumers with a variety of convenient eating options, consumption of further processed
products has increased (Grunert, 2006). As a result, poultry has become the second most popular
meat consumed in the world at 13.6 kg/capita/year after pork at 15.8 kg/capita/year (FAOSTAT,
2014).
Due to an increase in demand for poultry as a protein source, it is estimated that turkey
production had increased by 104 percent since 1970 (National Turkey Federation, 2014). This
rise in poultry consumption has placed more emphasis on quality traits like appearance and
texture (Fletcher, 2002). To remain a top meat choice of American consumers, product quality
and consistency must be maximized.
Meat Quality
The parameters that define meat quality are influenced by consumer preferences and meat
purchasing decisions. Quality traits considered important for a fresh, wholesome food product
are color, texture, and water-holding capacity. Of these factors, meat color is the most influential
to meat purchasing decisions (Mancini, 2005). Heme pigment concentration and muscle fiber
type composition are primarily responsible for the color that consumers perceive.

2
Meat Color
Heme Pigments
Meat color development is largely controlled by three heme proteins: myoglobin,
hemoglobin, and cytochrome c. In the living muscle, myoglobin and hemoglobin coordinate to
store and deliver oxygen to the tissue, which is necessary for aerobic energy metabolism. This
activity, in partnership with cytochrome c in the electron transport chain, provides the muscle
with ATP. Postmortem, these proteins are better known for their role in color development of
beef, lamb, pork, and poultry. When an animal is harvested, most of the hemoglobin leaves the
body in blood. Clydesdale and Francis (1972) reported that iron associated with myoglobin only
10% of the total iron of an animal prior to slaughter. After exanguination, this source of iron
(myoglobin) accounts for 95% of the total iron. As a result, myoglobin concentration, redox
state, and thermal stability play a vital role in the meat color perception.
Myoglobin
Myoglobin is a monomeric protein containing a single heme prosthetic group. This group
is surrounded by a globin moiety that protects it from undesirable reactions. The heme portion
contains an iron atom at the center of its porphyrin ring (Fig. 1). Four of the coordination sites of
the iron atom are bonded to the ring, while the fifth and sixth sites are available for binding to
ligands. The ligand bound to the sixth coordination site is the primary determinant of its redox
state.

3
Figure 1. Structure of the heme group of myoglobin (Seideman, Cross, Smith, & Durland,
1984)
In fresh meat, myoglobin exists in three primary forms. The first state, deoxymyoglobin
is characterized by the absence of a bound ligand to the heme iron of the porphyrin ring (Mancini
& Hunt, 2005). As a result, the iron is in the ferrous (Fe2+
) state. This redox form is associated
with the purplish-red color of meat. When myoglobin is exposed to oxygen, the diatomic atom
binds to the ferrous iron, causing a change in meat color. The resulting oxygenation is evident by
a bright cherry-red color which it is most desired by consumers. The high rate at which this
reaction occurs is triggered by the high affinity of oxygen for myoglobin (Pirko & Ayres, 1957)
and generally takes less than thirty minutes in a process known as bloom (Johnson, 1974).

4
Heme Heme
Fe2+
Fe2+
H20 02
Heme
Fe3+
H20
Figure 2. Myoglobin redox forms of raw meat. Myoglobin in the ferrous state (Fe2+
) can be
oxygenated to create oxymyoglobin or oxidized to form metmyoglobin. Metmyoglobin can be
reduced to its ferrous (Fe2+
) in the presence of oxygen to form oxymyoglobin. (Adapted from
Pegg et al., 1997)
In contrast, discoloration of meat can result from the oxidation of the ferrous (Fe2+
) iron
to ferric (Fe3+
) iron due to loss of valence electrons (Bekhit et al., 2003). As a result,
oxymyoglobin is converted to metmyoglobin, which appears brown. When the globin moiety
surrounding the heme ring is denatured, it can no longer sufficiently protect it (Bekhit et al.,
2003). Consequently, the heme group is quickly oxidized. Brooks (1937) stated that this “loss of
bloom” is noticeable when 60% of the myoglobin pigments are in the metmyoglobin form.
Therefore, the color distinguished by the naked eye is dictated by a predominating pigment
rather than a single pigment (Fig. 1-2).
Deoxygenation
Oxygenation
Oxidation
Reduction
Myoglobin
Purplish Red
Oxymyoglobin
Bright Red
Metmyoglobin
Brown

5
The primary structure of myoglobin is responsible for its redox and thermostability.
While myoglobin function is conserved across species, the structure of the protein is not. In fact,
livestock and poultry species are <75% homologous (Suman & Joseph, 2013). Recently, the
primary structure of turkey myoglobin was sequenced and found to have 100% homology with
chicken (Poulson Joseph et al., 2011). Poultry myoglobin differs from livestock due to a
modification in the number of histidine residues in its sequence. Joseph et al. (2011) reported
that turkey and chicken myoglobin contained 9 histidines as compared with 9 in pork, 13 in beef,
as well as 12 in sheep and goats. Additionally, poultry myoglobin is 300-400 Daltons greater
than other livestock species (Suman & Joseph, 2013). Specifically, turkey myoglobin has a
molecular mass 346 Da greater than beef myoglobin (P Joseph, Suman, Li, Beach, & Claus,
2010). Subsequently, these amino acid differences in red meat myoglobin and turkey myoglobin
primary structure are linked to differences in thermostability. For example, turkey myoglobin has
a greater resistance to heat-induced denaturation (P Joseph et al., 2010). A study conducted by
Ueki et al. (2004) determined that a one or two amino acid substitution in the primary structure
of myoglobin is sufficient for altering its stability. The substituted amino acids residues affect
tertiary myoglobin structure and, in essence, thermal stability and meat color formation (Suman
& Joseph, 2013).
Meat color development is considerably variable due to concentration differences in
myoglobin between muscles. Kranen et al. (1999) determined that myoglobin concentration
remains undetectable in the pectoralis muscle of chickens, while only 0.12 mg/g are detectable in
the sartorius, or thigh muscle, via SDS-PAGE and western blot techniques. The pectoralis
myoglobin concentration supports previous findings by Nishida and Nishida (1985) that reported
no detectable level of myoglobin. It was further determined that myoglobin levels were

6
detectable at 0.56 mg/g in the adductor muscle and 1.08 mg/g in the chicken heart (Kranen et al.,
1999). The variation in myoglobin concentration among poultry muscles further demonstrates
its importance in meat color formation and variation.
Hemoglobin
Hemoglobin is a major protein and pigment found in blood. When an animal is harvested,
blood is removed from the circulatory system and with it, most of the hemoglobin. Due to the
very small concentration of the protein remaining in the system, it has very little effect on meat
color. However, if exsanguination protocols are ineffective, as much as 20-30% of the blood
volume may remain in the carcass tissues, with a maximum of 10% in carcass muscles (Fox Jr,
1966). Subsequently, hemoglobin can play a key role in meat color development.
Unlike myoglobin, hemoglobin is a more complex globular protein. It is differentiated
from myoglobin by its tetrameric quaternary structure. The protein is comprised of two α and
two β subunits. The polytpeptide chains forming each subunit consist of α helices and beta
pleated sheets arranged in an alternating fashion. The protein chains of each subunit fold to
create a hydrophobic pocket that protects the heme group. As a result of its complex structure,
its reactivity not only depends on its pocket environment, but its interactions with groups
belonging to other subunits of the protein (Antonini, 1965). Consequently, the ligands that bind
hemoglobin can create conformational changes that may alter its reactivity and affect meat color
development.
7
Cytochrome C
Cytochrome c is a heme pigment found in the mitochondria of skeletal muscle cells.
Unlike myoglobin and hemoglobin, it is very heat stable. Cytochrome c was reported to resist
heat denaturation to temperatures as high as 105◦C (Cornish & Froning, 1974). Consequently,
cytochrome c is most influential of cooked meat color. Since myoglobin and hemoglobin are
decomposed during cooking, native cytochrome c may be more important natural color retention
at high temperatures (Pikul, Niewiarowicz, & Kupijaj, 1986). This is attributed to its pink
appearance in the reduced state. Pikul et al. (1986) measured the cytochrome c content in various
poultry meats, including turkey. Breast meat of turkeys contains cytochrome c at a concentration
of 13.1 ± 0.49 μg g-1
of tissue, while thigh meat has a concentration of 47.4 ± 1.47 μg g-1
of
tissue. In breast meat, cytochrome c represents 2.36% of the total heme pigment concentration as
compared to 2.2% in the thigh (Pikul et al., 1986). With quantifiable concentrations of
cytochrome c in poultry meat, it is likely a contributor to cooked meat color. However, with
higher concentrations of hemoglobin and myoglobin in fresh meat, its impact on meat color is
minimal.
Muscle Fiber Type
Significant animal to animal variation in meat quality exists. This variation is partially
explained by differences in muscle fiber type composition both within muscles and between
animals. As a result of differences in muscle fiber type, postmortem biochemical processes are
affected along with meat quality (Klont, Brocks, & Eikelenboom, 1998). Specifically, meat color
is in part explained by underlying muscle fiber type composition (Henckel, Oksbjerg, Erlandsen,

8
Barton-Gade, & Bejerholm, 1997). This is a result of variation in myoglobin concentration
caused by the fiber types themselves. Due to the role of myoglobin as a heme pigment, the
existing fiber type profile will result in differences in meat color.
In general, four fiber types exist: slow oxidative (Type I), fast twitch oxidative-glycolytic
(Type IIA), fast twitch glycolytic (Type IIB), and fast twitch glycolytic (Type IIX). While the
role of Type IIX fibers have not been extensively determined in turkey muscles, most turkey
muscles are comprised of Type IIA and Type IIB fibers. The gastrocnemius and sartorius are the
most oxidative turkey muscles, with a proportion of 75% Type I fibers (Wiskus et al., 1976). The
number of each fiber type present in a given muscle is largely dependent upon the muscle
function and location. Slow oxidative muscle fibers often appear red and have a high capillary
density. These fibers are red due to a higher concentration of myoglobin. The high capillary
density allows for more oxygenated blood to flow to the tissue and oxygen itself to be transferred
to myoglobin. This oxygen delivery system provides the necessary aerobic environment to aid in
ATP synthesis. Furthermore, these Type I muscle fibers have a low capacity to participate in
anaerobic metabolism and thus are common in muscles used for long term endurance. Due to
low anaerobic capacity, the phosphocreatine pool and glycolytic enzyme activity of these red
fibers is low (Matthews & Fox, 1976). In contrast, fast glycolytic fibers function under anaerobic
conditions that last for a short, intense time period. These fibers utilize glycogen stores rather
than mitochondrial respiration to fuel a fast twitch (Lee, Joo, & Ryu, 2010). Consequently,
glycogen content, glycolytic enzyme activity, and phosphocreatine stores are high (Matthews &
Fox, 1976). Because oxygen is unnecessary for their function, these Type IIB fibers appear white
due to a low capillary density and myoglobin concentration.
9
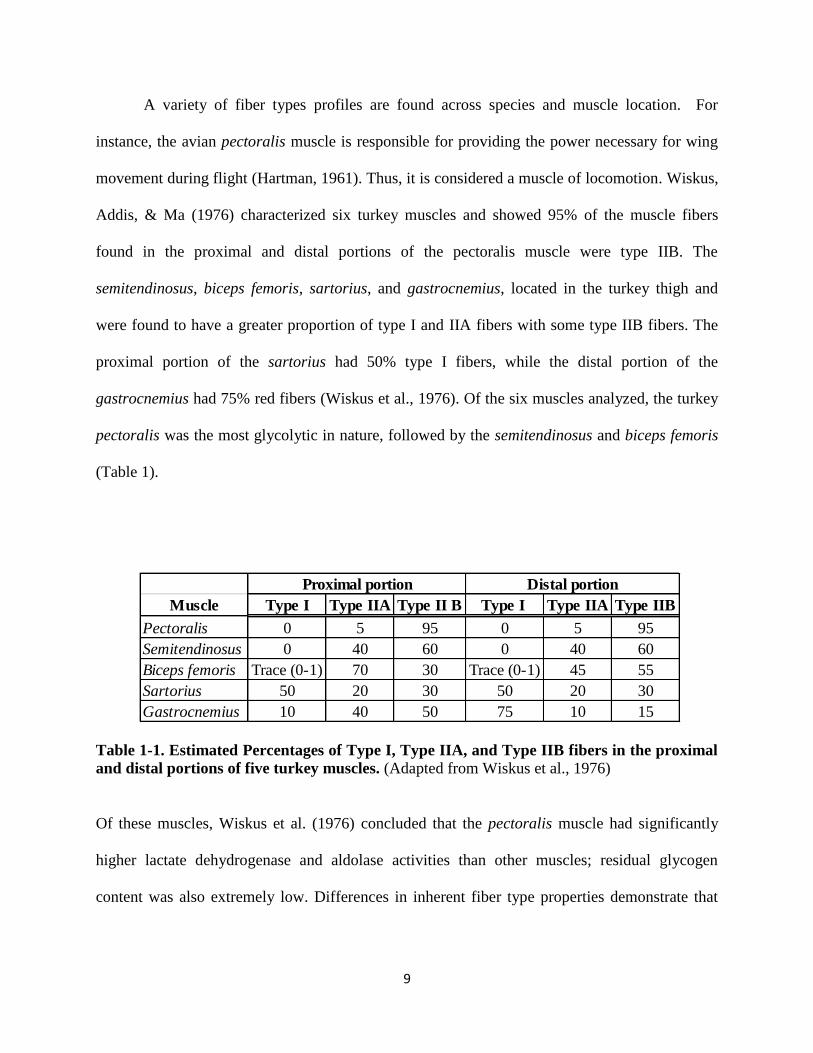
A variety of fiber types profiles are found across species and muscle location. For
instance, the avian pectoralis muscle is responsible for providing the power necessary for wing
movement during flight (Hartman, 1961). Thus, it is considered a muscle of locomotion. Wiskus,
Addis, & Ma (1976) characterized six turkey muscles and showed 95% of the muscle fibers
found in the proximal and distal portions of the pectoralis muscle were type IIB. The
semitendinosus, biceps femoris, sartorius, and gastrocnemius, located in the turkey thigh and
were found to have a greater proportion of type I and IIA fibers with some type IIB fibers. The
proximal portion of the sartorius had 50% type I fibers, while the distal portion of the
gastrocnemius had 75% red fibers (Wiskus et al., 1976). Of the six muscles analyzed, the turkey
pectoralis was the most glycolytic in nature, followed by the semitendinosus and biceps femoris
(Table 1).
Table 1-1. Estimated Percentages of Type I, Type IIA, and Type IIB fibers in the proximal
and distal portions of five turkey muscles. (Adapted from Wiskus et al., 1976)
Of these muscles, Wiskus et al. (1976) concluded that the pectoralis muscle had significantly
higher lactate dehydrogenase and aldolase activities than other muscles; residual glycogen
content was also extremely low. Differences in inherent fiber type properties demonstrate that
Muscle Type I Type IIA Type II B Type I Type IIA Type IIB
Pectoralis 0 5 95 0 5 95
Semitendinosus 0 40 60 0 40 60
Biceps femoris Trace (0-1) 70 30 Trace (0-1) 45 55
Sartorius 50 20 30 50 20 30
Gastrocnemius 10 40 50 75 10 15
Proximal portion Distal portion
10
the rate of postmortem metabolism and pH decline are partially driven by enzyme and metabolite
concentration and activity.
The Conversion of Muscle to Meat
Typically, the conversion of muscle to meat is a well-orchestrated set of events in which
the metabolic pathways responsible for energy metabolism function with a limited oxygen
supply. This is due to a change in the physiological condition of the animal. During animal
harvest, the blood supply is rapidly removed from the circulatory system in the process known as
exsanguination. As a result, oxygen is slowly depleted from the muscle. In an attempt to
maintain cell homeostasis, ATP requirements must be met. The phosphagen system initially
maintains ATP levels by quickly re-phosphorylating ADP. During postmortem activation,
phosphoryl groups are liberated from the phosphocreatine pool that was created by the activity of
creatine kinase; this aids in replenishing ATP (Bendall, 1973). In chicken, once the
phosphocreatine reservoir is depleted by 80% when euthanasia is preceded by electrical
stunning, ATP levels begin to diminish (Briskey, CASSENS, & TEAUTMAN, 1966). The
buildup of adenosine diphosphate (ADP) is a direct result of ATP breakdown. ADP is removed
from the system by the adenylate kinase reaction in which ATP and adenosine monophosphate
(AMP) are generated. AMP is converted to inosine monophosphate (IMP) by AMP deaminase,
which accumulates in the dying muscle (Lawrie, 1985). Once the phosphagen system is
exhausted glycogenolysis and anaerobic glycolysis predominate. The glucose-6-phosphate
produced from glycogenolysis is used in anaerobic glycolysis to synthesize pyruvate. Pyruvate is
converted to lactate to generate NAD+, which drives the continuation of anaerobic glycolysis.
Lactate is unable to be removed postmortem and accumulates in the muscle.

11
Eventually, the rate of ATP breakdown exceeds ATP synthesis. As a result, the ATP
necessary to break actomyosin cross-bridges and maintain a relaxed muscle state is unavailable.
With less than 1 μmol of ATP/g remaining in the muscle (Pietrzak et al., 1997), actomyosin
cross-bridges become permanent, indicating rigor mortis onset (Lawrie, 1985).
Concurrently to postmortem glycolysis, pH declines. This drop in pH is a result of
the movement of substrate through the enzyme phosphofructokinase before its inactivation,
allowing for pyruvate to be converted to lactate more rapidly (England et al., 2014). The rate and
extent to which this happens are modulators in turkey meat quality development (Berri,
Wacrenier, Millet, & Le Bihan-Duval, 2001). Poultry muscle differs from other meat species in
that the rate of glycolysis is more rapid (Addis, 1986). Typically, pH moderately declines from
7.0 in the living muscle to approximately 6.0 within or in 1 h postmortem (Pietrzak, Greaser, &
Sosnicki, 1997) at a rate of 0.03units/min in turkey breast muscle (Sosnicki, Greaser, Pietrzak,
Pospiech, & Sante, 1998). An ultimate pH of 5.7-5.9 is reached (Briskey et al., 1966).
Aberrations Affecting Postmortem Metabolism and Meat Quality
Temperature
Temperature, processing techniques, and exsanguination contribute to quality variation in
a commercial processing environment. These factors often affect normal postmortem metabolism
by altering the rate and extent to which pH declines. Consequently, quality attributes such as
color, texture, and water-holding capacity are changed; the result is aberrant meat.
Meat pH and color are highly correlated. High ultimate pH is commonly associated with
dark meat and can be firm and dry (DFD); this is often the result of animals that have

12
experienced extensive pre-harvest stress. For poultry species, this defect is often correlated with
a pH greater than 6.1 (Swatland, 2008). Similarly, low muscle pH is linked to lighter meat and is
characterized as pale, soft, and exudative (PSE). Turkey meat with this quality defect has a final
pH of less than 5.8 (Sosnicki et al., 1998). Poor water-holding capacity combined with high
lightness (L*) color values are the general parameters describing PSE poultry (Barbut, 1997;
Woelfel, Owens, Hirschler, & Sams, 1998).
Rigor development at elevated muscle temperatures can induce the PSE condition in
turkey meat. FREMERY and POOL (1960) determined that birds exposed to temperatures
between 37 and 41◦C during processing exhibit rapid postmortem glycolysis and early rigor
onset. In agreement, it was reported that chicken pectoralis maintained at a temperature between
30 and 37◦C displayed an increased rate of postmortem glycolysis and ATP depletion (Khan,
1971). Poultry meat demonstrating and increased rate of postmortem glycolysis has been
characterized by high glycogen degradation and increased lactate accumulation (Zhu, Ruusunen,
Gusella, Zhou, & Puolanne, 2011).
Specifically, poor color, water-holding capacity, and texture resulting from PSE meat has
been attributed to loss of protein functionality/solubility and degradation due to rapid pH decline.
Myofibrillar and sarcoplasmic proteins play a key role the capacity of meat to retain moisture.
This greatly affects texture, cohesiveness, and light reflectance. Due to the dipolar nature of
water molecules, they interact, or bind to the residues of these charged proteins and are held
there. However, if muscle is exposed to moderate pH decline and high temperature for a long
period of time, protein denaturation can be significantly greater than if severe pH and
temperature conditions exist for a short period of time (Offer, 1991). This denaturation results in

13
a less birefringent myofibril. As a result, light back-scattering increases due to altered protein
structure, resulting in a paler meat color (Swatland, 2008).
Under these conditions, extractability of proteins is often reduced due to denaturation and
degradation. The inability to extract proteins due to loss of functionality is detrimental to
production of further processed products. For instance, pectoralis muscles exposed to
temperatures of 40◦C during postmortem metabolism, present a sarcoplasmic protein content
lower than groups exposed to 0 and 20◦C temperatures (Zhu et al., 2011). Similarly, the
myofibrillar fraction was higher in protein content (Zhu et al., 2011). Pietrzak et al. (1997)
showed that this is likely due to precipitation of the sarcomplasmic protein phosphorylase on the
myofilaments in turkey. On the contrary, Pietrzak et al. (1997) found through fluorescent anti-
phosphorylase staining that phosphorylase accumulates in specific locations on the sarcomere:
the Z lines and middle of the A band. This suggests that myosin is not coated by precipitating
sarcoplasmic proteins on the myofibril, but that it is denatured, resulting in lowered
extractability. Irving, Swatland, and Millman (1989) and Offer (1991) hypothesized that during
rigor, myosin head shrinkage and denaturation leads the thick and thin filaments becoming more
closely associated.
Stun Method and Blood Removal
Stun technique can have major effects on bleed out efficiency. For many slaughter
facilities, low voltage electrical stun is the primary method of humane slaughter.
Unconsciousness is achieved by a low voltage (~13 to 15 mA) current flowing through a water
bath (Alvarado, Richards, O’Keefe, & Wang, 2007). Although studies have shown that initial

14
blood loss is affected, total blood loss after a 90-120s exanguination period is no different from
high voltage stun methods popular in the European Union (Gregory, 1993; Papinaho & Fletcher,
1995). In the last decade, the use of a carbon dioxide gas mixture has become a widespread
alternative. The gas is generally comprised of 30-55% CO2 and an argon filler (Mohan &
Gregory, 1990). These gases work in unison to render the bird unconscious. Specifically, carbon
dioxide lowers the pH of the cerebrospinal fluid (Alvarado et al., 2007), while argon displaces air
(Eisele, Eger 2nd, & Muallem, 1966). The result is an anesthetic and anoxic response. The
differences in these stun methods have been investigated in regards to bleed out efficiency and
residual hemoglobin content in the breast muscle.
When comparing these two stun methods Alvarado et al. (2007) determined that the
hemoglobin concentration in the chicken breast was lower in birds stunned with CO2 gas (8.53
+/- 1.38 µmole/kg) as compared to low-voltage electrical stun (8.72 +/- 1.66 µmole/kg), although
not statistically significant. These data showed only a small reduction (13-17%) in hemoglobin
content from birds bled and not bled. This small difference in hemoglobin content may be
explained by the lack of force available to drive blood out of muscle capillary beds after a rapid
blood pressure drop due to exanguination (Alvarado et al., 2007). Mohan et al. (1990) reported
differences in bleed out time of approximately 35 s when comparing CO2 and electrical stun
methods; 155s bleed out time and 120 s were determined respectively. This correlated with a
marginally heavier carcass weight for the CO2 stunned birds. These data suggested that a bleed
out efficiency was slightly impaired by the CO2 stun, resulting in a higher muscle hemoglobin
content. However, Raj, Grey, Audsely, and Gregory (1990) demonstrated that a* (redness) color
values were greater in electrically stunned birds. Perhaps the elevated a* values were due to
hemorrhages in the muscle from a traumatic stun method. These studies have sufficiently shown

15
that variation in stun method affects bleed out efficiency and, in turn, the hemoglobin
concentration remaining in the muscle. Enough residual hemoglobin in the muscle will affect
color and ultimately meat quality.
Summary
Although meat color is known as the most important quality attribute to consumers, many
factors influence its development. Inherently, heme pigment content, color stability, and muscle
fiber type composition are contributors. Environmentally, temperature, processing techniques
and inefficient bleed out can result in aberrant quality. Recently, a visible two-toning has
become evident in the turkey pectoralis major muscle. With poultry consumption popular, the
direct cause of this aberration must be investigated.
16
References
Addis, P. B., 1986. Muscle as Food. P. J. Betchel, ed. Academic Press, New York, NY
Press, New York, NY.
Alvarado, C., Richards, M., O’Keefe, S., & Wang, H. (2007). The effect of blood removal on
oxidation and shelf life of broiler breast meat. Poultry science, 86(1), 156-161.
Antonini, E. (1965). Interrelationship between structure and function in hemoglobin and
myoglobin. Physiological reviews, 45(1), 123-170.
Barbut, S. (1997). Problem of pale soft exudative meat in broiler chickens. British Poultry
Science, 38(4), 355-358.
Bekhit, A. E.-D. A., Geesink, G. H., Ilian, M. A., Morton, J. D., Sedcole, R., & Bickerstaffe, R.
(2003). Particulate metmyoglobin reducing activity and its relationship with meat color.
Journal of agricultural and food chemistry, 51(20), 6026-6035.
Bendall, J. (1973). Postmortem changes in muscle. The structure and function of muscle, 2(Part
2), 244-309.
Berri, C., Wacrenier, N., Millet, N., & Le Bihan-Duval, E. (2001). Effect of selection for
improved body composition on muscle and meat characteristics of broilers from
experimental and commercial lines. Poultry Science, 80(7), 833-838.
Briskey, E. J., CASSENS, R. G., & TEAUTMAN, J. (1966). The physiology and biochemistry
of muscle as a food. The physiology and biochemistry of muscle as a food.
Brooks, J. (1937). Color of meat. Food industry, 9, 707.
Clydesdale, F., & Francis, F. (1972). Color measurement of foods. xXVII. the chemistry of meat
color. Food Prod Develop.
Cornish, D., & Froning, G. (1974). Isolation and purification of turkey heme proteins. Poultry
science, 53(1), 365-377.
Eisele, J., Eger 2nd, E., & Muallem, M. (1966). Narcotic properties of carbon dioxide in the dog.
Anesthesiology, 28(5), 856-865.
Food and Agriculture Organization of the United Nations. (2012). Statistics.
Fletcher, D. (2002). Poultry meat quality. World's poultry science journal, 58(02), 131-145.
Fox Jr, J. B. (1966). Chemistry of meat pigments. Journal of Agricultural and Food Chemistry,
14(3), 207-210.
FREMERY, D., & POOL, M. F. (1960). BIOCHEMISTRY OF CHICKEN MUSCLE AS
RELATED TO RIGOR MORTIS AND TENDERIZATIONa. Journal of Food Science,
25(1), 73-87.
Gregory, N. (1993). Causes of downgrading in chickens, turkeys and ducks. Broiler Ind, 56, 42-
45.
Grunert, K. G. (2006). Future trends and consumer lifestyles with regard to meat consumption.
Meat Science, 74(1), 149-160.
Hartman, F. A. (1961). Locomotor mechanisms of birds (Vol. 143): Smithsonian institution.
Henckel, P., Oksbjerg, N., Erlandsen, E., Barton-Gade, P., & Bejerholm, C. (1997). Histo-and
biochemical characteristics of the longissimus dorsi muscle in pigs and their relationships
to performance and meat quality. Meat Science, 47(3), 311-321.
Irving, T., Swatland, H., & Millman, B. (1989). X-ray diffraction measurements of myofilament
lattice spacing and optical measurements of reflectance and sarcomere length in
commercial pork loins. Journal of Animal Science, 67(1), 152-156.
Johnson, B. (1974). Chilled vacuum-packed beef. CSIRO Food Res. Quart, 34, 14.

17
Joseph, P., Suman, S., Li, S., Beach, C., & Claus, J. (2010). Mass spectrometric characterization
and thermostability of turkey myoglobin. LWT-Food Science and Technology, 43(2),
273-278.
Joseph, P., Suman, S. P., Li, S., Claus, J. R., Fontaine, M., & Steinke, L. (2011). Primary
structure of turkey myoglobin. Food Chemistry, 129(1), 175-178.
Khan, A. (1971). Effect of temperature during post‐mortem glycolysis and dephosphorylation of
high energy phosphates on poultry meat tenderness. Journal of Food Science, 36(1), 120-
121.
Klont, R., Brocks, L., & Eikelenboom, G. (1998). Muscle fibre type and meat quality. Meat
Science, 49, S219-S229.
Kranen, R., Van Kuppevelt, T., Goedhart, H., Veerkamp, C., Lambooy, E., & Veerkamp, J.
(1999). Hemoglobin and myoglobin content in muscles of broiler chickens. Poultry
science, 78(3), 467-476.
Lee, S., Joo, S., & Ryu, Y. (2010). Skeletal muscle fiber type and myofibrillar proteins in
relation to meat quality. Meat science, 86(1), 166-170.
Mancini, R., & Hunt, M. (2005). Current research in meat color. Meat science, 71(1), 100-121.
Matthews, D., & Fox, E. (1976). The physiological basis of physical education and athletics.
Philadelphia, WB Saunders, 135-149.
Mohan, R. A., & Gregory, N. (1990). Investigation into the batch stunning/killing of chickens
using carbon dioxide or argon-induced hypoxia. Research in Veterinary Science, 49(3),
364-366.
Nishida, J., & Nishida, T. (1985). Relationship between the concentration of myoglobin and
parvalbumin in various types of muscle tissues from chickens. British poultry science,
26(1), 105-115.
Offer, G. (1991). Modelling of the formation of pale, soft and exudative meat: Effects of chilling
regime and rate and extent of glycolysis. Meat Science, 30(2), 157-184.
Papinaho, P., & Fletcher, D. (1995). Effect of stunning amperage on broiler breast muscle rigor
development and meat quality. Poultry science, 74(9), 1527-1532.
Pietrzak, M., Greaser, M., & Sosnicki, A. (1997). Effect of rapid rigor mortis processes on
protein functionality in pectoralis major muscle of domestic turkeys. Journal of Animal
Science, 75(8), 2106-2116.
Pikul, J., Niewiarowicz, A., & Kupijaj, H. (1986). The cytochrome c content of various poultry
meats. Journal of the Science of Food and Agriculture, 37(12), 1236-1240.
Pirko, P. C., & Ayres, J. C. (1957). Pigment changes in packaged beef during storage. Paper
presented at the Food Technology.
Raj, A. M., Grey, T., Audsely, A., & Gregory, N. (1990). Effect of electrical and gaseous
stunning on the carcase and meat quality of broilers. British Poultry Science, 31(4), 725-
733.
Seideman, S., Cross, H., Smith, G., & Durland, P. (1984). Factors associated with fresh meat
color: a review. Journal of Food Quality, 6(3), 211-237.
Senauer, B. (2001). The food consumer in the 21st century: new research perspectives: Retail
Food Industry Center, University of Minnesota.
Sosnicki, A., Greaser, M., Pietrzak, M., Pospiech, E., & Sante, V. (1998). PSE‐LIKE
SYNDROME IN BREAST MUSCLE OF DOMESTIC TURKEYS: A REVIEW.
Journal of Muscle Foods, 9(1), 13-23.

18
Suman, S. P., & Joseph, P. (2013). Myoglobin chemistry and meat color. Annual review of food
science and technology, 4, 79-99.
Swatland, H. (2008). How pH causes paleness or darkness in chicken breast meat. Meat science,
80(2), 396-400.
Wiskus, K., Addis, P., & Ma, R. T. (1976). Distribution of βR, αR and αW fibers in turkey
muscles. Poultry Science, 55(2), 562-572.
Woelfel, R., Owens, C., Hirschler, E., & Sams, A. (1998). The incidence and characterization of
pale, soft and exudative chicken meat in a commercial plant. Poultry Sci, 77(Suppl 1), 62.
Zhu, X., Ruusunen, M., Gusella, M., Zhou, G., & Puolanne, E. (2011). High post-mortem
temperature combined with rapid glycolysis induces phosphorylase denaturation and
produces pale and exudative characteristics in broiler Pectoralis major muscles. Meat
Science, 89(2), 181-188.
19
Chapter 2. Pectoralis muscle of turkey displays divergent function as
correlated with meat quality
Abstract
Fresh turkey meat color is determined by many factors which include muscle fiber type
composition and heme protein concentrations. These factors either are affected by or influence
biochemical events occurring postmortem. Deviations in the processing environment can also
result in aberrant fresh meat quality and may ultimately change the quality characteristics of
further processed products. Our objective was to describe the underlying cause and significance
of the two-toning color defect in fresh turkey breast. In the first experiment, pectoralis muscles
were collected and analyzed using image processing to characterize fresh turkey color. In the
second experiment, time from stun to exsanguination was tested as a promoter of fresh turkey
color. Results showed that the turkey breast possesses two distinct lobes that differ in pH, drip
loss, energy metabolism and muscle fiber type composition. Results also showed that the time
from stun to exsanguination enhanced fresh turkey color (P < 0.05) by mitigating the differences
between the two lobes. These results show inherent differences in breast muscle and processing
conditions interact to establish variations in fresh turkey color.
Introduction
In recent decades, the poultry industry has witnessed an increase in product sales due to a
consumer desire for convenience. In 2013, the impact of turkey sales alone contributed $4.83
billion dollars to the United States meat industry from over 7 billion pounds of meat products
(USDA NASS, 2015). With the popularity of value-added products, numerous meat quality
problems have surfaced, however (Qiao, Fletcher, Smith, & Northcutt, 2001; Rathgeber, Boles,
& Shand, 1999) the problems have been attributed to undesirable color and poor water-holding
capacity (Sosnicki & Wilson, 1991). Two-toning is a meat quality defect often characterized by

20
an inconsistent or dramatic color change visualized within or between muscles. Recently,
industry partners have observed an inconsistent color pattern or two-toning in the face of fresh
turkey breasts that translate into inconsistencies in further processed products like turkey deli
rolls. Because color is the primary determinant of meat purchasing decisions (Mancini & Hunt,
2005; Mitsumoto, O’Grady, Kerry, & Buckley, 2005; Ramírez & Cava, 2007), inconsistencies in
the color of deli rolls makes them less desirable to consumers.
Underlying differences in muscle and changes in postmortem metabolism can contribute
to meat color development. Inherent muscle color differences commonly result from variation in
heme pigment content and muscle fiber type composition (Kranen et al., 1999). The primary
pigment that gives meat its red color is myoglobin though hemoglobin and cytochrome c
contribute as well (Mancini & Hunt, 2005). Muscle myoglobin abundance is dictated by the
fiber type profile found in the muscle (Choe et al., 2008; Dransfield & Sosnicki, 1999; Hunt &
Hedrick, 1977; Seideman, Cross, Smith, & Durland, 1984). Muscle fiber types have been
classified based upon contractile speed and primary metabolism (Ozawa et al., 2000; Peter,
Barnard, Edgerton, Gillespie, & Stempel, 1972; Ryu & Kim, 2005). While these underlying
muscle properties can be different, events of postmortem metabolism may affect color
development as well.
The current experiment was designed to characterize the two-toning nature of the
pectoralis major muscle. The objective was to determine if inherent muscle differences or
postmortem metabolic events are responsible for the development of the two-toning phenomenon
visualized by consumers. The second goal was to determine if the stun to exsanguination time
enhanced the two-toning quality defect.

21
Materials and Methods
Characterizing the two-toning defect of the pectoralis major muscle
Muscle sampling. The pectoralis major muscle of 48, 20-wk old tom turkeys were obtained
from a commercial processing facility. Breast muscles were chosen at random from immediately
after the de-boning. Muscle samples (~5g) were collected from the large and small lobes of the
pectoralis major as outlined in Figure 1. Samples were frozen in liquid nitrogen and stored at -
80◦C for further analysis.
Color measurement and image analysis. The epimysium of the pectoralis major muscle was
removed using a knife with approximately 4 mm of the muscle surface followed by a 10 min
bloom period. In attempt to quantify color contrasts existing in two-toned turkey breast meat, a
Konica-Minolta Chroma Meter CR-200 (Ramsey, NJ) was first used. Unfortunately, sampling
limitations of this technology surfaced when lightness (L*), redness (a*), and yellowness (b*)
color value differences could not be detected by its point measurement design (Kang, East, &
Trujillo, 2008). Due to the muscle’s non-homogenous distribution of color and the colorimeter’s
inability to account for localized variability (Antonelli et al., 2004), two-toning was masked.
To solve this problem, CIELAB color values for the entire breast were determined using
a image processing. Using this approach, breast images were collected and quantified in an RGB
color space. RGB values were then converted to values in CIELAB color space. A light stand
(Bencher, Antioch, IL) with Sylvania DVY 650W 120V halogen/tungsten bulbs (Interlight,
Hammond, IN) was used to capture images of the pectoralis major muscle with a Powershot
SX170 IS camera (Canon, Melville, NY). The camera was equipped with a 16 megapixel sensor
with a 28 mm wide-angle lens. All lighting selections were in accordance with guidelines

22
established by the American Meat Science Association Guidelines for meat color evaluation
(AMSA, 2012). Resulting images were cropped in Paint.NET (dotPDN, Kirkland, WA) and
analyzed using image processing software (MATLAB 2014a, MathWorks, Natick, MA). A
software script was written to convert red, green, and blue matrices (RGB), or an M x N x 3
image, to CIELAB color space (Ruszon, 1997). A second software script calculated the statistical
parameters for the resulting color distribution: mean, standard deviation, minimum, maximum,
first quartile, third quartile, and skew. To minimize outliers, thresholding was used to eliminate
values representative of fat, light scattering, and background. The script eliminated these values
and re-calculated the initial statistical parameters. Approximately four percent of the total pixels
were removed with this function.
To normalize the data to a known color value range, images of the Japanese Pork Color
Standards were captured under the same lighting conditions. Color standards were also measured
in triplicate with Konica-Minolta Chroma Meter CR-200 (Ramsey, NJ) to obtain color
measurements in the CIELAB color space. Color standard images were similarly converted from
RGB to the CIELAB color space. The delta change between the Konica-Minolta Chroma Meter
CR-200 and imaging color values were calculated and averaged for each standard. The delta
value was subtracted from all image values in order to normalize the MATLAB data output from
the pectoralis images to the colorimeter data.
Muscle classification. To evaluate the two-toning, images of the pectoralis major muscles
collected were visually categorized by an untrained academic panel of five individuals as single-
toned or two-toned. Images consistently classified by the panelists as single-toned or two-toned
were assigned to that category. Muscle images were analyzed for L* and a* color value

23
differences. Panel classifications were confirmed quantitatively by a delta change between the
large and small lobe.
pH analysis. Muscle pH was determined from the adapted method of Bendall (1973). Frozen
muscle tissue was homogenized in 5 mM sodium iodoacetate and 150 mM KCl (pH 7.0) at a 1:8
ratio (wt/vol) using a Tissue Lyser II (Qiagen, Valencia, CA). Tissue homogenates were heated
at 25◦C, centrifuged and measured using an Orion Ross Ultra pH electrode (Fisher Scientific,
Pittsburgh, PA).
Centrifugal drip collection. Exudates were collected from muscle samples with a modified
procedure of Bouton, Harris & Shorthose (1971). Muscle samples (~16 g) were collected in
triplicate, weighed and placed in a 50 mL conical tube and centrifuged at 1500 x g for 60 min.
Following centrifugation, samples were removed, lightly blotted and re-weighed. Drip loss was
calculated in triplicate as a percentage of the original weight of the sample 24 h postmortem.
Protein content. Frozen muscle samples were powered in liquid nitrogen for both soluble and
total protein content. Soluble proteins were extracted by homogenization from a muscle sample
using 0.025M potassium phosphate buffer (pH 7.2) according to Joo, Kauffman, Kim, and Park
(1999) and measured using the Pierce BCA Assay Kit (Thermo Scientific, Rockford, IL). Total
muscle proteins were solubilized using a buffer containing 8 M urea, 2 M thiourea, 3% SDS
(wt/vol), 75 mM diotheothreitol, 0.05 M Tis-HCl (pH 6.8) and heated at 95◦C for 5 min (Warren,
Krzesinski and Greaser, 2003). Total protein concentration was determined using the Bio-Rad
RC DC protein assay (Bio-Rad, Hercules, CA).

24
Sarcomere length determination. Myofibrils were purified from frozen tissue samples using
the procedure described by Weaver, Bowker, and Gerrard (2008). Tissue samples were
homogenized using a Polytron PT-MR 2100 (Kinematica Ag, Littau-Lucerne, Switzerland) in
rigor buffer containing 75 mM KCl, 10 mM imidazole, 2 mM MgCl2, 2 mM ethylene glycol
tetracetic acid, 1 mM NaN3 (pH 7.2). Samples were centrifuged for 1 min and the supernatant
was discarded. Fresh rigor buffer was added to the sample pellet and homogenized for 10 sec.
Steps were repeated three times. Samples were diluted 1:1 with glycerol and rigor buffer
solution. Samples were stored at -20◦C until analysis.
Samples were diluted 1:4 and applied to a microscope slide with coverslip. Images of ten
myofibrils per sample were captured using a Nikon Inverted Microscope Eclipse Ti-E/B
equipped with a DS-L3 camera (Chiyoda, Tokyo, Japan) and NIS Elements (version 4.13)
software. The length of five consecutive sarcomeres from each image was determined by
measuring from Z line to Z line using a 10 μm ruler. The average sarcomere length for each
sample was calculated based on randomly selected ten images.
Muscle metabolite analysis. To prepare samples for metabolite analysis, two Eppendorf tubes
with 100 mg of frozen muscle was powdered using liquid nitrogen. One sample was subjected to
acid hydrolysis at 95◦C for glycogen analysis. The second sample was homogenized in 0.5 M
perchloric acid and centrifuged. The supernatant was removed and neutralized with 2 M KOH.
Muscle glucose, glucose-6-phosphate, glycogen, and lactate concentrations were determined
using enzymatic methods (Bergmeyer, 1984) modified for a 96-well microplate assay
(Hammelman et al., 2003). Glycolytic potential was calculated according to Monin and Sellier
(1985): glycolytic potential [μmole/g] = 2(glucose+glucose-6-phosphate+glycogen) + lactate.
25
Gel electrophoresis and protein blotting. Total muscle proteins of a 50 mg sample were
solubilized in a buffer containing 8 M urea, 2 M thiourea, 3% SDS (wt/vol), 75 mM
diotheothreitol, 0.05 M Tis-HCl (pH 6.8) and heated at 95◦C for 5 min (Warren, Krzesinski and
Greaser, 2003). Total protein concentration was determined using the Bio-Rad RC DC protein
assay (Bio-Rad, Hercules, CA). Samples were diluted to contain 8 μg/μL protein using the
solubilization buffer (Warren, Krzesinski and Greaser, 2003). For electrophoresis, 240μg and 60
μg/lane of protein were loaded for hemoglobin and lactate dehydrogenase detection, respectively.
Proteins were electrophoresed at 60 V for 20 min and 120 V for 2 h 45 min using a 15%
polyacrylamide gel and transferred to nitrocellulose membrane at 50 V for 1 h. To prevent non-
specific antibody binding, membranes were blocked in PBS with 3% casein for 1 h. Primary
antibody incubations were performed in blocking buffer in a cold room overnight and were
washed with TBS-T containing 0.05% Tween three times after incubation. Membranes were
incubated overnight with the primary antibody as follows: anti-hemoglobin beta 1:200 (LS-
C294450; Lifespan Biosciences, Seattle, WA) and anti- lactate dehydrogenase A 1:2000 (NBP-
1-48336; Novus Biologicals, Littleton, CO). Secondary antibody donkey anti-rabbit IgG (926-
32213; Li-cor Biosciences, Lincoln, NE) was applied at 1:5000 dilution, incubated for 1 h at
room temperature, and washed three times. Antibody binding was determined by exposure to
fluorescence.
Following quantification, membranes were re-blocked for 1 h in PBS with 3% casein.
Beta actin abundance was used as a loading control on all membranes. Membranes were
incubated in primary and secondary membranes as follows: anti-beta actin 1:2000 (NB600-501;
Novus Biologicals, Littleton, CO) and goat anti- mouse 1:5000 (926-6818; Li-cor Biosciences,

26
Lincoln, NE). All membranes were re-scanned for fluorescent detection. Lactate dehydrogenase
membranes were stained Ponceau-S to confirm equal loading.
RNA extraction, reverse transcription, and PCR amplification. Total RNA was extracted
using the Direct-zol RNA Mini Prep Kit (Zymo Research, Irvine, CA). cDNA was generated
using the High Capacity cDNA Reverse Transcriptase Kit (Applied Biosystems, Waltham, MA)
and a DNA Engine PTC-200 Peltier Thermal Cycler (Biorad, Hercules, CA). For determination
of myoglobin mRNA abundance, a 7500 Fast Real-Time PCR System (Applied Biosystems,
Waltham, MA) was used with SYBR green detection. Myoglobin and 18S rRNA primers were
designed using the sequences provided by NCBI accession code XM_003202347.2 and
AJ419877, respectively. The myoglobin primer was (5’3
’) AGTGGAGGCCGATATTGCTG
(Forward) and TCACCTCCGGCTATAACGAC (Reverse) and was synthesized by Eurofins
MWG Operon (Huntsville, AL). Expression of the 18S rRNA housekeeping gene was detected
using primers (5’3
’) CCGTCGTAGTTCCGACCATAA (Forward) and
GAGGGTCATGGGAATAACG (Reverse). All primers were diluted to a 10 μM concentration
prior to use. For PCR quantification, the Ct endpoint was used. Gene expression was determined
by the 2-∆∆Ct
method.
Tom selection. A truck containing approximately 1000 birds were randomly selected and
stunned with carbon dioxide. Following stunning, 20 tom turkeys were randomly selected for
slaughter and identified as the ‘first’ treatment group coming off the truck. A second set of 20
toms were randomly selected from the ‘last’ 100 birds shackled off the truck and harvested.
Approximately 1.5 h post-chill, identified birds were removed from the processing line and one

27
pectoralis major muscle was removed for further analysis. This procedure was repeated on a
second day for a total of two replicates (trucks).
Statistical analysis. All muscle property parameters were subjected to an ANOVA test using
JMP Pro 11(SAS Institute, Cary, NC) statistical software as a completely randomized designed.
Lobe served as the main effect. Color measurements were analyzed as a two-by-two full factorial
design. Lobe and color condition served as main effects for characterization color measurements.
Time and lobe served as main effects for the study component evaluating time effect on color,
Truck/day was imputed in the model as a block. Significant differences of means were
determined using an alpha level of 0.05. Significant results were further compared using the LS
Means Student’s T Test.
Results and Discussion
Characterizing the two-toning defect of the pectoralis major muscle
Initially, there was no interaction between lobe and the color assignment of each
pectoralis major muscle classified by an untrained panel. Figure 2 shows L* color values and the
variability for the main effects of lobe and condition. Figure 2a indicates that the small lobe is
darker (P = 0.0007), while the two lobes are consistently variable in color (Fig. 2b). Analysis of
the single-toned and two-toned classifications made by the untrained panel suggests that the
single-toned group displays a higher degree of lightness (Fig. 2c) and similar color variation to
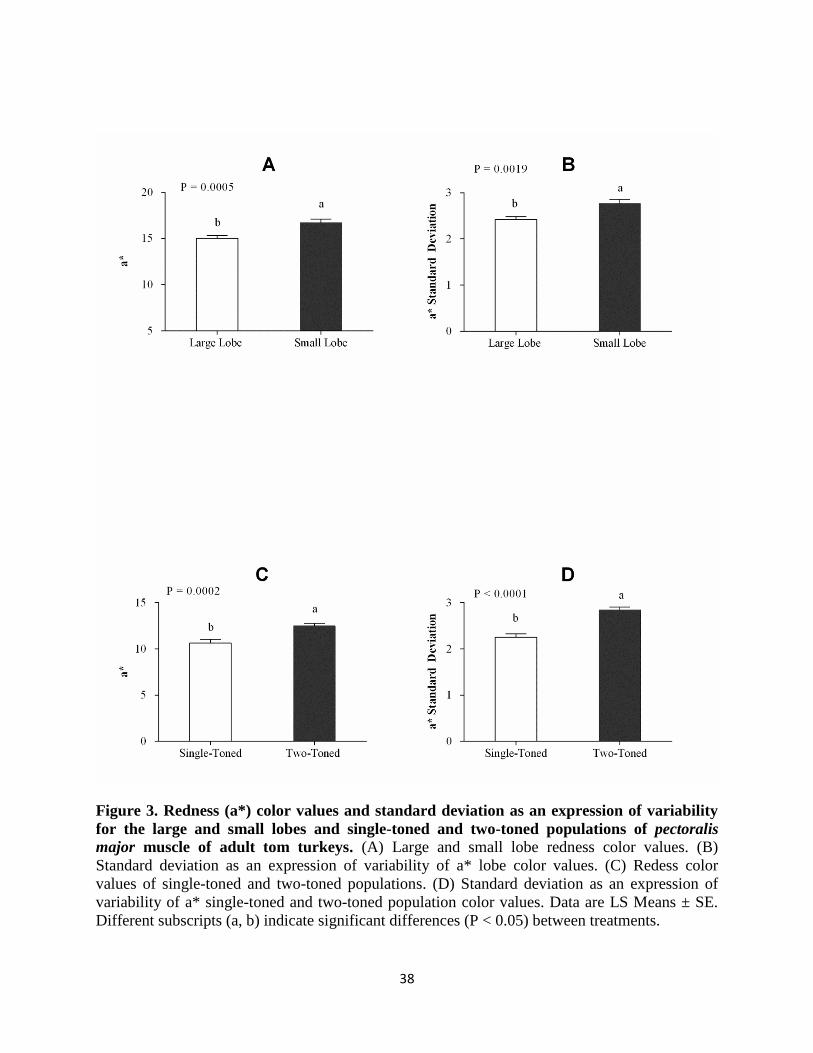
the two-toned group (Fig. 2d). Assessment of redness showed the small lobe (Fig. 3a) and two-
toned population to appear redder (Fig. 3c), while both were more variable (Fig. 3b) in color than
the large lobe (Fig. 3b) and single-toned population (Fig. 3d). These data show that an untrained

28
panel can detect differences in fresh turkey meat color and suggest the severity of two-toning in
turkey breast muscle is more a function of the smaller lobe being darker than the large lobe being
lighter.
In support of the aforementioned, redness (a*) values are shown in Fig. 3. Redness values
for those breasts muscles designated two-toned were greater (P = 0.0005) than that of the single-
toned group. The nature of redness, however, was more variable, as suggested by a greater
variation in two-toned and smaller lobes (Fig. 3b and 3d). These data confirm that the smaller
lobe of fresh turkey breast muscles plays a bigger role in color variation than would be
anticipated. To understand the cause of color variation in two-toning, a full characterization of
the large and small lobe muscle properties was performed.
Heme proteins such as myoglobin, hemoglobin, and cytochrome c give meat its color.
Postmortem, myoglobin is the major pigment responsible for meat color. However, other heme
pigments such as hemoglobin become more important in color formation when processing
abnormalities such as inefficient bleed-out occur (Alvarado et al., 2007; Bourbab & Idaomar,
2012; Warriss, 1977). With the darker (Fig. 2a) and redder (Fig. 3a) appearance of the small
lobe, both myoglobin and residual hemoglobin content were measured. Cytochrome c was not
investigated due to its low concentration in glycolytic muscles and its minor role in fresh meat
color development (Pikul et al., 1986)
Initial attempts to quantify myoglobin in the large and small lobe of the pectoralis major
muscle using western blot techniques were unsuccessful. This result is not surprising because
Kranen et al. (1999) was unsuccessful in detecting myoglobin in the pectoralis major muscle due
to the muscle’s predominating glycolytic nature. To circumvent this issue, myoglobin
abundance was evaluated in both lobes using real-time quantitative PCR. Results indicated that

29
myoglobin expression was indeed greater (P = 0.0121) in the small lobe than the large lobe (Fig.
4). These data suggest muscle fiber type in the small lobe may differ from the large lobe. To
eliminate the possibility of blood-based heme contamination, hemoglobin was determined.
Results indicated no differences (P = 0.99) in hemoglobin content between the large and small
lobe (Fig. 5). These data suggest differences between lobes are not due to incomplete
exsanguination of lobes but rather differences in muscle fiber type characterisitics.
Because myoglobin content is highly correlated with differences in muscle fiber type
composition and, thus, postmortem metabolism (Kranen et al., 1999), we determined the ultimate
pH and glycolytic metabolites between the large and small lobes. The small lobes had a higher (P
< 0.0001) ultimate pH (5.97 ± 0.02) compared to the large lobe (5.82 ± 0.03; Figure 6).
Moreover, the small lobe contained lower lactate (P < 0.0001) and glycogen (P = 0.0078) and as
such, a lower glycolytic potential (P < 0.0001; Table 1). Lower glycolytic potential is a measure
of the metabolites that may have come from the breakdown of glycogen. Glycolytic potential
would also be greater with in glycolytic, fast-contracting muscle fibers. Glycolytic potential
would also be inversely correlated with oxidative metabolism. Fewer glycogen stores are needed
because they rely less on glycolysis and more on the oxidative metabolism (Schwerzmann,
Hoppeler, Kayar, & Weibel, 1989). While the small lobe remains glycolytic, small shifts in
oxidative profile are evident in the small lobe. On the other hand, the resulting increased lactate
accumulation and low ultimate pH of the large lobe suggests an extended postmortem glycolysis.
A greater flux of substrate through the phosphofructokinase (PFK) before its inactivation allows
for pyruvate to be converted to lactate more rapidly (England, Matarneh, Scheffler, Wachet, &
Gerrard, 2014).

30
Differences in metabolite content and pH are likely due to differences muscle fiber type
content. For example, high glycogen stores, high lactate content and low myoglobin content all
contribute to the notion that the large lobe possesses a more glycolytic muscle fiber profile, while
lower glycogen stores and lower lactate accumulation and higher myoglobin content suggest a
more oxidative muscle fiber type composition. These fiber types characteristics strongly suggest
that the large lobe of the turkey pectoralis major is more glycolytic in nature than the small lobe,
which is more oxidative. To further evaluate this difference, lactate dehydrogenase (LDH)
abundance was measured. LDH is an enzyme commonly associated with glycolytic muscle fibers
and is responsible for converting pyruvate to lactate. As expected, LDH abundance of both lobes
was high because the pectoralis major is a glycolytic muscle known to be primarily comprised of
Type IIB muscle fibers (Wiskus et al., 1976). However, the large lobe contained higher (P =
0.012) LDH abundance than the small lobe (Fig. 7).
Poultry meat is known to experience rapid postmortem glycolysis (Rathgeber et al.,
1999). This is largely attributed to the glycolytic nature of their muscle fibers. Sustained elevated
temperatures in the muscle during postmortem glycolysis and pH decline can result in a loss of
protein functionality (El Rammouz, Babile, & Fernandez, 2004; Zhu et al., 2011). To determine
if protein denaturation occurred during processing, parameters such as percent drip-loss, and
protein content were measured.
Drip-loss of the large and small lobe (Fig. 8) indicated that the small lobe released 2.3%
± 0.13 of its total mass as purge, while the large lobe purged 4.9% ± 0.28 (P < 0.0001). This
difference was confirmed by the soluble protein concentration of the two groups (Fig. 9a). A
higher soluble protein content was detected in the small lobe group as compared to the large lobe
(P = 0.0027). Typically, sarcoplasmic proteins are readily soluble in buffers of low salt content.

31
If only low concentrations are detected in the soluble protein fraction, then some have likely lost
functionality. Consequently, they are likely partially lost in the form of purge (Swatland, 2008).
No differences were detected in total protein content (Fig. 9b) between the large and small lobe
groups (P = 0.8889). This was expected as total protein content is remains constant within or
between different skeletal muscles. Combined, the higher percent drip-loss and lower soluble
protein concentration of the large lobe group compared to the small lobe group suggests that a
greater number of proteins are becoming denatured postmortem. As a result, the large lobe is
potentially experiencing a greater loss of protein functionality. This protein denaturation may
partially explain two-toning phenomenon. Swatland (2008) reported that L* values are
significantly affected by denaturation of sarcoplasmic proteins, resulting in an increased amount
of extracellular water. Thus, light is greater due to an alteration in protein structure (Swatland,
2008). The increase in light scatter causes the meat to appear paler. Consequently, the lower
soluble protein content and higher percent driploss of the large lobe indicates that it may have
experienced more protein denaturation due to pH/temperature abuse during postmortem
processing. However, an evaluation of sarcomere length (Fig. 10) showed no statistical
difference between the lobes (P = 0.1423). While the sample size was small (n = 10), these data
suggest temperature abuse played no major role in the postmortem events resulting in the two-
toning effect and loss of protein functionality.
Characterization of the two-toning defect indicated significant differences in the inherent
muscle properties of the large and small lobe of the pectoralis major muscle. The large lobe had
higher metabolite concentrations, indicating a higher glycolytic potential and possible shuttling
of more substrate through glycolysis. This is correlated with the lower ultimate pH of the large
lobe. A greater flux of substrate through PFK to synthesize pyruvate downstream before its

32
inactivation would promote the accumulation of lactate postmortem. Lactate accumulation in the
muscle would result in a lower ultimate pH and ultimately meat quality. On the contrary, lower
metabolite concentrations and glycolytic potential in the small lobe suggests a shift toward
oxidative metabolism. These results combined with distinct differences in LDH abundance and
protein content suggests divergent function of the pectoralis muscle, resulting in the two-toning
phenomenon.
Stun to Exsanguination Study
Our industry partners use whole truck CO2 stunning. Due to lack of automation and the
number of birds on the truck, some birds are not exsanguinated for up to 30 min post-stunning.
Therefore, we determined the effect that the time to exsanguination played in the severity and
incidence of two-toning between the large and small lobes.
Twenty toms were randomly selected from the first 100 birds removed from the transport
truck and served as the first shackled treatment group (First). A second 20 were selected from
the last 100 of the same truck and represented the last shackled treatment group (Last). After
chilling, pectoralis major muscles was removed and subjected to color determination via image
processing. There was no interaction between lobe and time. Consequently, the main effects are
represented in Figure 11. L* color values indicated that the small lobe was darker (Fig. 11a) and
more variable in color than the large lobe (Fig. 11b). Additionally, turkey breast appeared to
darker with time (Fig. 11c), while also displaying more variation (Fig. 11d). Assessment of
degree of redness showed the small lobe being more red (Fig. 12a) and variable (Fig. 12b) in
color than the large lobe. The a* values of the turkey breast became redder (Fig. 11c) and more
varied with time (Fig. 12d). These data suggest the increased variation, as well as the darkening

33
and reddening of the turkey breast with time was a result of the inherently redder small lobe and
its variation.
One possible explanation for the inherently darker and redder small lobe was hemoglobin
content due to concerns of inefficient bled out as a result of 30 min between stunning and
exsanguination. However, hemoglobin content did not differ in the small lobe as evaluated by
time (Fig. 13). Therefore, the source of the reddening effect was not due to incomplete bleeding
caused by time.
Because stun to stick time was the primary interest of this study, breast muscle two-
toning was ignored. However, we chose to classify images of the pectoralis major muscles on
the basis of two-toning using the cut-off established from our initial studies. For example, those
samples lying within two standard deviations of the mean delta change for L* of the single-toned
group were classified as such. Once grouped, the incidence of two-toning was calculated based
on the frequency per treatment group (n = 20). Table 2 shows the frequency of single-toned and
two-toned pectoralis muscles. Curiously, the incidence of two-toned samples increases by nearly
50% in both replications of turkeys sampled last. These data show a greater frequency of two-
toning in CO2 stunned turkey breasts suggesting that the incidence of two-toning may be
partially responsible for darker and redder of the small lobe.
Our initial studies characterizing the two-toning effect suggested the underlying cause of
two toning was the result of differences in inherent muscle properties, which would not change
with time postmortem. To explore the cause of this increased incidence of two-toning further,
color, pH and metabolites were assessed. Since there was no interaction between lobe and time,
the main effects of lobe and time were evaluated independently (Fig. 14). The mean ultimate pH
values of the small lobes were higher than the large lobe (Fig. 14a). However, the ultimate pH
34
was higher in those turkeys last shackled than first shackled (Fig. 14b). This difference in pH
with time could be related to the inherent differences in glycolytic flux between the large and
small lobe. Indeed, the smaller lobe is more oxidative than the large lobe. Consequently, less
substrate was likely shuttled through PFK before shutdown postmortem. As a result, lower
concentrations of flux would occur before PFK inactivation (England et al., 2014). This means
that the ultimate pH remains higher in the small lobe. The lower (Fig. 15a) lactate concentration
of the small lobe irrespective of time (Fig. 15b), indicates that less pyruvate was converted to
lactate by LDH postmortem. If a lower flux of substrate through PFK occurred before its
inactivation, the glycolytic cascade would result in less production of pyruvate. Consequently,
less lactate would accumulate in the muscle postmortem, resulting in a higher ultimate pH.
Analysis of the residual glycogen content and glycolytic potential indicated no interaction
between time and lobe, while there was also no statistical significance to the main effect of time
(Fig. 15d and 15f). All effects were a result of inherent lobe differences. More residual
glycogen was detected in the large lobe than the small lobe (Fig. 15c). Glycolytic potential was
also higher in the large lobe than the small (Fig. 15e). These data are in agreement with earlier
characterizations.
Characterization suggested that the small lobe displayed a shift toward a slightly more
oxidative metabolism, while the large lobe remained more glycolytic. Recall, that it takes
approximately 30 min for a single truck of turkeys to be shackled. The higher ultimate pH of the
turkey breast with time (Fig. 14b) could be due to a higher ultimate pH (Fig. 14a) of the small
lobe and its lower lactate content (Fig. 15a). If so, the higher ultimate pH of the small lobe (Fig.
14) and lower lactate content (Fig. 15a) could be explained by a changed in body temperature of
the bird within the shackling time period. If the small lobe functions under a more oxidative

35
metabolism than the large lobe, then perhaps the lowering of the external body temperature of
turkeys by approximately 6◦C (Fig. 16) slows metabolism. This would results in a higher
ultimate pH and less lactate accumulation.
Conclusions
Taken together, data suggest that the time from stun to exsanguination enhances the two-
toning color defect and that differences in muscle metabolism between the large and small lobe
may explain the color development postmortem.

36
Figure 1. Sampling location of the large and small lobes of the pectoralis major muscle in
adult tom turkeys for experiment one and two. The large and small lobe were differentiated
by the fibrous raphe running medial through the muscle.

37
Figure 2. Lightness (L*) color values and standard deviation as an expression of variability
for the large and small lobes and single-toned and two-toned populations of pectoralis
major muscle of adult tom turkeys. (A) Large and small lobe lightness color values. (B)
Standard deviation as an expression of variability of L* lobe color values. (C) Lightness color
values of single-toned and two-toned populations. (D) Standard deviation as an expression of
variability of L* single-toned and two-toned population color values. Data are LS Means ± SE.
Different subscripts (a, b) indicate significant differences (P < 0.05) between treatments.
38
Figure 3. Redness (a*) color values and standard deviation as an expression of variability
for the large and small lobes and single-toned and two-toned populations of pectoralis
major muscle of adult tom turkeys. (A) Large and small lobe redness color values. (B)
Standard deviation as an expression of variability of a* lobe color values. (C) Redess color
values of single-toned and two-toned populations. (D) Standard deviation as an expression of
variability of a* single-toned and two-toned population color values. Data are LS Means ± SE.
Different subscripts (a, b) indicate significant differences (P < 0.05) between treatments.

39
Figure 4. Relative myoglobin mRNA abundance of the small and large lobes of the
pectoralis major muscle in adult tom turkeys. Data are LS Means ± SE. Different subscripts
(a,b) indicate significant differences (P < 0.05) between treatments.

40
Figure 5. Hemoglobin content of the small and large lobes of the pectoralis major muscle in
adult tom turkeys. Data are LS Means ± SE. Different subscripts (a,b) indicate significant
differences (P < 0.05) between treatments. Control = turkey blood; Large = large lobe; Small =
small lobe.
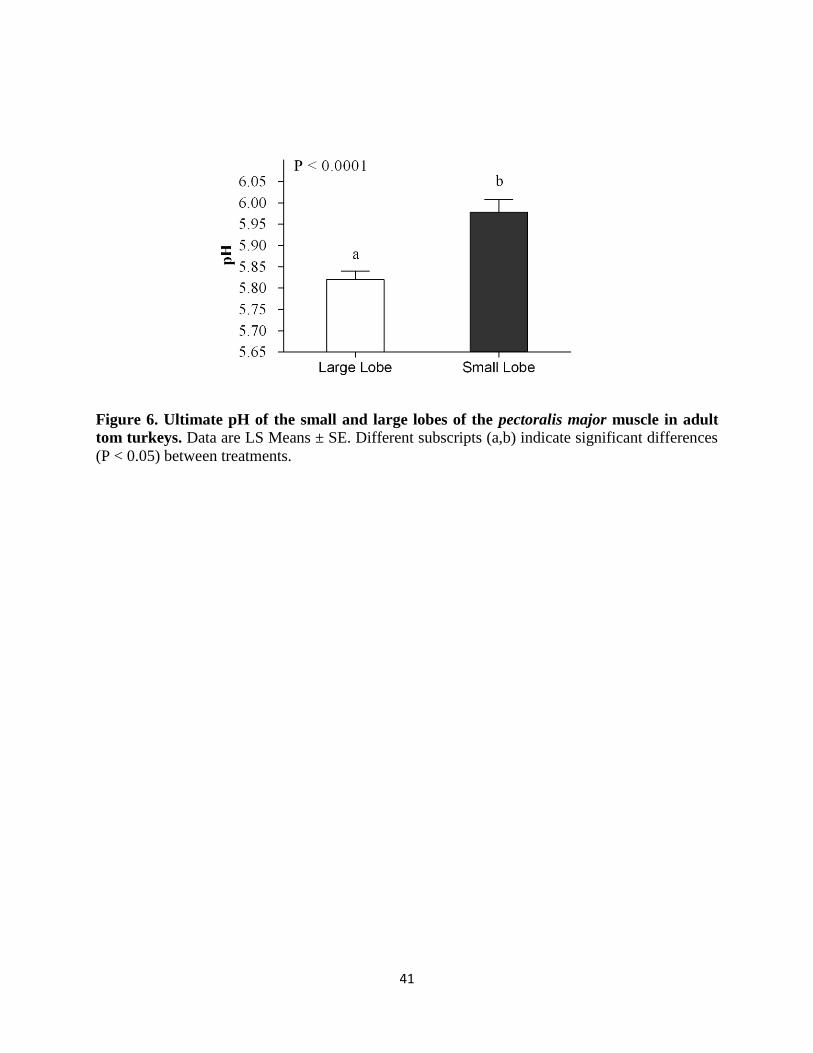
41
Figure 6. Ultimate pH of the small and large lobes of the pectoralis major muscle in adult
tom turkeys. Data are LS Means ± SE. Different subscripts (a,b) indicate significant differences
(P < 0.05) between treatments.
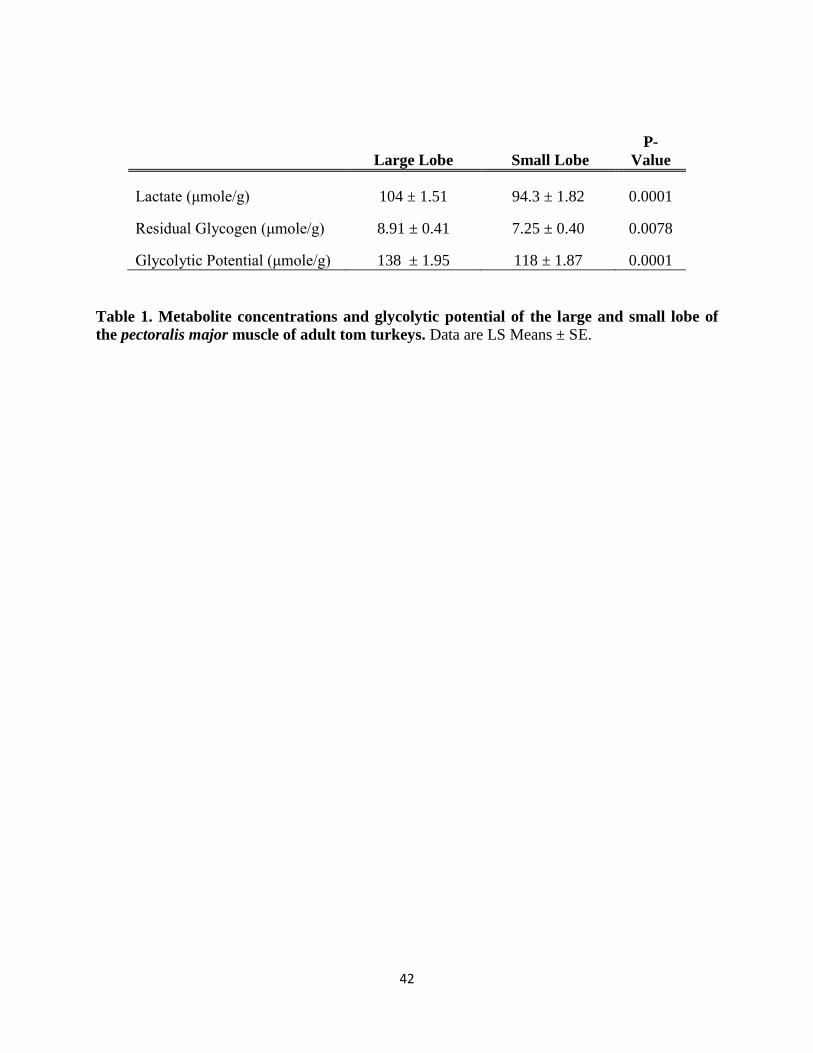
42
Large Lobe Small Lobe
P-
Value
Lactate (μmole/g) 104 ± 1.51 94.3 ± 1.82 0.0001
Residual Glycogen (μmole/g) 8.91 ± 0.41 7.25 ± 0.40 0.0078
Glycolytic Potential (μmole/g) 138 ± 1.95 118 ± 1.87 0.0001
Table 1. Metabolite concentrations and glycolytic potential of the large and small lobe of
the pectoralis major muscle of adult tom turkeys. Data are LS Means ± SE.

43
Figure 7. Lactate dehydrogenase content (LDH) of the large and small lobes of the
pectoralis major muscle in adult tom turkeys. Data are LS Means ± SE. Different subscripts
(a,b) indicate significant differences (P < 0.05) between treatments. Control = pooled mouse led
muscle; Large = large lobe; Small = small lobe.
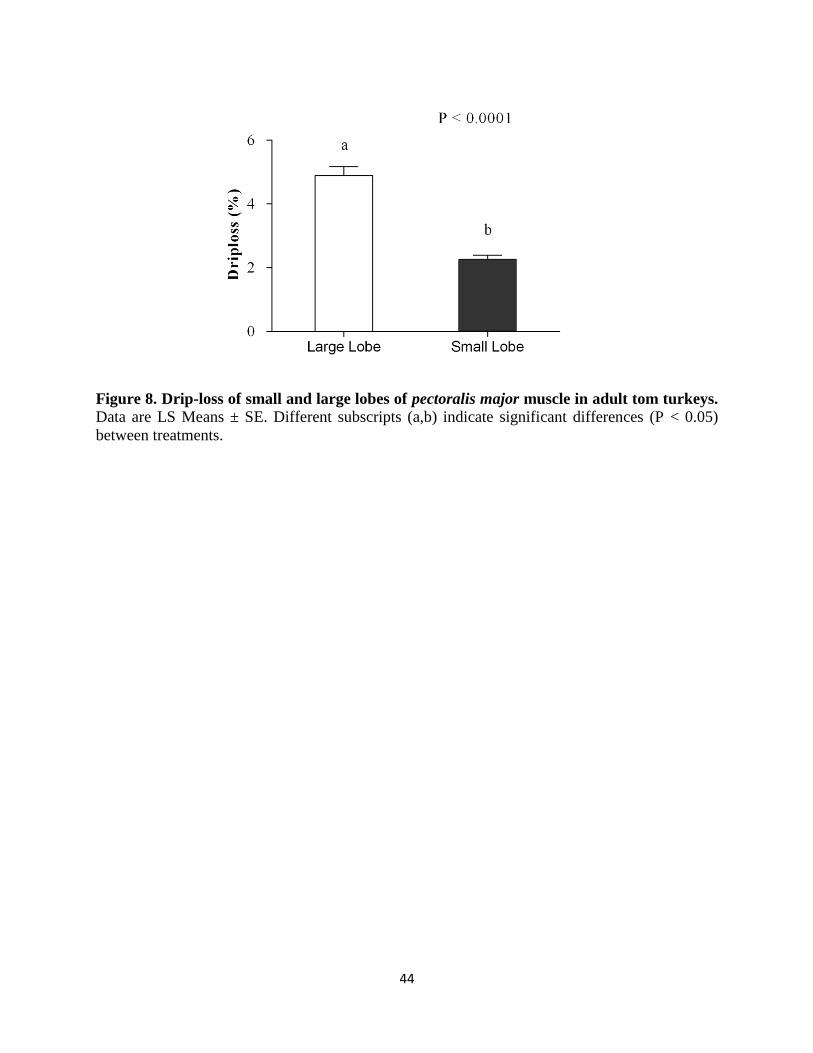
44
Figure 8. Drip-loss of small and large lobes of pectoralis major muscle in adult tom turkeys.
Data are LS Means ± SE. Different subscripts (a,b) indicate significant differences (P < 0.05)
between treatments.

45
Figure 9. Soluble and total protein concentration of the large and small lobe of the
pectoralis major muscle in adult tom turkeys. (A) Soluble protein concentration of the large
and small lobe. (B) Total protein concentration of the large and small lobe. Data are LS Means ±
SE. Different subscripts (a,b) indicate significant differences (P < 0.05) between treatments.

46
Figure 10. Sarcomere length of the large and small lobes of the pectoralis major muscle in
adult tom turkeys. Data are LS Means ± SE. Different subscripts (a,b) indicate significant
differences (P < 0.05) between treatments.

47
Figure 11. Lightness (L*) color values and variability for the large and small lobes and of
the pectoralis major muscle of adult tom turkeys shackled first and last from a transport
truck. (A) Large and small lobe lightness color values. (B) Standard deviation as an expression
of variability of L* lobe color values. (C) Lightness color values of first and last shackled
treatment groups. (D) Standard deviation as an expression of variability of L* color values for
first and last shackled treatment groups. Data are LS Means ± SE. Different subscripts (a, b)
indicate significant differences (P < 0.05) between treatments.

48
Figure 12. Redness (a*) color values and variability for the large and small lobes and of the
pectoralis major muscle of adult tom turkeys shackled first and last from a transport truck.
(A) Large and small lobe lightness color values. (B) Standard deviation as an expression of
variability of a* lobe color values. (C) Redness color values of first and last shackled treatment
groups. (D) Standard deviation as an expression of variability of a* color values for first and last
shackled treatment groups. Data are LS Means ± SE. Different subscripts (a, b) indicate
significant differences (P < 0.05) between treatments.

49
Figure 13. Hemoglobin content of the small lobe of the pectoralis major muscle in adult tom
turkeys sampled first and last from a transport truck. Data are LS Means ± SE. Different
subscripts (a,b) indicate significant differences (P < 0.05) between treatments. Control = turkey
blood; First = small lobe from the first shackled treatment group; Last = small lobe from the last
shackled treatment group.

50
Single-Toned Two-Toned Replication
First 80% 20% Truck 1
Last 65% 35% Truck 1
First 75% 25% Truck 2
Last 55% 45% Truck 2
Table 2. Frequency of single-toned and two-toned pectoralis major muscles in tom turkeys
sampled first and last from a transport truck.
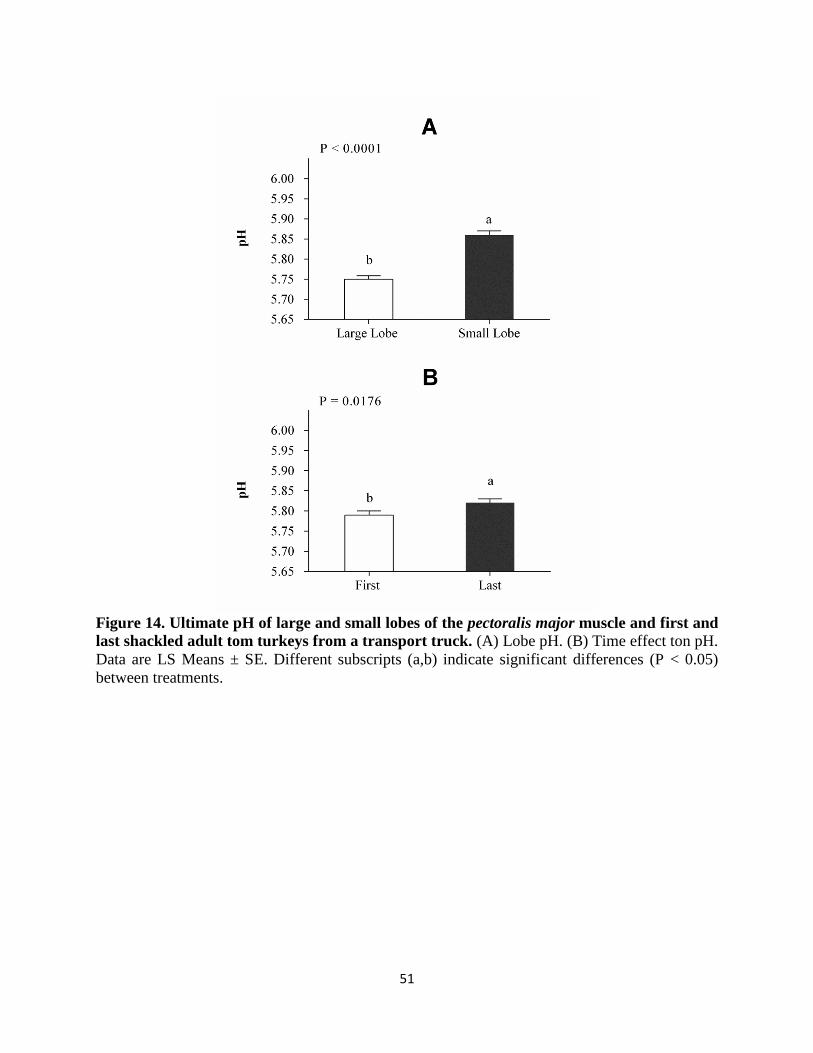
51
Figure 14. Ultimate pH of large and small lobes of the pectoralis major muscle and first and
last shackled adult tom turkeys from a transport truck. (A) Lobe pH. (B) Time effect ton pH.
Data are LS Means ± SE. Different subscripts (a,b) indicate significant differences (P < 0.05)
between treatments.

52
Figure 15. Metabolite concentrations and glycolytic potential of the large and small lobe of
the pectoralis major muscle and first and last shackled adult tom turkeys from a transport
truck. (A) Lobe lactate content. (B) Time effect on lactate content. (C) Lobe glycogen content.
(D) Time effect on residual glycogen content. (E) Lobe glycolytic potential. (F) Time effect on
glycolytic potential. Data are LS Means ± SE. Different subscripts (a,b) indicate significant
differences (P < 0.05) between treatments.

53
Figure 16. Effect of stun to stick time on body temperature of adult tom turkeys. Data are
LS Means ± SE. Different subscripts (a,b) indicate significant differences (P < 0.05) between
treatments

54
References
Alvarado, C., Richards, M., O’Keefe, S., & Wang, H. (2007). The effect of blood removal on
oxidation and shelf life of broiler breast meat. Poultry science, 86(1), 156-161.
American Meat Science Association (2012). Meat Color Measurement Guidelines.
Antonelli, A., Cocchi, M., Fava, P., Foca, G., Franchini, G. C., Manzini, D., & Ulrici, A. (2004).
Automated evaluation of food colour by means of multivariate image analysis coupled to
a wavelet-based classification algorithm. Analytica Chimica Acta, 515(1), 3-13.
Bendall, J. (1973). Postmortem changes in muscle. The structure and function of muscle, 2(Part
2), 244-309.
Bergmeyer, H. U. 1974. Methods of enzymatic analysis. Academic Press, New York.
Bouton, P., HARRIS, P. t., & Shorthose, W. (1971). Effect of ultimate pH upon the water‐holding capacity and tenderness of mutton. Journal of food science, 36(3), 435-439.
Choe, J., Choi, Y., Lee, S., Shin, H., Ryu, Y., Hong, K., & Kim, B. (2008). The relation between
glycogen, lactate content and muscle fiber type composition, and their influence on
postmortem glycolytic rate and pork quality. Meat Science, 80(2), 355-362.
Dransfield, E., & Sosnicki, A. (1999). Relationship between muscle growth and poultry meat
quality. Poultry Science, 78(5), 743-746.
El Rammouz, R., Babile, R., & Fernandez, X. (2004). Effect of ultimate pH on the
physicochemical and biochemical characteristics of turkey breast muscle showing normal
rate of postmortem pH fall. Poultry science, 83(10), 1750-1757.
England, E. M., Matarneh, S. K., Scheffler, T. L., Wachet, C., & Gerrard, D. E. (2014). pH
inactivation of phosphofructokinase arrests postmortem glycolysis. Meat science, 98(4),
850-857.
Hammelman, J., Bowker, B., Grant, A., Forrest, J., Schinckel, A., & Gerrard, D. (2003). Early
postmortem electrical stimulation simulates PSE pork development. Meat science, 63(1),
69-77.
Hunt, M., & Hedrick, H. (1977). Profile of fiber types and related properties of five bovine
muscles. Journal of Food Science, 42(2), 513-517.
Joo, S., Kauffman, R., Kim, B., & Park, G. (1999). The relationship of sarcoplasmic and
myofibrillar protein solubility to colour and water-holding capacity in porcine
longissimus muscle. Meat science, 52(3), 291-297.
Kang, S., East, A., & Trujillo, F. (2008). Colour vision system evaluation of bicolour fruit: A
case study with ‘B74’mango. Postharvest Biology and Technology, 49(1), 77-85.
Kranen, R., Van Kuppevelt, T., Goedhart, H., Veerkamp, C., Lambooy, E., & Veerkamp, J.
(1999). Hemoglobin and myoglobin content in muscles of broiler chickens. Poultry
science, 78(3), 467-476.
Mancini, R., & Hunt, M. (2005). Current research in meat color. Meat science, 71(1), 100-121.
Mitsumoto, M., O’Grady, M. N., Kerry, J. P., & Buckley, D. J. (2005). Addition of tea catechins
and vitamin C on sensory evaluation, colour and lipid stability during chilled storage in
cooked or raw beef and chicken patties. Meat Science, 69(4), 773-779.
Monin, G., and P. Sellier. 1985. Pork of low technological quality with a normal rate of muscle
pH fall in the immediate post-mortem period: the case of the Hampshire breed. Meat Sci.
13: 49-63.
Ozawa, S., Mitsuhashi, T., Mitsumoto, M., Matsumoto, S., Itoh, N., Itagaki, K., . . . Dohgo, T.
(2000). The characteristics of muscle fiber types of longissimus thoracis muscle and their
55
influences on the quantity and quality of meat from Japanese Black steers. Meat Science,
54(1), 65-70.
Peter, J. B., Barnard, R. J., Edgerton, V. R., Gillespie, C. A., & Stempel, K. E. (1972). Metabolic
profiles of three fiber types of skeletal muscle in guinea pigs and rabbits. Biochemistry,
11(14), 2627-2633.
Pikul, J., Niewiarowicz, A., & Kupijaj, H. (1986). The cytochrome c content of various poultry
meats. Journal of the Science of Food and Agriculture, 37(12), 1236-1240.
Qiao, M., Fletcher, D., Smith, D., & Northcutt, J. (2001). The effect of broiler breast meat color
on pH, moisture, water-holding capacity, and emulsification capacity. Poultry Science,
80(5), 676-680.
Ramírez, R., & Cava, R. (2007). The crossbreeding of different Duroc lines with the Iberian pig
affects colour and oxidative stability of meat during storage. Meat science, 77(3), 339-
347.
Rathgeber, B., Boles, J., & Shand, P. (1999). Rapid postmortem pH decline and delayed chilling
reduce quality of turkey breast meat. Poultry science, 78(3), 477-484.
Ruszon, M., (1997). RGB to CIELAB from c code by Yossi Rubner.
Schwerzmann, K., Hoppeler, H., Kayar, S. R., & Weibel, E. R. (1989). Oxidative capacity of
muscle and mitochondria: correlation of physiological, biochemical, and morphometric
characteristics. Proceedings of the National Academy of Sciences, 86(5), 1583-1587.
Seideman, S., Cross, H., Smith, G., & Durland, P. (1984). Factors associated with fresh meat
color: a review. Journal of Food Quality, 6(3), 211-237.
Sosnicki, A., & Wilson, B. (1991). Pathology of turkey skeletal muscle: implications for the
poultry industry. Food structure (USA).
Swatland, H. (2008). How pH causes paleness or darkness in chicken breast meat. Meat Science,
80(2), 396-400.
United States Department of Agriculture National Agriculture and Statistics Service. (2013).
Poultry Production and Value 2013 Summary.
Warren, C. M., Krzesinski, P. R., & Greaser, M. L. (2003). Vertical agarose gel electrophoresis
and electroblotting of high‐molecular‐weight proteins. Electrophoresis, 24(11), 1695-
1702.
Weaver, A., Bowker, B., & Gerrard, D. (2008). Sarcomere length influences postmortem
proteolysis of excised bovine semitendinosus muscle. Journal of animal science, 86(8),
1925-1932.
Wiskus, K., Addis, P., & Ma, R. T. (1976). Distribution of βR, αR and αW fibers in turkey
muscles. Poultry Science, 55(2), 562-572.

56
Chapter 3. Future Directions
A multitude of factors influence meat quality development. Loading, transport, wait time
prior to slaughter, and heat or cold exposure are all examples of antemortem stressors that can
affect quality attributes. Furthermore, temperature extremes and time exposures peri- and
postmortem are well documented to have the same effect. The experiments presented here offer
great insight into the inherent properties of the two lobes of the turkey pectoralis major.
Although it is not well understood, the time effect study demonstrated how color is developing
early postmortem. Despite this, there are still missing pieces to the puzzle. An understanding of
how the inherent lobe differences affect functionality as a cooked turkey deli roll is essential. To
add to this, knowing how antemortem factors, such as bird location on the truck, affect
postmortem color development is key. Lastly, mapping of postmortem metabolism in a single
bird at various processing points could provide useful information about how the muscle is
converted to meat and what equipment or processes are the most detrimental to color and protein
functionality as quality parameters.
Initially, a follow up study should be conducted where the specific functional differences
of the two lobes are tested in a cooked turkey deli roll. For instance, a sample size of
approximately twenty single-toned and two-toned breasts should be collected immediately
following de-bone. The two-toned breasts should be separated into large and small lobes along
the membrane running medial through the muscle. Since the single-toned breasts should exhibit
more consistent and desirable quality, they would serve as the control. With no visible color
variation in each individual single-toned breast, the large and small lobes would remain
unseparated. Following this, both the large and small lobe of the two-toned group would be
processed independently to create a formed deli roll product.

57
A determination of percent cook-loss would provide information about additional
proteins that are being denatured during the cook-step, attributing to reduce moisture retention
and perhaps color inconsistency. Despite separating the two lobes to make a more consistent
product, each deli roll could be sliced so that L* and a* color measurements could be determined
using imaging software. This would aid in understanding cooked meat color development.
A second study could focus on two-factors: bird location on the truck and postmortem
metabolic events. For instance, a transport truck could be divided into eight quadrants as
represented by Figure 1. Two birds from each quadrant would be wing-banded per truck,
sampling five trucks. Five trucks would be sampled from these locations in the summer, fall,
and winter seasons. By doing this, season could serve as a block in the statistical model. If there
Rear Front
Figure 1. Sampling method for second study to test the effect of bird location during
transport on meat quality.
is a major block effect, then antemortem temperature extremes play a role in meat quality and
postmortem metabolic events. After wing-banding, these birds would be followed through the
processing facility to de-feathering. Afterward, the right pectoralis major would be removed,
allowed to bloom for ten minutes, and photographed. Two samples from each lobe would be
obtained for driploss, metabolite, and pH determination. After removing the right pectoralis
muscle, birds would be re-shackled until post-chill. At that time, carcasses would be removed
A
A
E
B
F
C
G
D
H

58
from the processing line and the left pectoralis would be removed. Then, it would be
photographed and sampled as previously described. Using the photographs, the breasts could be
categorized as single-toned or two-toned. With these data, it could be determined whether the
bird’s location on the truck during transport is a stress factor contributing to the two-toning color
phenomenon. With the metabolite data, a better understanding of what is happen in the turkey
muscle during postmortem events would provide insight on how the muscle is functioning.
Antemortem, perimortem, and postmortem factors are complex and impact product color
and quality. To aid in production of more consistent and quality meat products, more information
concerning how meat color and protein functionality are affected by these factors should be
created.

59
Appendix A
if nargin == 1
B = double(R(:,:,3));
G = double(R(:,:,2));
R = double(R(:,:,1));
end
if max(max(R)) > 1.0 || max(max(G)) > 1.0 || max(max(B)) > 1.0
R = double(R) / 255;
G = double(G) / 255;
B = double(B) / 255;
end
% Set a threshold
T = 0.008856;
[M, N] = size(R);
s = M * N;
RGB = [reshape(R,1,s); reshape(G,1,s); reshape(B,1,s)];
% RGB to XYZ
MAT = [0.412453 0.357580 0.180423;
0.212671 0.715160 0.072169;
0.019334 0.119193 0.950227];
XYZ = MAT * RGB;
% Normalize for D65 white point
X = XYZ(1,:) / 0.950456;
Y = XYZ(2,:);
Z = XYZ(3,:) / 1.088754;
XT = X > T;
YT = Y > T;
ZT = Z > T;
Y3 = Y.^(1/3);
fX = XT .* X.^(1/3) + (~XT) .* (7.787 .* X + 16/116);
fY = YT .* Y3 + (~YT) .* (7.787 .* Y + 16/116);
fZ = ZT .* Z.^(1/3) + (~ZT) .* (7.787 .* Z + 16/116);
L = reshape(YT .* (116 * Y3 - 16.0) + (~YT) .* (903.3 * Y), M, N);
a = reshape(500 * (fX - fY), M, N);
b = reshape(200 * (fY - fZ), M, N);
if nargout < 2
L = cat(3,L,a,b);
end
Figure 1. Software script converting red, green, blue (RGB) color values to CIELAB color
space.

60
function [xmean, xstd, xmin, xmax, xskew, xquan25, xquan75] = RunStats(x)
xmean = mean(x);
xstd = std(x);
xmin = min(x);
xmax = max(x);
xskew = skewness(x);
xquan25 = quantile(x,0.25);
xquan75 = quantile(x,0.75);
Figure 2. Software script producing statistical parameters for the raw color distribution.

61
clc; clear; close all
[X] = imread('select image.jpg');
[L,a,b] = RGB2Lab(X);
[m,n] = size(L);
Lv =reshape(L,[1,m*n]);
hist(Lv,100);
[Lvmean, Lvstd, Lvmin, Lvmax, Lvskew, Lvquan25, Lvquan75] = RunStats(Lv)
Lv_new=Lv(Lv<79.499 & Lv>60.446);
hist(Lv_new,100)
[Lvmean_trunc, Lvstd_trunc, Lvmin_trunc, Lvmax_trunc, Lvskew_trunc, Lvquan25_trunc,
Lvquan75_trunc] = RunStats(Lv_new)
[ma,na] = size(a);
av =reshape(a,[1,ma*na]);
hist(av,100);
[avmean, avstd, avmin, avmax, avskew, avquan25, avquan75] = RunStats(av)
av_new=av(av<24.6013 & av>5.8017);
hist(av_new,100)
[avmean_trunc, avstd_trunc, avmin_trunc, avmax_trunc, avskew_trunc, avquan25_trunc,
avquan75_trunc] = RunStats(av_new)
[mb,nb] = size(b);
bv =reshape(b,[1,mb*nb]);
hist(bv,100);
[bvmean, bvstd, bvmin, bvmax, bvskew, bvquan25, bvquan75] = RunStats(bv)
bv_new=bv(bv<35.6164 & bv>16.363);
hist(bv_new,100)
[bmean_trunc, bvstd_trunc, bvmin_trunc, bvmax_trunc, bvskew_trunc, bvquan25_trunc,
bvquan75_trunc] = RunStats(bv_new)
Figure 3. Software script truncating the original color distributions to eliminate values
representing background, outliers, and light scattering.

62