PECO Phase II PLAN.pdf - Pennsylvania Public Utility Commission
231
PECO PROGRAM YEARS 2013-2015 ACT 129 - PHASE II ENERGY EFFICIENCY AND CONSERVATION PLAN Submitted to: Pennsylvania Public Utility Commission Submitted by: November 1, 2012
Transcript of PECO Phase II PLAN.pdf - Pennsylvania Public Utility Commission

PECO PROGRAM YEARS 2013-2015 ACT 129 - PHASE II ENERGY EFFICIENCY AND CONSERVATION PLAN Submitted to: Pennsylvania Public Utility Commission Submitted by:
November 1, 2012
PECO PY 2013-2015 Act 129 - Phase II Energy Efficiency And Conservation Plan Page ii
Table of Contents
Introduction ............................................................................................................................. vii
1. Overview of Plan............................................................................................................... 1
1.1 Summary Description of Plan, Objectives, and Overall Strategy ................................................. 1 1.2 Summary Description of Process Used to Develop the Phase II Plan ......................................... 2 1.3 Summary Tables of Portfolio Savings Goals, Budget and Cost-Effectiveness ............................ 4 1.4 Summary of Program Implementation .......................................................................................... 10 1.5 Summary Description of PECO’s Strategy to Acquire 25% Savings Each Program Year ....... 11 1.6 Summary Descriptions of PECO’s Implementation Strategy to Manage EE&C Portfolios .... 11 1.7 Summary Description of PECO’s Data Management, Quality Assurance, and Evaluation
Processes ............................................................................................................................................. 12 1.8 Summary Description of Cost Recovery Mechanism................................................................... 13
2. Energy Efficiency Portfolio / Program Summary Tables and Charts ................... 14
2.1 Residential, Commercial/Industrial Small, Commercial/Industrial Large and Governmental/Educational/Non-Profit Portfolio Summaries .................................................... 14
2.2 Plan Data: Costs, Cost-Effectiveness and Savings by Program, Sector and Portfolio ............. 14 2.3 Budget and Parity Analysis ............................................................................................................. 14
3. Program Descriptions ..................................................................................................... 15
3.1 Discussion of Criteria and Process Used for Selection of Programs .......................................... 15 3.1.1 Portfolio Objectives and Metrics that Define Program Success .................................... 15 3.1.2 Process for Program Development ................................................................................... 15 3.1.3 How Energy Efficiency Measures Were Included in the Portfolio .............................. 17
3.1.3.1 Treatment of Measures in the Portfolio of Programs ................................................. 17 3.1.3.2 Identification of Measures ......................................................................................... 17 3.1.3.3 Qualitative Screen ..................................................................................................... 17 3.1.3.4 Economic Screen ........................................................................................................ 18
3.1.4 Comprehensiveness of Measures in Residential and Small Commercial Rate Classes ............................................................................................................................................... 18
3.2 Individual Program Descriptions ................................................................................................... 19 3.2.1 Residential Programs ......................................................................................................... 19
3.2.1.1 EE Program 1 — PECO Smart Appliance Recycling ......................................... 19 3.2.1.2 EE Program 2 — PECO Smart Home Rebates Program .................................... 25 3.2.1.3 EE Program 3 — PECO Smart House Call ........................................................ 37 3.2.1.4 EE Program 4 — PECO Smart Builder Rebates ................................................. 47 3.2.1.5 EE Program 5 — PECO Low-Income Energy Efficiency (LEEP) Program ....... 54 3.2.1.6 EE Program 6 — PECO Smart Energy Saver Program ..................................... 61 3.2.1.7 EE Program 7 — PECO Smart Usage Profile .................................................... 65
3.2.2 Commercial and Industrial Programs.............................................................................. 69 3.2.2.1 EE Program 8 — PECO Smart Equipment Incentives (C&I) ............................ 69 3.2.2.2 EE Program 9 — PECO Smart Business Solutions ............................................ 87 3.2.2.3 EE Program 10 — PECO Smart Multi-Family Solutions Program ................. 100 3.2.2.4 EE Program 11 — PECO Smart Construction Incentives ............................... 115 3.2.2.5 EE Program 12—PECO Smart Equipment Incentives (GINP) ....................... 131
PECO PY 2013-2015 Act 129 - Phase II Energy Efficiency And Conservation Plan Page iii
3.2.2.6 EE Program 13 —PECO Smart On-Site .......................................................... 147
4. Program Management and Implementation Strategies......................................... 155
4.1 Overview of PECO Management and Implementation Strategies ........................................... 155 4.1.1 Types of services offered by PECO and other parties ................................................. 155 4.1.2 Risk categories and risk mitigation strategies ............................................................... 155
4.1.2.1 Performance Risk ............................................................................................... 155 4.1.2.2 Technology Risk ................................................................................................. 156 4.1.2.3 Market Risk........................................................................................................ 156 4.1.2.4 Evaluation Risk .................................................................................................. 157
4.1.3 Human resource and contractor resource constraints ................................................. 157 4.1.4 Early warning systems to indicate progress towards goals and process for
adjustment ......................................................................................................................... 157 4.1.5 Implementation schedules with milestones .................................................................. 158
4.2 Executive Management Structure ................................................................................................. 158 4.2.1 PECO Structure for Addressing Portfolio Strategy ...................................................... 158 4.2.2 Approach for overseeing the performance of CSPs and other providers ................. 161 4.2.3 Basis for Administrative Budget ..................................................................................... 161
4.3 Conservation Service Providers (CSPs) ....................................................................................... 162 4.3.1 Selected CSPs ..................................................................................................................... 162 4.3.2 Describe the work and measures being performed by CSPs ...................................... 162 4.3.3 Describe any pending RFPs to be issued for additional CSPs .................................... 162
5. Reporting and Tracking Systems ............................................................................... 163
5.1 Reporting .......................................................................................................................................... 163 5.1.1 List of Reports ................................................................................................................... 163 5.1.2 Data Submissions .............................................................................................................. 164
5.2 Project Management Tracking Systems ....................................................................................... 164 5.2.1 Data Tracking System Overview .................................................................................... 164 5.2.2 Software Format, Data Exchange Format and Database Structure ............................ 165 5.2.3 Access for Commission and Statewide Plan Evaluator ............................................... 166
6. Quality Assurance and Evaluation, Measurement and Verification .................. 168
6.1 Quality Assurance/Quality Control .............................................................................................. 168 6.1.1 Overall Approach to Quality Assurance/Quality Control .......................................... 168 6.1.2 Procedures for Measure and Project Installation Verification, QA/QC and Savings
Documentation .................................................................................................................. 169 6.1.3 Process for Collecting and Addressing Participant, Contractor and Trade Ally
Feedback............................................................................................................................. 169 6.2 Market and Process Evaluations ................................................................................................... 170 6.3 Strategy for Coordinating with Statewide Evaluator ................................................................. 170
7. Cost Recovery Mechanism .......................................................................................... 171
7.1 Total Annual Revenues for Phase II ............................................................................................. 171 7.2 Description of Phase II Plan in Accordance with 66 Pa. C.S. § 1307 and 2806.1 ..................... 171 7.3 Data Tables ....................................................................................................................................... 172 7.4 Tariffs and Section 1307 Cost Recovery Mechanism for Phase II Plan .................................... 172
7.4.1 Tariffs .................................................................................................................................. 172 7.4.2 Cost Recovery Mechanism .............................................................................................. 172

PECO PY 2013-2015 Act 129 - Phase II Energy Efficiency And Conservation Plan Page iv
7.4.3 True-Up .............................................................................................................................. 173 7.5 Cost Recovery Mechanism ............................................................................................................. 173 7.6 Accounting for Phase II Costs verses Phase I Costs ................................................................... 173
8. Cost Effectiveness ......................................................................................................... 174
8.1 Description of Application of the TRC Analysis......................................................................... 174 8.1.1 Cost Effectiveness Analysis Approach .......................................................................... 174 8.1.2 Avoided Costs ................................................................................................................... 174
8.1.2.1 Energy Prices ..................................................................................................... 174 8.1.2.2 Capacity Prices .................................................................................................. 176 8.1.2.3 Transmission and Distribution ......................................................................... 176
8.2 Data Tables ....................................................................................................................................... 176
9. Plan Compliance Information and Other Key Issues ............................................ 177
9.1 Plan Compliance ............................................................................................................................. 177 9.1.1 Description of Plan ........................................................................................................... 177 9.1.2 Statement Delineating the EE&C Plan ........................................................................... 177 9.1.3 Low-Income requirements .............................................................................................. 177 9.1.4 Government/Non-Profit requirements .......................................................................... 177 9.1.5 Spending on experimental equipment or devices limited to two percent ................ 178 9.1.6 Competitively neutral to all distribution customers .................................................... 178
9.2 Other Key Issues .............................................................................................................................. 178 9.2.1 Describe how this EE&C Plan will lead to long-term, sustainable energy efficiency
savings in the EDC’s service territory and in Pennsylvania ....................................... 178 9.2.2 Describe how this EE&C Plan, and the EDC, will avoid possible overlaps between
programs offered in different Pennsylvania EDC service territories as well as possible programs offered in neighboring states ......................................................... 178
9.2.3 Describe how this EE&C Plan will leverage and utilize other financial resources, including funds from other public and private sector energy efficiency and solar energy programs ............................................................................................................... 178
9.2.4 Describe how the EDC will address consumer education for its programs ............. 178 9.2.5 Indicate how the EDC will provide a list of all eligible federal and state funding
programs available to ratepayers for energy efficiency and conservation ............... 179 9.2.6 Describe how the EDC will provide the public with information about the results
from the programs ............................................................................................................ 179
Appendix A. PECO Electricity Consumption Forecast ............................................. 180
Appendix B. CSP Contract(s) ......................................................................................... 181
Appendix C. Program by Program Savings and Costs for Each Program Year .... 182
C.1 Portfolio Summary of Lifetime Costs and Benefits .................................................................... 182 C.2 Summary of Portfolio Energy and Demand Savings ................................................................. 183 C.3 Summary of Portfolio Costs ........................................................................................................... 184 C.4 Program Summaries ....................................................................................................................... 185 C.5 Budget and Parity Analysis Summary ......................................................................................... 190 C.6 Program Cost Data Per Year .......................................................................................................... 190 C.7 TRC Benefits Table .......................................................................................................................... 193
PECO PY 2013-2015 Act 129 - Phase II Energy Efficiency And Conservation Plan Page v
Appendix D. Calculation Methods and Assumptions .............................................. 196
D.1 Total Resource Cost Test Calculation Methods .......................................................................... 196 D.2 Seasonal Avoided Costs for Electricity ........................................................................................ 199 D.3 Seasonal End-Use Load Shapes ..................................................................................................... 201 D.4 Measure Level Net To Gross (NTG) Factors Applied for Benefit-Cost Analysis ................... 204
Appendix E. Exhibits RAS ............................................................................................ 224
PECO PY 2013-2015 Act 129 - Phase II Energy Efficiency And Conservation Plan Page vi
List of Figures and Tables
Figures: Figure 1. Phase II Plan Development Process ....................................................................................................... 3Figure 2: PECO PY 2013-2015 Energy Efficiency Portfolio Structure ................................................................ 4Figure 3. Major Program Implementation Milestones ...................................................................................... 10Figure 4: Program Documentation and Measurement, Verification and Evaluation Framework .............. 12Figure 5: Process for Developing Energy Efficiency Programs ........................................................................ 16Figure 6. Implementation Schedule ................................................................................................................... 158Figure 7. PECO Proposed EE&C Organization ................................................................................................ 160Figure 8. Calculation of 2006 Annual Revenue ................................................................................................ 171 Tables: Table 1. PECO EE Program Summary – Phase II ................................................................................................ 5Table 2. Portfolio Summary of Lifetime Costs and Benefits PY 2013-2015 ....................................................... 7Table 3. Summary of Portfolio Cumulative Gross Energy and Demand Savings ........................................... 8Table 4. Summary of Portfolio Costs ..................................................................................................................... 9Table 5: Administrative Costs 2013-2015 ........................................................................................................... 161Table 6: Selected CSPs for Phase II Implementation ........................................................................................ 162Table 7: Forthcoming RFPs for Phase II Implementation Services ................................................................ 162Table 8: Periods for Energy and Coincident Peak Demand Savings ............................................................. 175 Table C-1. Portfolio Summary of Lifetime Costs and Benefits (PY 2013-2015) ............................................ 182Table C-2. Summary of Portfolio Gross Energy and Demand Savings ......................................................... 183Table C-3. Summary of Portfolio Costs (PY 2013-2015) .................................................................................. 184Table C-4. Program Summaries .......................................................................................................................... 185Table C-5. Budget and Parity Analysis Summary (2013-2015) ....................................................................... 190Table C-6A. Portfolio-Specific Assignment of EE&C Costs (PY 2013-2015) ................................................. 190Table C-6B. Allocation of Common Costs Applicable to Customer Sector (PY 2013-2015) ....................... 192 Table C-6C. Summary of Portfolio EE&C Costs (PY 2013-2015).................................................................... 192 Table C-7. TRC Benefits Table ............................................................................................................................. 193Table D-1. Avoided Costs for Electricity ($/kWh) ............................................................................................ 199Table D-2. Weighted Average Avoided Costs for Transmission and Distribution ($/kWh) ...................... 200Table D-3. End-Use Load Shapes ....................................................................................................................... 201Table D-4. NTG Factors ....................................................................................................................................... 204
PECO PY 2013-2015 Act 129 - Phase II Energy Efficiency And Conservation Plan Page vii
Introduction
PECO Energy Company, an Exelon company, provides electric service to a mix of residential, commercial and diversified industrial customers in Philadelphia and electric and natural gas services to the surrounding metropolitan region. PECO strives to provide reliable utility service for customers and ensure high levels of customer satisfaction. This three year Energy Efficiency and Conservation Phase II Plan meets the requirements set by the Pennsylvania Public Utility Commission (PUC or Commission) in its Act 129 Phase II Implementation Order.1
This order requires that PECO file a Phase II Plan no later than November 1, 2012. PECO's Phase II Plan builds on the experience gained through implementation of its Phase I Plan and includes several new programs, updated savings and costs, and refined program delivery strategies to meet Act 129 goals, provide comprehensive program opportunities for customers, and advance the transformation of the market in PECO’s service territory toward a more energy efficient future.
The savings detailed in this Plan take into account the latest federal energy efficiency standards, such as the Energy Independence Act of 2009, and PECO’s estimates of the most recent updates to the Pennsylvania Technical Reference Manual. Given the successful results of PECO’s Phase I Plan to date, combined with the enhancements and new program offerings presented in this Plan, PECO believes it has an excellent portfolio of proven programs that will help its customers save money on their energy bills. PECO looks forward to Commission approval of this Plan.
1 PUC Implementation Order, August 2, 2012
PECO PY 2013-2015 Act 129 - Phase II Energy Efficiency And Conservation Plan Page 1
1. Overview of Plan
1.1 Summary Description of Plan, Objectives, and Overall Strategy This document presents PECO’s Plan to achieve the required energy efficiency savings targets for the Phase II period, as set forth by the Commission. The Phase II time period covers three program years, starting June 1, 2013 and ending on May 31, 2016.
» PY 2013: June 1, 2013-May 31, 2014 » PY 2014: June 1, 2014- May 31, 2015 » PY 2015: June 1, 2015-May, 31, 2016
The savings achieved under this Plan meet the energy savings goal specified by the PUC2
per the enabling legislation of Act 129. Specifically, between June 1, 2013 through May 31, 2016, PECO shall achieve a 2.9% energy savings relative to expected load for June 1, 2009 and May 31, 2010.
This Plan provides a detailed discussion of PECO’s intentions for meeting the Phase II savings target required in Act 129. The layout and organization of this Plan are in accordance with the Phase II Plan template as specified by the PUC.3
As demonstrated by the excellent results delivered in Phase I, these programs will enable our customers in all customer classes to continue to reduce their energy usage and decrease their environmental impact. PECO’s primary objectives for the Phase II period are to:
» Meet energy savings goals while laying the groundwork for long term market transformation. » Offer a diverse group of programs that provide opportunities for participation for all customers. » Deliver program savings cost effectively by striving to achieve comprehensive cost-effective
savings opportunities. » Continue to provide customers with service levels on all efficiency programs (residential and
business) for electricity savings opportunities. » Transform the market for efficient technologies and highly qualified efficiency-oriented trade
allies (such as electricians, HVAC contractors, builders, architects and engineers). » Inform and educate customers on how to use energy more efficiently.
This Plan presents detailed information on the Company’s proposed approach, energy efficiency measures, and incentive levels. PECO has made significant efforts to build into this Plan a robust forecast of future participation, anticipating changes from codes and standards and other market forces that will impact program delivery. However, PECO anticipates the need to periodically update portions of this Plan to ensure excellence and cost-effectiveness in program design and delivery. The Company will update the Commission regarding any significant revisions to the Plan over time and seek Commission’s approval as appropriate.
2 Implementation Order, August 2, 2012. 3 Implementation of Act 129 of 2008 – Phase II Energy Efficiency and Conservation Plan Template Docket No. M-2012-2289411. September 26, 2012.
PECO PY 2013-2015 Act 129 - Phase II Energy Efficiency And Conservation Plan Page 2
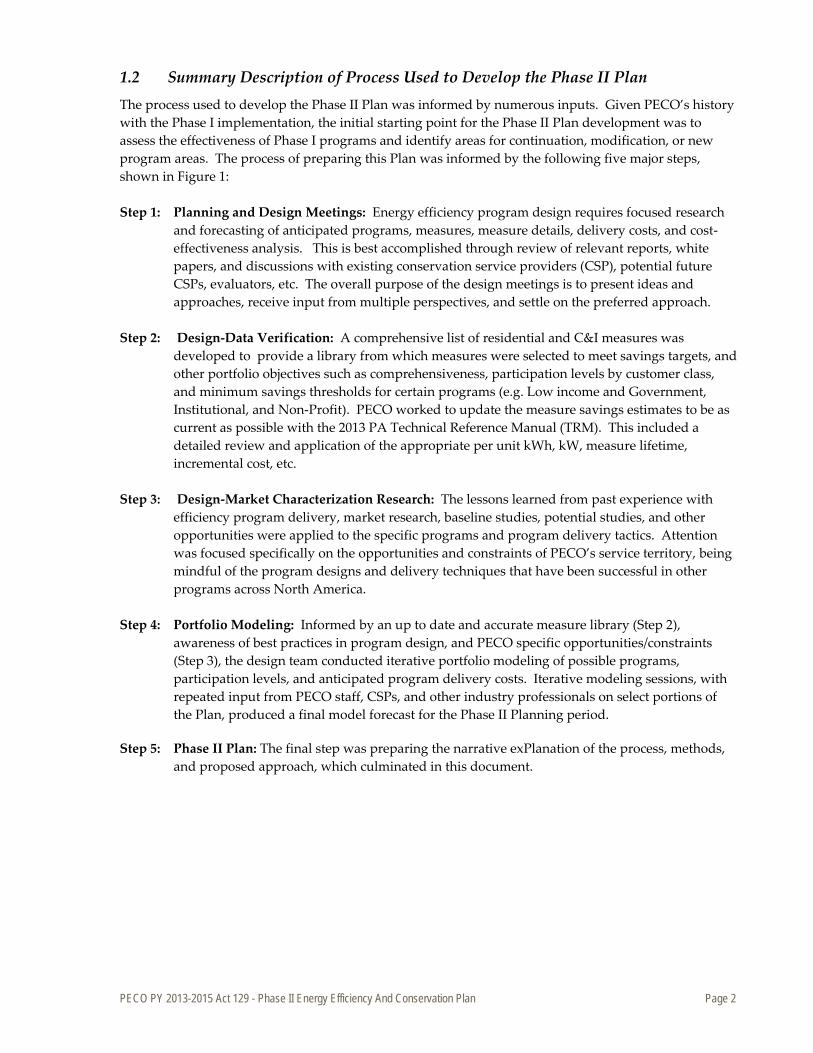
1.2 Summary Description of Process Used to Develop the Phase II Plan The process used to develop the Phase II Plan was informed by numerous inputs. Given PECO’s history with the Phase I implementation, the initial starting point for the Phase II Plan development was to assess the effectiveness of Phase I programs and identify areas for continuation, modification, or new program areas. The process of preparing this Plan was informed by the following five major steps, shown in Figure 1: Step 1: Planning and Design Meetings: Energy efficiency program design requires focused research
and forecasting of anticipated programs, measures, measure details, delivery costs, and cost-effectiveness analysis. This is best accomplished through review of relevant reports, white papers, and discussions with existing conservation service providers (CSP), potential future CSPs, evaluators, etc. The overall purpose of the design meetings is to present ideas and approaches, receive input from multiple perspectives, and settle on the preferred approach.
Step 2: Design-Data Verification: A comprehensive list of residential and C&I measures was
developed to provide a library from which measures were selected to meet savings targets, and other portfolio objectives such as comprehensiveness, participation levels by customer class, and minimum savings thresholds for certain programs (e.g. Low income and Government, Institutional, and Non-Profit). PECO worked to update the measure savings estimates to be as current as possible with the 2013 PA Technical Reference Manual (TRM). This included a detailed review and application of the appropriate per unit kWh, kW, measure lifetime, incremental cost, etc.
Step 3: Design-Market Characterization Research: The lessons learned from past experience with
efficiency program delivery, market research, baseline studies, potential studies, and other opportunities were applied to the specific programs and program delivery tactics. Attention was focused specifically on the opportunities and constraints of PECO’s service territory, being mindful of the program designs and delivery techniques that have been successful in other programs across North America.
Step 4: Portfolio Modeling: Informed by an up to date and accurate measure library (Step 2),
awareness of best practices in program design, and PECO specific opportunities/constraints (Step 3), the design team conducted iterative portfolio modeling of possible programs, participation levels, and anticipated program delivery costs. Iterative modeling sessions, with repeated input from PECO staff, CSPs, and other industry professionals on select portions of the Plan, produced a final model forecast for the Phase II Planning period.
Step 5: Phase II Plan: The final step was preparing the narrative exPlanation of the process, methods, and proposed approach, which culminated in this document.
PECO PY 2013-2015 Act 129 - Phase II Energy Efficiency And Conservation Plan Page 3
Figure 1. Phase II Plan Development Process
This process was facilitated by referring to reference materials and targeted research efforts completed during the Phase I period. Examples of referenced materials and activities undertaken include:
» Annual reports filed with the Commission on Phase I
» Energy efficiency portfolio benchmarking research program delivery achieved in other states, as well as a review of best practice design and delivery approaches
» Statewide evaluator reports: a) Baseline Studies4; b) Potential Study5
» Updated savings and other inputs per the 2013 TRM Order
» Other updated information (e.g., avoided costs, discount rates, load shapes, cost escalation rates, line loss factors, internal labor rates, etc.)
» Planning meetings with energy efficiency industry professionals to review and assess the reasonableness and likelihood for success of the proposed Plan, addressing topics such as: a) delivery approaches, b) eligibility; c) incentive levels; etc.
» Discussions with other PA utilities and members of our stakeholder group to review strategies and areas of possible coordination
4 Pennsylvania Statewide Commercial and Industrial End Use Saturation Study, Nexant, 2012; Pennsylvania Statewide Residential End Use and Saturation Study. GDS Associates, Nexant, Mondre Energy. 2012. 5 Electric Energy Efficiency Potential for Pennsylvania. GDS Associates and Nexant, Mondre Energy. 2012
PECO PY 2013-2015 Act 129 - Phase II Energy Efficiency And Conservation Plan Page 4
» Customization of a comprehensive benefit-cost screening tool, with specific adjustments to the required calculation6
» Iterative program design Planning meetings to ensure a combination of programs for all customer classes, including comprehensive measures, with attention to cost-effectiveness thresholds
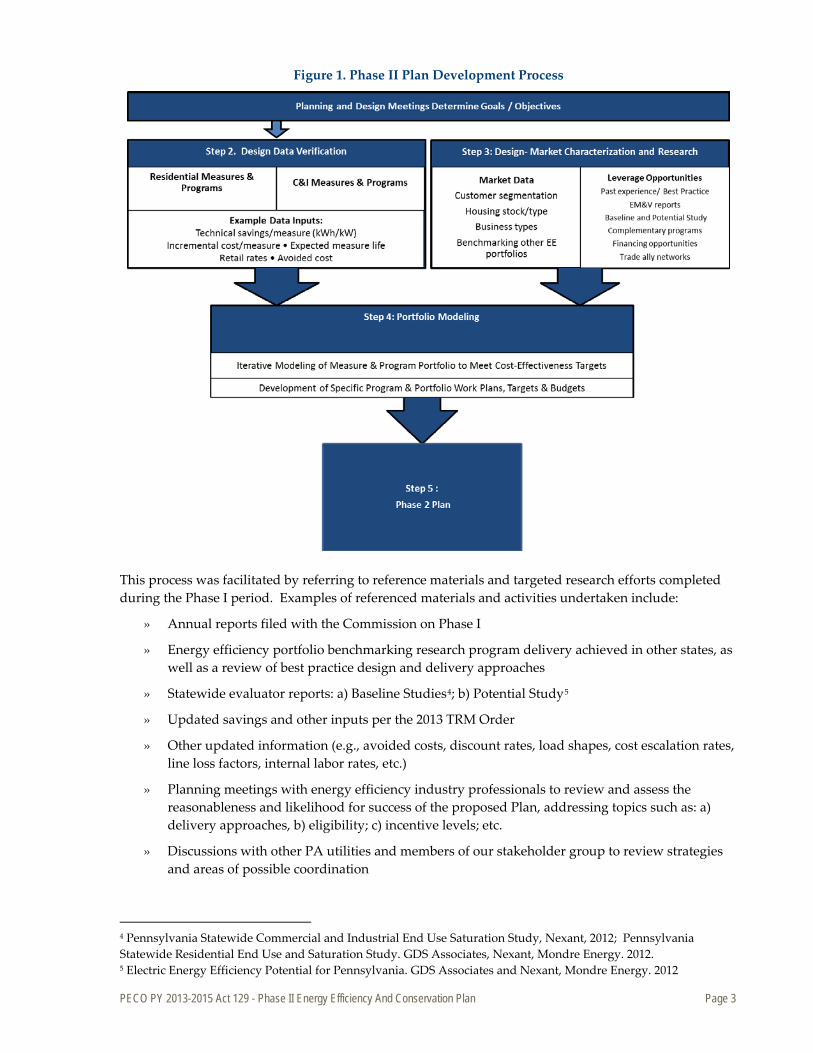
1.3 Summary Tables of Portfolio Savings Goals, Budget and Cost-Effectiveness PECO will invest up to a total of approximately $256 million in energy efficiency programs over a three year program period for PY 2013, PY 2014, and PY 2015. The Company Plans to achieve 105% of the statutory electric savings goal, using 100% of the total allowable electric spending cap. Additionally, consistent with Phase II requirements, PECO has developed this Plan to meet the required government, institutional, and non-profit sector (GINP) savings requirement of at least 10% of total portfolio savings and meet the requirement of 4.5% of portfolio savings coming from the low income sector. Figure 2 presents the portfolio structure, which details the residential sector programs, commercial and industrial (C&I) programs, as well as common support service areas. Section 3.2 of this report provides a full description of each program.
Figure 2: PECO PY 2013-2015 Energy Efficiency Portfolio Structure
6 Pennsylvania PUC 2012 Total Resource Cost Test M-2012-2300653, August 30, 2012
PECO
Commercial Sector
PECO Smart Equipment
Incentives (C&I)
PECO Smart Business Solutions
PECO- Smart Construction
Incentives
PECO Multi-Family Solutions
PECO Smart Equipment
Incentives (GINP)
PECO Smart On-Site
Residential Sector
PECO Smart Appliance Recycling
PECO Smart Home Rebates
PECO Smart Builder Rebates
PECO Smart House Call
PECO Low Income Efficiency Program
(LEEP)
PECO Smart Energy Saver
PECO Smart User Profile
Cross-cutting Support
Customer Outreach
Online Energy Assessment
Awareness Campaign
Data Tracking
Website
Evaluation, Measurement &
Verification
Call Center
PECO PY 2013-2015 Act 129 - Phase II Energy Efficiency And Conservation Plan Page 5
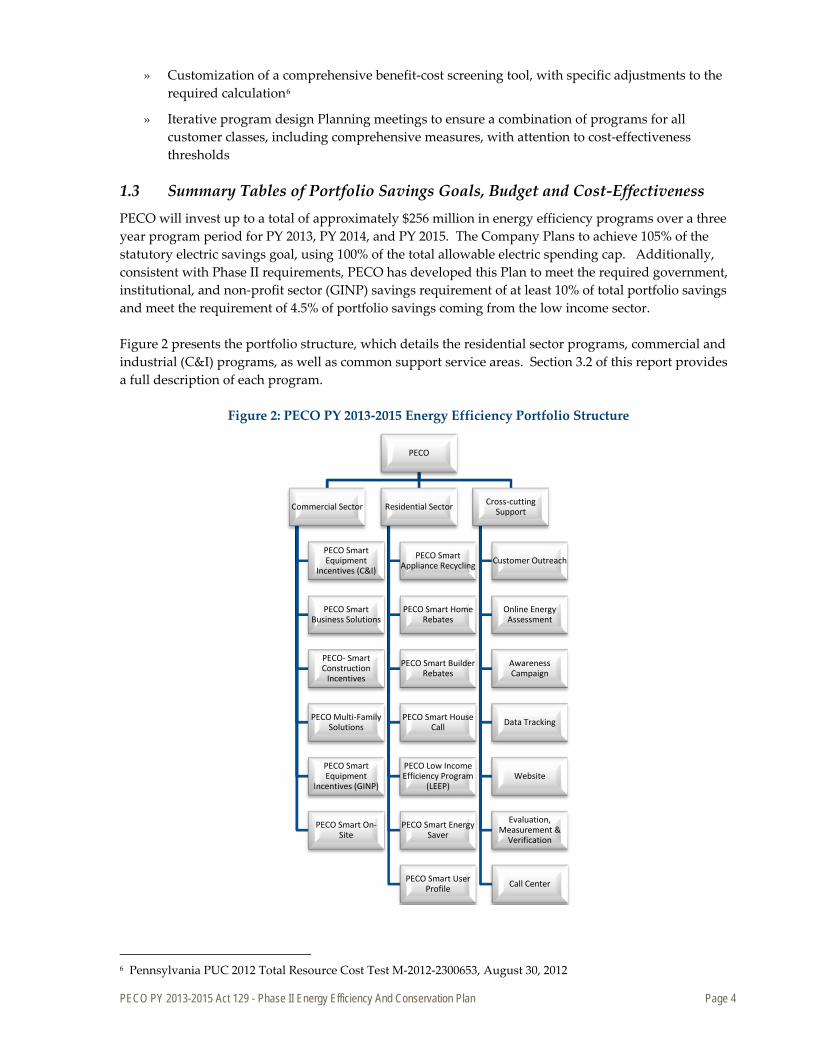
Table 1. PECO EE Program Summary – Phase II
Program
Gross Annual Energy Savings (MWh)
Budget (Million $)
Total Participants (Cumulative)
TRC Analysis
First Year Acquisition Costs per kWh
PY 2013 PY 2014 PY 2015 3-Year Total PY 2013 PY 2014 PY 2015
3-Year Total
Average Annual B/C Ratio
Incentive Costs
($/kWh)
Non-Incentive
Costs ($/kWh)
Total Costs
($/kWh) Residential 1. PECO Smart Appliance Recycling 13,628 13,628 13,628 40,885 $2.4 $2.4 $2.4 $7.2 $2.4 48,000 5.0 $0.059 $0.118 $0.177
2. PECO Smart Home Rebates 102,940 93,314 84,606 280,860 $17.5 $18.3 $17.7 $53.5 $17.8 7,096,465 1.3 $0.150 $0.040 $0.191
3. PECO Smart House Call 5,307 4,765 4,539 14,611 $5.2 $5.3 $5.5 $16.0 $5.3 18,413 0.67 $0.074 $1.021 $1.095
4. PECO Smart Builder Rebates 112 135 162 409 $0.5 $0.6 $0.6 $1.7 $0.6 273 0.20 $0.434 $3.749 $4.183
5. PECO Low Income Energy Efficiency (LEEP) 16,432 16,446 16,487 49,364 $7.8 $8.0 $8.1 $23.8 $7.9 33,094 1.5 $0.000 $0.483 $0.483
6.PECO Smart Energy Saver 958 958 958 2,873 $0.5 $0.5 $0.5 $1.6 $0.5 21,000 1.1 $0.000 $0.561 $0.561
7. PECO Smart Usage Profile 8,000 16,800 26,000 50,800 $0.6 $1.0 $1.4 $3.0 $1.0 210,000 1.9 $0.000 $0.059 $0.059
8. PECO Smart Multi-Family Solutions Program (Res)
3,274 2,793 2,793 8,861 $1.6 $1.7 $1.7 $5.0 $1.7 27,165 1.1 $0.000 $0.567 $0.567
Subtotal Phase Il Residential EE Programs
150,651 148,838 149,173 448,663 $36.3 $37.8 $37.9 $111.9 $37.3 7,454,410 1.2 $0.102 $0.182 $0.284
Phase I Bank Savings (Residential) 16,684 16,684 16,684 50,053 n/a n/a n/a n/a n/a n/a n/a n/a n/a n/a
Subtotal Phase Il Residential EE Programs + Phase I Bank Savings (Residential)
167,336 165,523 165,857 498,715 n/a n/a n/a n/a n/a n/a n/a n/a n/a n/a

PECO PY 2013-2015 Act 129 - Phase II Energy Efficiency And Conservation Plan Page 6
Program
Gross Annual Energy Savings (MWh)
Budget (Million $)
Total Participants (Cumulative)
TRC Analysis
First Year Acquisition Costs per kWh
PY 2013 PY 2014 PY 2015 3-Year Total PY 2013 PY 2014 PY 2015
3-Year Total
Average Annual B/C Ratio
Incentive Costs
($/kWh)
Non-Incentive
Costs ($/kWh)
Total Costs
($/kWh) Commercial and Industrial 9. PECO Smart Equipment Incentives (C&I)
90,274 90,576 90,019 270,870 $13.8 $14.0 $14.2 $42.1 $14.0 15,370 2.0 $0.087 $0.069 $0.155
10. PECO Smart Business Solutions 14,477 14,622 14,768 43,867 $2.7 $2.8 $2.9 $8.4 $2.8 673 1.5 $0.000 $0.192 $0.192
11. PECO Smart Multi- Family Solutions Program (C&I)
4,405 3,993 3,997 12,395 $1.6 $1.6 $1.7 $4.8 $1.6 5,402 1.0 $0.076 $0.315 $0.391
12. PECO Smart Construction Incentives 26,029 26,290 26,552 78,871 $4.0 $4.1 $4.2 $12.3 $4.1 3,778 1.6 $0.098 $0.057 $0.156
13. PECO Smart Equipment Incentives (GINP)
34,239 34,582 34,927 103,748 $8.0 $8.1 $8.3 $24.4 $8.1 6,145 1.9 $0.131 $0.104 $0.235
14. PECO Smart On-Site 45,001 45,001 45,001 135,002 $4.9 $5.0 $5.0 $14.9 $5.0 40 1.2 $0.095 $0.015 $0.110 Subtotal Phase Il Commercial & Industrial EE Programs
214,425 215,063 215,266 644,754 $35.1 $35.6 $36.1 $106.9 $35.6 31,408 1.5 $0.091 $0.109 $0.200
Phase I Bank Savings (Commercial) 13,651 13,651 13,651 40,952 n/a n/a n/a n/a n/a n/a n/a n/a n/a n/a
Subtotal Phase Il Commercial EE Programs + Phase I Bank Savings (Commercial)
228,076 228,714 228,916 685,706 n/a n/a n/a n/a n/a n/a n/a n/a n/a n/a
Common Costs n/a n/a n/a n/a $13.7 $11.8 $12.1 $37.6 $12.5 n/a (n/a) n/a n/a n/a
Grand Total – All Phase Il EE Programs 365,077 363,901 364,439 1,093,417 $85.0 $85.2 $86.2 $256.4 $85.5 7,485,819 1.4 $0.095 $0.139 $0.235
Grand Total – All Phase Il EE Programs + Phase I Bank Savings
395,412 394,236 394,774 1,184,422 $85.0 $85.2 $86.2 $256.4 $85.5 7,485,819 1.4 $0.095 $0.139 $0.235
*Energy savings are at meter
PECO PY 2013-2015 Act 129 - Phase II Energy Efficiency And Conservation Plan Page 7
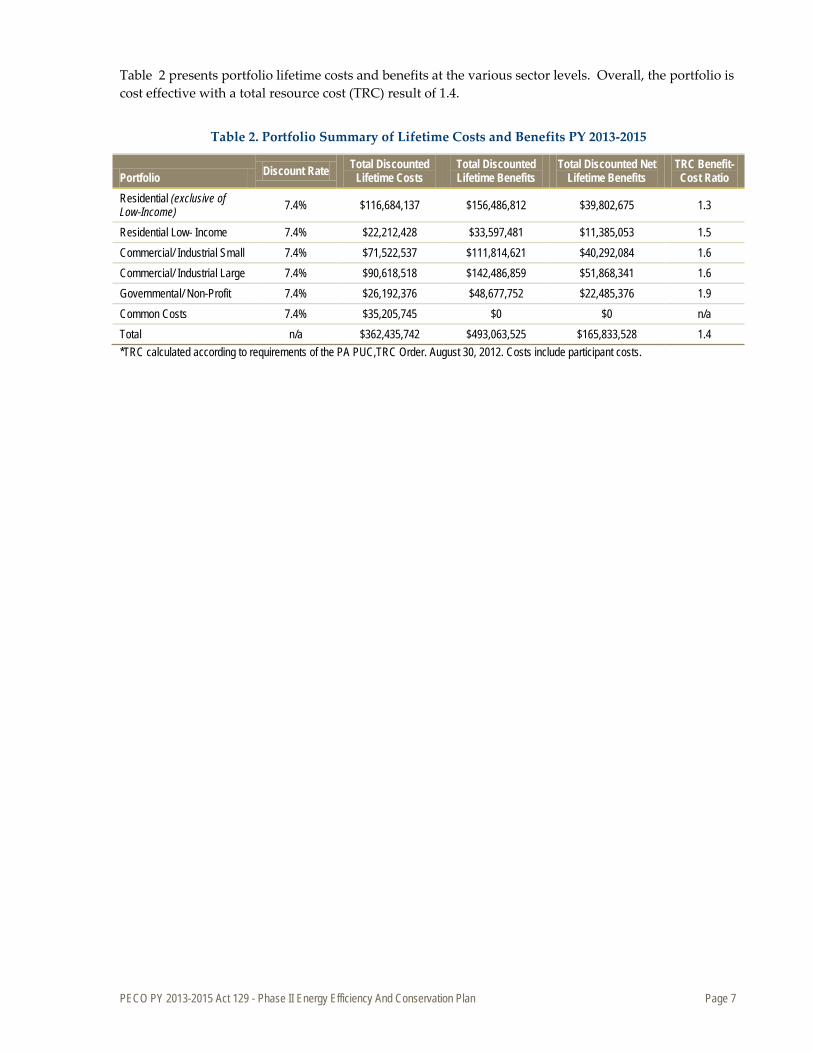
Table 2 presents portfolio lifetime costs and benefits at the various sector levels. Overall, the portfolio is cost effective with a total resource cost (TRC) result of 1.4.
Table 2. Portfolio Summary of Lifetime Costs and Benefits PY 2013-2015
Portfolio Discount Rate Total Discounted Lifetime Costs
Total Discounted Lifetime Benefits
Total Discounted Net Lifetime Benefits
TRC Benefit-Cost Ratio
Residential (exclusive of Low-Income) 7.4% $116,684,137 $156,486,812 $39,802,675 1.3
Residential Low- Income 7.4% $22,212,428 $33,597,481 $11,385,053 1.5 Commercial/ Industrial Small 7.4% $71,522,537 $111,814,621 $40,292,084 1.6 Commercial/ Industrial Large 7.4% $90,618,518 $142,486,859 $51,868,341 1.6 Governmental/ Non-Profit 7.4% $26,192,376 $48,677,752 $22,485,376 1.9 Common Costs 7.4% $35,205,745 $0 $0 n/a Total n/a $362,435,742 $493,063,525 $165,833,528 1.4 *TRC calculated according to requirements of the PA PUC,TRC Order. August 30, 2012. Costs include participant costs.
PECO PY 2013-2015 Act 129 - Phase II Energy Efficiency And Conservation Plan Page 8
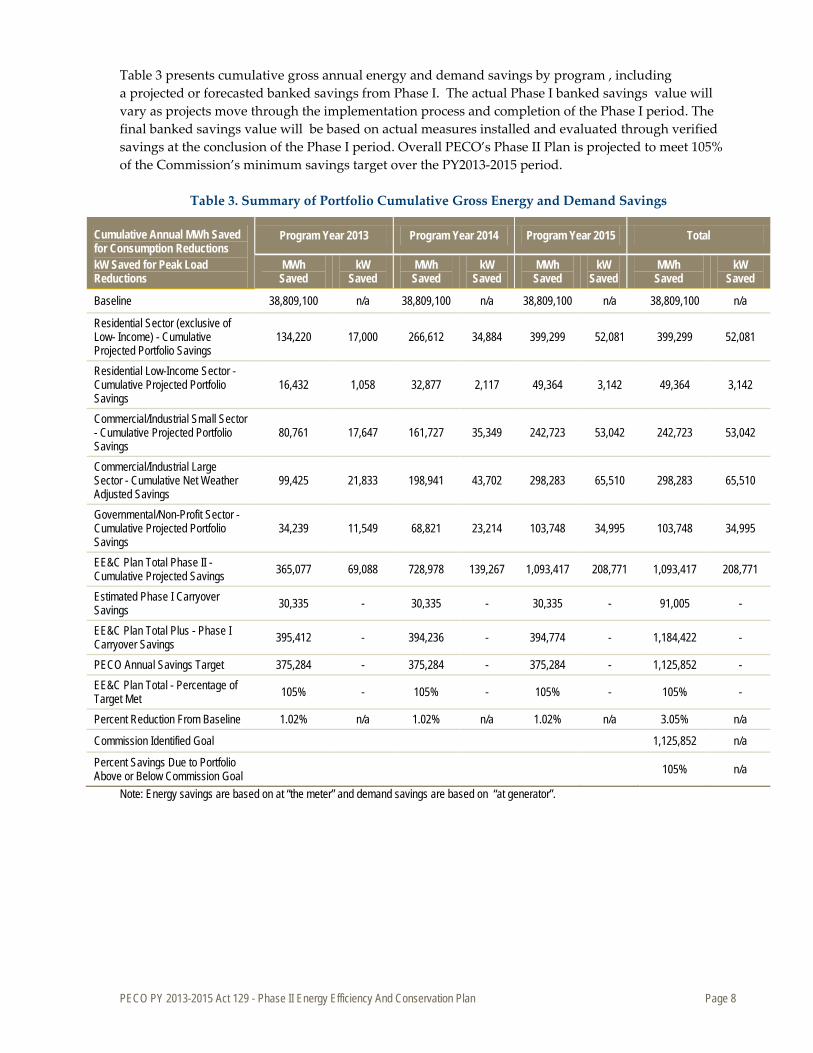
Table 3 presents cumulative gross annual energy and demand savings by program , including a projected or forecasted banked savings from Phase I. The actual Phase I banked savings value will vary as projects move through the implementation process and completion of the Phase I period. The final banked savings value will be based on actual measures installed and evaluated through verified savings at the conclusion of the Phase I period. Overall PECO’s Phase II Plan is projected to meet 105% of the Commission’s minimum savings target over the PY2013-2015 period.
Table 3. Summary of Portfolio Cumulative Gross Energy and Demand Savings
Cumulative Annual MWh Saved for Consumption Reductions kW Saved for Peak Load Reductions
Program Year 2013 Program Year 2014 Program Year 2015 Total
MWh Saved
kW Saved
MWh Saved
kW Saved
MWh Saved
kW Saved
MWh Saved
kW Saved
Baseline 38,809,100 n/a 38,809,100 n/a 38,809,100 n/a 38,809,100 n/a
Residential Sector (exclusive of Low- Income) - Cumulative Projected Portfolio Savings
134,220 17,000 266,612 34,884 399,299 52,081 399,299 52,081
Residential Low-Income Sector - Cumulative Projected Portfolio Savings
16,432 1,058 32,877 2,117 49,364 3,142 49,364 3,142
Commercial/Industrial Small Sector - Cumulative Projected Portfolio Savings
80,761 17,647 161,727 35,349 242,723 53,042 242,723 53,042
Commercial/Industrial Large Sector - Cumulative Net Weather Adjusted Savings
99,425 21,833 198,941 43,702 298,283 65,510 298,283 65,510
Governmental/Non-Profit Sector - Cumulative Projected Portfolio Savings
34,239 11,549 68,821 23,214 103,748 34,995 103,748 34,995
EE&C Plan Total Phase II - Cumulative Projected Savings 365,077 69,088 728,978 139,267 1,093,417 208,771 1,093,417 208,771
Estimated Phase I Carryover Savings 30,335 - 30,335 - 30,335 - 91,005 -
EE&C Plan Total Plus - Phase I Carryover Savings 395,412 - 394,236 - 394,774 - 1,184,422 -
PECO Annual Savings Target 375,284 - 375,284 - 375,284 - 1,125,852 - EE&C Plan Total - Percentage of Target Met 105% - 105% - 105% - 105% -
Percent Reduction From Baseline 1.02% n/a 1.02% n/a 1.02% n/a 3.05% n/a
Commission Identified Goal 1,125,852 n/a
Percent Savings Due to Portfolio Above or Below Commission Goal 105% n/a
Note: Energy savings are based on at “the meter” and demand savings are based on “at generator”.
PECO PY 2013-2015 Act 129 - Phase II Energy Efficiency And Conservation Plan Page 9
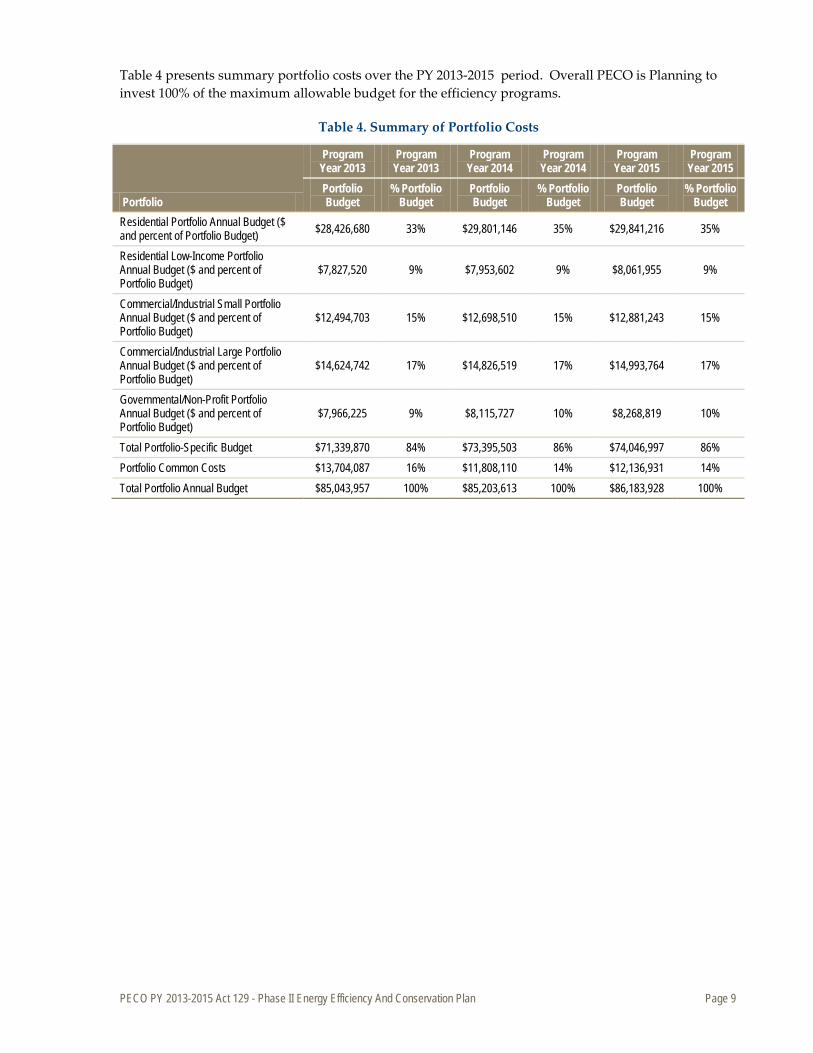
Table 4 presents summary portfolio costs over the PY 2013-2015 period. Overall PECO is Planning to invest 100% of the maximum allowable budget for the efficiency programs.
Table 4. Summary of Portfolio Costs
Portfolio
Program Year 2013
Program Year 2013
Program Year 2014
Program Year 2014
Program Year 2015
Program Year 2015
Portfolio Budget
% Portfolio Budget
Portfolio Budget
% Portfolio Budget
Portfolio Budget
% Portfolio Budget
Residential Portfolio Annual Budget ($ and percent of Portfolio Budget) $28,426,680 33% $29,801,146 35% $29,841,216 35%
Residential Low-Income Portfolio Annual Budget ($ and percent of Portfolio Budget)
$7,827,520 9% $7,953,602 9% $8,061,955 9%
Commercial/Industrial Small Portfolio Annual Budget ($ and percent of Portfolio Budget)
$12,494,703 15% $12,698,510 15% $12,881,243 15%
Commercial/Industrial Large Portfolio Annual Budget ($ and percent of Portfolio Budget)
$14,624,742 17% $14,826,519 17% $14,993,764 17%
Governmental/Non-Profit Portfolio Annual Budget ($ and percent of Portfolio Budget)
$7,966,225 9% $8,115,727 10% $8,268,819 10%
Total Portfolio-Specific Budget $71,339,870 84% $73,395,503 86% $74,046,997 86% Portfolio Common Costs $13,704,087 16% $11,808,110 14% $12,136,931 14% Total Portfolio Annual Budget $85,043,957 100% $85,203,613 100% $86,183,928 100%
PECO 2013-2015 Act 129 - Phase II Energy Efficiency And Conservation Plan Page 10
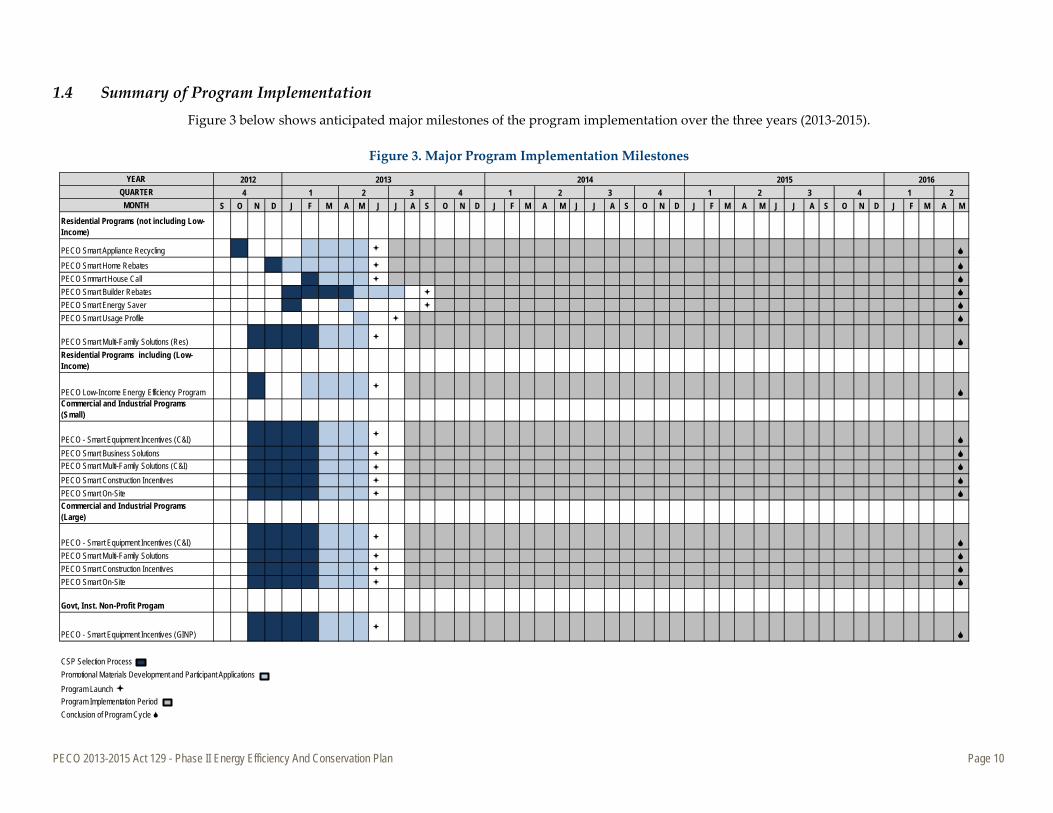
1.4 Summary of Program Implementation Figure 3 below shows anticipated major milestones of the program implementation over the three years (2013-2015).
Figure 3. Major Program Implementation Milestones
YEARQUARTER 4
MONTH S O N D J F M A M J J A S O N D J F M A M J J A S O N D J F M A M J J A S O N D J F M A MResidential Programs (not including Low-Income)
PECO Smart Appliance Recycling
PECO Smart Home Rebates PECO Smmart House Call PECO Smart Builder Rebates PECO Smart Energy Saver PECO Smart Usage Profile
PECO Smart Multi-Family Solutions (Res)
Residential Programs including (Low-Income)
PECO Low-Income Energy Efficiency Program
Commercial and Industrial Programs (Small)
PECO - Smart Equipment Incentives (C&I)
PECO Smart Business Solutions PECO Smart Multi-Family Solutions (C&I) PECO Smart Construction Incentives PECO Smart On-Site Commercial and Industrial Programs (Large)
PECO - Smart Equipment Incentives (C&I)
PECO Smart Multi-Family Solutions PECO Smart Construction Incentives PECO Smart On-Site
Govt, Inst. Non-Profit Progam
PECO - Smart Equipment Incentives (GINP)
CSP Selection Process Promotional Materials Development and Participant ApplicationsProgram Launch Program Implementation PeriodConclusion of Program Cycle
20161 21
2014 20153 4 1 2 3 42
201320121 2 3 4

PECO PY 2013-2015 Act 129 - Phase II Energy Efficiency And Conservation Plan Page 11
1.5 Summary Description of PECO’s Strategy to Acquire 25% Savings Each Program Year
PECO’s portfolio of programs are designed to produce significant savings in each of the three program years. As shown in Table 1, the Company projects that over 25% of the three year savings target will be achieved each program year.
1.6 Summary Descriptions of PECO’s Implementation Strategy to Manage EE&C Portfolios
PECO will take a number of steps to ensure effective, Act 129-compliant implementation of this Phase II Plan. These include:
» Implementation contracting: PECO will contract with a registered implementation CSP for each program (or set of programs) with specific experience implementing utility programs and working with each program’s target market. This will maximize the use of expertise already developed, enable PECO to make the programs available quickly to customers and begin achieving savings as soon as possible, allowing PECO staff to manage the broad set of programs.
» Utilization of delivery channels: Each program in the Plan calls for using appropriate and available means of delivering program services, including ensuring an adequate supply of featured equipment, promotion and distribution of the rebated products, and training and education. Depending on the program, channels may include, but are not limited to, trade allies such as equipment manufacturers and retailers, distributors, contractors, equipment installers, architects and engineers, facility auditors, and trade associations; government, community, and affinity groups; PECO field staff; PECO bill inserts, web pages devoted to the programs, on-line audits; news media advertising; as well as the implementation CSP.
» Awareness and education: PECO will implement a general education campaign to inform customers and other stakeholders about the programs, PECO’s commitment to reducing customer electricity use, and the benefits of energy efficiency. Depending on the program, these activities can include training seminars, fact sheets, case studies, on-line audits and energy profiles, home/facility site visits, and demonstration projects.
» Tracking database: PECO’s tracking database was developed and is maintained by a third-party database vendor. Database protocols were developed to ensure accurate data entry through proper field definitions and input validations. Program activity tracking queries were written to facilitate program tracking and reporting for PECO and the Commission. The implementation CSPs upload program data into the database at defined intervals and according to the data protocols. The evaluation, measurement and verification (EM&V) vendor is able to access the information in the database.
» Pre-launch design and preparation period: The implementation schedule for each new program includes a design phase to allow PECO and the implementation CSP to properly prepare for the program launch. This time will be used to refine the program, develop protocols, and training materials, recruit trade allies, conduct educational activities, and develop and print incentive applications. The elements will be in place prior to full operation of the program. They will also be reviewed during process evaluations so that improvements may be incorporated during this Plan cycle.
» Continuous review of implementation practices: The Plan explicitly addresses the challenges that each program will face in achieving success. Internal process reviews and evaluations by the EM&V contractor of the program protocols, procedures, participant satisfaction, and reporting will be conducted to identify and address issues that arise during program operation and to facilitate ongoing program improvement.
PECO PY 2013-2015 Act 129 - Phase II Energy Efficiency And Conservation Plan Page 12
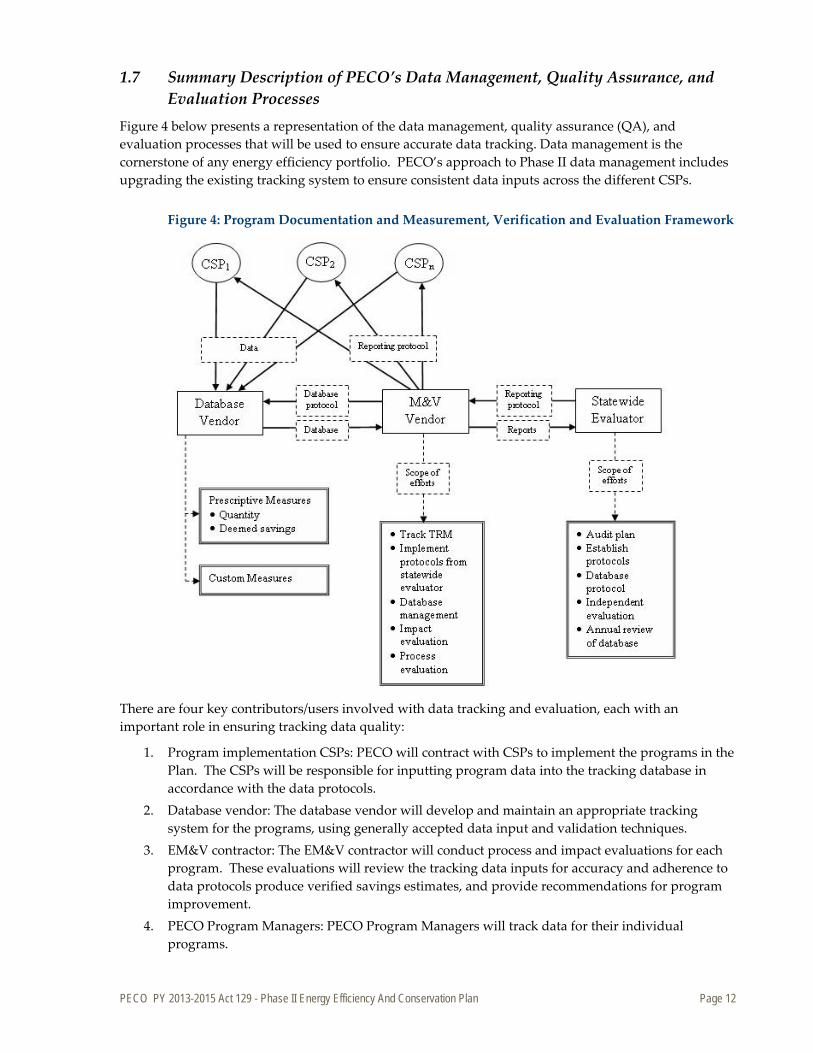
1.7 Summary Description of PECO’s Data Management, Quality Assurance, and Evaluation Processes
Figure 4 below presents a representation of the data management, quality assurance (QA), and evaluation processes that will be used to ensure accurate data tracking. Data management is the cornerstone of any energy efficiency portfolio. PECO’s approach to Phase II data management includes upgrading the existing tracking system to ensure consistent data inputs across the different CSPs.
Figure 4: Program Documentation and Measurement, Verification and Evaluation Framework
There are four key contributors/users involved with data tracking and evaluation, each with an important role in ensuring tracking data quality:
1. Program implementation CSPs: PECO will contract with CSPs to implement the programs in the Plan. The CSPs will be responsible for inputting program data into the tracking database in accordance with the data protocols.
2. Database vendor: The database vendor will develop and maintain an appropriate tracking system for the programs, using generally accepted data input and validation techniques.
3. EM&V contractor: The EM&V contractor will conduct process and impact evaluations for each program. These evaluations will review the tracking data inputs for accuracy and adherence to data protocols produce verified savings estimates, and provide recommendations for program improvement.
4. PECO Program Managers: PECO Program Managers will track data for their individual programs.

PECO PY 2013-2015 Act 129 - Phase II Energy Efficiency And Conservation Plan Page 13
PECO’s approach addresses four areas critical to ensuring program implementation quality: 1. Implementation CSP selection: PECO will select and contract with CSPs who have demonstrated
experience implementing data management protocols and a commitment to maintaining data quality and integrity.
2. Development of program implementation and documentation protocols: PECO and the CSPs will develop specific data management protocols and procedures for each program. These will govern all aspects of the program implementation, from procedures for conducting site visits to data input.
3. Verification and documentation of activities and savings: Verification of project eligibility and actual installation of measures is important. Documentation of purchases and installations will ensure that programs are implemented in top quality fashion and will provide the basis for defensible program evaluations.
4. Evaluation Plans: PECO will contract with an experienced EM&V vendor to conduct an independent assessment of each program’s performance. This contractor will be in place prior to the start of most programs and will develop a comprehensive Plan for conducting process and impact evaluations. The EM&V contractor will work with the Statewide Evaluator to ensure that the evaluations are conducted according to state requirements.
1.8 Summary Description of Cost Recovery Mechanism As required by Act 129, PECO’s EE&C Plan costs are recoverable through a 66 Pa. C.S.§1307 cost-recovery mechanism. During the development of the Phase I EE&C Plan, PECO collaborated with key stakeholders to develop a mechanism to address several recovery issues (e.g., levelized charge, charging of interest, and true-up process). This mechanism was implemented as part of the Phase I Plan and has proven to work effectively. In its Phase II Implementation Order, the Commission again provided direction on the cost recovery tariff mechanism to be used.7
The Commission described a Phase II mechanism similar to the Phase I mechanism. They indicated that the mechanism shall be designed to recover, on a full and current basis, without interest, from each customer class, all prudent and reasonable EE&C costs that have been assigned to each class. In addition, the mechanism shall be non-bypassable and structured so that it will not affect the EDC’s price to compare. As such, PECO proposes to use a cost recovery mechanism for Phase II similar to that used in Phase I.
As with Phase I, PECO proposes that the cost recovery mechanism for Phase II includes four separate recovery charges, one for the Residential class (which includes low income customers), one for the Small Commercial/Industrial class, one for the Large Commercial/Industrial class, and one for the Municipal Lighting class (street lights and traffic lights). For the GINP customers, who are defined in Act 129, PECO does not have a separate recovery mechanism because their electric accounts are already included in the Small Commercial/Industrial and the Large Commercial/Industrial classes. Four separate charges were developed to ensure that the rate classes that finance the measures are the classes that receive the direct energy and conservation benefits. 8
See Section 7 for a detailed description of and estimated values for the cost recovery mechanisms.
7 Pennsylvania PUC. Implementation Order, August 2, 2012., Pp. 115 - 119 8 Pennsylvania PUC. Implementation Order, August 2, 2012., P. 100
PECO PY 2013-2015 Act 129 - Phase II Energy Efficiency And Conservation Plan Page 14
2. Energy Efficiency Portfolio / Program Summary Tables and Charts
2.1 Residential, Commercial/Industrial Small, Commercial/Industrial Large and Governmental/Educational/Non-Profit Portfolio Summaries
Appendix C contains the following data tables as required by the Commission’s Plan II template: » Table C- 4: Program Summaries
2.2 Plan Data: Costs, Cost-Effectiveness and Savings by Program, Sector and Portfolio
Appendix C contains the following data tables as required by the Commission’s Plan II template: » Table C- 1: Portfolio Summary of Lifetime Costs and Benefits » Table C-2: Summary of Portfolio Energy and Demand Savings » Table C-3: Summary of Portfolio Costs » Table C-4: Program Summaries
2.3 Budget and Parity Analysis Appendix C contains the following data tables as required by the Commission’s Plan II template:
» Table C-5: Budget and Parity Analysis Summary
PECO PY 2013-2015 Act 129 - Phase II Energy Efficiency And Conservation Plan Page 15
3. Program Descriptions
3.1 Discussion of Criteria and Process Used for Selection of Programs
3.1.1 Portfolio Objectives and Metrics that Define Program Success
The Energy Efficiency and Conservation (EE&C) program portfolio objectives are to achieve the requirements set forth in Act 129- Phase II targets specific to PECO. This includes achieving the following milestones:
» Achieve a 2.9% energy savings in PECO’s baseline load (1,125,852 MWh) over the three year Plan period between June 1, 2013 and May 31, 2016.
» Invest in energy efficiency up to 2% of PECO’s annual revenue or $85.5 million for a maximum of $256.4 million over the three-year period from June 1, 2013 to May 31, 2016.
» Achieve at least 10% of the total EE&C program portfolio energy savings through programs directed toward PECO’s government and public sector/non-profit customers, and at least 4.5% of total energy savings from the low income sector.
» Provide a comprehensive portfolio of programs with opportunities for all customers to participate.
In addition to monitoring the above-referenced Act 129 metrics, PECO will define additional metrics for program success in consultation with its measurement and verification contractor. Below is a representative list of questions that PECO intends to address over the course of its program implementation:
» Are customers generally satisfied with the EE&C program offerings? » Are there additional programs that could be offered in the future? » Are all customer segments appropriately represented?
PECO expects to utilize industry standard practices for measuring and evaluating these and other parameters to assess program success. PECO will carefully review the recommendations over the course of portfolio implementation and make mid-course corrections as necessary.
3.1.2 Process for Program Development
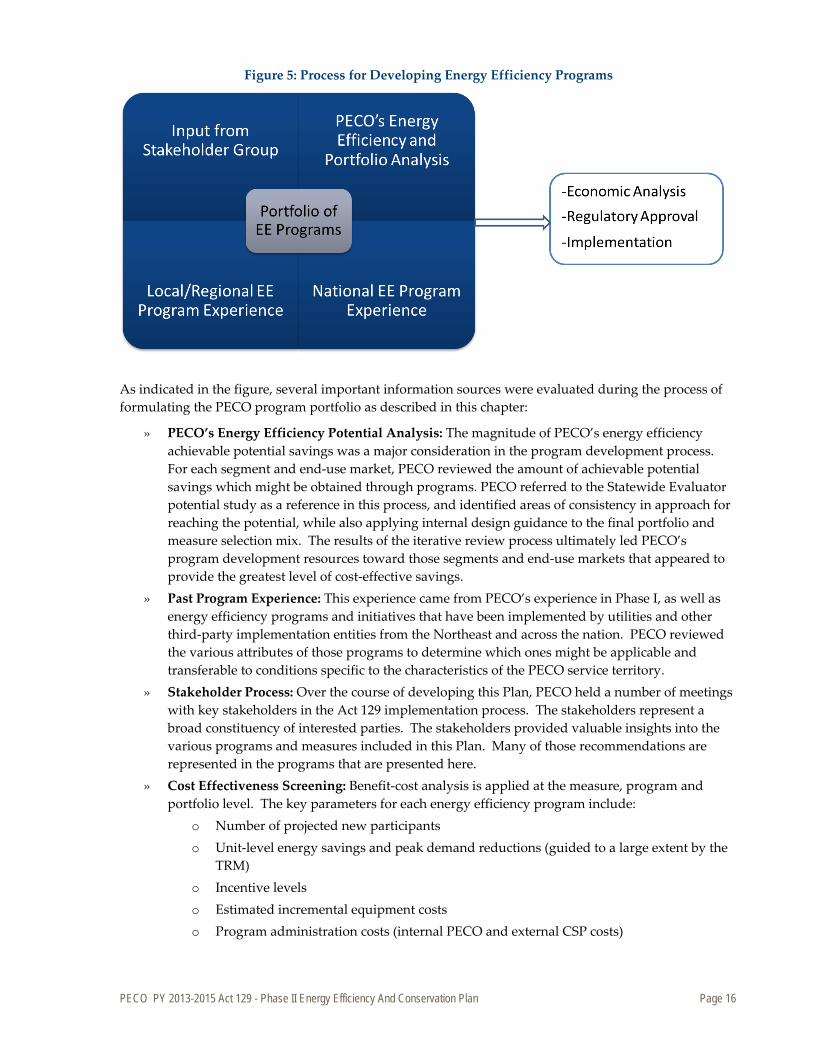
The process of developing energy efficiency programs requires rigorous quantitative analysis, thorough benchmarking, and a thoughtful stakeholder process. The process employed by PECO to develop this Plan includes all of these components and is illustrated in Figure 5. Each element is described in the section below.
PECO PY 2013-2015 Act 129 - Phase II Energy Efficiency And Conservation Plan Page 16
Figure 5: Process for Developing Energy Efficiency Programs
As indicated in the figure, several important information sources were evaluated during the process of formulating the PECO program portfolio as described in this chapter:
» PECO’s Energy Efficiency Potential Analysis: The magnitude of PECO’s energy efficiency achievable potential savings was a major consideration in the program development process. For each segment and end-use market, PECO reviewed the amount of achievable potential savings which might be obtained through programs. PECO referred to the Statewide Evaluator potential study as a reference in this process, and identified areas of consistency in approach for reaching the potential, while also applying internal design guidance to the final portfolio and measure selection mix. The results of the iterative review process ultimately led PECO’s program development resources toward those segments and end-use markets that appeared to provide the greatest level of cost-effective savings.
» Past Program Experience: This experience came from PECO’s experience in Phase I, as well as energy efficiency programs and initiatives that have been implemented by utilities and other third-party implementation entities from the Northeast and across the nation. PECO reviewed the various attributes of those programs to determine which ones might be applicable and transferable to conditions specific to the characteristics of the PECO service territory.
» Stakeholder Process: Over the course of developing this Plan, PECO held a number of meetings with key stakeholders in the Act 129 implementation process. The stakeholders represent a broad constituency of interested parties. The stakeholders provided valuable insights into the various programs and measures included in this Plan. Many of those recommendations are represented in the programs that are presented here.
» Cost Effectiveness Screening: Benefit-cost analysis is applied at the measure, program and portfolio level. The key parameters for each energy efficiency program include:
o Number of projected new participants o Unit-level energy savings and peak demand reductions (guided to a large extent by the
TRM) o Incentive levels o Estimated incremental equipment costs o Program administration costs (internal PECO and external CSP costs)
PECO PY 2013-2015 Act 129 - Phase II Energy Efficiency And Conservation Plan Page 17
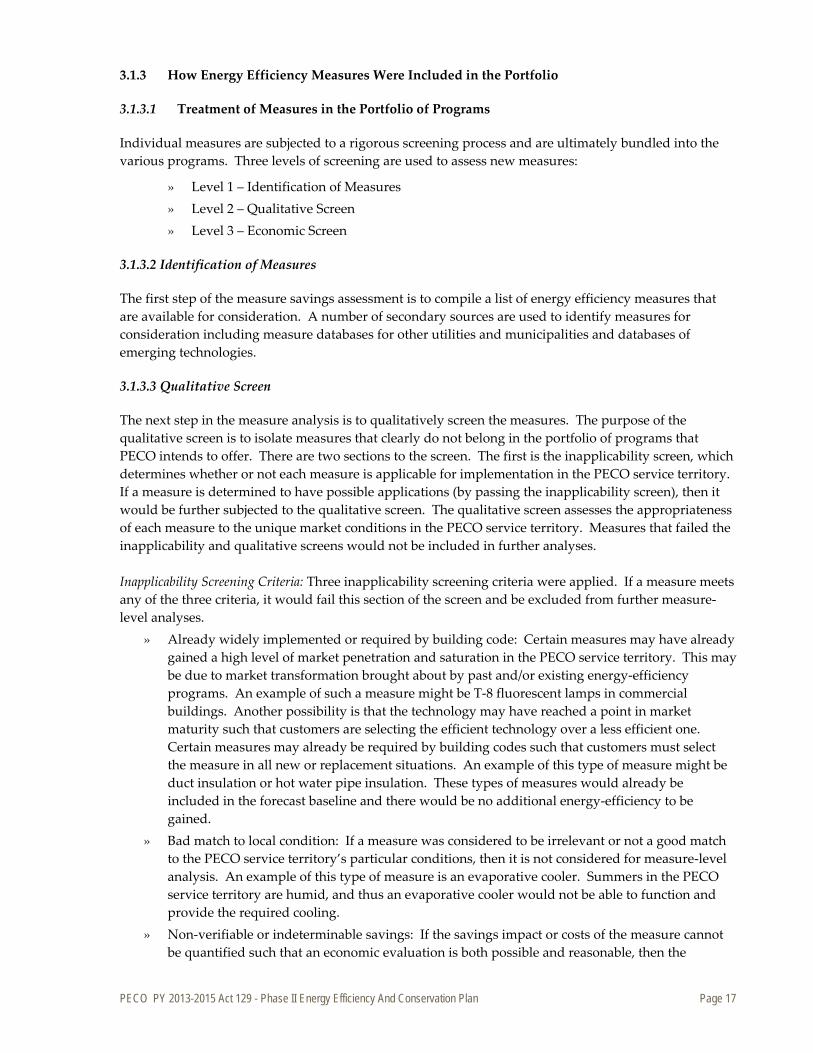
3.1.3 How Energy Efficiency Measures Were Included in the Portfolio
3.1.3.1 Treatment of Measures in the Portfolio of Programs
Individual measures are subjected to a rigorous screening process and are ultimately bundled into the various programs. Three levels of screening are used to assess new measures:
» Level 1 – Identification of Measures » Level 2 – Qualitative Screen » Level 3 – Economic Screen
3.1.3.2 Identification of Measures
The first step of the measure savings assessment is to compile a list of energy efficiency measures that are available for consideration. A number of secondary sources are used to identify measures for consideration including measure databases for other utilities and municipalities and databases of emerging technologies.
3.1.3.3 Qualitative Screen
The next step in the measure analysis is to qualitatively screen the measures. The purpose of the qualitative screen is to isolate measures that clearly do not belong in the portfolio of programs that PECO intends to offer. There are two sections to the screen. The first is the inapplicability screen, which determines whether or not each measure is applicable for implementation in the PECO service territory. If a measure is determined to have possible applications (by passing the inapplicability screen), then it would be further subjected to the qualitative screen. The qualitative screen assesses the appropriateness of each measure to the unique market conditions in the PECO service territory. Measures that failed the inapplicability and qualitative screens would not be included in further analyses. Inapplicability Screening Criteria: Three inapplicability screening criteria were applied. If a measure meets any of the three criteria, it would fail this section of the screen and be excluded from further measure-level analyses.
» Already widely implemented or required by building code: Certain measures may have already gained a high level of market penetration and saturation in the PECO service territory. This may be due to market transformation brought about by past and/or existing energy-efficiency programs. An example of such a measure might be T-8 fluorescent lamps in commercial buildings. Another possibility is that the technology may have reached a point in market maturity such that customers are selecting the efficient technology over a less efficient one. Certain measures may already be required by building codes such that customers must select the measure in all new or replacement situations. An example of this type of measure might be duct insulation or hot water pipe insulation. These types of measures would already be included in the forecast baseline and there would be no additional energy-efficiency to be gained.
» Bad match to local condition: If a measure was considered to be irrelevant or not a good match to the PECO service territory’s particular conditions, then it is not considered for measure-level analysis. An example of this type of measure is an evaporative cooler. Summers in the PECO service territory are humid, and thus an evaporative cooler would not be able to function and provide the required cooling.
» Non-verifiable or indeterminable savings: If the savings impact or costs of the measure cannot be quantified such that an economic evaluation is both possible and reasonable, then the
PECO PY 2013-2015 Act 129 - Phase II Energy Efficiency And Conservation Plan Page 18
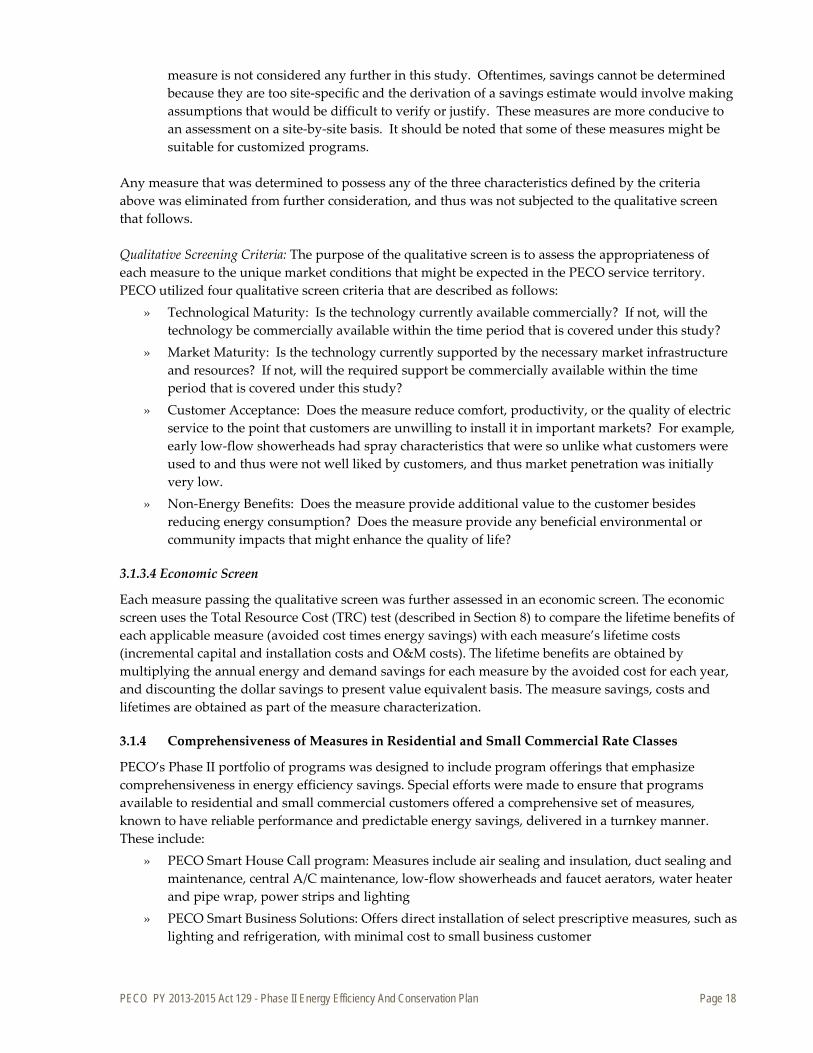
measure is not considered any further in this study. Oftentimes, savings cannot be determined because they are too site-specific and the derivation of a savings estimate would involve making assumptions that would be difficult to verify or justify. These measures are more conducive to an assessment on a site-by-site basis. It should be noted that some of these measures might be suitable for customized programs.
Any measure that was determined to possess any of the three characteristics defined by the criteria above was eliminated from further consideration, and thus was not subjected to the qualitative screen that follows. Qualitative Screening Criteria: The purpose of the qualitative screen is to assess the appropriateness of each measure to the unique market conditions that might be expected in the PECO service territory. PECO utilized four qualitative screen criteria that are described as follows:
» Technological Maturity: Is the technology currently available commercially? If not, will the technology be commercially available within the time period that is covered under this study?
» Market Maturity: Is the technology currently supported by the necessary market infrastructure and resources? If not, will the required support be commercially available within the time period that is covered under this study?
» Customer Acceptance: Does the measure reduce comfort, productivity, or the quality of electric service to the point that customers are unwilling to install it in important markets? For example, early low-flow showerheads had spray characteristics that were so unlike what customers were used to and thus were not well liked by customers, and thus market penetration was initially very low.
» Non-Energy Benefits: Does the measure provide additional value to the customer besides reducing energy consumption? Does the measure provide any beneficial environmental or community impacts that might enhance the quality of life?
3.1.3.4 Economic Screen
Each measure passing the qualitative screen was further assessed in an economic screen. The economic screen uses the Total Resource Cost (TRC) test (described in Section 8) to compare the lifetime benefits of each applicable measure (avoided cost times energy savings) with each measure’s lifetime costs (incremental capital and installation costs and O&M costs). The lifetime benefits are obtained by multiplying the annual energy and demand savings for each measure by the avoided cost for each year, and discounting the dollar savings to present value equivalent basis. The measure savings, costs and lifetimes are obtained as part of the measure characterization.
3.1.4 Comprehensiveness of Measures in Residential and Small Commercial Rate Classes
PECO’s Phase II portfolio of programs was designed to include program offerings that emphasize comprehensiveness in energy efficiency savings. Special efforts were made to ensure that programs available to residential and small commercial customers offered a comprehensive set of measures, known to have reliable performance and predictable energy savings, delivered in a turnkey manner. These include:
» PECO Smart House Call program: Measures include air sealing and insulation, duct sealing and maintenance, central A/C maintenance, low-flow showerheads and faucet aerators, water heater and pipe wrap, power strips and lighting
» PECO Smart Business Solutions: Offers direct installation of select prescriptive measures, such as lighting and refrigeration, with minimal cost to small business customer
PECO PY 2013-2015 Act 129 - Phase II Energy Efficiency And Conservation Plan Page 19
3.2 Individual Program Descriptions
3.2.1 Residential Programs
3.2.1.1 EE Program 1 — PECO Smart Appliance Recycling
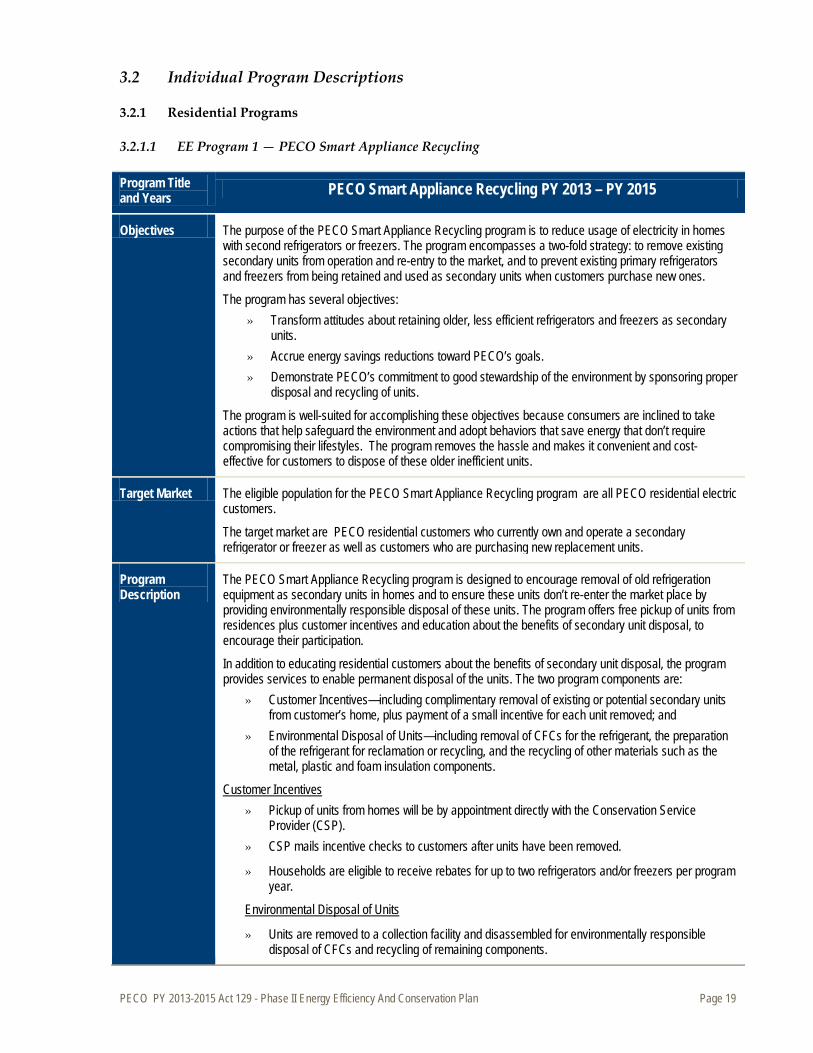
Program Title and Years PECO Smart Appliance Recycling PY 2013 – PY 2015
Objectives The purpose of the PECO Smart Appliance Recycling program is to reduce usage of electricity in homes with second refrigerators or freezers. The program encompasses a two-fold strategy: to remove existing secondary units from operation and re-entry to the market, and to prevent existing primary refrigerators and freezers from being retained and used as secondary units when customers purchase new ones.
The program has several objectives: » Transform attitudes about retaining older, less efficient refrigerators and freezers as secondary
units. » Accrue energy savings reductions toward PECO’s goals. » Demonstrate PECO’s commitment to good stewardship of the environment by sponsoring proper
disposal and recycling of units.
The program is well-suited for accomplishing these objectives because consumers are inclined to take actions that help safeguard the environment and adopt behaviors that save energy that don’t require compromising their lifestyles. The program removes the hassle and makes it convenient and cost-effective for customers to dispose of these older inefficient units.
Target Market The eligible population for the PECO Smart Appliance Recycling program are all PECO residential electric customers.
The target market are PECO residential customers who currently own and operate a secondary refrigerator or freezer as well as customers who are purchasing new replacement units.
Program Description
The PECO Smart Appliance Recycling program is designed to encourage removal of old refrigeration equipment as secondary units in homes and to ensure these units don’t re-enter the market place by providing environmentally responsible disposal of these units. The program offers free pickup of units from residences plus customer incentives and education about the benefits of secondary unit disposal, to encourage their participation.
In addition to educating residential customers about the benefits of secondary unit disposal, the program provides services to enable permanent disposal of the units. The two program components are:
» Customer Incentives—including complimentary removal of existing or potential secondary units from customer’s home, plus payment of a small incentive for each unit removed; and
» Environmental Disposal of Units—including removal of CFCs for the refrigerant, the preparation of the refrigerant for reclamation or recycling, and the recycling of other materials such as the metal, plastic and foam insulation components.
» Pickup of units from homes will be by appointment directly with the Conservation Service Provider (CSP).
Customer Incentives
» CSP mails incentive checks to customers after units have been removed.
» Households are eligible to receive rebates for up to two refrigerators and/or freezers per program year.
» Units are removed to a collection facility and disassembled for environmentally responsible disposal of CFCs and recycling of remaining components.
Environmental Disposal of Units
PECO PY 2013-2015 Act 129 - Phase II Energy Efficiency And Conservation Plan Page 20
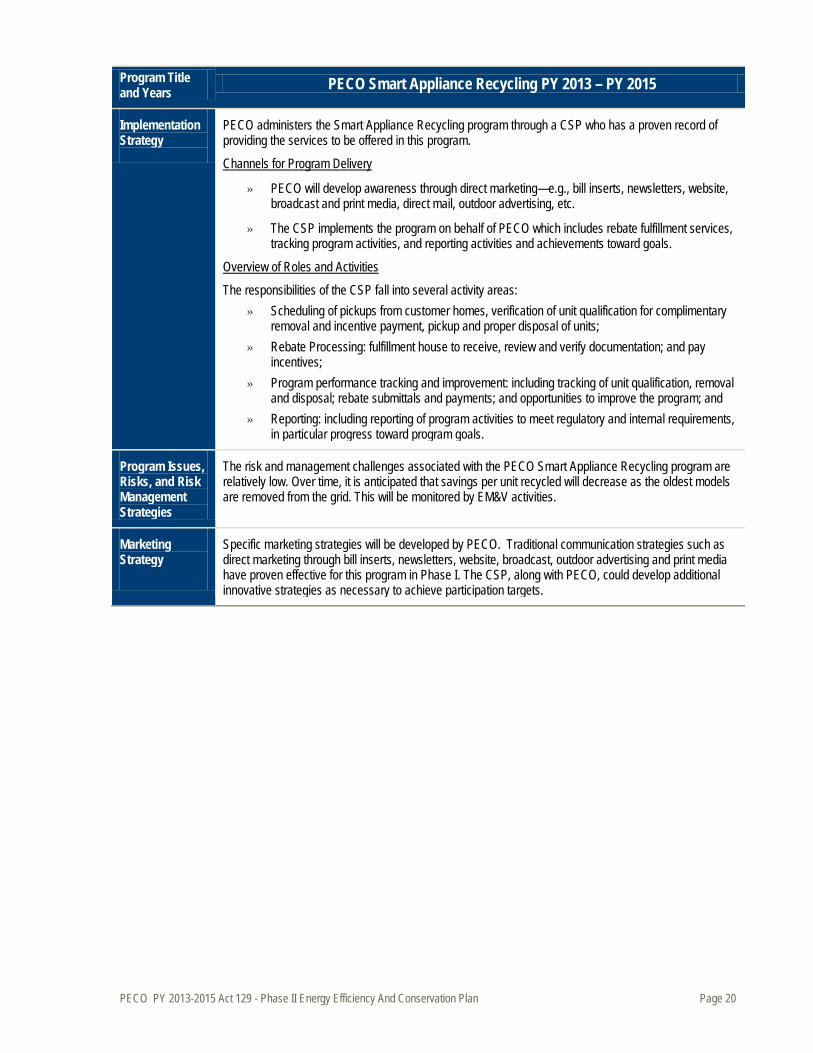
Program Title and Years PECO Smart Appliance Recycling PY 2013 – PY 2015
Implementation Strategy
PECO administers the Smart Appliance Recycling program through a CSP who has a proven record of providing the services to be offered in this program.
» PECO will develop awareness through direct marketing—e.g., bill inserts, newsletters, website, broadcast and print media, direct mail, outdoor advertising, etc.
Channels for Program Delivery
» The CSP implements the program on behalf of PECO which includes rebate fulfillment services, tracking program activities, and reporting activities and achievements toward goals.
The responsibilities of the CSP fall into several activity areas:
Overview of Roles and Activities
» Scheduling of pickups from customer homes, verification of unit qualification for complimentary removal and incentive payment, pickup and proper disposal of units;
» Rebate Processing: fulfillment house to receive, review and verify documentation; and pay incentives;
» Program performance tracking and improvement: including tracking of unit qualification, removal and disposal; rebate submittals and payments; and opportunities to improve the program; and
» Reporting: including reporting of program activities to meet regulatory and internal requirements, in particular progress toward program goals.
Program Issues, Risks, and Risk Management Strategies
The risk and management challenges associated with the PECO Smart Appliance Recycling program are relatively low. Over time, it is anticipated that savings per unit recycled will decrease as the oldest models are removed from the grid. This will be monitored by EM&V activities.
Marketing Strategy
Specific marketing strategies will be developed by PECO. Traditional communication strategies such as direct marketing through bill inserts, newsletters, website, broadcast, outdoor advertising and print media have proven effective for this program in Phase I. The CSP, along with PECO, could develop additional innovative strategies as necessary to achieve participation targets.
PECO PY 2013-2015 Act 129 - Phase II Energy Efficiency And Conservation Plan Page 21
Program Title and Years PECO Smart Appliance Recycling PY 2013 – PY 2015
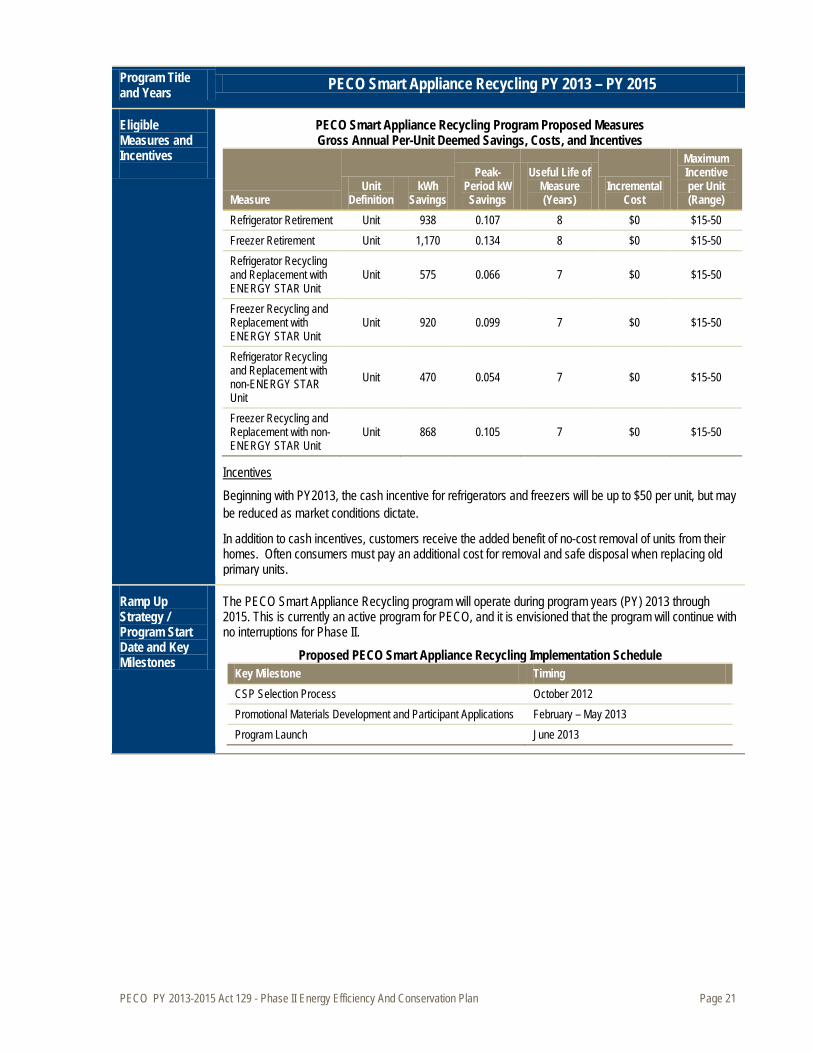
Eligible Measures and Incentives
PECO Smart Appliance Recycling Program Proposed Measures Gross Annual Per-Unit Deemed Savings, Costs, and Incentives
Measure Unit
Definition kWh
Savings
Peak-Period kW Savings
Useful Life of Measure (Years)
Incremental Cost
Maximum Incentive per Unit (Range)
Refrigerator Retirement Unit 938 0.107 8 $0 $15-50 Freezer Retirement Unit 1,170 0.134 8 $0 $15-50 Refrigerator Recycling and Replacement with ENERGY STAR Unit
Unit 575 0.066 7 $0 $15-50
Freezer Recycling and Replacement with ENERGY STAR Unit
Unit 920 0.099 7 $0 $15-50
Refrigerator Recycling and Replacement with non-ENERGY STAR Unit
Unit 470 0.054 7 $0 $15-50
Freezer Recycling and Replacement with non-ENERGY STAR Unit
Unit 868 0.105 7 $0 $15-50
Beginning with PY2013, the cash incentive for refrigerators and freezers will be up to $50 per unit, but may be reduced as market conditions dictate.
Incentives
In addition to cash incentives, customers receive the added benefit of no-cost removal of units from their homes. Often consumers must pay an additional cost for removal and safe disposal when replacing old primary units.
Ramp Up Strategy / Program Start Date and Key Milestones
The PECO Smart Appliance Recycling program will operate during program years (PY) 2013 through 2015. This is currently an active program for PECO, and it is envisioned that the program will continue with no interruptions for Phase II.
Proposed PECO Smart Appliance Recycling Implementation Schedule Key Milestone Timing CSP Selection Process October 2012 Promotional Materials Development and Participant Applications February – May 2013 Program Launch June 2013
PECO PY 2013-2015 Act 129 - Phase II Energy Efficiency And Conservation Plan Page 22
Program Title and Years PECO Smart Appliance Recycling PY 2013 – PY 2015
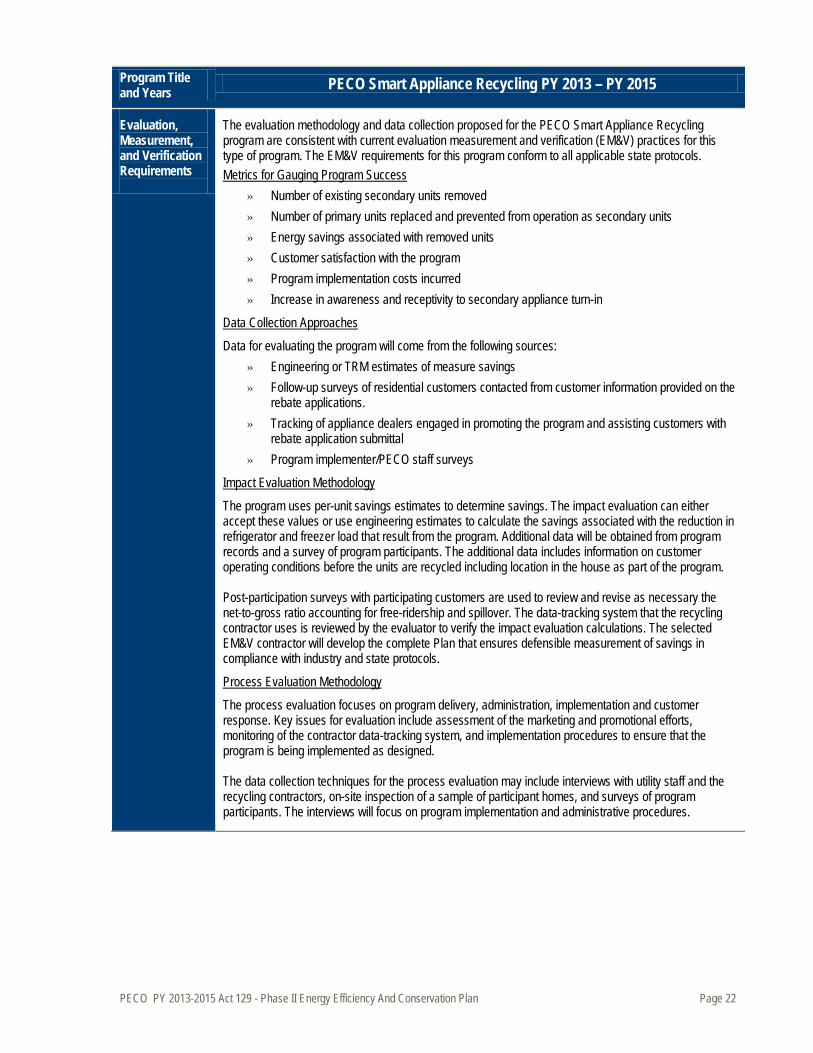
Evaluation, Measurement, and Verification Requirements
The evaluation methodology and data collection proposed for the PECO Smart Appliance Recycling program are consistent with current evaluation measurement and verification (EM&V) practices for this type of program. The EM&V requirements for this program conform to all applicable state protocols.
» Number of existing secondary units removed Metrics for Gauging Program Success
» Number of primary units replaced and prevented from operation as secondary units » Energy savings associated with removed units » Customer satisfaction with the program » Program implementation costs incurred » Increase in awareness and receptivity to secondary appliance turn-in
Data for evaluating the program will come from the following sources:
Data Collection Approaches
» Engineering or TRM estimates of measure savings » Follow-up surveys of residential customers contacted from customer information provided on the
rebate applications. » Tracking of appliance dealers engaged in promoting the program and assisting customers with
rebate application submittal » Program implementer/PECO staff surveys
The program uses per-unit savings estimates to determine savings. The impact evaluation can either accept these values or use engineering estimates to calculate the savings associated with the reduction in refrigerator and freezer load that result from the program. Additional data will be obtained from program records and a survey of program participants. The additional data includes information on customer operating conditions before the units are recycled including location in the house as part of the program.
Impact Evaluation Methodology
Post-participation surveys with participating customers are used to review and revise as necessary the net-to-gross ratio accounting for free-ridership and spillover. The data-tracking system that the recycling contractor uses is reviewed by the evaluator to verify the impact evaluation calculations. The selected EM&V contractor will develop the complete Plan that ensures defensible measurement of savings in compliance with industry and state protocols.
The process evaluation focuses on program delivery, administration, implementation and customer response. Key issues for evaluation include assessment of the marketing and promotional efforts, monitoring of the contractor data-tracking system, and implementation procedures to ensure that the program is being implemented as designed.
Process Evaluation Methodology
The data collection techniques for the process evaluation may include interviews with utility staff and the recycling contractors, on-site inspection of a sample of participant homes, and surveys of program participants. The interviews will focus on program implementation and administrative procedures.
PECO PY 2013-2015 Act 129 - Phase II Energy Efficiency And Conservation Plan Page 23
Program Title and Years PECO Smart Appliance Recycling PY 2013 – PY 2015
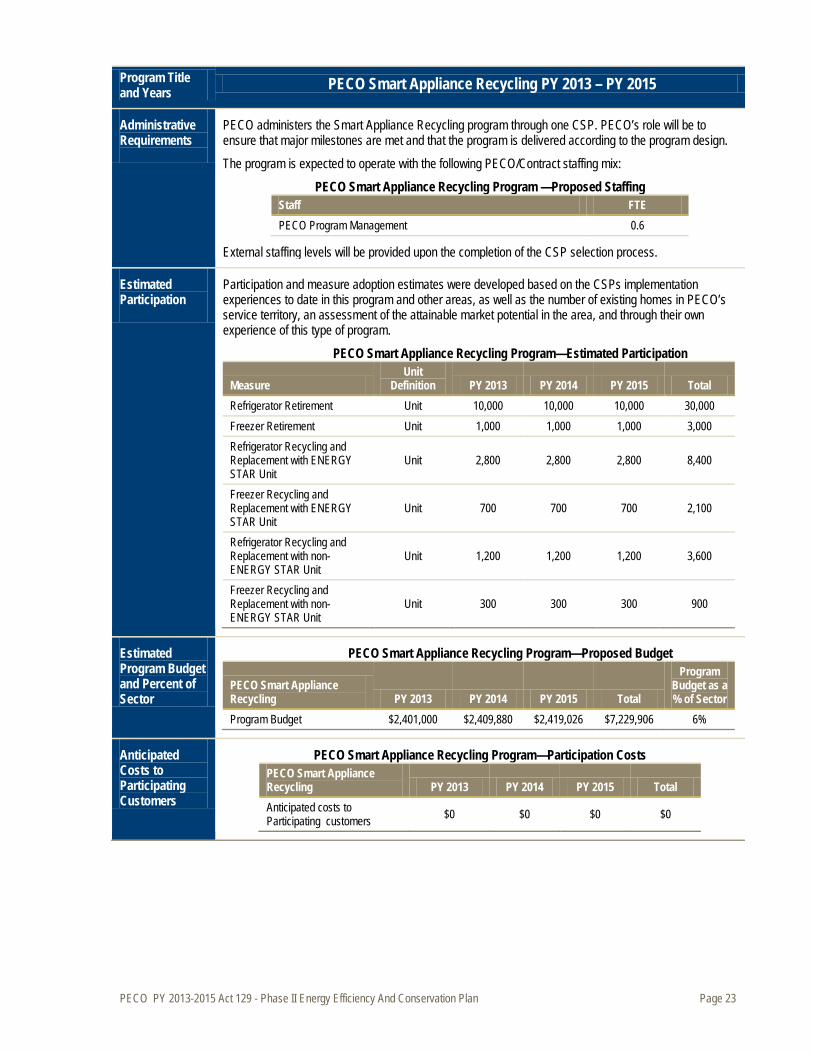
Administrative Requirements
PECO administers the Smart Appliance Recycling program through one CSP. PECO’s role will be to ensure that major milestones are met and that the program is delivered according to the program design.
The program is expected to operate with the following PECO/Contract staffing mix:
PECO Smart Appliance Recycling Program —Proposed Staffing Staff FTE PECO Program Management 0.6
External staffing levels will be provided upon the completion of the CSP selection process.
Estimated Participation
Participation and measure adoption estimates were developed based on the CSPs implementation experiences to date in this program and other areas, as well as the number of existing homes in PECO’s service territory, an assessment of the attainable market potential in the area, and through their own experience of this type of program.
PECO Smart Appliance Recycling Program—Estimated Participation
Measure Unit
Definition PY 2013 PY 2014 PY 2015 Total Refrigerator Retirement Unit 10,000 10,000 10,000 30,000 Freezer Retirement Unit 1,000 1,000 1,000 3,000 Refrigerator Recycling and Replacement with ENERGY STAR Unit
Unit 2,800 2,800 2,800 8,400
Freezer Recycling and Replacement with ENERGY STAR Unit
Unit 700 700 700 2,100
Refrigerator Recycling and Replacement with non-ENERGY STAR Unit
Unit 1,200 1,200 1,200 3,600
Freezer Recycling and Replacement with non-ENERGY STAR Unit
Unit 300 300 300 900
Estimated Program Budget and Percent of Sector
PECO Smart Appliance Recycling Program—Proposed Budget
PECO Smart Appliance Recycling PY 2013 PY 2014 PY 2015 Total
Program Budget as a % of Sector
Program Budget $2,401,000 $2,409,880 $2,419,026 $7,229,906 6%
Anticipated Costs to Participating Customers
PECO Smart Appliance Recycling Program—Participation Costs PECO Smart Appliance Recycling PY 2013 PY 2014 PY 2015 Total Anticipated costs to Participating customers $0 $0 $0 $0
PECO PY 2013-2015 Act 129 - Phase II Energy Efficiency And Conservation Plan Page 24
Program Title and Years PECO Smart Appliance Recycling PY 2013 – PY 2015
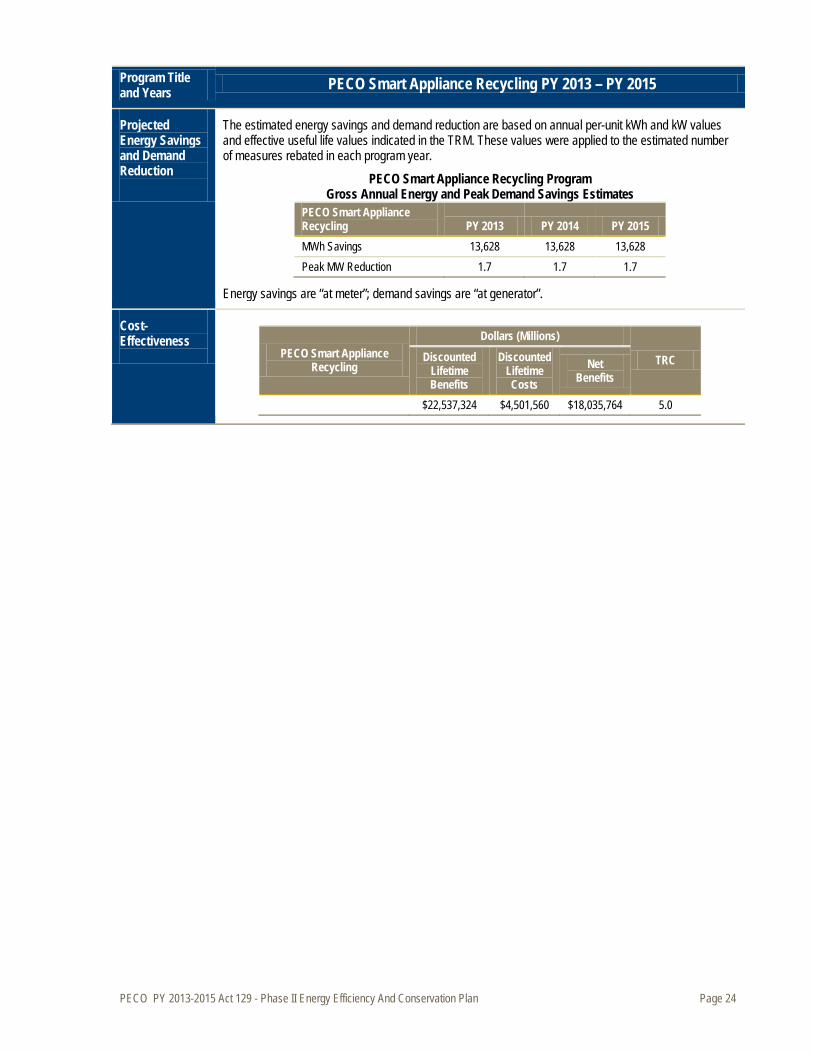
Projected Energy Savings and Demand Reduction
The estimated energy savings and demand reduction are based on annual per-unit kWh and kW values and effective useful life values indicated in the TRM. These values were applied to the estimated number of measures rebated in each program year.
PECO Smart Appliance Recycling Program Gross Annual Energy and Peak Demand Savings Estimates
PECO Smart Appliance Recycling PY 2013 PY 2014 PY 2015 MWh Savings 13,628 13,628 13,628 Peak MW Reduction 1.7 1.7 1.7
Energy savings are “at meter”; demand savings are “at generator”.
Cost-Effectiveness
PECO Smart Appliance Recycling
Dollars (Millions)
TRC Discounted Lifetime Benefits
Discounted Lifetime Costs
Net Benefits
$22,537,324 $4,501,560 $18,035,764 5.0

PECO PY 2013-2015 Act 129 - Phase II Energy Efficiency And Conservation Plan Page 25
3.2.1.2 EE Program 2 — PECO Smart Home Rebates Program
Program Title and Years PECO Smart Home Rebates Program PY 2013 – PY 2015
Objectives The purpose of the PECO Smart Home Rebates program is to increase the penetration of high efficiency lighting, appliances, electronics, HVAC and water heating measures among PECO’s residential customers. The program influences the adoption of these energy efficiency measures by offering either cash rebates or upstream and midstream discounts for the purchase and installation of qualifying efficient products, typically sold through major retail outlets or through HVAC trade ally contractors.
The program has several objectives: » Increase consumer and trade ally awareness of the breadth of energy efficiency opportunities for
homes, as well as adoption of these products and practices. » Make significant contribution to PECO’s energy savings goals. » Demonstrate PECO’s commitment to and confidence in the measures’ performance and their
ability to reduce home energy use.
Target Market The target market for the PECO Smart Home Rebates program is all PECO residential electric customers in PECO’s service territory and, in particular, those customers switching to efficient lighting and retro-fitting existing equipment that needs replacing or who can be persuaded to replace inefficient equipment before it fails.
Program Description
The PECO Smart Home Rebates program is designed to encourage and assist PECO residential electric customers in improving the energy efficiency of their homes through a broad range of energy efficiency options that address all major energy end uses. This program offers cash rebates to residential customers who install high-efficiency electric equipment and engages retailers, equipment suppliers and contractors to promote the rebate-eligible equipment.
The program will promote and provide rebates to help defray the cost of high-efficiency models of common home equipment, with a focus on qualified lighting and equipment where ENERGY STAR® is typically the minimum standard. Featuring ENERGY STAR® equipment, or better, helps ensure that high-quality measures will be installed, which adds savings reliability and reduces the likelihood of customer dissatisfaction.
Depending on the product purchased, rebates are offered in different ways. For example, for efficient lighting, PECO will provide incentives to the lighting manufacturers to reduce pricing and these “upstream buy-down” discounts are applied to selected lighting products sold by the participating retailer. For other products, for example, ENERGY STAR HVAC equipment, rebate application forms are submitted to PECO after the installation of qualifying equipment.
Rebates
Implementation Strategy
PECO will administer the PECO Smart Home Rebates program through a Conservation Service Provider (CSP), who will provide assistance with marketing; working with upstream and midstream suppliers and trade allies to stock and specify qualifying measures, promoting the program, assisting with rebate applications; providing rebate fulfillment services; and tracking and reporting program activities and achievements toward goals.
This program will be delivered mainly through retailers, equipment suppliers and trade allies. PECO develops awareness through direct marketing—e.g., bill inserts, newsletters, website, broadcast and print media, direct mail; and pays the participant rebates. Other channels include:
Channels for Program Delivery
» The PECO Smart House Call program is a natural pipeline for this program. The audit recommendations will include resource information for the recommended measures, including rebates available under the PECO Smart Home Rebates program.
» Retailers and equipment contractors/installers may be engaged to promote awareness and use of rebate offers to help sell qualifying equipment; they may also provide or pre-fill rebate forms
PECO PY 2013-2015 Act 129 - Phase II Energy Efficiency And Conservation Plan Page 26
Program Title and Years PECO Smart Home Rebates Program PY 2013 – PY 2015
to help customers obtain rebates. These allies are most likely to include: o Major retail stores; o Residential air conditioning and heating equipment dealers and installers; and o Small electrical equipment dealers.
The implementation CSP will have full responsibility for delivery of all aspects of the program. Responsibilities fall into several activity areas:
Overview of Roles and Activities
» Development of upstream and midstream supplier network to stock and promote program qualifying equipment;
» Program outreach including development and distribution of program materials in collaboration with PECO and upstream and midstream allies;
» Rebate processing: fulfillment house to receive, review and verify applications; and pay rebates; » Program performance tracking and improvement: including tracking availability of qualifying
products, identification of new products, and other opportunities to improve the program; » Reporting: including reporting of program activities to meet regulatory and internal requirements,
in particular progress toward program goals; and » Lighting responsibilities: recruiting, negotiating and coordinating with manufacturers and retailers
for products, incentives, data and pricing.
The program is designed so that customers can easily submit rebate applications on their own. However, equipment suppliers and contractors are instrumental in achieving program success. Using the rebates and ENERGY STAR® quality assurance as selling points, these allies can increase sales of qualifying equipment. They can further assist by aiding in the submittal of the rebate application.
Through the PECO Smart Home Rebates program, PECO will educate local dealers and contractors about program procedures and benefits. PECO may conduct seminars to familiarize participating dealers and contractors with the structure and procedures of the program. Handouts will likely include specific information about rebate schedules and lists of qualifying high-efficiency models.
Education Overview
Consumer education will be combined with program awareness activities. Through the use of point of purchase promotional materials, bill inserts, newsletters, on-line information, and direct mail, customers will receive educational information regarding the benefits of and opportunities to save money on energy efficiency upgrades.
Program Issues, Risks, and Risk Management Strategies
The use of prescriptive rebates for a specific list of measures is an approach including Phase I Plan with a long history among utility-sponsored energy efficiency programs. The major risk for performance of this program is that customer adoption of efficient lighting, appliances and HVAC equipment decreases. Other program risks toward achieving savings goals exist if the TRM deemed savings are further revised downward.
Marketing Strategy
PECO will administer the Smart Home Rebates program through a CSP who has experience in promoting efficient products through utility rebate and instant discount programs. In particular, the CSP will have experience working with upstream suppliers; ensuring that in-store information is current, accurate and prominently displayed; processing rebate applications; and ensuring that payment is made for qualifying measures that meet the program requirements. Major marketing initiatives are anticipated to include potentially all major media forms such as radio, Internet ads, newspaper, and sponsorship of major events.
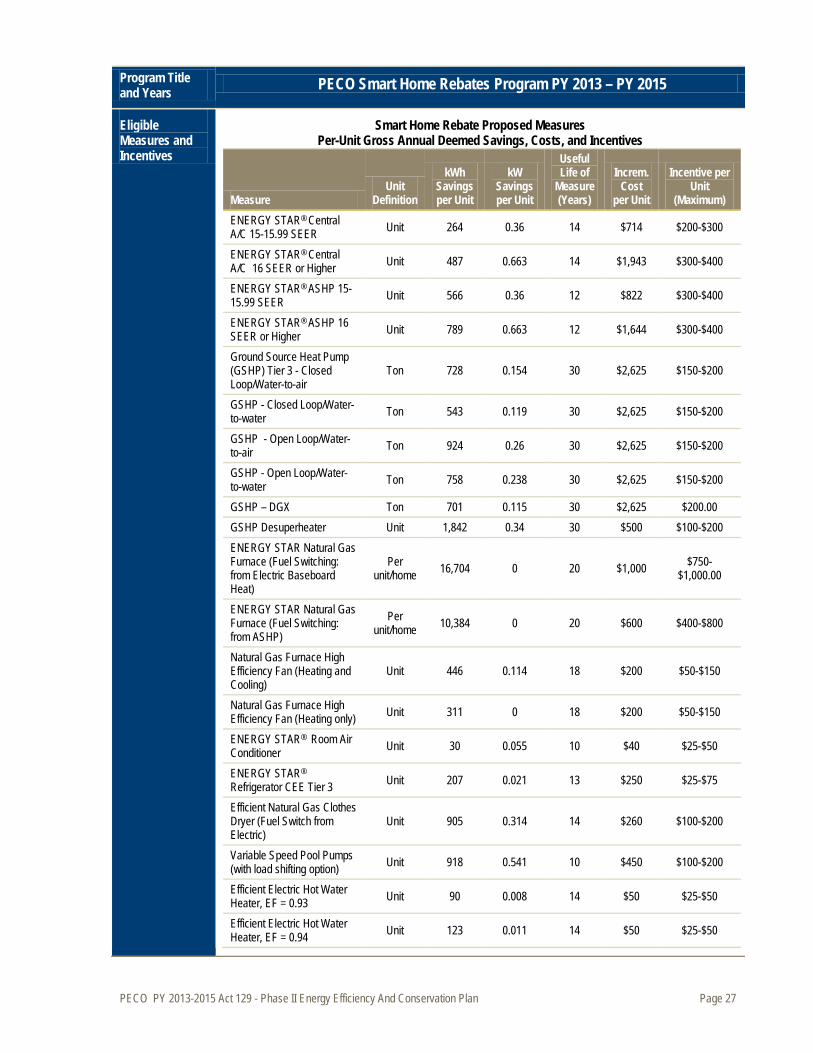
PECO PY 2013-2015 Act 129 - Phase II Energy Efficiency And Conservation Plan Page 27
Program Title and Years PECO Smart Home Rebates Program PY 2013 – PY 2015
Eligible Measures and Incentives
Smart Home Rebate Proposed Measures Per-Unit Gross Annual Deemed Savings, Costs, and Incentives
Measure Unit
Definition
kWh Savings per Unit
kW Savings per Unit
Useful Life of
Measure (Years)
Increm. Cost
per Unit
Incentive per Unit
(Maximum) ENERGY STAR® Central A/C 15-15.99 SEER Unit 264 0.36 14 $714 $200-$300
ENERGY STAR® Central A/C 16 SEER or Higher Unit 487 0.663 14 $1,943 $300-$400
ENERGY STAR® ASHP 15-15.99 SEER Unit 566 0.36 12 $822 $300-$400
ENERGY STAR® ASHP 16 SEER or Higher Unit 789 0.663 12 $1,644 $300-$400
Ground Source Heat Pump (GSHP) Tier 3 - Closed Loop/Water-to-air
Ton 728 0.154 30 $2,625 $150-$200
GSHP - Closed Loop/Water-to-water Ton 543 0.119 30 $2,625 $150-$200
GSHP - Open Loop/Water-to-air Ton 924 0.26 30 $2,625 $150-$200
GSHP - Open Loop/Water-to-water Ton 758 0.238 30 $2,625 $150-$200
GSHP – DGX Ton 701 0.115 30 $2,625 $200.00 GSHP Desuperheater Unit 1,842 0.34 30 $500 $100-$200 ENERGY STAR Natural Gas Furnace (Fuel Switching: from Electric Baseboard Heat)
Per unit/home 16,704 0 20 $1,000 $750-
$1,000.00
ENERGY STAR Natural Gas Furnace (Fuel Switching: from ASHP)
Per unit/home 10,384 0 20 $600 $400-$800
Natural Gas Furnace High Efficiency Fan (Heating and Cooling)
Unit 446 0.114 18 $200 $50-$150
Natural Gas Furnace High Efficiency Fan (Heating only) Unit 311 0 18 $200 $50-$150
ENERGY STAR® Room Air Conditioner Unit 30 0.055 10 $40 $25-$50
ENERGY STAR® Refrigerator CEE Tier 3 Unit 207 0.021 13 $250 $25-$75
Efficient Natural Gas Clothes Dryer (Fuel Switch from Electric)
Unit 905 0.314 14 $260 $100-$200
Variable Speed Pool Pumps (with load shifting option) Unit 918 0.541 10 $450 $100-$200
Efficient Electric Hot Water Heater, EF = 0.93 Unit 90 0.008 14 $50 $25-$50
Efficient Electric Hot Water Heater, EF = 0.94 Unit 123 0.011 14 $50 $25-$50
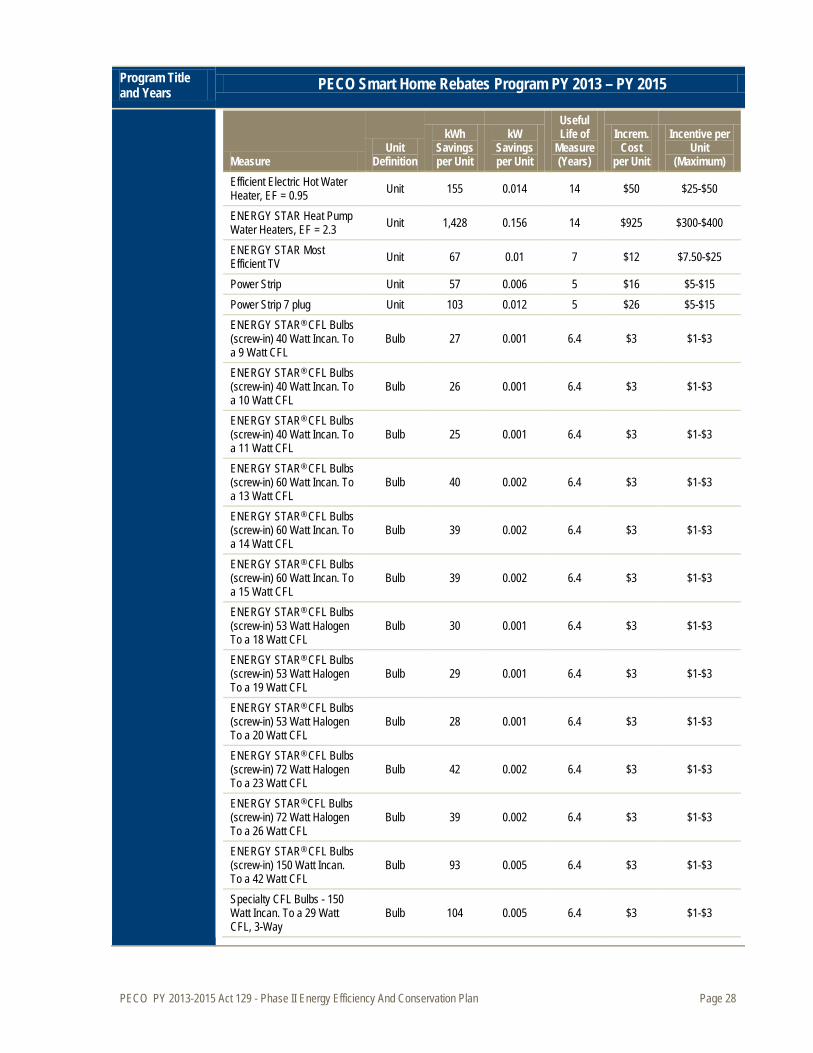
PECO PY 2013-2015 Act 129 - Phase II Energy Efficiency And Conservation Plan Page 28
Program Title and Years PECO Smart Home Rebates Program PY 2013 – PY 2015
Measure Unit
Definition
kWh Savings per Unit
kW Savings per Unit
Useful Life of
Measure (Years)
Increm. Cost
per Unit
Incentive per Unit
(Maximum) Efficient Electric Hot Water Heater, EF = 0.95 Unit 155 0.014 14 $50 $25-$50
ENERGY STAR Heat Pump Water Heaters, EF = 2.3 Unit 1,428 0.156 14 $925 $300-$400
ENERGY STAR Most Efficient TV Unit 67 0.01 7 $12 $7.50-$25
Power Strip Unit 57 0.006 5 $16 $5-$15 Power Strip 7 plug Unit 103 0.012 5 $26 $5-$15 ENERGY STAR® CFL Bulbs (screw-in) 40 Watt Incan. To a 9 Watt CFL
Bulb 27 0.001 6.4 $3 $1-$3
ENERGY STAR® CFL Bulbs (screw-in) 40 Watt Incan. To a 10 Watt CFL
Bulb 26 0.001 6.4 $3 $1-$3
ENERGY STAR® CFL Bulbs (screw-in) 40 Watt Incan. To a 11 Watt CFL
Bulb 25 0.001 6.4 $3 $1-$3
ENERGY STAR® CFL Bulbs (screw-in) 60 Watt Incan. To a 13 Watt CFL
Bulb 40 0.002 6.4 $3 $1-$3
ENERGY STAR® CFL Bulbs (screw-in) 60 Watt Incan. To a 14 Watt CFL
Bulb 39 0.002 6.4 $3 $1-$3
ENERGY STAR® CFL Bulbs (screw-in) 60 Watt Incan. To a 15 Watt CFL
Bulb 39 0.002 6.4 $3 $1-$3
ENERGY STAR® CFL Bulbs (screw-in) 53 Watt Halogen To a 18 Watt CFL
Bulb 30 0.001 6.4 $3 $1-$3
ENERGY STAR® CFL Bulbs (screw-in) 53 Watt Halogen To a 19 Watt CFL
Bulb 29 0.001 6.4 $3 $1-$3
ENERGY STAR® CFL Bulbs (screw-in) 53 Watt Halogen To a 20 Watt CFL
Bulb 28 0.001 6.4 $3 $1-$3
ENERGY STAR® CFL Bulbs (screw-in) 72 Watt Halogen To a 23 Watt CFL
Bulb 42 0.002 6.4 $3 $1-$3
ENERGY STAR® CFL Bulbs (screw-in) 72 Watt Halogen To a 26 Watt CFL
Bulb 39 0.002 6.4 $3 $1-$3
ENERGY STAR® CFL Bulbs (screw-in) 150 Watt Incan. To a 42 Watt CFL
Bulb 93 0.005 6.4 $3 $1-$3
Specialty CFL Bulbs - 150 Watt Incan. To a 29 Watt CFL, 3-Way
Bulb 104 0.005 6.4 $3 $1-$3
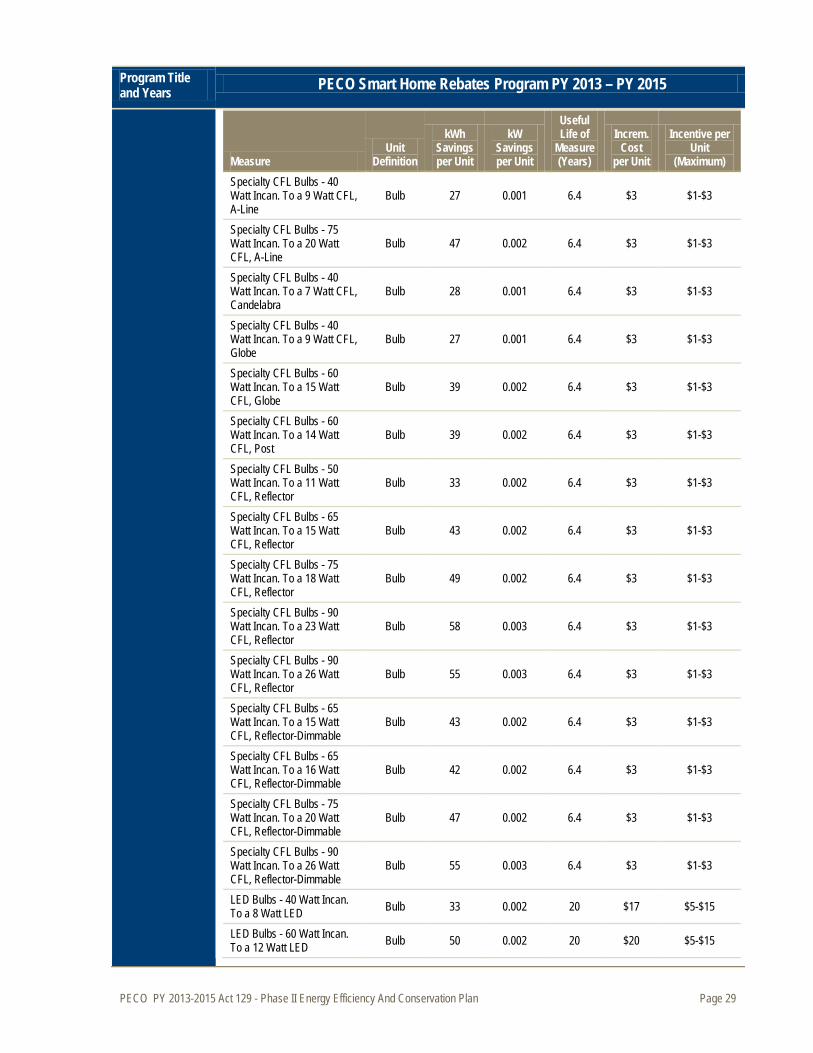
PECO PY 2013-2015 Act 129 - Phase II Energy Efficiency And Conservation Plan Page 29
Program Title and Years PECO Smart Home Rebates Program PY 2013 – PY 2015
Measure Unit
Definition
kWh Savings per Unit
kW Savings per Unit
Useful Life of
Measure (Years)
Increm. Cost
per Unit
Incentive per Unit
(Maximum) Specialty CFL Bulbs - 40 Watt Incan. To a 9 Watt CFL, A-Line
Bulb 27 0.001 6.4 $3 $1-$3
Specialty CFL Bulbs - 75 Watt Incan. To a 20 Watt CFL, A-Line
Bulb 47 0.002 6.4 $3 $1-$3
Specialty CFL Bulbs - 40 Watt Incan. To a 7 Watt CFL, Candelabra
Bulb 28 0.001 6.4 $3 $1-$3
Specialty CFL Bulbs - 40 Watt Incan. To a 9 Watt CFL, Globe
Bulb 27 0.001 6.4 $3 $1-$3
Specialty CFL Bulbs - 60 Watt Incan. To a 15 Watt CFL, Globe
Bulb 39 0.002 6.4 $3 $1-$3
Specialty CFL Bulbs - 60 Watt Incan. To a 14 Watt CFL, Post
Bulb 39 0.002 6.4 $3 $1-$3
Specialty CFL Bulbs - 50 Watt Incan. To a 11 Watt CFL, Reflector
Bulb 33 0.002 6.4 $3 $1-$3
Specialty CFL Bulbs - 65 Watt Incan. To a 15 Watt CFL, Reflector
Bulb 43 0.002 6.4 $3 $1-$3
Specialty CFL Bulbs - 75 Watt Incan. To a 18 Watt CFL, Reflector
Bulb 49 0.002 6.4 $3 $1-$3
Specialty CFL Bulbs - 90 Watt Incan. To a 23 Watt CFL, Reflector
Bulb 58 0.003 6.4 $3 $1-$3
Specialty CFL Bulbs - 90 Watt Incan. To a 26 Watt CFL, Reflector
Bulb 55 0.003 6.4 $3 $1-$3
Specialty CFL Bulbs - 65 Watt Incan. To a 15 Watt CFL, Reflector-Dimmable
Bulb 43 0.002 6.4 $3 $1-$3
Specialty CFL Bulbs - 65 Watt Incan. To a 16 Watt CFL, Reflector-Dimmable
Bulb 42 0.002 6.4 $3 $1-$3
Specialty CFL Bulbs - 75 Watt Incan. To a 20 Watt CFL, Reflector-Dimmable
Bulb 47 0.002 6.4 $3 $1-$3
Specialty CFL Bulbs - 90 Watt Incan. To a 26 Watt CFL, Reflector-Dimmable
Bulb 55 0.003 6.4 $3 $1-$3
LED Bulbs - 40 Watt Incan. To a 8 Watt LED Bulb 33 0.002 20 $17 $5-$15
LED Bulbs - 60 Watt Incan. To a 12 Watt LED Bulb 50 0.002 20 $20 $5-$15
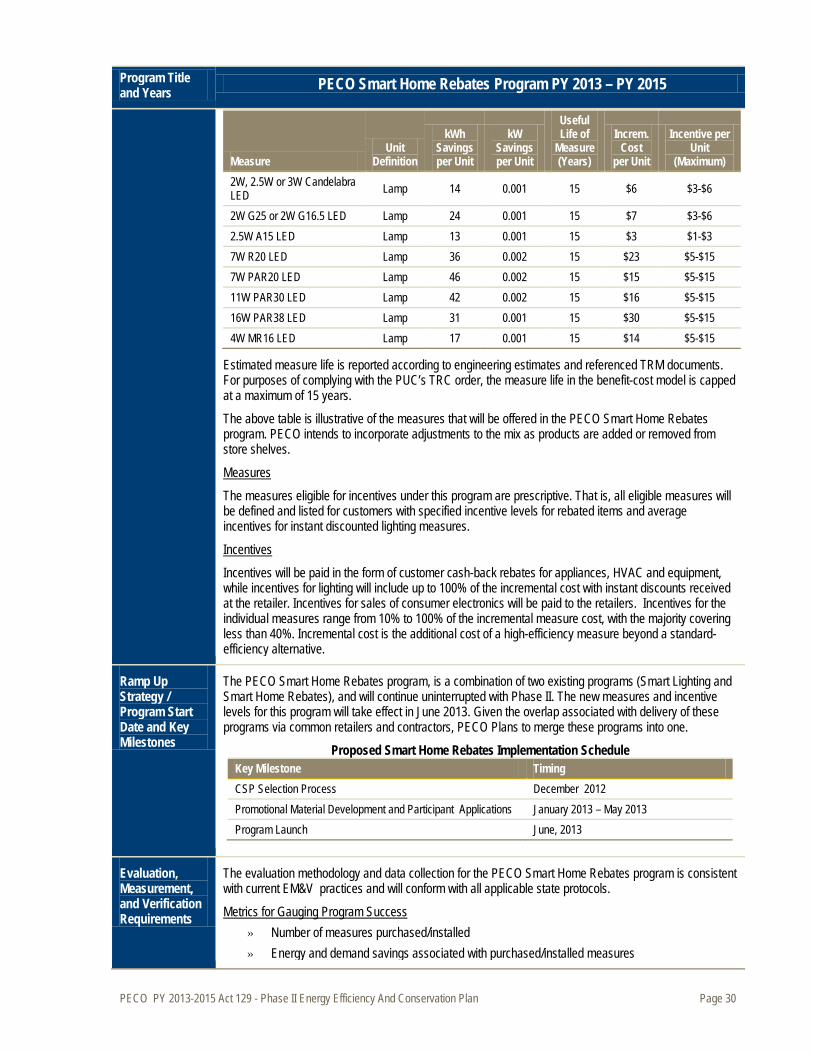
PECO PY 2013-2015 Act 129 - Phase II Energy Efficiency And Conservation Plan Page 30
Program Title and Years PECO Smart Home Rebates Program PY 2013 – PY 2015
Measure Unit
Definition
kWh Savings per Unit
kW Savings per Unit
Useful Life of
Measure (Years)
Increm. Cost
per Unit
Incentive per Unit
(Maximum) 2W, 2.5W or 3W Candelabra LED Lamp 14 0.001 15 $6 $3-$6
2W G25 or 2W G16.5 LED Lamp 24 0.001 15 $7 $3-$6 2.5W A15 LED Lamp 13 0.001 15 $3 $1-$3 7W R20 LED Lamp 36 0.002 15 $23 $5-$15 7W PAR20 LED Lamp 46 0.002 15 $15 $5-$15 11W PAR30 LED Lamp 42 0.002 15 $16 $5-$15 16W PAR38 LED Lamp 31 0.001 15 $30 $5-$15 4W MR16 LED Lamp 17 0.001 15 $14 $5-$15
Estimated measure life is reported according to engineering estimates and referenced TRM documents. For purposes of complying with the PUC’s TRC order, the measure life in the benefit-cost model is capped at a maximum of 15 years. The above table is illustrative of the measures that will be offered in the PECO Smart Home Rebates program. PECO intends to incorporate adjustments to the mix as products are added or removed from store shelves.
The measures eligible for incentives under this program are prescriptive. That is, all eligible measures will be defined and listed for customers with specified incentive levels for rebated items and average incentives for instant discounted lighting measures.
Measures
Incentives will be paid in the form of customer cash-back rebates for appliances, HVAC and equipment, while incentives for lighting will include up to 100% of the incremental cost with instant discounts received at the retailer. Incentives for sales of consumer electronics will be paid to the retailers. Incentives for the individual measures range from 10% to 100% of the incremental measure cost, with the majority covering less than 40%. Incremental cost is the additional cost of a high-efficiency measure beyond a standard-efficiency alternative.
Incentives
Ramp Up Strategy / Program Start Date and Key Milestones
The PECO Smart Home Rebates program, is a combination of two existing programs (Smart Lighting and Smart Home Rebates), and will continue uninterrupted with Phase II. The new measures and incentive levels for this program will take effect in June 2013. Given the overlap associated with delivery of these programs via common retailers and contractors, PECO Plans to merge these programs into one.
Proposed Smart Home Rebates Implementation Schedule Key Milestone Timing CSP Selection Process December 2012 Promotional Material Development and Participant Applications January 2013 – May 2013 Program Launch June, 2013
Evaluation, Measurement, and Verification Requirements
The evaluation methodology and data collection for the PECO Smart Home Rebates program is consistent with current EM&V practices and will conform with all applicable state protocols.
» Number of measures purchased/installed Metrics for Gauging Program Success
» Energy and demand savings associated with purchased/installed measures
PECO PY 2013-2015 Act 129 - Phase II Energy Efficiency And Conservation Plan Page 31
Program Title and Years PECO Smart Home Rebates Program PY 2013 – PY 2015
» Customer satisfaction with the program and the products » Program implementation costs incurred » Program cost effectiveness » Increase in number and variety of suppliers who stock qualified products
» Impact Evaluation Data Collection Approaches
o Tracking system data for all measures o Review of projects to verify installation, efficiency level, system size, and operation as
reported compared to assumed TRM values. » Process Evaluation—Evaluation of program design and implementation will be conducted by
gathering and analyzing data through a variety of surveys and interviews, including: o Surveys of target market customers (participants and nonparticipants) o Surveys and interviews of retailers, contractors, and service providers who participate
and/or promote the program o Interviews with the implementation CSP and PECO program staff o Review of program documents and tracking system data
Gross impacts for demand and energy will be verified for the two categories of measures in this program—deemed and partially deemed. These categories are currently defined by the existing TRM and approved interim TRM protocols. Values for deemed measures are applicable to residential lighting and appliances and HVAC during the program period after the end of the useful life of the replacement equipment. Appliance and HVAC measures are also partially deemed due to the unspecified baseline values for the remaining useful life of the replaced equipment. Savings assumptions will be verified through follow-up phone interviews with program participants. The participant surveys will cover the following:
Impact Evaluation Methodology
» Persistence (e.g., are the measures still installed?)
» HVAC, appliance, and lighting rebated measures installed
» Other changes to the home that affect energy usage such as changes in occupancy, or changes in house size
The participant surveys will be completed after the end of the program year.
Additionally, as discussed above, to enable a more rigorous assessment of LED lighting savings and help ensure customer satisfaction, the Navigant team will conduct two different evaluation tasks focusing on 1) residential LED usage and 2) LED lamp lighting quality.
Program process evaluation is important to ensure that the program is operating as intended and to provide information that can enable improvements in both the program design and implementation. Process evaluation will be undertaken and conducted throughout the program by the implementation and EM&V contractors engaged by PECO.
Process Evaluation Methodology
To build on the findings of previous evaluations and identify changes and possible trends, the process evaluation will be based on information from participant and nonparticipant market actors, including PECO program and Planning staff; vendors, contractors, and suppliers; and customers.
Process evaluations focus on program implementation issues including administration, program-delivery mechanisms, ongoing activities, and perceptions and responses of participants and nonparticipants. Process evaluation will assess customer understanding, attitudes about, and satisfaction with the program and with PECO’s other educational activities and materials associated with other PECO EE programs. The evaluations will make use of survey data collected by the implementation and EM&V contractors. These

PECO PY 2013-2015 Act 129 - Phase II Energy Efficiency And Conservation Plan Page 32
Program Title and Years PECO Smart Home Rebates Program PY 2013 – PY 2015
surveys will include both customers known to have participated in the program and eligible nonparticipants.
The EM&V contractor will use this information to help PECO assess the performance of the program design and delivery of the products and services featured in the program, including effectiveness of the marketing and educational materials, effectiveness of advertising and promotional campaigns and messages and effectiveness of the trade ally involvement.
Post-surveys with participating customers will be used to estimate the net-to-gross ratio accounting for free-riders and free-drivers. Customers will be asked to provide information regarding whether they would have purchased the rebated items without the PECO promotion, whether they installed the items, and whether they subsequently purchased additional rebate-eligible items at full cost. This outline of the self-report methodology for the assessment of net impacts describes only the basic approach. The selected EM&V contractor will develop the complete Plan that ensures the appropriate measurement of savings in compliance with industry and State protocols.
Administrative Requirements
PECO will administer the Smart Home Rebates program through a CSP implementation contractor. PECO’s role will be to ensure that:
» The CSP performs all the activities associated with delivery of all components of the program » PECO’s educational and program messages are delivered accurately and clearly to ensure the
effectiveness of program delivery and maximize customer satisfaction with the program » The PECO and ENERGY STAR® brands are being handled appropriately
The program is expected to operate with the following staffing mix:
PECO Smart Home Rebates Program—Proposed PECO / CSP Staffing Staff FTE PECO Program Management 1.1
External staffing levels will be provided upon the completion of the CSP selection process.
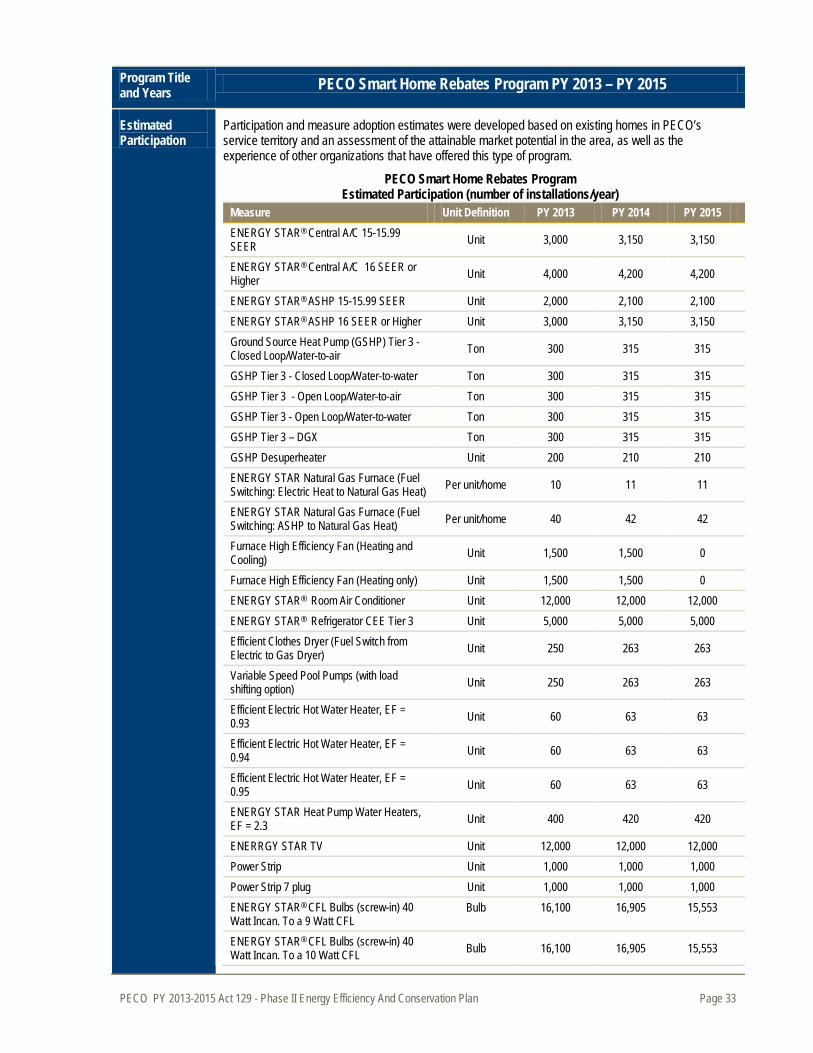
PECO PY 2013-2015 Act 129 - Phase II Energy Efficiency And Conservation Plan Page 33
Program Title and Years PECO Smart Home Rebates Program PY 2013 – PY 2015
Estimated Participation
Participation and measure adoption estimates were developed based on existing homes in PECO’s service territory and an assessment of the attainable market potential in the area, as well as the experience of other organizations that have offered this type of program.
PECO Smart Home Rebates Program Estimated Participation (number of installations/year)
Measure Unit Definition PY 2013 PY 2014 PY 2015 ENERGY STAR® Central A/C 15-15.99 SEER Unit 3,000 3,150 3,150
ENERGY STAR® Central A/C 16 SEER or Higher Unit 4,000 4,200 4,200
ENERGY STAR® ASHP 15-15.99 SEER Unit 2,000 2,100 2,100 ENERGY STAR® ASHP 16 SEER or Higher Unit 3,000 3,150 3,150 Ground Source Heat Pump (GSHP) Tier 3 - Closed Loop/Water-to-air Ton 300 315 315
GSHP Tier 3 - Closed Loop/Water-to-water Ton 300 315 315 GSHP Tier 3 - Open Loop/Water-to-air Ton 300 315 315 GSHP Tier 3 - Open Loop/Water-to-water Ton 300 315 315 GSHP Tier 3 – DGX Ton 300 315 315 GSHP Desuperheater Unit 200 210 210 ENERGY STAR Natural Gas Furnace (Fuel Switching: Electric Heat to Natural Gas Heat) Per unit/home 10 11 11
ENERGY STAR Natural Gas Furnace (Fuel Switching: ASHP to Natural Gas Heat) Per unit/home 40 42 42
Furnace High Efficiency Fan (Heating and Cooling) Unit 1,500 1,500 0
Furnace High Efficiency Fan (Heating only) Unit 1,500 1,500 0 ENERGY STAR® Room Air Conditioner Unit 12,000 12,000 12,000 ENERGY STAR® Refrigerator CEE Tier 3 Unit 5,000 5,000 5,000 Efficient Clothes Dryer (Fuel Switch from Electric to Gas Dryer) Unit 250 263 263
Variable Speed Pool Pumps (with load shifting option) Unit 250 263 263
Efficient Electric Hot Water Heater, EF = 0.93 Unit 60 63 63
Efficient Electric Hot Water Heater, EF = 0.94 Unit 60 63 63
Efficient Electric Hot Water Heater, EF = 0.95 Unit 60 63 63
ENERGY STAR Heat Pump Water Heaters, EF = 2.3 Unit 400 420 420
ENERRGY STAR TV Unit 12,000 12,000 12,000 Power Strip Unit 1,000 1,000 1,000 Power Strip 7 plug Unit 1,000 1,000 1,000 ENERGY STAR® CFL Bulbs (screw-in) 40 Watt Incan. To a 9 Watt CFL
Bulb 16,100 16,905 15,553
ENERGY STAR® CFL Bulbs (screw-in) 40 Watt Incan. To a 10 Watt CFL Bulb 16,100 16,905 15,553
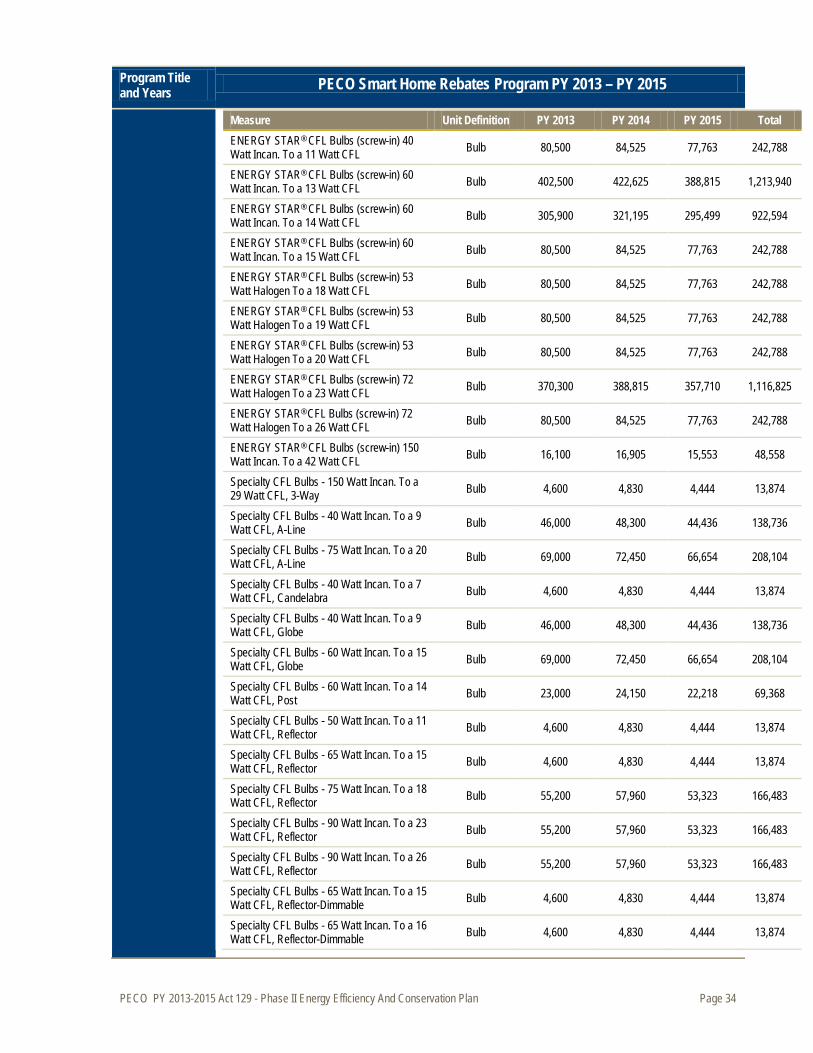
PECO PY 2013-2015 Act 129 - Phase II Energy Efficiency And Conservation Plan Page 34
Program Title and Years PECO Smart Home Rebates Program PY 2013 – PY 2015
Measure Unit Definition PY 2013 PY 2014 PY 2015 Total ENERGY STAR® CFL Bulbs (screw-in) 40 Watt Incan. To a 11 Watt CFL Bulb 80,500 84,525 77,763 242,788
ENERGY STAR® CFL Bulbs (screw-in) 60 Watt Incan. To a 13 Watt CFL Bulb 402,500 422,625 388,815 1,213,940
ENERGY STAR® CFL Bulbs (screw-in) 60 Watt Incan. To a 14 Watt CFL Bulb 305,900 321,195 295,499 922,594
ENERGY STAR® CFL Bulbs (screw-in) 60 Watt Incan. To a 15 Watt CFL Bulb 80,500 84,525 77,763 242,788
ENERGY STAR® CFL Bulbs (screw-in) 53 Watt Halogen To a 18 Watt CFL Bulb 80,500 84,525 77,763 242,788
ENERGY STAR® CFL Bulbs (screw-in) 53 Watt Halogen To a 19 Watt CFL Bulb 80,500 84,525 77,763 242,788
ENERGY STAR® CFL Bulbs (screw-in) 53 Watt Halogen To a 20 Watt CFL Bulb 80,500 84,525 77,763 242,788
ENERGY STAR® CFL Bulbs (screw-in) 72 Watt Halogen To a 23 Watt CFL Bulb 370,300 388,815 357,710 1,116,825
ENERGY STAR® CFL Bulbs (screw-in) 72 Watt Halogen To a 26 Watt CFL Bulb 80,500 84,525 77,763 242,788
ENERGY STAR® CFL Bulbs (screw-in) 150 Watt Incan. To a 42 Watt CFL Bulb 16,100 16,905 15,553 48,558
Specialty CFL Bulbs - 150 Watt Incan. To a 29 Watt CFL, 3-Way Bulb 4,600 4,830 4,444 13,874
Specialty CFL Bulbs - 40 Watt Incan. To a 9 Watt CFL, A-Line Bulb 46,000 48,300 44,436 138,736
Specialty CFL Bulbs - 75 Watt Incan. To a 20 Watt CFL, A-Line Bulb 69,000 72,450 66,654 208,104
Specialty CFL Bulbs - 40 Watt Incan. To a 7 Watt CFL, Candelabra Bulb 4,600 4,830 4,444 13,874
Specialty CFL Bulbs - 40 Watt Incan. To a 9 Watt CFL, Globe Bulb 46,000 48,300 44,436 138,736
Specialty CFL Bulbs - 60 Watt Incan. To a 15 Watt CFL, Globe Bulb 69,000 72,450 66,654 208,104
Specialty CFL Bulbs - 60 Watt Incan. To a 14 Watt CFL, Post Bulb 23,000 24,150 22,218 69,368
Specialty CFL Bulbs - 50 Watt Incan. To a 11 Watt CFL, Reflector Bulb 4,600 4,830 4,444 13,874
Specialty CFL Bulbs - 65 Watt Incan. To a 15 Watt CFL, Reflector Bulb 4,600 4,830 4,444 13,874
Specialty CFL Bulbs - 75 Watt Incan. To a 18 Watt CFL, Reflector Bulb 55,200 57,960 53,323 166,483
Specialty CFL Bulbs - 90 Watt Incan. To a 23 Watt CFL, Reflector Bulb 55,200 57,960 53,323 166,483
Specialty CFL Bulbs - 90 Watt Incan. To a 26 Watt CFL, Reflector Bulb 55,200 57,960 53,323 166,483
Specialty CFL Bulbs - 65 Watt Incan. To a 15 Watt CFL, Reflector-Dimmable Bulb 4,600 4,830 4,444 13,874
Specialty CFL Bulbs - 65 Watt Incan. To a 16 Watt CFL, Reflector-Dimmable Bulb 4,600 4,830 4,444 13,874
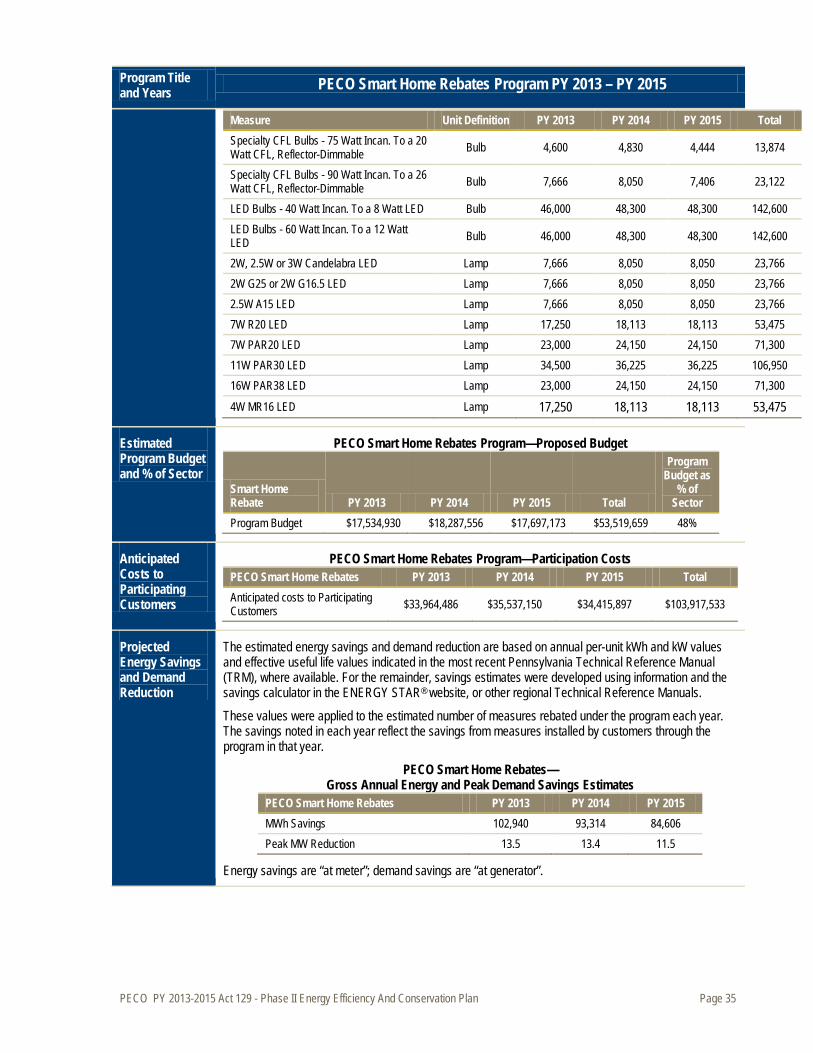
PECO PY 2013-2015 Act 129 - Phase II Energy Efficiency And Conservation Plan Page 35
Program Title and Years PECO Smart Home Rebates Program PY 2013 – PY 2015
Measure Unit Definition PY 2013 PY 2014 PY 2015 Total Specialty CFL Bulbs - 75 Watt Incan. To a 20 Watt CFL, Reflector-Dimmable Bulb 4,600 4,830 4,444 13,874
Specialty CFL Bulbs - 90 Watt Incan. To a 26 Watt CFL, Reflector-Dimmable Bulb 7,666 8,050 7,406 23,122
LED Bulbs - 40 Watt Incan. To a 8 Watt LED Bulb 46,000 48,300 48,300 142,600 LED Bulbs - 60 Watt Incan. To a 12 Watt LED Bulb 46,000 48,300 48,300 142,600
2W, 2.5W or 3W Candelabra LED Lamp 7,666 8,050 8,050 23,766 2W G25 or 2W G16.5 LED Lamp 7,666 8,050 8,050 23,766 2.5W A15 LED Lamp 7,666 8,050 8,050 23,766 7W R20 LED Lamp 17,250 18,113 18,113 53,475 7W PAR20 LED Lamp 23,000 24,150 24,150 71,300 11W PAR30 LED Lamp 34,500 36,225 36,225 106,950 16W PAR38 LED Lamp 23,000 24,150 24,150 71,300
4W MR16 LED Lamp 17,250 18,113 18,113 53,475
Estimated Program Budget and % of Sector
PECO Smart Home Rebates Program—Proposed Budget
Smart Home Rebate PY 2013 PY 2014 PY 2015 Total
Program Budget as
% of Sector
Program Budget $17,534,930 $18,287,556 $17,697,173 $53,519,659 48%
Anticipated Costs to Participating Customers
PECO Smart Home Rebates Program—Participation Costs PECO Smart Home Rebates PY 2013 PY 2014 PY 2015 Total Anticipated costs to Participating Customers $33,964,486 $35,537,150 $34,415,897 $103,917,533
Projected Energy Savings and Demand Reduction
The estimated energy savings and demand reduction are based on annual per-unit kWh and kW values and effective useful life values indicated in the most recent Pennsylvania Technical Reference Manual (TRM), where available. For the remainder, savings estimates were developed using information and the savings calculator in the ENERGY STAR® website, or other regional Technical Reference Manuals.
These values were applied to the estimated number of measures rebated under the program each year. The savings noted in each year reflect the savings from measures installed by customers through the program in that year.
PECO Smart Home Rebates— Gross Annual Energy and Peak Demand Savings Estimates
PECO Smart Home Rebates PY 2013 PY 2014 PY 2015 MWh Savings 102,940 93,314 84,606 Peak MW Reduction 13.5 13.4 11.5
Energy savings are “at meter”; demand savings are “at generator”.
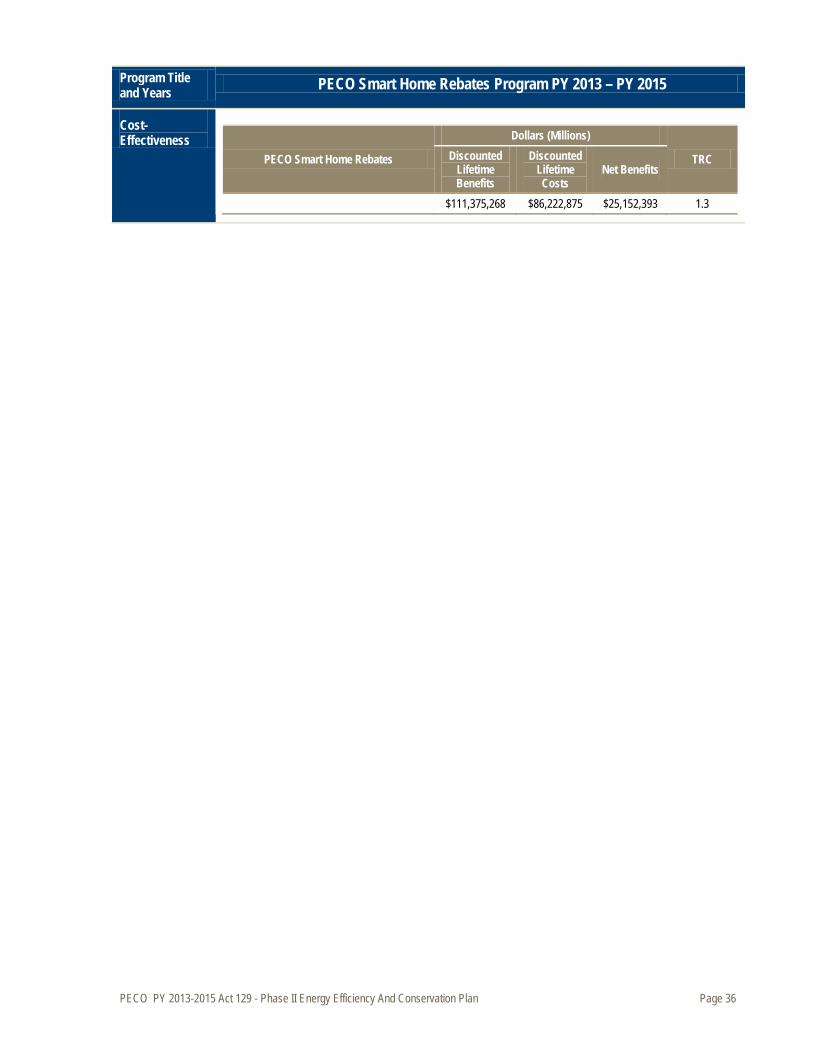
PECO PY 2013-2015 Act 129 - Phase II Energy Efficiency And Conservation Plan Page 36
Program Title and Years PECO Smart Home Rebates Program PY 2013 – PY 2015
Cost-Effectiveness
PECO Smart Home Rebates
Dollars (Millions)
TRC Discounted Lifetime Benefits
Discounted Lifetime Costs
Net Benefits
$111,375,268 $86,222,875 $25,152,393 1.3

PECO PY 2013-2015 Act 129 - Phase II Energy Efficiency And Conservation Plan Page 37
3.2.1.3 EE Program 3 — PECO Smart House Call
Program Title and Years PECO Smart House Call PY 2013 – PY 2015
Objectives PECO proposes to launch the PECO Smart House Call program as part of a long-term strategy to address comprehensive energy efficiency improvements for existing residential buildings. The PECO Smart House Call (SHC) program will achieve several objectives:
» Improve customer understanding of how their homes use energy and how they can use it more efficiently;
» Procure immediate energy savings through installation of low-cost energy-saving measures at the time of the initial on-site Assessment or Audit;
» Encourage installation of additional recommended energy-saving measures with additional incentives; and
» Advance the development of a trained, building science focused, professional retrofit workforce
Target Market The SHC program targets all PECO residential electric customers with single-family detached, attached, and multi-family buildings with less than four residentially metered units. Additionally, a comprehensive Audit will be targeted toward PECO residential electric heat (Rate RH) customers.The target market also includes building retro-fit contractors who provide quality audits and installation of recommended measures. PECO Plans to require that only program approved contractors, be eligible to perform advanced diagnostic testing.
Program Description
The SHC program will be a two-tier approach, with a general walk-through Assessment available to all PECO residential electric customers, and a comprehensive Audit available only to PECO Residential Electric Heat (Rate RH) customers that will be performed by an auditor. There are additional measures available to customers who have received this Audit that may be installed by any qualified trade ally subject to verification by a program approved inspector prior to rebate approval.
The services the SHC will provide, including in-home audits and referrals to program qualified contractors, aim to help PECO customers gain a better understanding of their home energy use and achieve savings while also improving the comfort of their homes. The SHC program involves an on-site energy Assessment or Audit with direct install of low-cost measures. Rebates for eligible building envelope retrofits will be available only for electric heated homes that have completed an Audit through the SHC program. Customers will be made aware of other efficient measures rebated through other PECO Smart Ideas programs, and they will be encouraged to participate in these measures as well. From a customer perspective, the presentation of program participation opportunities will strive for simplicity and comprehensiveness, so customers simply are focusing on what improvements they need to make for their home, not necessarily with which program the identified measure is associated. The program is designed to be flexible and adaptable to the many possible ways customers decide to participate in energy efficiency retrofits, which may include on-line, and in-person Assessments or Audits.
Customers will have the ability to call PECO’s selected CSP customer service agents to learn more about the program, and more broadly discuss the opportunities in their home and gauge if the homeowner is a good candidate for the energy efficiency measures rebated by the program. For example, some customers may already have converted to efficient lighting and low-flow water devices; as such, the real opportunity is to address major building envelope or HVAC upgrades. The purpose of the phone consultations will be to help customers select the best channel for program participation that maximizes returns for all parties.
PECO will offer all residential electric customers an opportunity to receive a discounted energy assessment of their home. PECO proposes to use trained energy auditors, who may be either CSP staff, or program approved independent auditors, to perform on-site testing and inspection, assess the energy performance of the house, and provide customers with itemized lists of energy efficiency improvements, their anticipated costs and savings, along with information on financial resources available to help defray first-costs. There are two types of audits available:
On-Site Energy Audits and Assessments
PECO PY 2013-2015 Act 129 - Phase II Energy Efficiency And Conservation Plan Page 38
Program Title and Years PECO Smart House Call PY 2013 – PY 2015
» Comprehensive Energy Audit — These are comprehensive, on-site inspections with diagnostic testing (i.e. blower door, combustion safety) used to identify and quantify energy efficiency opportunities. Audit reports are provided containing specific recommendations, including expected costs, energy savings, and resource referrals. The audit will cover the entire home, including the air flow through the home, insulation, heating and cooling systems, lighting and major appliances. At the time of the audit, direct install of efficient lighting and low-flow water saving devices may be installed. PECO Plans to utilize the services of the selected CSP for provision of the audits by program approved certified auditors. The CSP will explore the market potential to utilize program qualified independent participating contractors to conduct the initial audit. Given PECO is focused for this program on electricity reduction, this more expensive program delivery channel will be restricted just to PECO residential electric heating customers.
» Energy Assessment — These are on-site “walk-through” assessments conducted by trained energy auditors designed to identify common opportunities for energy efficiency improvements. No diagnostic testing (i.e. blower door, combustion safety) are conducted, though auditors can identify the majority of major energy-savings opportunities. At the time of the initial energy assessment, the auditor will educate the customer and direct-install efficient lighting products and other low-cost measures. Representative measures are envisioned to include efficient lighting, smart plug strips as appropriate, and low flow water saving devices, for those homes with electric hot water heating. The assessment will conclude with a review of key findings, and suggestions of which identified opportunities are the most logical, and referral to program qualified trade allies to follow-up and do the installations. The energy assessment option will be available for all PECO residential electric customers regardless of primary space heating fuel type.
During every Assessment or Audit, the auditor will install, at no additional charge to the customer, a package of low-cost measures to improve the energy efficiency of homes. These measures may include efficient lighting, low-flow water devices, hot water heater pipe wrap and smart power strips.
Direct Installation of Measures
Providing customers with help in implementing the recommendations is key to the success of the program in achieving comprehensive, whole house savings. This includes offering resources that include both financial incentives and technical assistance. Incentives will be offered for the installation of weatherization measures recommended during an Audit, to improve home heating and cooling efficiency in electric heated homes. PECO will contract with a CSP who will manage and oversee that auditors comply with program requirements and the installed measures were installed and diagnostic testing shows shell improvement.
Assistance with Additional Measure Installations
PECO will make use of auditors who are qualified to perform the comprehensive, technical audits and contractors knowledgeable about measures recommended in the audit report. This will be achieved through development of relationships with contracting trade allies. Under the program, PECO will, through its CSP:
Workforce Training and Participation
» Provide training to ensure the CSP’s employees or contractors demonstrate an understanding of the SHC program and of building science principles, which are the basis of the energy audits.
» Ensure that the CSP employees and/or contactors are familiar with and meet all program procedures and requirements. The CSP will conduct inspections on a portion of assessments and all rebate qualifying audits who installed additional energy saving measures not included in the initial audit to ensure that program QA/QC protocols are being met.
Implementation Strategy
The SHC program provides participants with a whole-house energy Assessment or Audit and provides the infrastructure for homeowners to follow through and complete home energy efficiency improvements.
PECO PY 2013-2015 Act 129 - Phase II Energy Efficiency And Conservation Plan Page 39
Program Title and Years PECO Smart House Call PY 2013 – PY 2015
The SHC is designed to achieve increased awareness and adoption of energy efficiency opportunities by residential electric customers through participating contractors. CSPs will implement the program on PECO’s behalf by providing:
Channels for Program Delivery
» Trained, accredited energy auditors to conduct the in-home inspection and testing, install low-cost measures, prepare and deliver customer reports with specific energy-efficiency recommendations that include estimated cost, savings, and resources for obtaining rebates/loans, and follow-up visits to verify savings.
» Recruitment and training of Assessors, Auditors, and installation trade allies: verifying that all participating contractors on the qualified list have appropriate credentials, testing equipment and data analysis software to assess homes, conduct building diagnostic testing, install measures, and report evaluation grade energy savings results.
» Recruitment and management of a network of accredited trade allies who will install additional measures recommended by the auditors but not installed during the audit (e.g., weatherization measures).
» Market based contractor education. The CSP may provide opportunities for any interested contractor to receive education on best practices and program terms and conditions to also become a qualified contractor.
» Software to analyze and record Assessment or Audit results, enable development of recommendations, and track customer actions.
The implementation CSP will have full responsibility for delivery of all aspects of the program. Responsibilities fall into several activity areas:
Overview of Roles and Activities
» Audits and customer reports: ensuring that auditors prepare reports that are comprehensive and comply with program guidelines.
» Recruitment and training of audit and installation contractors: verifying that all participating contractors on the qualified list have appropriate testing equipment and data analysis software to assess homes, install measures, and report evaluation grade energy savings results.
» Monitoring of auditors and contractors: including scheduling of home audit appointments and verification of inspections and measure installations.
» Telephone consultations: to screen customers for program eligibility, and create a pipeline of assessments and audits.
» Program marketing: including design, development and distribution of program materials in collaboration with PECO and promotional campaigns in collaboration with upstream participants.
» Program education and outreach: including design, development of promotional campaigns and coordination with PECO.
» Lead generation: may include neighborhood canvassing, outbound calls, and customer usage analysis.
» Incentive processing: pay eligible rebates. » Program activity tracking: including tracking of audit requests, audit data collection, customer
actions, and incentive tracking. » Reporting: development of documentation to meet program reporting requirements.
Education is a major component of the SHC program. Education will be both publicly distributed and customer-specific.
Education Overview
» The customer reports generated, following the energy evaluations, provide one-on-one educational opportunities. Using data from their own homes, residential customers will learn how
PECO PY 2013-2015 Act 129 - Phase II Energy Efficiency And Conservation Plan Page 40
Program Title and Years PECO Smart House Call PY 2013 – PY 2015
they use energy and how they can use it more wisely. » The workforce education provides an opportunity to educate equipment and HVAC contractors
about the benefits of energy efficiency and about the program.
There are already several programs in place at the State level that provide qualified residents with loans and/or rebates to enable action on many of the measures commonly recommended in the SHC audit reports, as well as qualified contractor referral listings. These resources are available to PECO customers in addition to the benefits provided by this and other PECO programs. For example, Keystone HELP® offers loans to Pennsylvania-resident homeowners.
Applicable Collaborative Resources
Furthermore, the SHC program offers an opportunity to promote economic development by taking advantage of the creation of a trained workforce of qualified energy auditors and improvement contractors located within the community.
Program Issues, Risks, and Risk Management Strategies
The PECO Smart House Call model, while in effect for over a decade nationally, is still a challenging and complicated program to design, launch, and implement cost-effectively consistent with the constraints of the total resource cost test. The following are common barriers to success and strategies to surmount them:
» Contractor Participation—A limited supply of qualified contractors with the skills to diagnose and market whole-house energy efficiency improvements can limit program potential. A solution is the development of a local network of qualified professionals to provide audit and installation services and to promote the program to residential energy customers. PECO, through its CSP, may: o Offer technical training to participating home improvement trade contractors, including
classroom and field sessions to cover building science principles, diagnostic testing and/or installation best practices.
o Offer sales and business process education to help contractors succeed in selling and delivering home performance services, including procedures for quality assurance, employee training, and understanding program incentives or financing.
» Consumer Incentives—The up-front costs of making the recommended improvements may limit customer participation in the program or delay projects unless customers have a way to get them done and to pay for them. o The SHC program offers rebates directly through the program or in collaboration with other
PECO Smart Ideas programs. o Additionally, having easy access to contractors who can complete the work provides
incentive to act on the Assessment or Audit recommendations. Offering referrals or a list of qualified/participating contractors can be a help.
o PECO may also explore the possibility of working with independent financial institutions to help promote the program and refer customers to these lending institutions for access to financing for home energy efficiency improvements.
» Marketing and Consumer Education—Consumers may not be familiar with the whole-house approach and the benefits it can provide for improving comfort, as well as saving energy. Marketing activities can educate them about the benefits. o PECO will communicate information and make customers aware through bill inserts, web
site, or some targeted direct mail. These tactics can help educate homeowners about the benefits of the whole-house approach to energy improvements and how they can take advantage of the program.
o More creative ideas could include home improvement show exhibits, seminars, targeted direct mail, and door-to-door canvassing.
o The CSP will work to develop and enlist the help of participating contractors to promote and educate customers about the program.
PECO PY 2013-2015 Act 129 - Phase II Energy Efficiency And Conservation Plan Page 41
Program Title and Years PECO Smart House Call PY 2013 – PY 2015
» Quality Assurance—Consumers should be assured that the program offers reliable, high quality services. The program will have a quality assurance Plan to aid delivery of the program services, provide protocols for contractor reporting and support program evaluation.
The proposed SHC program addresses these design and implementation issues, incorporating program components and activities that directly address the potential impediments to success.
Ramp Up Strategy
The SHC program may require considerable ramp up activity prior to launch of program services to residential customers. Because of the structured nature of the program, significant infrastructure needs to be built, including:
» Auditor/installation contractor education—Courses that provide the CSP’s employees or contractors with skills qualifying them to perform the audits must be developed and scheduled; the existing commercial availability of training and even certification (e.g., by BPI and RESNET) provides the option of simply arranging for courses to be offered starting immediately upon approval of program and continuing through program operation.
» Qualified auditor/installation contractor referral mechanism—The CSP must develop an adequate network of contractors to perform the SHC services and have a mechanism for ensuring that they are qualified to do the work.
» Audit scheduling and project tracking procedures—Procedures need to be developed regarding how and who a customer will contact to request an Assessment or Audit, how the scheduling of appointments will be handled, and how the information about the audit, the recommendations, and the installations will be tracked.
» Incentive processing procedures—The SHC will provide incentives of different types, direct installations and cash rebates. Procedures that establish eligibility and documentation requirements and incentive levels/formulas will be in place prior to program launch.
Marketing Strategy
The SHC program will rely on a combination of the following (but not limited to) key marketing strategies to drive participation in the program:
» Contractor word-of-mouth promotion » Direct mail campaign targeted to specific geographic areas » Utility newsletter bill inserts » Program web page » Neighborhood canvassing
As the program is ramping up, direct mail campaigns may be employed to kick-start program participation. Direct mail campaigns allow for targeting by geographic area and customer and therefore allow greater control of workflow than mass media efforts. Bill inserts, mass media advertising, and press releases to targeted areas may be used on a limited basis to ramp up production as needed. The program Web page also will promote the availability of the program to interested customers.

PECO PY 2013-2015 Act 129 - Phase II Energy Efficiency And Conservation Plan Page 42
Program Title and Years PECO Smart House Call PY 2013 – PY 2015
Eligible Measures and Incentives The SHC program will directly install low-cost energy-saving measures during energy Assessments or
Audits and will provide rebates to influence customer installation of recommended weatherization, HVAC and appliance measures. Some of the SHC measures (e.g. air sealing, insulation) are only eligible for homes whose primary heating source is an electric form of space that had a program qualified audit or homes with electric water heating (low flow water devices) so as to maximize electric savings per program dollar.
Measures
PECO Smart House Call Measures Per Unit Gross Annual Savings and Cost Per-Unit Savings
Measure Unit
Definition
kWh Savings per Unit
kW Savings per Unit
Useful Life of Measure (Years)
Increm. Cost per
Unit
Incentive per Unit
(Maximum) ASHP (Duct Sealing) Home 362 0.112 6 $311 $200-$300 ASHP (Maintenance) Home 603 0.187 12 $175 $75-$150 Air Sealing - Electric SH Home 1,151 0.037 15 $415 $250-$350 Attic Ceiling Insulation R-49 from R19 - Electric SH Home 428 0.085 25 $800 $400-$500
Addl. Wall Insulation, R-19, blown-in - Electric SH Home 639 0.106 25 $500 $400-$500
Low Flow Showerheads - Elec WH Unit 355 0.033 9 $0 $0
Kitchen Faucet Aerators - Elec WH Unit 46 0.01 12 $0 $0
Bathroom Faucet Aerators - Elec WH Unit 46 0.003 12 $0 $0
Pipe Wrap - Elec WH Unit 93 0.009 13 $15 $0
Advanced Power Strips Unit 57 0.013 5 $0 $0 ENERGY STAR CFL Bulbs (screw-in) 60 Watt Incan. To a 13 Watt CFL
Bulb 40 0.002 6 $0 $0
ENERGY STAR CFL Bulbs (screw-in) 53 Watt Halogen To a 19 Watt CFL
Bulb 29 0.001 6 $0 $0
ENERGY STAR CFL Bulbs (screw-in) 53 Watt Halogen To a 20 Watt CFL
Bulb 28 0.001 6 $0 $0
ENERGY STAR CFL Bulbs (screw-in) 72 Watt Halogen To a 23 Watt CFL
Bulb 42 0.002 6 $0 $0
Estimated measure life is reported according to engineering estimates and referenced TRM documents. For purposes of complying with the PUC’s TRC order, the measure life in the benefit-cost model is capped at a maximum of 15 years Some of the measures in this program may be provided free of charge to participants (e.g. CFLs, low flow water devices). As such, consistent with the PA PUC TRC order, the costs associated with purchase and installation of the efficient equipment are treated as a program delivery cost, as such, no incremental costs or incentive values are detailed.
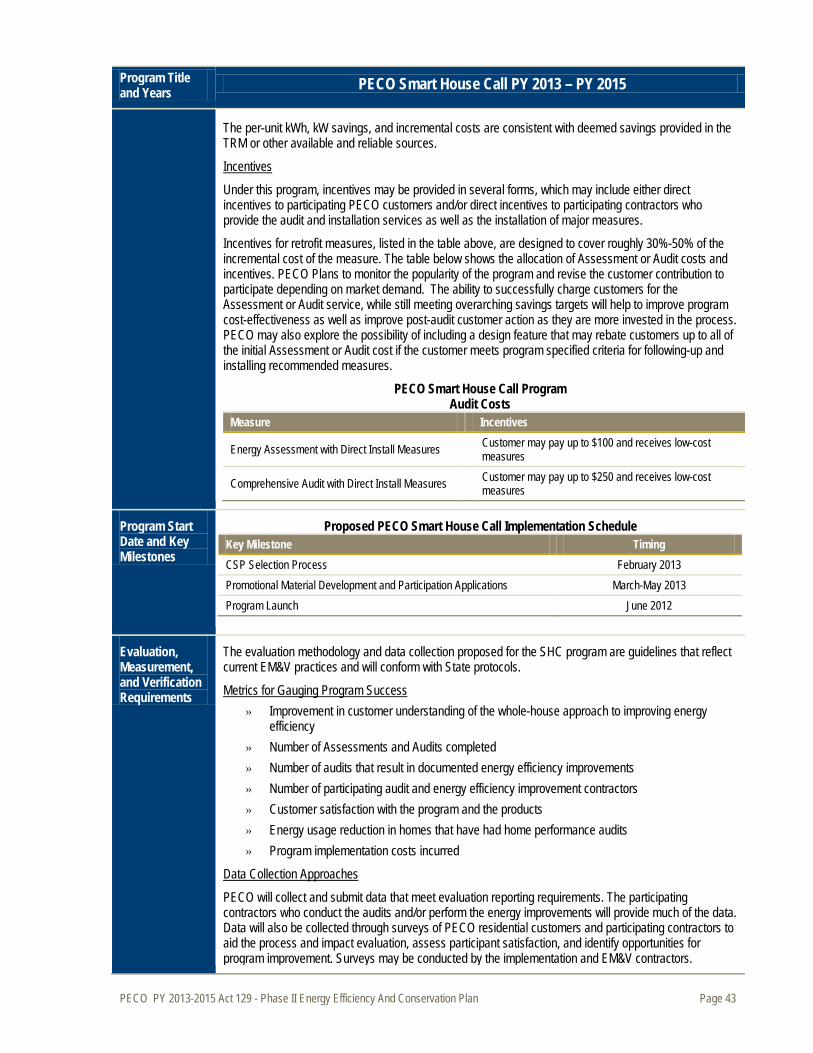
PECO PY 2013-2015 Act 129 - Phase II Energy Efficiency And Conservation Plan Page 43
Program Title and Years PECO Smart House Call PY 2013 – PY 2015
The per-unit kWh, kW savings, and incremental costs are consistent with deemed savings provided in the TRM or other available and reliable sources.
Under this program, incentives may be provided in several forms, which may include either direct incentives to participating PECO customers and/or direct incentives to participating contractors who provide the audit and installation services as well as the installation of major measures.
Incentives
Incentives for retrofit measures, listed in the table above, are designed to cover roughly 30%-50% of the incremental cost of the measure. The table below shows the allocation of Assessment or Audit costs and incentives. PECO Plans to monitor the popularity of the program and revise the customer contribution to participate depending on market demand. The ability to successfully charge customers for the Assessment or Audit service, while still meeting overarching savings targets will help to improve program cost-effectiveness as well as improve post-audit customer action as they are more invested in the process. PECO may also explore the possibility of including a design feature that may rebate customers up to all of the initial Assessment or Audit cost if the customer meets program specified criteria for following-up and installing recommended measures.
PECO Smart House Call Program Audit Costs
Measure Incentives
Energy Assessment with Direct Install Measures Customer may pay up to $100 and receives low-cost measures
Comprehensive Audit with Direct Install Measures Customer may pay up to $250 and receives low-cost measures
Program Start Date and Key Milestones
Proposed PECO Smart House Call Implementation Schedule Key Milestone Timing CSP Selection Process February 2013 Promotional Material Development and Participation Applications March-May 2013 Program Launch June 2012
Evaluation, Measurement, and Verification Requirements
The evaluation methodology and data collection proposed for the SHC program are guidelines that reflect current EM&V practices and will conform with State protocols.
» Improvement in customer understanding of the whole-house approach to improving energy efficiency
Metrics for Gauging Program Success
» Number of Assessments and Audits completed » Number of audits that result in documented energy efficiency improvements » Number of participating audit and energy efficiency improvement contractors » Customer satisfaction with the program and the products » Energy usage reduction in homes that have had home performance audits » Program implementation costs incurred
PECO will collect and submit data that meet evaluation reporting requirements. The participating contractors who conduct the audits and/or perform the energy improvements will provide much of the data. Data will also be collected through surveys of PECO residential customers and participating contractors to aid the process and impact evaluation, assess participant satisfaction, and identify opportunities for program improvement. Surveys may be conducted by the implementation and EM&V contractors.
Data Collection Approaches

PECO PY 2013-2015 Act 129 - Phase II Energy Efficiency And Conservation Plan Page 44
Program Title and Years PECO Smart House Call PY 2013 – PY 2015
Customer billing data prior to and following program participation will be required to assess energy use for additional measures and improvement opportunities, and assess and/or verify savings for the payment of customer incentives.
The overall goal of the impact evaluation will be to certify program savings. This will be achieved by verifying that installations occurred and persist, that the program is properly reporting savings and that documentation matches the reporting database.
Impact Evaluation Methodology
The EM&V contractor will determine the appropriate means of estimating savings attributable to the program; that is, net savings, including both free-ridership and spillover. Spillover may be particularly relevant to this program. Because the major thrust of the program is to encourage customers to think about the home as an entire system and consider how the structure, from roof to basement and all their energy-using equipment, affects the energy performance of the home, it would not be surprising to find that customers continue to make additional energy-related improvements on their own (i.e., without PECO incentives) after participation in SHC.
Telephone as well as potential on-site surveys of participants will be conducted to assess report delivery, installation and continued use of free measures, influence of the program on the decision to implement recommended and free measures, as well as satisfaction levels, barriers to implementation and participation and other process questions.
The SHC program is a relatively complex program, involving home visits, direct installation of measures, delivery of an audit report with additional recommendations, and even subsequent installations with either the CSP implementation contractor or other contractors. Process evaluations throughout the program will be critical to ensure that the program is operating as intended and to provide information that can enable improvements in both the program design and delivery of services.
Process Evaluation Methodology
Process evaluations will assess customer understanding, attitude about, and satisfaction with the program and with PECO’s other educational activities and materials. They will obtain feedback from the contractors who perform installations and audits. The evaluations will make use of survey data collected by the implementation and EM&V contractors. Process evaluation will be conducted throughout the program by the implementation and EM&V contractors selected by PECO.
Administrative Requirements
PECO will administer the SHC program through a CSP implementation contractor. PECO’s role will be to ensure that:
» The CSP performs all required program activities and provides monitoring and tracking required to track program progress
» PECO’s educational and program messages are delivered accurately and clearly to ensure the effectiveness of program delivery and maximize customer satisfaction with the program
The program is expected to operate with the following PECO/Contract staffing mix:
PECO Smart House Call Program – Proposed Staffing Staff FTE PECO Program Management 1.1
External staffing levels will be provided upon the completion of the CSP selection process.
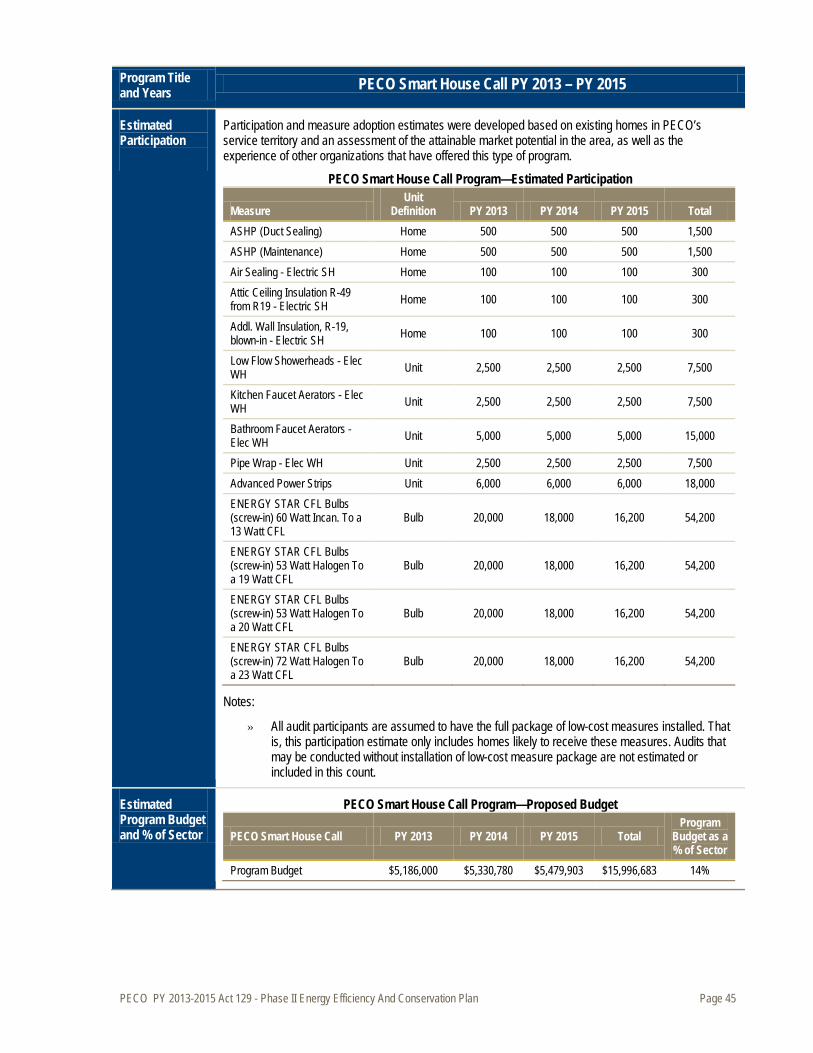
PECO PY 2013-2015 Act 129 - Phase II Energy Efficiency And Conservation Plan Page 45
Program Title and Years PECO Smart House Call PY 2013 – PY 2015
Estimated Participation
Participation and measure adoption estimates were developed based on existing homes in PECO’s service territory and an assessment of the attainable market potential in the area, as well as the experience of other organizations that have offered this type of program.
PECO Smart House Call Program—Estimated Participation
Measure Unit
Definition PY 2013 PY 2014 PY 2015 Total ASHP (Duct Sealing) Home 500 500 500 1,500 ASHP (Maintenance) Home 500 500 500 1,500 Air Sealing - Electric SH Home 100 100 100 300 Attic Ceiling Insulation R-49 from R19 - Electric SH Home 100 100 100 300
Addl. Wall Insulation, R-19, blown-in - Electric SH Home 100 100 100 300
Low Flow Showerheads - Elec WH Unit 2,500 2,500 2,500 7,500
Kitchen Faucet Aerators - Elec WH Unit 2,500 2,500 2,500 7,500
Bathroom Faucet Aerators - Elec WH Unit 5,000 5,000 5,000 15,000
Pipe Wrap - Elec WH Unit 2,500 2,500 2,500 7,500 Advanced Power Strips Unit 6,000 6,000 6,000 18,000 ENERGY STAR CFL Bulbs (screw-in) 60 Watt Incan. To a 13 Watt CFL
Bulb 20,000 18,000 16,200 54,200
ENERGY STAR CFL Bulbs (screw-in) 53 Watt Halogen To a 19 Watt CFL
Bulb 20,000 18,000 16,200 54,200
ENERGY STAR CFL Bulbs (screw-in) 53 Watt Halogen To a 20 Watt CFL
Bulb 20,000 18,000 16,200 54,200
ENERGY STAR CFL Bulbs (screw-in) 72 Watt Halogen To a 23 Watt CFL
Bulb 20,000 18,000 16,200 54,200
Notes:
» All audit participants are assumed to have the full package of low-cost measures installed. That is, this participation estimate only includes homes likely to receive these measures. Audits that may be conducted without installation of low-cost measure package are not estimated or included in this count.
Estimated Program Budget and % of Sector
PECO Smart House Call Program—Proposed Budget
PECO Smart House Call PY 2013 PY 2014 PY 2015 Total Program
Budget as a % of Sector
Program Budget $5,186,000 $5,330,780 $5,479,903 $15,996,683 14%
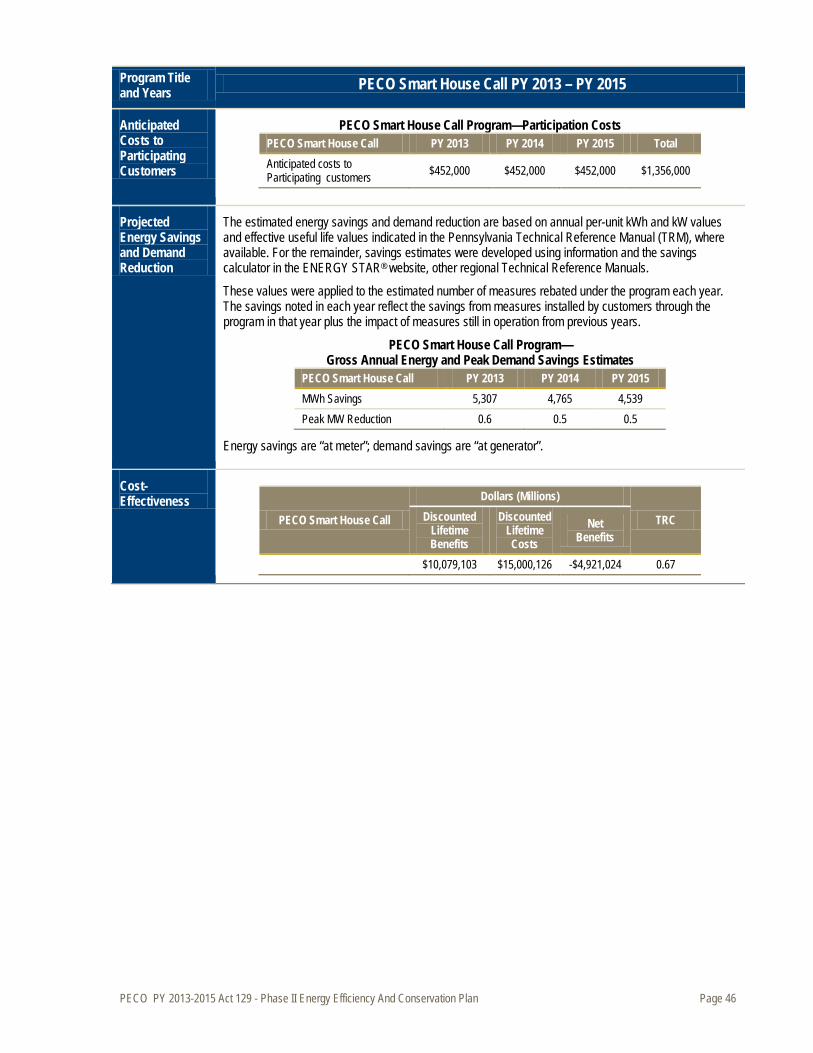
PECO PY 2013-2015 Act 129 - Phase II Energy Efficiency And Conservation Plan Page 46
Program Title and Years PECO Smart House Call PY 2013 – PY 2015
Anticipated Costs to Participating Customers
PECO Smart House Call Program—Participation Costs PECO Smart House Call PY 2013 PY 2014 PY 2015 Total Anticipated costs to Participating customers $452,000 $452,000 $452,000 $1,356,000
Projected Energy Savings and Demand Reduction
The estimated energy savings and demand reduction are based on annual per-unit kWh and kW values and effective useful life values indicated in the Pennsylvania Technical Reference Manual (TRM), where available. For the remainder, savings estimates were developed using information and the savings calculator in the ENERGY STAR® website, other regional Technical Reference Manuals.
These values were applied to the estimated number of measures rebated under the program each year. The savings noted in each year reflect the savings from measures installed by customers through the program in that year plus the impact of measures still in operation from previous years.
PECO Smart House Call Program— Gross Annual Energy and Peak Demand Savings Estimates
PECO Smart House Call PY 2013 PY 2014 PY 2015 MWh Savings 5,307 4,765 4,539 Peak MW Reduction 0.6 0.5 0.5
Energy savings are “at meter”; demand savings are “at generator”.
Cost-Effectiveness
PECO Smart House Call
Dollars (Millions)
TRC Discounted Lifetime Benefits
Discounted Lifetime Costs
Net Benefits
$10,079,103 $15,000,126 -$4,921,024 0.67

PECO PY 2013-2015 Act 129 - Phase II Energy Efficiency And Conservation Plan Page 47
3.2.1.4 EE Program 4 — PECO Smart Builder Rebates
Program Title and Years PECO Smart Builder Rebates PY 2013 – PY 2015
Objectives The purpose of the PECO Smart Builder Rebates program is to improve the energy efficiency of newly constructed homes in the PECO service territory.
The program has the following objectives: » Make contributions toward achievement of PECO’s energy savings goals. » Influence residential new construction practices in the PECO service territory to help advance
improved building science and energy efficiency design/build practices.
Target Market The target market for participation in the program is residential architects, builders, and contractors (i.e. those most responsible for design, construction and equipment decisions). All newly constructed residentially metered single-family electrically heated homes in PECO’s service territory using ENERGY STAR air-source or ground source heat pumps as their primary source of heat are eligible to participate.
Program Description
The PECO Smart Builder Rebates program is intended to accelerate the adoption of energy efficiency in the design, construction and operation of new single-family homes by leveraging the EPA’s ENERGY STAR® Homes certification. The eligibility criteria will be based on new homes being at least 15% above the 2009 IECC code and meeting all ENERGY STAR version 3.0 requirements., and/or whatever future minimum threshold is established by the EPA. The program will provide education and rebates to inform and encourage architects, builders, and home buyers on the benefits of ENERGY STAR® homes as well as requirements for gaining certification.
The program has the following components:
The program will educate residential new construction market stakeholders on energy-efficient home design and construction, and inform them of PECO incentives available for meeting the ENERGY STAR® Homes requirements. Program staff will develop seminars and materials to educate builders on energy-efficient building practices and to address the factors that generally prevent homebuilders’ from incorporating energy efficiency into homes.
Education
The program will offer rebates to new homebuilders to encourage the adoption of ENERGY STAR® recommended design practices and the installation of high-efficiency equipment and shell measures. The proposed incentives are designed to cover roughly 30% of the incremental costs of meeting the ENERGY STAR® standard. Incremental cost is the additional cost of a high-efficiency measure beyond a standard-efficiency alternative. At this time it is envisioned that the incentive will be $400 plus $0.10 per year 1 kWh savings as verified for each home. Rebate levels may change over time depending on market reaction and program participation. Rebates will be paid to the builder.
Rebates
Implementation Strategy
PECO will administer the PECO Smart Builder Rebates program through a CSP. CSPs will implement the program on PECO’s behalf by designing and delivering marketing materials; recruiting and providing education to various stakeholders; providing rebate fulfillment services; and tracking and reporting program activities and achievements toward goals.
Upstream market stakeholders, including the architects, builders, developers, real estate agents, and mortgage lenders will be offered education about energy-efficient home design and construction and associated benefits. They will also have the following roles as delivery channels:
Channels for Program Delivery
» Designers, builders, and developers who participate in training seminars can distinguish themselves to prospective homebuyers as qualified or certified energy-efficient providers.
» Builders and real estate agents educated about the features and advantages of energy-efficient homes will, in-turn, serve as ambassadors for the program promoting these advantages as a

PECO PY 2013-2015 Act 129 - Phase II Energy Efficiency And Conservation Plan Page 48
Program Title and Years PECO Smart Builder Rebates PY 2013 – PY 2015
selling point. » Lenders who understand the benefits of lower energy costs can offer homebuyers larger loan
amounts and/or lower interest rates than they would have otherwise qualified for, towards the purchase of certified energy-efficient homes.
The CSP will have full responsibility for delivery of all aspects of the program. Responsibilities fall into several activity areas:
Overview of Roles and Activities
» Identification and recruitment of upstream market stakeholders for program participation and delivery channel activities.
» Development and operation of educational seminars and materials for designers, builders, developers, appraisers, realtors and lenders.
» Design, development and distribution of program materials in collaboration with PECO. » Support the development and continual training of an independent home energy rater (HERS)
network from which builders will receive independent certification of their new homes meeting ENERGY STAR criteria.
» Receive, review and verify rebate applications and pay rebates. Conduct quality control review of a sample of participating homes to ensure program criteria are being met and submitted HERS ratings (modeled energy savings software files) are consistent with field verified observations.
» Track program performance and all program documentation, including rebate submittals and payments as well as opportunities to improve the program.
» Reporting of program activities to meet regulatory and internal requirements, in particular progress toward program goals.
Education training and demonstration has been shown to be a key component in market transformation. The program will increase awareness of and confidence in the performance and benefits of increased energy efficiency. Emphasis on the additional benefits of comprehensive energy efficiency improvements and continual maintenance to retain savings will demonstrate an overall cost-effectiveness that can be achieved without the need for financial incentives over the long term. Ongoing deployment of these strategies will become “standard” practice by key stakeholders influencing long-term market transformation.
Education Overview
To accomplish this, the program will offer several forms of education: » Education seminars will be held by experts in specific aspects of high-efficiency home design
and construction needed to meet the ENERGY STAR® standard. In addition to teaching key building science principles and basic program elements, these education seminars provide PECO with an excellent opportunity to develop strong relationships and build trust within the design and construction industry.
» PECO will link the training activities with national certification efforts, such as the ENERGY STAR rating system, to provide visibility and continuity. Additional linkages with nationwide certification programs for residential builders, inspectors, lighting designers and continuing education for architects and engineers will be explored.
» Publications with technical information, practical advice, and case study examples may be developed. These will be directed to the design/build/sales community..
The program will leverage program design, marketing and training resources provided by the EPA. The ENERGY STAR® Homes program offers vetted, standardized program design, technical requirements and quality assurance processes, along with support from the EPA with marketing and training materials. . Many homebuyers and new construction industry stakeholders may be already familiar with the ENERGY
Applicable Collaborative Resources
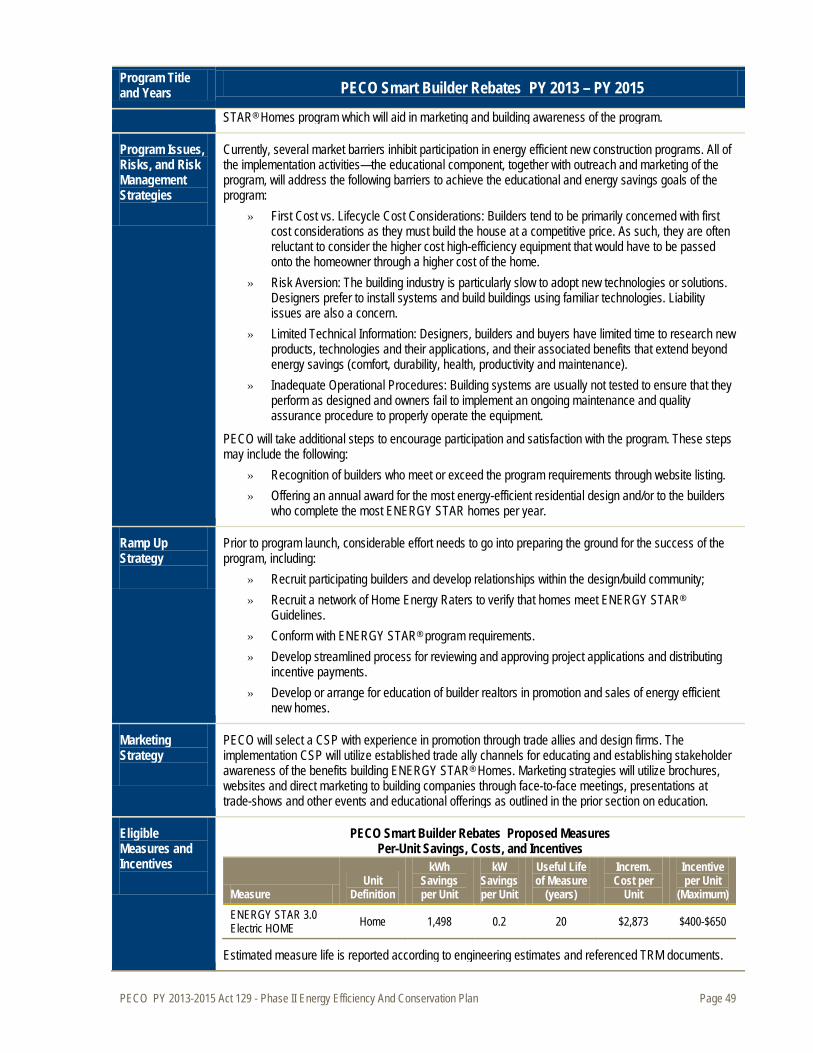
PECO PY 2013-2015 Act 129 - Phase II Energy Efficiency And Conservation Plan Page 49
Program Title and Years PECO Smart Builder Rebates PY 2013 – PY 2015
STAR® Homes program which will aid in marketing and building awareness of the program.
Program Issues, Risks, and Risk Management Strategies
Currently, several market barriers inhibit participation in energy efficient new construction programs. All of the implementation activities—the educational component, together with outreach and marketing of the program, will address the following barriers to achieve the educational and energy savings goals of the program:
» First Cost vs. Lifecycle Cost Considerations: Builders tend to be primarily concerned with first cost considerations as they must build the house at a competitive price. As such, they are often reluctant to consider the higher cost high-efficiency equipment that would have to be passed onto the homeowner through a higher cost of the home.
» Risk Aversion: The building industry is particularly slow to adopt new technologies or solutions. Designers prefer to install systems and build buildings using familiar technologies. Liability issues are also a concern.
» Limited Technical Information: Designers, builders and buyers have limited time to research new products, technologies and their applications, and their associated benefits that extend beyond energy savings (comfort, durability, health, productivity and maintenance).
» Inadequate Operational Procedures: Building systems are usually not tested to ensure that they perform as designed and owners fail to implement an ongoing maintenance and quality assurance procedure to properly operate the equipment.
PECO will take additional steps to encourage participation and satisfaction with the program. These steps may include the following:
» Recognition of builders who meet or exceed the program requirements through website listing. » Offering an annual award for the most energy-efficient residential design and/or to the builders
who complete the most ENERGY STAR homes per year.
Ramp Up Strategy
Prior to program launch, considerable effort needs to go into preparing the ground for the success of the program, including:
» Recruit participating builders and develop relationships within the design/build community; » Recruit a network of Home Energy Raters to verify that homes meet ENERGY STAR®
Guidelines. » Conform with ENERGY STAR® program requirements. » Develop streamlined process for reviewing and approving project applications and distributing
incentive payments. » Develop or arrange for education of builder realtors in promotion and sales of energy efficient
new homes.
Marketing Strategy
PECO will select a CSP with experience in promotion through trade allies and design firms. The implementation CSP will utilize established trade ally channels for educating and establishing stakeholder awareness of the benefits building ENERGY STAR® Homes. Marketing strategies will utilize brochures, websites and direct marketing to building companies through face-to-face meetings, presentations at trade-shows and other events and educational offerings as outlined in the prior section on education.
Eligible Measures and Incentives
PECO Smart Builder Rebates Proposed Measures Per-Unit Savings, Costs, and Incentives
Measure Unit
Definition
kWh Savings per Unit
kW Savings per Unit
Useful Life of Measure
(years)
Increm. Cost per
Unit
Incentive per Unit
(Maximum) ENERGY STAR 3.0 Electric HOME Home 1,498 0.2 20 $2,873 $400-$650
Estimated measure life is reported according to engineering estimates and referenced TRM documents.
PECO PY 2013-2015 Act 129 - Phase II Energy Efficiency And Conservation Plan Page 50
Program Title and Years PECO Smart Builder Rebates PY 2013 – PY 2015
For purposes of complying with the PUC’s TRC order, the measure life in the benefit-cost model is capped at a maximum of 15 years. Depending on the savings per house, the incentive may exceed $650 as the incentive is based on a $400 base incentive plus $0.10 / kWh for year 1 savings.
To encourage participants to take the comprehensive approach, rebates will only be offered for homes that are certified as meeting National ENERGY STAR requirements, rather than individual pieces of equipment or systems. This comprehensive approach avoids “cream skimming” (that is, where participants take only the easiest and most lucrative measures), and reduces lost energy-saving opportunities.
Measures
New residential single family homes with PECO electric as the primary heating source that are certified to ENERGY STAR 3.0 standards and at least 15% more efficient than IECC 2009 code will be eligible for a $400 incentive. Participants also receive a performance bonus of $0.10 per kWh of savings estimated through energy use simulation modeling as an incentive to achieve greater energy savings. The performance bonus also ensures equity in the distribution of incentives by creating a sliding scale based on energy saved, instead of a single prescriptive incentive regardless of project size or energy savings.
Incentives

PECO PY 2013-2015 Act 129 - Phase II Energy Efficiency And Conservation Plan Page 51
Program Title and Years PECO Smart Builder Rebates PY 2013 – PY 2015
Program Start Date and Key Milestones
The following table provides a schedule of anticipated key milestones:
Proposed PECO Smart Builder Rebates Implementation Schedule Key Milestone Timing CSP Selection Process January-April 2013 Promotional Material Development and Participation Applications May-July 2013 Program Launch September 2013
Evaluation, Measurement, and Verification Requirements
The EM&V requirements for this program will conform with established precedents for other PECO programs and broader state protocols. The key issue for evaluation of new construction programs is an assessment of whether promotional and marketing efforts are effective.
» Number of projects completed Metrics for Gauging Program Success
» Satisfaction of home buyers and participating contractors with the program » Energy savings associated with homes built through participation in the program » Receptivity/adoption of energy-efficient building practices by designers, builders, and developers
Data collection will consist of a thorough review of implementation contractor databases, review of energy consumption information, surveys interviews of program participants and non-participants. The data to be gathered for evaluation will likely include the following:
Data Collection Approaches
» Billing and/or metered use data » REM/Rate modeling files submitted by participants » Program tracking system for rebates paid, and home characteristics » Participating customer and contractor surveys » Program implementer/PECO staff interviews » Upstream and homeowner surveys regarding program awareness, satisfaction with the program,
understanding and perceived savings from measures, household characteristics home operation behaviors, program influence on design and construction decisions
» Non-participant surveys to identify barriers to participation » Local weather data
The overall goal of the impact evaluation will be to certify program savings. This will be achieved by verifying that homes meet program requirements through a combination of field and/or phone verification; the program is properly reporting savings and documentation matches reporting database.
Impact Evaluation Methodology
The process evaluation will be coordinated with impact evaluation and will include interviews with program managers, the implementation contractor, home builders, raters, and other market players. These interviews will be conducted to assess the operational conditions of the program and to identify ways to improve the program delivery and participation. These surveys will be enhanced by collecting market data and assessing trends in construction practices and activity. Wherever it is practical and appropriate, evaluation activities will be conducted in conjunction with other utilities and agencies in the state to efficiently utilize resources and help ensure consistency.
Process Evaluation Methodology
Process evaluation activities will focus on program implementation, administration, and delivery. Interviews will be used to determine if the upstream market stakeholders and homeowners are finding the program informational and promotional materials useful.
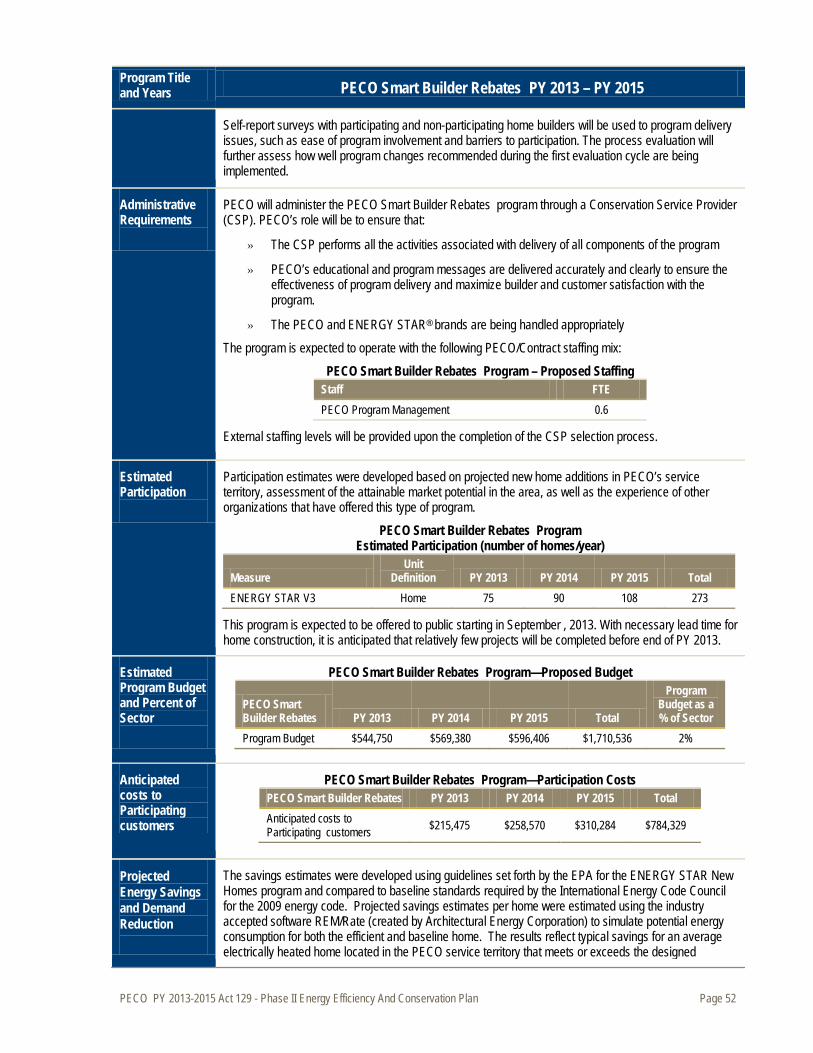
PECO PY 2013-2015 Act 129 - Phase II Energy Efficiency And Conservation Plan Page 52
Program Title and Years PECO Smart Builder Rebates PY 2013 – PY 2015
Self-report surveys with participating and non-participating home builders will be used to program delivery issues, such as ease of program involvement and barriers to participation. The process evaluation will further assess how well program changes recommended during the first evaluation cycle are being implemented.
Administrative Requirements
PECO will administer the PECO Smart Builder Rebates program through a Conservation Service Provider (CSP). PECO’s role will be to ensure that:
» The CSP performs all the activities associated with delivery of all components of the program
» PECO’s educational and program messages are delivered accurately and clearly to ensure the effectiveness of program delivery and maximize builder and customer satisfaction with the program.
» The PECO and ENERGY STAR® brands are being handled appropriately
The program is expected to operate with the following PECO/Contract staffing mix:
PECO Smart Builder Rebates Program – Proposed Staffing Staff FTE PECO Program Management 0.6
External staffing levels will be provided upon the completion of the CSP selection process.
Estimated Participation
Participation estimates were developed based on projected new home additions in PECO’s service territory, assessment of the attainable market potential in the area, as well as the experience of other organizations that have offered this type of program.
PECO Smart Builder Rebates Program Estimated Participation (number of homes/year)
Measure Unit
Definition PY 2013 PY 2014 PY 2015 Total ENERGY STAR V3 Home 75 90 108 273
This program is expected to be offered to public starting in September , 2013. With necessary lead time for home construction, it is anticipated that relatively few projects will be completed before end of PY 2013.
Estimated Program Budget and Percent of Sector
PECO Smart Builder Rebates Program—Proposed Budget
PECO Smart Builder Rebates PY 2013 PY 2014 PY 2015 Total
Program Budget as a % of Sector
Program Budget $544,750 $569,380 $596,406 $1,710,536 2%
Anticipated costs to Participating customers
PECO Smart Builder Rebates Program—Participation Costs PECO Smart Builder Rebates PY 2013 PY 2014 PY 2015 Total Anticipated costs to Participating customers $215,475 $258,570 $310,284 $784,329
Projected Energy Savings and Demand Reduction
The savings estimates were developed using guidelines set forth by the EPA for the ENERGY STAR New Homes program and compared to baseline standards required by the International Energy Code Council for the 2009 energy code. Projected savings estimates per home were estimated using the industry accepted software REM/Rate (created by Architectural Energy Corporation) to simulate potential energy consumption for both the efficient and baseline home. The results reflect typical savings for an average electrically heated home located in the PECO service territory that meets or exceeds the designed
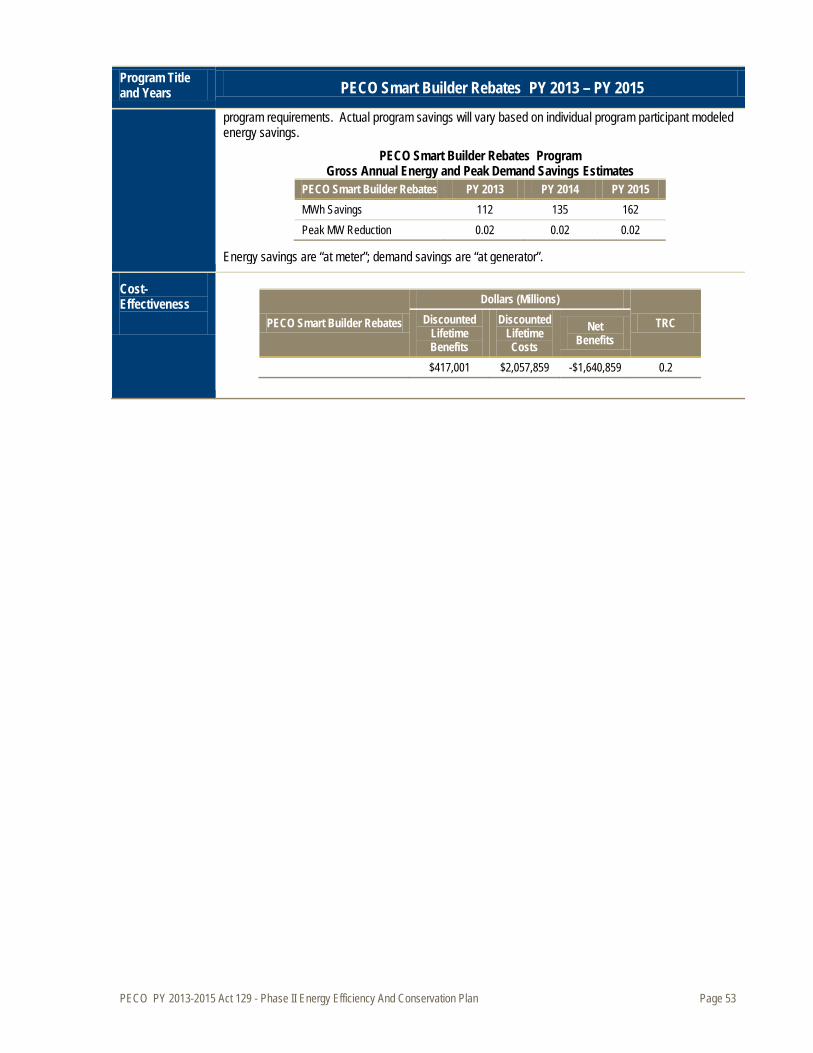
PECO PY 2013-2015 Act 129 - Phase II Energy Efficiency And Conservation Plan Page 53
Program Title and Years PECO Smart Builder Rebates PY 2013 – PY 2015
program requirements. Actual program savings will vary based on individual program participant modeled energy savings.
PECO Smart Builder Rebates Program Gross Annual Energy and Peak Demand Savings Estimates
PECO Smart Builder Rebates PY 2013 PY 2014 PY 2015 MWh Savings 112 135 162 Peak MW Reduction 0.02 0.02 0.02
Energy savings are “at meter”; demand savings are “at generator”.
Cost-Effectiveness
PECO Smart Builder Rebates
Dollars (Millions)
TRC Discounted Lifetime Benefits
Discounted Lifetime Costs
Net Benefits
$417,001 $2,057,859 -$1,640,859 0.2
PECO PY 2013-2015 Act 129 - Phase II Energy Efficiency And Conservation Plan Page 54
3.2.1.5 EE Program 5 — PECO Low-Income Energy Efficiency (LEEP) Program
Program Title and Years PECO Low-Income Energy Efficiency (LEEP) Program PY 2013 – PY 2015
Objectives The purpose of the PECO Low-Income Energy Efficiency Program (LEEP) is to reduce kilowatt hour consumption through education and assistance to eligible residential customers with making their homes more energy efficient. The program builds upon the Low Income Usage Reduction Program (LIURP) objective to make low-income customers’ energy bills more affordable by helping to reduce energy usage.
Target Market The target market for the low-income program is income qualified residents in existing residential units that are provided with electricity by PECO and who are financially responsible for the electric bill payment. Customers must meet the following usage and income eligibility criteria for program participation.
» Market for Component 1: PECO residential customers with a household income at or below 200% of the federal poverty level (FPL) (same as LIURP limit of 200%), plus LEEP requirement of household usage levels that exceed monthly average usage of 600 kWh per month for electric base load (500 kWh for Customer Assistance Program (CAP) rate customers) for non-electric heating customers and 1400 kWh per month for electric heating customers. PECO will focus primarily on residential customers with a household income at or below 150% of the FPL for this program. The definition of high-use customers may change depending on the results of the on-going programs;
» Market for Component 2: PECO customers who will participate in LIURP during PY2013-PY2015;
» Market for Component 3: PECO residential electric customers with a household income at or below 200% of the federal poverty level (FPL) participating in community events for low-income residents.; and
» Market for Component 4: PECO residential customers, homeowners and/or tenants, with a household income at or below 200% of the federal poverty level (FPL) that do not meet the LEEP usage requirement for weatherization services
Low-income new construction units are excluded from the eligible population.
Program Description
The Act 129 Phase I PECO Low-Income Energy Efficiency (LEEP) program was modeled after PECO’s existing LIURP. LIURP is a successful program that provides energy efficiency services and energy education to PECO’s low-income customers to help them reduce their energy usage and increase the affordability of their energy bills. Like LIURP, LEEP focuses on education and the installation of measures in homes that meet the LEEP criteria. The main difference between LEEP and LIURP is that LIURP addresses both electric and gas energy usage, whereas LEEP addresses only electricity demand and energy savings. Participating households receive the following:
Component 1: » In-home Audits and Education—These are on-site inspections and tests used to identify energy
savings opportunities and energy-savings measures the program offers and to educate residents about ways to reduce their energy usage. o Trained auditors perform on-site audits (air leak testing and home inspection) and assess
the energy performance of the house; i.e., identify where energy is used and where there are inefficiencies and determine which measures are appropriate to install;
o The auditors discuss the opportunities to reduce energy use and bills with residents; and o Follow-up communications with the participants reinforce the message of the benefits of
energy-saving behaviors (e.g., turning off lights in unoccupied rooms) and adoption of energy-savings measures offered by the auditors.
» Direct Installation of Measures—EE measures will be directly installed by auditors during the audit to reduce energy use in the home at no charge to residents. This aspect of the program has been expanded to include additional cost-effective measures such as specialty CFL bulbs and to bring services to more households.

PECO PY 2013-2015 Act 129 - Phase II Energy Efficiency And Conservation Plan Page 55
Program Title and Years PECO Low-Income Energy Efficiency (LEEP) Program PY 2013 – PY 2015
» Applicable measures will continue to be installed, at no cost to residents, in the same way as they have been in past LIURP and Act 129 Phase I LEEP programs. The program will expand CFL installations from an average of 6 bulbs to include all lighting opportunities that meet the hourly usage requirement set forth in the TRM regardless of the number of bulbs.
Component 2: » Increase the number of CFL bulbs installed for LIURP participants – The LIURP program
already installs an average of four CFL bulbs in each participant residence as part of its services. LEEP will increase CFL penetration by installing CFL bulbs (including certain specialty bulbs) in all lighting opportunities that meet the hourly usage requirement set forth in the TRM regardless of the number of bulbs.
Component 3: » Distribution of CFL bulbs- PECO will participate in low-income community events and distribute
CFL bulbs to income-eligible electric customers in the PECO service territory. Component 4: » Replace old, inefficient working refrigerators with new ENERGY STAR® units - For income
eligible customers who are homeowners and/or tenants, and do not meet the usage requirement for weatherization services, they may qualify for a refrigerator as part of the refrigerator swap component.
Implementation Strategy
The PECO Low-Income Energy Efficiency (LEEP) program will provide similar services as LIURP, but with added workload and funding to allow the program to reach a greater number of households.
LEEP is delivered in the same manner and by the same CSP as LIURP. In particular, the following channels will be used:
Channels for Program Delivery
» LIURP staff and contractors » Community groups, Community Assistance Program (CAP) staff to refer eligible participants
The education component of LEEP will be continued and emphasized. In addition to in-home discussions with auditors about energy savings opportunities, customers will be provided with energy education materials to enhance their understanding of energy-saving behaviors and measures and to make them aware of other PECO energy efficiency programs, as well as other State and local resources available to assist them.
Education Overview
Program Issues, Risks, and Risk Management Strategies
LEEP has the benefit of using and building on the existing LIURP and Act 129 Phase I LEEP infrastructure for outreach and delivery of services. This program will simply supplement that infrastructure to attain greater participation in improving the energy efficiency of homes in the low-income target market. As such, there is little risk associated with this program.
Marketing Strategy
LEEP will be marketed as part of the LIURP activities. PECO will develop new outreach strategies and collaborations, as needed, that educate customers and engage them in taking advantage of the program.
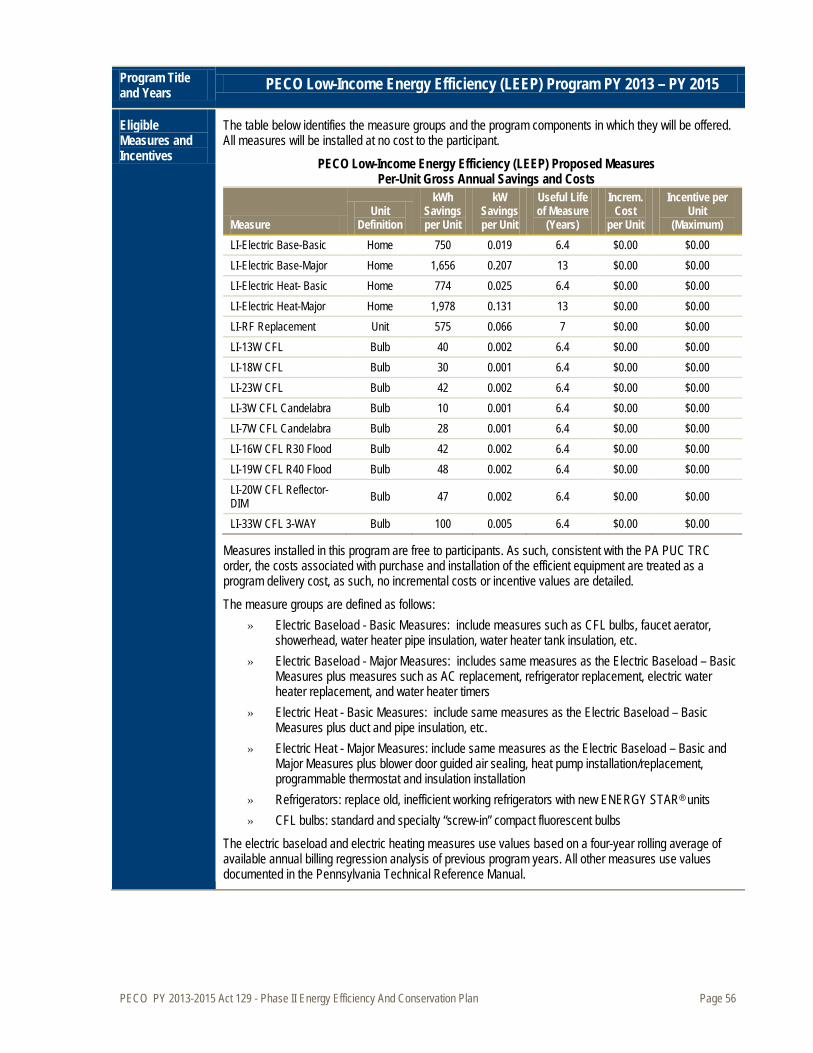
PECO PY 2013-2015 Act 129 - Phase II Energy Efficiency And Conservation Plan Page 56
Program Title and Years PECO Low-Income Energy Efficiency (LEEP) Program PY 2013 – PY 2015
Eligible Measures and Incentives
The table below identifies the measure groups and the program components in which they will be offered. All measures will be installed at no cost to the participant.
PECO Low-Income Energy Efficiency (LEEP) Proposed Measures Per-Unit Gross Annual Savings and Costs
Measure Unit
Definition
kWh Savings per Unit
kW Savings per Unit
Useful Life of Measure
(Years)
Increm. Cost
per Unit
Incentive per Unit
(Maximum) LI-Electric Base-Basic Home 750 0.019 6.4 $0.00 $0.00 LI-Electric Base-Major Home 1,656 0.207 13 $0.00 $0.00 LI-Electric Heat- Basic Home 774 0.025 6.4 $0.00 $0.00 LI-Electric Heat-Major Home 1,978 0.131 13 $0.00 $0.00 LI-RF Replacement Unit 575 0.066 7 $0.00 $0.00 LI-13W CFL Bulb 40 0.002 6.4 $0.00 $0.00 LI-18W CFL Bulb 30 0.001 6.4 $0.00 $0.00 LI-23W CFL Bulb 42 0.002 6.4 $0.00 $0.00 LI-3W CFL Candelabra Bulb 10 0.001 6.4 $0.00 $0.00 LI-7W CFL Candelabra Bulb 28 0.001 6.4 $0.00 $0.00 LI-16W CFL R30 Flood Bulb 42 0.002 6.4 $0.00 $0.00 LI-19W CFL R40 Flood Bulb 48 0.002 6.4 $0.00 $0.00 LI-20W CFL Reflector-DIM Bulb 47 0.002 6.4 $0.00 $0.00
LI-33W CFL 3-WAY Bulb 100 0.005 6.4 $0.00 $0.00
Measures installed in this program are free to participants. As such, consistent with the PA PUC TRC order, the costs associated with purchase and installation of the efficient equipment are treated as a program delivery cost, as such, no incremental costs or incentive values are detailed.
The measure groups are defined as follows: » Electric Baseload - Basic Measures: include measures such as CFL bulbs, faucet aerator,
showerhead, water heater pipe insulation, water heater tank insulation, etc. » Electric Baseload - Major Measures: includes same measures as the Electric Baseload – Basic
Measures plus measures such as AC replacement, refrigerator replacement, electric water heater replacement, and water heater timers
» Electric Heat - Basic Measures: include same measures as the Electric Baseload – Basic Measures plus duct and pipe insulation, etc.
» Electric Heat - Major Measures: include same measures as the Electric Baseload – Basic and Major Measures plus blower door guided air sealing, heat pump installation/replacement, programmable thermostat and insulation installation
» Refrigerators: replace old, inefficient working refrigerators with new ENERGY STAR® units » CFL bulbs: standard and specialty “screw-in” compact fluorescent bulbs
The electric baseload and electric heating measures use values based on a four-year rolling average of available annual billing regression analysis of previous program years. All other measures use values documented in the Pennsylvania Technical Reference Manual.
PECO PY 2013-2015 Act 129 - Phase II Energy Efficiency And Conservation Plan Page 57
Program Title and Years PECO Low-Income Energy Efficiency (LEEP) Program PY 2013 – PY 2015
Ramp Up Strategy / Program Start Date and Key Milestones
Because the PECO Low-Income Energy Efficiency (LEEP) program will use the infrastructure of the existing Act 129 Phase I LEEP program, it is anticipated that program operations will continue un-interrupted. The following schedule identifies key milestones for the program.
Proposed PECO Low-Income Energy Efficiency (LEEP) Implementation Schedule Key Milestone Timing CSP Selection Process November 2012 Promotional Material Development and Participation Application February-May 2013 Program Launch June 2013
Evaluation, Measurement, and Verification Requirements
The evaluation methodology and data collection for the program reflect current, typical evaluation measurement and verification EM&V) practices. EM&V requirements for this program conform with state protocols.
» Number of measures installed in participating households Metrics for Gauging Program Success
» Customer satisfaction with the program and the products » Energy usage reduction and bill savings among participating households » Program implementation costs incurred » Number of CFL bulbs distributed through low-income community events
Program staff will collect data on program marketing, outreach, and service activities. The program will utilize a data tracking system to record and report program activities and achievements.
Data Collection Approaches
The data required for evaluating the program includes the following sources and information: » Program tracking system for measures installed and home characteristics » Customer surveys regarding program awareness, satisfaction with the program, understanding
and perceived savings from measures, household characteristics home operation behaviors, and use of the installed measures
» Periodic reviews and assessment of all components. Interviews with the program implementer and LEEP staff, to identify problems and possible program services/implementation improvements
» Data maintained for EM&V of LEEP program
Gross Impacts
Impact Evaluation Methodology
Component 1 audits done as part of LEEP will be similar to LIURP, which has provided energy efficiency services and energy education to PECO’s low-income customers since 1988.9
» Electric Baseload – Basic Measure: includes measures such as CFLs (4), refrigerator removal, faucet aerator, showerhead, water heater pipe insulation, and water heater tank insulation.
LEEP Component 1 (audit) is subdivided into two measure groups (electric baseload and electric heat) and two measure types (basic and major), plus additional CFLs, to appropriately differentiate estimated energy savings. The measure groups are defined as follows:
9 PECO Energy has implemented a set of Universal Services Programs to meet requirements set by Pennsylvania’s electric and gas restructuring legislation and various Public Utility Commission orders and agreements. The Universal Services Programs include: 1) a CAP payment assistance program that is designed to make energy bills more affordable by furnishing payment subsidies; 2) a LIURP program that is designed to make energy bills more affordable by helping to reduce usage; and 3) a CARES program that is designed to assist households in developing appropriate strategies for maintaining energy service.
PECO PY 2013-2015 Act 129 - Phase II Energy Efficiency And Conservation Plan Page 58
Program Title and Years PECO Low-Income Energy Efficiency (LEEP) Program PY 2013 – PY 2015
» Electric Baseload – Major Measure: includes same measures as the Electric Baseload – Basic Measure plus room/wall AC replacement, refrigerator replacement, electric water heater replacement, and water heater timers (electric water heaters only).
» Electric Heat – Basic Measure: includes same measures as the Electric Baseload – Basic Measure plus duct and pipe insulation, programmable thermostats.
» Electric Heat – Major Measure: includes same measures as the Electric Heat – Basic Measure plus blower door guided air sealing, heat pump installation/replacement, and insulation installation.
Component 2, 3 (CFLs) and 4 (refrigerator swap) will be estimated using deemed values from the TRM.
Energy Savings – Stipulated Values
Stipulated values for Component 1 (audits) are taken from a custom measure protocol approved by the SWE on September 30, 2010. Savings will be determined using a four-year average of billing analysis of LEEP program data. Eventually, the stipulated value will be based entirely on LEEP program data.
Energy Savings – Billing Analysis
The evaluation team will use billing analysis based on Option C – Whole Facility (Billing Regression Analysis to assess annual energy saving. The results from the billing regression analysis will provide statistically adjusted engineering estimates of savings from this protocol and provide a realization rate to be applied to the engineering model of demand savings discussed below.
Program process evaluation is important to ensure that the program is operating as intended and to provide information that can enable improvements in both the program design and implementation. Process evaluations will be undertaken and conducted throughout the program by the implementation and EM&V contractor selected by PECO. This will supplement the LIURP and Act 129 LEEP Phase I evaluation activities.
Process Evaluation Methodology
Process evaluation will assess eligible customers’ understanding, attitudes about, and satisfaction with the program. They will make use of survey data collected, as described above, by the implementation and EM&V contractors. These surveys will include both customers known to have participated in the program and eligible nonparticipants.
Administrative Requirements
PECO will administer the Low-Income Energy Efficiency (LEEP) program. The program is expected to operate with the following PECO/Contract staffing mix:
PECO Low-Income Energy Efficiency (LEEP) Program – Proposed Staffing Staff FTE PECO Program Management 1.1
External staffing levels will be provided upon the completion of the CSP selection process.
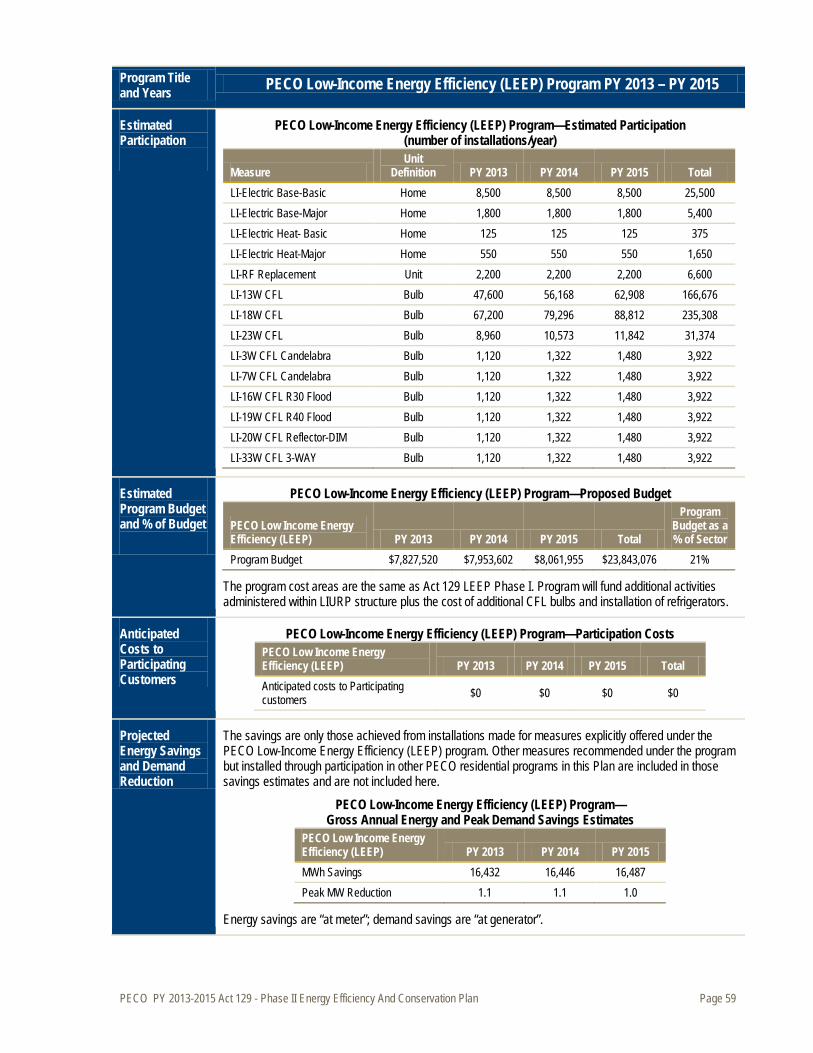
PECO PY 2013-2015 Act 129 - Phase II Energy Efficiency And Conservation Plan Page 59
Program Title and Years PECO Low-Income Energy Efficiency (LEEP) Program PY 2013 – PY 2015
Estimated Participation
PECO Low-Income Energy Efficiency (LEEP) Program—Estimated Participation (number of installations/year)
Measure Unit
Definition PY 2013 PY 2014 PY 2015 Total LI-Electric Base-Basic Home 8,500 8,500 8,500 25,500 LI-Electric Base-Major Home 1,800 1,800 1,800 5,400 LI-Electric Heat- Basic Home 125 125 125 375 LI-Electric Heat-Major Home 550 550 550 1,650 LI-RF Replacement Unit 2,200 2,200 2,200 6,600 LI-13W CFL Bulb 47,600 56,168 62,908 166,676 LI-18W CFL Bulb 67,200 79,296 88,812 235,308 LI-23W CFL Bulb 8,960 10,573 11,842 31,374 LI-3W CFL Candelabra Bulb 1,120 1,322 1,480 3,922 LI-7W CFL Candelabra Bulb 1,120 1,322 1,480 3,922 LI-16W CFL R30 Flood Bulb 1,120 1,322 1,480 3,922 LI-19W CFL R40 Flood Bulb 1,120 1,322 1,480 3,922 LI-20W CFL Reflector-DIM Bulb 1,120 1,322 1,480 3,922 LI-33W CFL 3-WAY Bulb 1,120 1,322 1,480 3,922
Estimated Program Budget and % of Budget
PECO Low-Income Energy Efficiency (LEEP) Program—Proposed Budget
PECO Low Income Energy Efficiency (LEEP) PY 2013 PY 2014 PY 2015 Total
Program Budget as a % of Sector
Program Budget $7,827,520 $7,953,602 $8,061,955 $23,843,076 21%
The program cost areas are the same as Act 129 LEEP Phase I. Program will fund additional activities administered within LIURP structure plus the cost of additional CFL bulbs and installation of refrigerators.
Anticipated Costs to Participating Customers
PECO Low-Income Energy Efficiency (LEEP) Program—Participation Costs PECO Low Income Energy Efficiency (LEEP) PY 2013 PY 2014 PY 2015 Total Anticipated costs to Participating customers $0 $0 $0 $0
Projected Energy Savings and Demand Reduction
The savings are only those achieved from installations made for measures explicitly offered under the PECO Low-Income Energy Efficiency (LEEP) program. Other measures recommended under the program but installed through participation in other PECO residential programs in this Plan are included in those savings estimates and are not included here.
PECO Low-Income Energy Efficiency (LEEP) Program— Gross Annual Energy and Peak Demand Savings Estimates
PECO Low Income Energy Efficiency (LEEP) PY 2013 PY 2014 PY 2015 MWh Savings 16,432 16,446 16,487 Peak MW Reduction 1.1 1.1 1.0
Energy savings are “at meter”; demand savings are “at generator”.

PECO PY 2013-2015 Act 129 - Phase II Energy Efficiency And Conservation Plan Page 60
Program Title and Years PECO Low-Income Energy Efficiency (LEEP) Program PY 2013 – PY 2015
Cost-Effectiveness
PECO Low Income Energy Efficiency (LEEP)
Dollars (Millions)
TRC Discounted Lifetime Benefits
Discounted Lifetime Costs
Net Benefits
$33,597,481 $22,212,428 $11,385,053 1.51
PECO PY 2013-2015 Act 129 - Phase II Energy Efficiency And Conservation Plan Page 61
3.2.1.6 EE Program 6 — PECO Smart Energy Saver Program
Program Title and Years PECO Smart Energy Saver Program PY 2013 – PY 2015
Objectives The intent of the PECO Smart Energy Saver Program is to educate and engage grade school students and their families to take actions that can reduce their home energy use and increase its efficiency.
Target Market The program targets grade school students, and by association their families, in grades 5 through 7 who are within PECO’s service area through free in-class energy efficiency education to students and distribution of take-home direct-install energy kits.
Program Description
Reaching parents through their children is a proven behavior change strategy. A CSP will work directly with PECO to introduce the program to schools throughout the service territory. All educational materials and take-home efficiency kits will be provided free of charge. Providing energy education to students is an effective way to influence families’ energy behaviors. The PECO Smart Energy Saver program consists of an energy-based class room curriculum in which students will be instructed on energy saving approaches that can be implemented in their homes. Students will be provided a “take home” kit designed to raise awareness about how individual actions and low-cost measures can create significant reductions in electricity and water consumption. The take-home kit will include a range of low-cost, easy to install energy efficiency measures and educational materials. The kit is anticipated to include representative measures, as detailed below, and is subject to change over time:
» CFLs: Two 13 W, One 20W, One 23W » Low flow showerhead and faucet aerator » LED nightlight » PECO Energy Efficiency Program materials » Low cost/no cost energy saving tips » Parent volunteer post-card, providing permission for PECO to follow-up with the parent of the
student for purposes of participant satisfaction surveys and EM&V. Energy savings related to this program are derived from items included in the take-home kit. Information on the response card collected by the teacher as to what measures were installed will help inform evaluation.
Implementation Strategy
PECO will administer the PECO Smart Energy Saver Program through a CSP who has experience in designing and delivering the energy based curriculum and distributing “take-home” kits to school kids.
» The program will be delivered by a third-party CSP chosen through a competitive bidding process. The CSP will work to gain the permission of schools to enroll and participate in the program.
Channels for Program Delivery
» The schools in PECO’s territory will act as a channel to provide this curriculum and the take home kits to the students and as a result to their families- the rate-payers.
» The CSP will be responsible for delivering the energy based curriculum and the “take-home kits”.
Overview of Roles and Activities
» The CSP will develop an energy-based curriculum to be delivered by teachers and, distribute energy efficiency “take-home” kits to schools. Students will take the energy efficiency kits home, and as part of the activity, discuss the contents with parents, and return to the classroom a “response card” indicating which efficient products were installed, as well as an optional parent signature line, with contact information, providing PECO the opportunity to follow-up with the parent for EM&V purposes.
» The CSP will provide PECO with quarterly feedback reports documenting program progress.
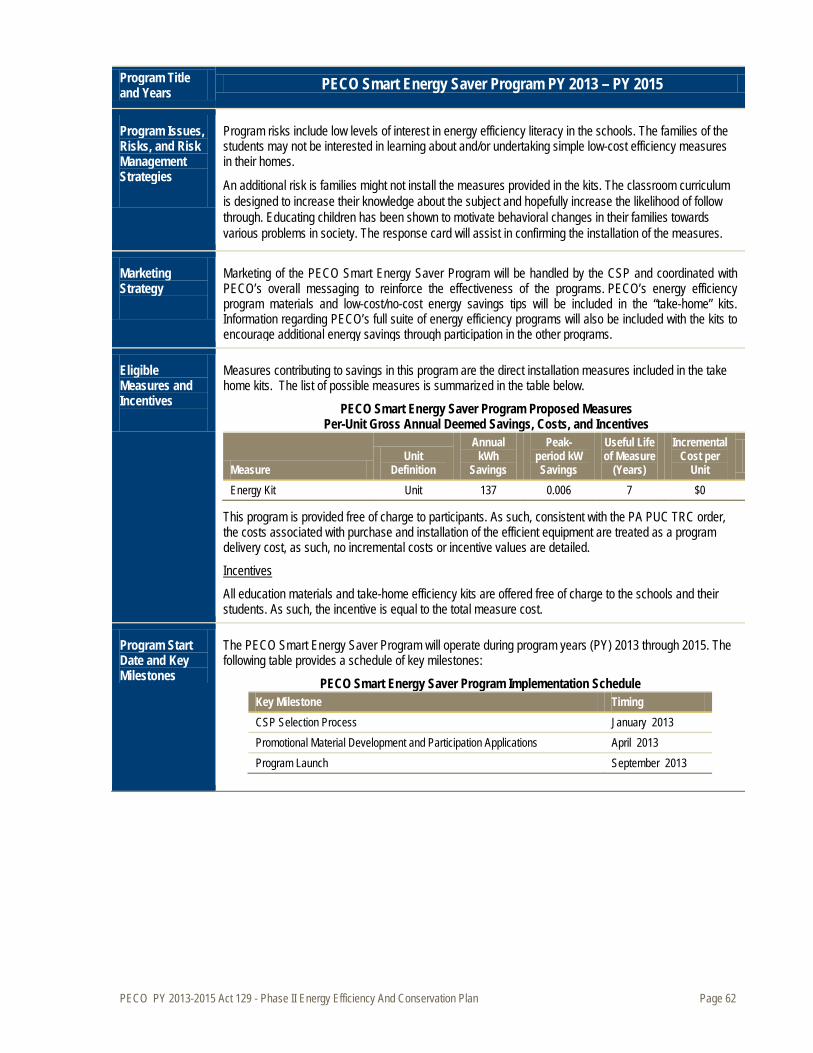
PECO PY 2013-2015 Act 129 - Phase II Energy Efficiency And Conservation Plan Page 62
Program Title and Years PECO Smart Energy Saver Program PY 2013 – PY 2015
Program Issues, Risks, and Risk Management Strategies
Program risks include low levels of interest in energy efficiency literacy in the schools. The families of the students may not be interested in learning about and/or undertaking simple low-cost efficiency measures in their homes.
An additional risk is families might not install the measures provided in the kits. The classroom curriculum is designed to increase their knowledge about the subject and hopefully increase the likelihood of follow through. Educating children has been shown to motivate behavioral changes in their families towards various problems in society. The response card will assist in confirming the installation of the measures.
Marketing Strategy
Marketing of the PECO Smart Energy Saver Program will be handled by the CSP and coordinated with PECO’s overall messaging to reinforce the effectiveness of the programs. PECO’s energy efficiency program materials and low-cost/no-cost energy savings tips will be included in the “take-home” kits. Information regarding PECO’s full suite of energy efficiency programs will also be included with the kits to encourage additional energy savings through participation in the other programs.
Eligible Measures and Incentives
Measures contributing to savings in this program are the direct installation measures included in the take home kits. The list of possible measures is summarized in the table below.
PECO Smart Energy Saver Program Proposed Measures Per-Unit Gross Annual Deemed Savings, Costs, and Incentives
Measure Unit
Definition
Annual kWh
Savings
Peak-period kW Savings
Useful Life of Measure
(Years)
Incremental Cost per
Unit
Energy Kit Unit 137 0.006 7 $0
This program is provided free of charge to participants. As such, consistent with the PA PUC TRC order, the costs associated with purchase and installation of the efficient equipment are treated as a program delivery cost, as such, no incremental costs or incentive values are detailed.
All education materials and take-home efficiency kits are offered free of charge to the schools and their students. As such, the incentive is equal to the total measure cost.
Incentives
Program Start Date and Key Milestones
The PECO Smart Energy Saver Program will operate during program years (PY) 2013 through 2015. The following table provides a schedule of key milestones:
PECO Smart Energy Saver Program Implementation Schedule Key Milestone Timing CSP Selection Process January 2013 Promotional Material Development and Participation Applications April 2013 Program Launch September 2013

PECO PY 2013-2015 Act 129 - Phase II Energy Efficiency And Conservation Plan Page 63
Program Title and Years PECO Smart Energy Saver Program PY 2013 – PY 2015
Evaluation, Measurement, and Verification Requirements
All evaluation activities will be conducted by PECO’s EM&V contractor. Impact and process evaluation activities will be conducted annually as outlined below including verifying annual reported program savings.
Metrics for measuring program success include number of kits distributed, verification of installed measures, as well as program satisfaction as gathered through process evaluation.
Metrics for Gauging Program Success
Data for evaluating the program will include the CSP’s database of information about the number of take-home kits distributed. Response cards collected from program participants will be provided to the Evaluation Contractor and will be used to inform PECO of the impact of the program and realization rates.
Data Collection Approaches
The impact evaluation will verify the savings claimed by the CSP. This will be achieved by verifying measures from student kits were installed and measure savings are consistent with deemed values from the TRM.
Impact Evaluation Methodology
The process evaluation will be coordinated with the impact evaluation and may include interviews with program managers, the chosen CSP, participating teachers and students. Interviews and or surveys will be conducted to assess the operational conditions of the program and to identify ways to improve it.
Process Evaluation Methodology
Administrative Requirements
PECO will be responsible for general administrative oversight of the program, including the following:
» Oversight and administration of the CSP » Goal achievement within investment
The program is expected to operate with the following PECO/Contract staffing mix:
PECO Smart Energy Saver Program—Proposed PECO / Contract Staffing Staff FTE PECO Program Manager 0.5
External staffing levels will be provided upon the completion of the CSP selection process.
Estimated Participation
PECO Smart Energy Saver Program—Estimated Participation
Measure Unit
Definition PY 2013 PY 2014 PY 2015 Total Number of student participants Unit 7,000 7,000 7,000 21,000
Estimated Program Budget and % of Budget
Approval of the program is anticipated in PY 2013 Q1, with less than full year of program operation. The cost estimates reflect this timing.
PECO Smart Energy Saver Program —Proposed Budget
PECO Smart Energy Saver PY 2013 PY 2014 PY 2015 Total
Program Budget as a % of Sector
Program Budget $535,000 $537,400 $539,872 $1,612,272 1%
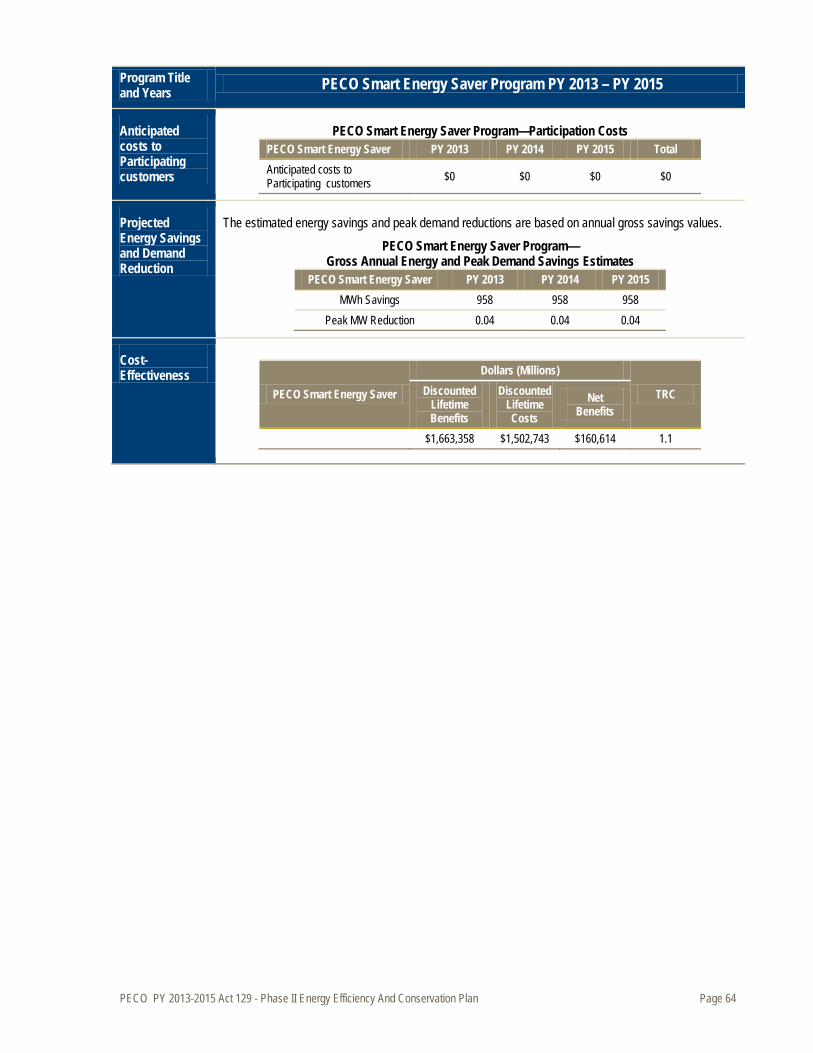
PECO PY 2013-2015 Act 129 - Phase II Energy Efficiency And Conservation Plan Page 64
Program Title and Years PECO Smart Energy Saver Program PY 2013 – PY 2015
Anticipated costs to Participating customers
PECO Smart Energy Saver Program—Participation Costs PECO Smart Energy Saver PY 2013 PY 2014 PY 2015 Total Anticipated costs to Participating customers $0 $0 $0 $0
Projected Energy Savings and Demand Reduction
The estimated energy savings and peak demand reductions are based on annual gross savings values.
PECO Smart Energy Saver Program— Gross Annual Energy and Peak Demand Savings Estimates
PECO Smart Energy Saver PY 2013 PY 2014 PY 2015 MWh Savings 958 958 958
Peak MW Reduction 0.04 0.04 0.04
Cost-Effectiveness
PECO Smart Energy Saver
Dollars (Millions)
TRC Discounted Lifetime Benefits
Discounted Lifetime Costs
Net Benefits
$1,663,358 $1,502,743 $160,614 1.1
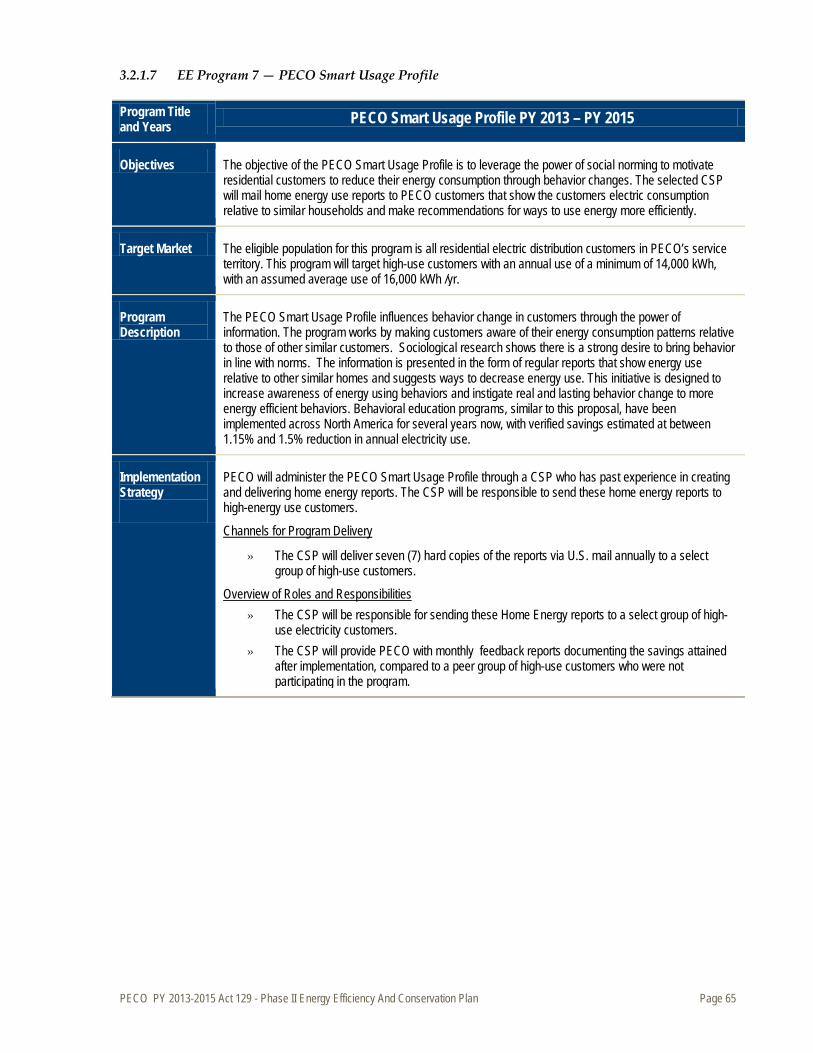
PECO PY 2013-2015 Act 129 - Phase II Energy Efficiency And Conservation Plan Page 65
3.2.1.7 EE Program 7 — PECO Smart Usage Profile
Program Title and Years PECO Smart Usage Profile PY 2013 – PY 2015
Objectives The objective of the PECO Smart Usage Profile is to leverage the power of social norming to motivate residential customers to reduce their energy consumption through behavior changes. The selected CSP will mail home energy use reports to PECO customers that show the customers electric consumption relative to similar households and make recommendations for ways to use energy more efficiently.
Target Market The eligible population for this program is all residential electric distribution customers in PECO’s service territory. This program will target high-use customers with an annual use of a minimum of 14,000 kWh, with an assumed average use of 16,000 kWh /yr.
Program Description
The PECO Smart Usage Profile influences behavior change in customers through the power of information. The program works by making customers aware of their energy consumption patterns relative to those of other similar customers. Sociological research shows there is a strong desire to bring behavior in line with norms. The information is presented in the form of regular reports that show energy use relative to other similar homes and suggests ways to decrease energy use. This initiative is designed to increase awareness of energy using behaviors and instigate real and lasting behavior change to more energy efficient behaviors. Behavioral education programs, similar to this proposal, have been implemented across North America for several years now, with verified savings estimated at between 1.15% and 1.5% reduction in annual electricity use.
Implementation Strategy
PECO will administer the PECO Smart Usage Profile through a CSP who has past experience in creating and delivering home energy reports. The CSP will be responsible to send these home energy reports to high-energy use customers.
» The CSP will deliver seven (7) hard copies of the reports via U.S. mail annually to a select group of high-use customers.
Channels for Program Delivery
» The CSP will be responsible for sending these Home Energy reports to a select group of high-use electricity customers.
Overview of Roles and Responsibilities
» The CSP will provide PECO with monthly feedback reports documenting the savings attained after implementation, compared to a peer group of high-use customers who were not participating in the program.

PECO PY 2013-2015 Act 129 - Phase II Energy Efficiency And Conservation Plan Page 66
Program Title and Years PECO Smart Usage Profile PY 2013 – PY 2015
Program Issues, Risks, and Risk Management Strategies
Program risks involve not knowing how PECO customers will respond to Home Energy Reports. While providers of Home Energy reports typically find savings of up to 2.5% from this approach, each geographic area has a unique population and response to this approach carries some uncertainty. Barriers to implementation of efficiency include:
» Efficiency is invisible. » Most people when asked if they want to save energy will say “yes”. Often they think they are
already doing what they can to be energy efficient. » Not knowing what to do, or what to do first. » Not knowing where to obtain energy efficient products and services. » Perceptions of cost, financial constraints. » Doubt regarding the ability to make a significant difference in energy use/cost.
Customer education and engagement will be necessary to address these barriers and is essential for the success of the PECO Smart Usage Profile. Each report sent out to the customer represents an opportunity to engage them in better understanding their energy use as well as providing specific approaches to better manage it.
Marketing Strategy
Behavioral science-based approaches to communication, data analytics, and cutting-edge software are the tools being applied in this program to broadly and deeply engage utility customers. The program will be delivered as an opt-out effort, meaning that all the customers selected will be considered participants unless they specifically opt out of the program. All customers selected will receive regular reports with a clear and easy to understand normative message which is a comparison of their electricity consumption to similar sized homes in the region.
In addition to the energy use feedback and efficiency recommendations in the report, additional measures can help enhance the customer experience. For example, an online home energy audit tool may help to emphasize the social norming message and also provide consumers with additional energy saving ideas. The CSP could develop such approaches that will be most effective for the PECO customer base.
Eligible Measures and Incentives
PECO Smart Usage Profile Proposed Measures—Per-Unit Gross Annual Deemed Savings, Costs, and Potential Incentives
Measure Unit
Definition
Annual kWh
Savings Peak-period kW Savings
Useful Life of Measure (Years)
Incremental Costs per Unit
Incentive per Unit
(Maximum) Home Energy Reports
Home 200 0.023 1 $0 $0
This program is provided free of charge to participants. As such, consistent with the PA PUC TRC order, the costs associated with the delivery of the home energy report are treated as a program delivery cost, as such, no incremental costs or incentive values are detailed.
Home Energy Reports: These reports will contain information about current energy use relative to similar customers and provide recommendations to reduce energy consumption.
Measures
There are no direct incentives associated with this behavior change approach. The reports are provided free of charge to the selected customers.
Incentives
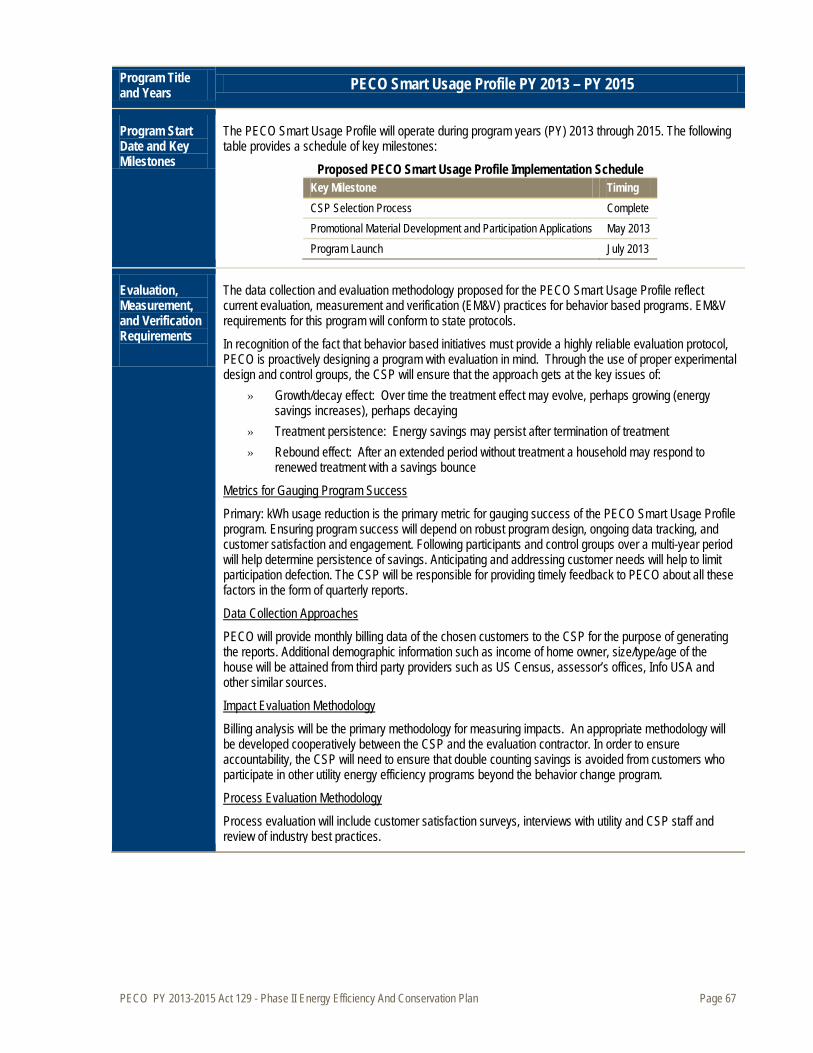
PECO PY 2013-2015 Act 129 - Phase II Energy Efficiency And Conservation Plan Page 67
Program Title and Years PECO Smart Usage Profile PY 2013 – PY 2015
Program Start Date and Key Milestones
The PECO Smart Usage Profile will operate during program years (PY) 2013 through 2015. The following table provides a schedule of key milestones:
Proposed PECO Smart Usage Profile Implementation Schedule Key Milestone Timing CSP Selection Process Complete Promotional Material Development and Participation Applications May 2013 Program Launch July 2013
Evaluation, Measurement, and Verification Requirements
The data collection and evaluation methodology proposed for the PECO Smart Usage Profile reflect current evaluation, measurement and verification (EM&V) practices for behavior based programs. EM&V requirements for this program will conform to state protocols.
In recognition of the fact that behavior based initiatives must provide a highly reliable evaluation protocol, PECO is proactively designing a program with evaluation in mind. Through the use of proper experimental design and control groups, the CSP will ensure that the approach gets at the key issues of:
» Growth/decay effect: Over time the treatment effect may evolve, perhaps growing (energy savings increases), perhaps decaying
» Treatment persistence: Energy savings may persist after termination of treatment » Rebound effect: After an extended period without treatment a household may respond to
renewed treatment with a savings bounce
Primary: kWh usage reduction is the primary metric for gauging success of the PECO Smart Usage Profile program. Ensuring program success will depend on robust program design, ongoing data tracking, and customer satisfaction and engagement. Following participants and control groups over a multi-year period will help determine persistence of savings. Anticipating and addressing customer needs will help to limit participation defection. The CSP will be responsible for providing timely feedback to PECO about all these factors in the form of quarterly reports.
Metrics for Gauging Program Success
PECO will provide monthly billing data of the chosen customers to the CSP for the purpose of generating the reports. Additional demographic information such as income of home owner, size/type/age of the house will be attained from third party providers such as US Census, assessor’s offices, Info USA and other similar sources.
Data Collection Approaches
Billing analysis will be the primary methodology for measuring impacts. An appropriate methodology will be developed cooperatively between the CSP and the evaluation contractor. In order to ensure accountability, the CSP will need to ensure that double counting savings is avoided from customers who participate in other utility energy efficiency programs beyond the behavior change program.
Impact Evaluation Methodology
Process evaluation will include customer satisfaction surveys, interviews with utility and CSP staff and review of industry best practices.
Process Evaluation Methodology

PECO PY 2013-2015 Act 129 - Phase II Energy Efficiency And Conservation Plan Page 68
Program Title and Years PECO Smart Usage Profile PY 2013 – PY 2015
Administrative Requirements
PECO will administer the PECO Smart Usage Profile through the chosen CSP. PECO’s role will be to ensure that the program is delivered on time and within budget.
The program is expected to operate with the following PECO/Contract staffing mix:
PECO Smart Usage Profile—Proposed Staffing Staff FTE
PECO Program Manager 0.5
External staffing levels will be provided upon the completion of the CSP selection process.
Estimated Participation
PECO will reach out to approximately 40,000 residential customers in its initial year of the program. PECO will add 30,000 additional new customers to the program every year for the next two years.
PECO Smart Usage Profile—Estimated Participation
Measure Unit
Definition PY 2013 PY 2014 PY 2015 Total Number of participants/yr Home 40,000 70,000 100,000 210,000
Estimated Program Budget and % of Sector
PECO Smart Usage Profile—Proposed Budget
PECO Smart User Profile PY 2013 PY 2014 PY 2015 Total
Program Budget as a % of Sector
Program Budget $600,000 $992,400 $1,384,872 $2,977,272 3%
Anticipated costs to Participating customers
PECO Smart Usage Profile—Participation Costs PECO Smart User Profile PY 2013 PY 2014 PY 2015 Total Anticipated costs to Participating customers $0 $0 $0 $0
Projected Energy Savings and Demand Reduction
The estimated energy savings and peak demand reductions are based on annual kWh and kW values. PECO estimates annual savings of 1-3% for participants in this program.
PECO Smart Usage Profile— Gross Annual Energy and Peak Demand Savings Estimates
PECO Smart User Profile PY 2013 PY 2014 PY 2015 MWh Savings 8,000 16,800 26,000 Peak MW Reduction 0.99 2.07 3.21
Energy savings are “at meter”; demand savings are “at generator”.
Cost-Effectiveness
PECO Smart User Profile
Dollars (Millions)
TRC Discounted Lifetime Benefits
Discounted Lifetime Costs
Net Benefits
$5,180,297 $2,723,083 $2,457,214 1.9
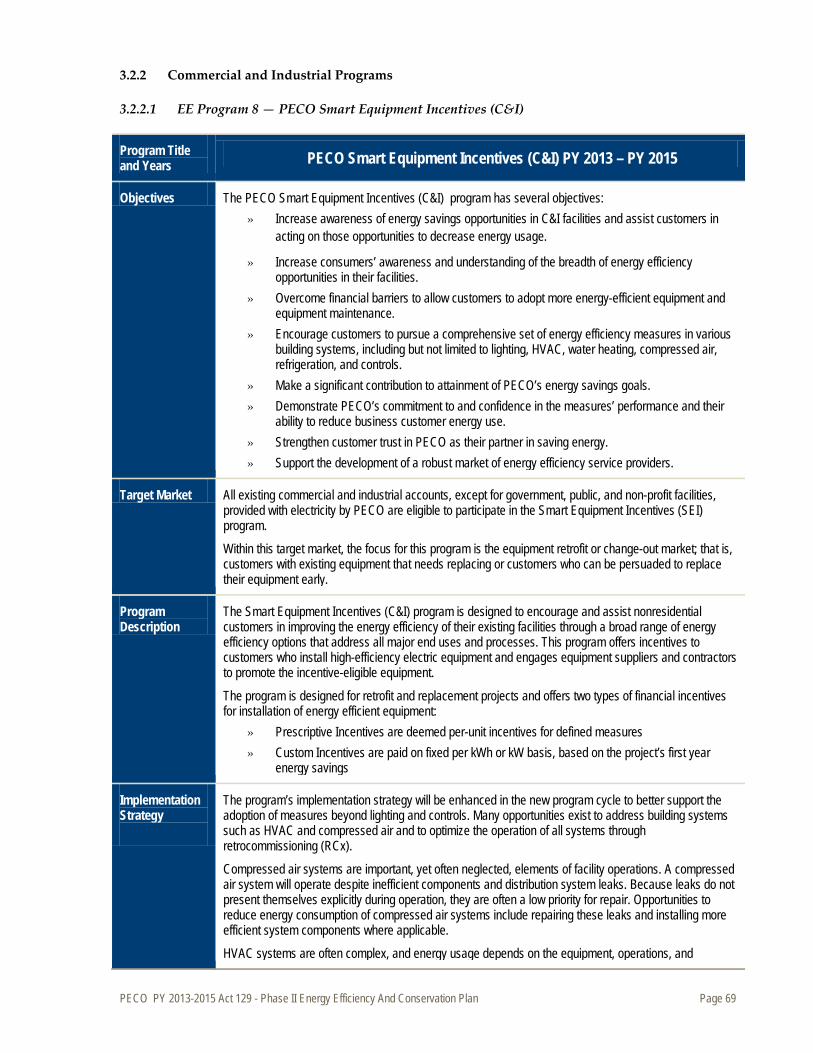
PECO PY 2013-2015 Act 129 - Phase II Energy Efficiency And Conservation Plan Page 69
3.2.2 Commercial and Industrial Programs
3.2.2.1 EE Program 8 — PECO Smart Equipment Incentives (C&I)
Program Title and Years PECO Smart Equipment Incentives (C&I) PY 2013 – PY 2015
Objectives The PECO Smart Equipment Incentives (C&I) program has several objectives: » Increase awareness of energy savings opportunities in C&I facilities and assist customers in
acting on those opportunities to decrease energy usage.
» Increase consumers’ awareness and understanding of the breadth of energy efficiency opportunities in their facilities.
» Overcome financial barriers to allow customers to adopt more energy-efficient equipment and equipment maintenance.
» Encourage customers to pursue a comprehensive set of energy efficiency measures in various building systems, including but not limited to lighting, HVAC, water heating, compressed air, refrigeration, and controls.
» Make a significant contribution to attainment of PECO’s energy savings goals. » Demonstrate PECO’s commitment to and confidence in the measures’ performance and their
ability to reduce business customer energy use. » Strengthen customer trust in PECO as their partner in saving energy. » Support the development of a robust market of energy efficiency service providers.
Target Market All existing commercial and industrial accounts, except for government, public, and non-profit facilities, provided with electricity by PECO are eligible to participate in the Smart Equipment Incentives (SEI) program.
Within this target market, the focus for this program is the equipment retrofit or change-out market; that is, customers with existing equipment that needs replacing or customers who can be persuaded to replace their equipment early.
Program Description
The Smart Equipment Incentives (C&I) program is designed to encourage and assist nonresidential customers in improving the energy efficiency of their existing facilities through a broad range of energy efficiency options that address all major end uses and processes. This program offers incentives to customers who install high-efficiency electric equipment and engages equipment suppliers and contractors to promote the incentive-eligible equipment.
The program is designed for retrofit and replacement projects and offers two types of financial incentives for installation of energy efficient equipment:
» Prescriptive Incentives are deemed per-unit incentives for defined measures » Custom Incentives are paid on fixed per kWh or kW basis, based on the project’s first year
energy savings
Implementation Strategy
The program’s implementation strategy will be enhanced in the new program cycle to better support the adoption of measures beyond lighting and controls. Many opportunities exist to address building systems such as HVAC and compressed air and to optimize the operation of all systems through retrocommissioning (RCx).
Compressed air systems are important, yet often neglected, elements of facility operations. A compressed air system will operate despite inefficient components and distribution system leaks. Because leaks do not present themselves explicitly during operation, they are often a low priority for repair. Opportunities to reduce energy consumption of compressed air systems include repairing these leaks and installing more efficient system components where applicable. HVAC systems are often complex, and energy usage depends on the equipment, operations, and

PECO PY 2013-2015 Act 129 - Phase II Energy Efficiency And Conservation Plan Page 70
Program Title and Years PECO Smart Equipment Incentives (C&I) PY 2013 – PY 2015
maintenance. Opportunities to reduce energy consumption arise through the replacement of equipment and key components, as well as the optimization of operations.
RCx is a systematic facility investigation that identifies low-cost and no-cost facility improvement measures. RCx has been shown to provide significant cost-effective energy efficiency savings while enhancing the environment in existing commercial facilities and can solve issues of high energy and maintenance costs, occupant complaints, indoor environmental quality, and shorter than expected equipment lives. RCx enhances building performance without replacing major equipment through system optimization.
PECO will administer the Smart Equipment Incentives (C&I) program through a CSP implementation contractor who will oversee all aspects of the program’s implementation, outlined in the sections below.
Effective implementation of the program depends on all aspects of the delivery working effectively. This includes making qualifying products available, distributing information about the products and the program, promoting the program adequately, and educating those influential in making product selection and purchasing decisions.
Channels for Program Delivery
» Product Supply o Equipment suppliers—Vendors are influential in equipment selection in commercial and
industrial facilities. They can be and should be engaged to recommend incentive-eligible models of equipment for retrofit and replacement projects. As appropriate, the incentives for equipment purchased under the program can be split or directed to these vendors.
o Other trade allies—Installation and maintenance contractors can provide services associated with some of the qualifying measures, such as HVAC diagnostic tune-ups, identifying and sealing air and duct leaks, and refrigeration system maintenance. Again, as appropriate, incentives offered on qualifying measures can be directed to or split with these providers to encourage them to promote program participation
» Program and Product Information Distribution o CSP— The implementation CSP will develop and distribute information about the
qualifying products and participation assistance by establishing and leveraging existing relationships with the product and service suppliers.
o Trade allies—As both deliverers of program products and potential participants in the program, all vendors of the qualifying equipment and service measures should be engaged to receive and also provide to their public sector clients information about the program measure benefits, how the program works, and assistance with the incentive process.
o Utility staff— While PECO will engage a CSP to implement the program, the staff has ongoing contact with all key account customers. The staff will provide information about the program benefits, measures, and process.
» Program Promotion o CSP— A key responsibility of the implementation CSP is outreach and effective promotion
of the program to the target market. o Trade allies—All vendors of the qualifying equipment and service measures should be
engaged to make their clients aware of the program and encourage their participation by recommending high-efficiency equipment models and diagnostic services.
o Facility auditors—Part of auditors’ services can and should include making customers aware of this program and the incentives available for installation of high-efficiency measures.
o Program marketing—The program marketing strategy is discussed below. » Education
o The CSP will meet individually with facility decision makers during outreach and project
PECO PY 2013-2015 Act 129 - Phase II Energy Efficiency And Conservation Plan Page 71
Program Title and Years PECO Smart Equipment Incentives (C&I) PY 2013 – PY 2015
development o Trade publication articles on the benefits of specific measures, technologies, and
diagnostic tune-ups, as well as whole facility assessments o Trade industry meetings leveraged to include product and program education as part of
them o Workshops provided by government agencies for commercial and industrial businesses to
understand how to improve energy use in their facilities o Facility audit reports
Enhancing the program’s ability to support more comprehensive projects in the areas of compressed air and RCx will require that the program enhance the program channels in the following ways:
» Product supply will be enhanced through the development of a set of qualified compressed air and RCx service providers
» Promotion of the program to customers occupying “good candidate” buildings for RCx through account managers, program implementation team, and qualified RCx service providers
The implementation CSP will have full responsibility for delivery of all aspects of the program. Responsibilities fall into several activity areas:
Overview of Roles and Activities
» Development of relationships with equipment and maintenance suppliers to make incentive-eligible equipment and services available and to promote their participation in the program.
» Program marketing: including development and distribution of program materials and assistance with direct mail or other promotion in collaboration with other PECO contractors. o Market segmentation strategies will be developed to identify and target facilities with
compressed air systems and those with good potential for RCx. o Screening guidelines will be developed to help account managers and trade allies identify
and qualify candidates having the highest potential for successful completion of compressed air and RCx projects.
» Participant recruitment and assistance: including assisting customers and contractors with selection of measures and incentive application submittal, assisting customers and contractors with development of estimates and documentation for approval of custom measure projects.
» Incentive processing: including a fulfillment house to receive, review and verify applications; and pay the financial incentives.
» Program performance tracking and improvement: including tracking availability of qualifying products, incentive submittals and payments, and opportunities to improve the program.
» Reporting: including reporting of program activities to meet regulatory and internal requirements, including progress toward program goals.
The program will provide education on the availably of the program, its rules, requirements, and process, as well as technical training on program-eligible equipment. Educating equipment suppliers and contractors will ensure that program channels and participants have the understanding and tools to make the program successful. Where possible, the program will leverage education provided by other groups by promoting available training to customer and trade allies or by co-sponsoring events.
Education Overview
The program will develop and conduct training sessions for trade allies and other product supply and product distribution providers. These will be designed to provide technical information on the measures promoted under the program, information about the program requirements and eligibility. Information on the benefits of promoting energy efficiency to their clients will be covered along with sales strategies such as incorporating financial analysis in to their sales package. Trainings will be tailored appropriately for different market actors.
PECO PY 2013-2015 Act 129 - Phase II Energy Efficiency And Conservation Plan Page 72
Program Title and Years PECO Smart Equipment Incentives (C&I) PY 2013 – PY 2015
Several other sources of technical and financial assistance are available to commercial and industrial energy users to enable energy efficiency improvements. Information about these resources will be made available to the program participants and to trade allies through the program trainings and resources. They include:
Applicable Collaborative Resources
» Pennsylvania Department of Environmental Protection (DEP) offers workshops and other assistance to help small businesses improve energy efficiency at their facilities. The services are sponsored by DEP’s Office of the Small Business Ombudsman..10
Program Issues, Risks, and Risk Management Strategies
There are many challenges associated with providing an energy efficiency program to commercial and industrial customers. Key ones are identified below, along with how the PECO Smart Equipment Incentives (C&I) program can address them.
» TRM Updates: The program design excludes relamp and reballast measures for T12 to T8 and T8 to High-Performance T8 (HPT8) because these measures will likely be phased out in the future. The program design can accommodate these measures if acceptable, though the design does include alternative measures such as retrofits of ballasts to HPT8 ballasts with low ballast factors.
» Market Diversity: The C&I market is diverse both in terms of size and makeup. Additionally, the market differs in organizational structure, technological sophistication, and inclination toward energy savings. To overcome this challenge, the program will consider the needs of the various customer segments when developing program outreach and educational strategies. Appropriate channels will be used and messages will be tailored to resonate with each segment.
» Technical Diversity: The energy uses of industrial customers are also diverse and often site-specific requiring expertise across a broad range of technologies. The CSP will have access to a team of technical and process experts to assist industrial customers in particular with project development. These experts will be called upon to support certain program functions, such as performing pre- and post-installation inspections and reviewing engineering calculations.
» Trade Ally Relationships: Equipment vendors and installation contractors have considerable influence in equipment purchase decisions. This effectively makes these trade allies part of the participant target market. Several strategies will be used to engage those trade allies including trainings and other resources. If necessary, the program will investigate options for providing financial incentives to vendors. This may be in the form of an incentive program to encourage their participation by offsetting some of their sales costs or allowing the customer to direct the incentive payment to their vendor.
Ramp Up Strategy
This program is a continuing program, and a full ramp up strategy is not anticipated. However, the program implementation staff will be trained on any revised program guidelines and eligible technologies.
Marketing Strategy
The unique nature of the supply chain for energy efficiency products and services provides the opportunity to coordinate program marketing along two distinct channels. Though PECO customers are the ultimate target market for the program, trade allies sell and install the efficiency measures and have significant influence with customers in their decision-making process. Therefore, the two channels will be focused on the end use customer and trade allies. The marketing activities that will be targeted toward each channel are described below:
Direct Marketing to Customers: » Print: opportunities for printed materials include bill inserts and messages, direct mail to
10 http://www.portal.state.pa.us/portal/server.pt/community/small_business_ombudsman-move_to_grants/10493, October 2012.
PECO PY 2013-2015 Act 129 - Phase II Energy Efficiency And Conservation Plan Page 73
Program Title and Years PECO Smart Equipment Incentives (C&I) PY 2013 – PY 2015
targeted customer groups, and program brochures and other literature such as case studies and resource listings.
» Electronic: The PECO Smart Ideas Web site will include detailed program information on eligibility, incentive levels, and other requirements. E-mail updates announcements will be sent to assigned accounts.
» Account Executives: Larger C&I customers have an assigned account representatives who maintains an ongoing, one-on-one relationship with key customer contacts. The account executives will be leveraged to present the program to each of their assigned accounts as well as identify opportunities throughout the program cycle.
» Industry Groups: The program will seek out opportunities to present the program to industry groups whose membership falls within the targeted population of C&I customers. Good candidates are the local chapter of the Building Owners and Managers Association (BOMA), Chambers of Commerce, and the Association of Facilities Engineering.
Marketing to Trade Allies: » Industry Associations: The program will develop relationships with industry association who
represent trades working along the energy efficiency supply chain. These include local chapters of the American Society of Heating, Refrigeration, and Air-Conditioning Engineers (ASHRAE), Association of Energy Engineers (AEE) and the National Association of Energy Service Companies (NAESCO).
» Workshops and Trainings: A series of workshops will be held to educate trade allies on the availably of incentives, program requirements, and strategies for incorporating energy efficiency into their sales process.
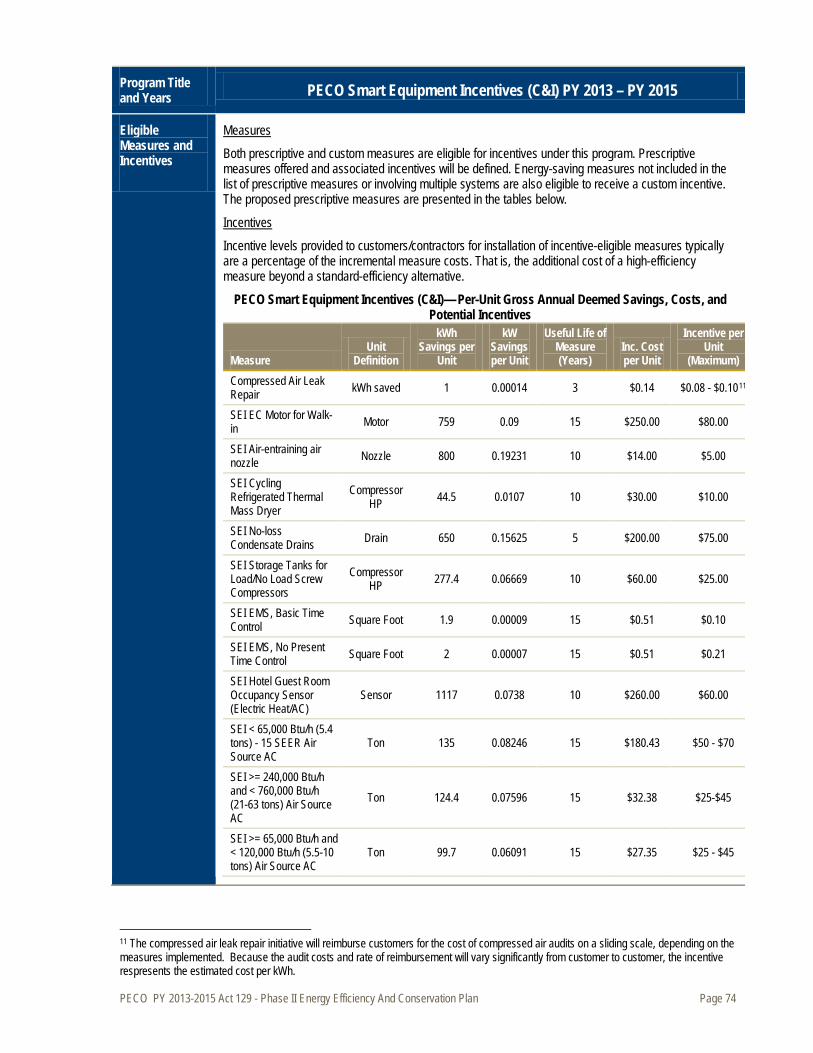
PECO PY 2013-2015 Act 129 - Phase II Energy Efficiency And Conservation Plan Page 74
Program Title and Years PECO Smart Equipment Incentives (C&I) PY 2013 – PY 2015
Eligible Measures and Incentives
Both prescriptive and custom measures are eligible for incentives under this program. Prescriptive measures offered and associated incentives will be defined. Energy-saving measures not included in the list of prescriptive measures or involving multiple systems are also eligible to receive a custom incentive. The proposed prescriptive measures are presented in the tables below.
Measures
Incentive levels provided to customers/contractors for installation of incentive-eligible measures typically are a percentage of the incremental measure costs. That is, the additional cost of a high-efficiency measure beyond a standard-efficiency alternative.
Incentives
PECO Smart Equipment Incentives (C&I)— Per-Unit Gross Annual Deemed Savings, Costs, and Potential Incentives
Measure Unit
Definition
kWh Savings per
Unit
kW Savings per Unit
Useful Life of Measure (Years)
Inc. Cost per Unit
Incentive per Unit
(Maximum) Compressed Air Leak Repair kWh saved 1 0.00014 3 $0.14 $0.08 - $0.1011
SEI EC Motor for Walk-in
Motor 759 0.09 15 $250.00 $80.00
SEI Air-entraining air nozzle Nozzle 800 0.19231 10 $14.00 $5.00
SEI Cycling Refrigerated Thermal Mass Dryer
Compressor HP 44.5 0.0107 10 $30.00 $10.00
SEI No-loss Condensate Drains Drain 650 0.15625 5 $200.00 $75.00
SEI Storage Tanks for Load/No Load Screw Compressors
Compressor HP 277.4 0.06669 10 $60.00 $25.00
SEI EMS, Basic Time Control Square Foot 1.9 0.00009 15 $0.51 $0.10
SEI EMS, No Present Time Control Square Foot 2 0.00007 15 $0.51 $0.21
SEI Hotel Guest Room Occupancy Sensor (Electric Heat/AC)
Sensor 1117 0.0738 10 $260.00 $60.00
SEI < 65,000 Btu/h (5.4 tons) - 15 SEER Air Source AC
Ton 135 0.08246 15 $180.43 $50 - $70
SEI >= 240,000 Btu/h and < 760,000 Btu/h (21-63 tons) Air Source AC
Ton 124.4 0.07596 15 $32.38 $25-$45
SEI >= 65,000 Btu/h and < 120,000 Btu/h (5.5-10 tons) Air Source AC
Ton 99.7 0.06091 15 $27.35 $25 - $45
11 The compressed air leak repair initiative will reimburse customers for the cost of compressed air audits on a sliding scale, depending on the measures implemented. Because the audit costs and rate of reimbursement will vary significantly from customer to customer, the incentive respresents the estimated cost per kWh.
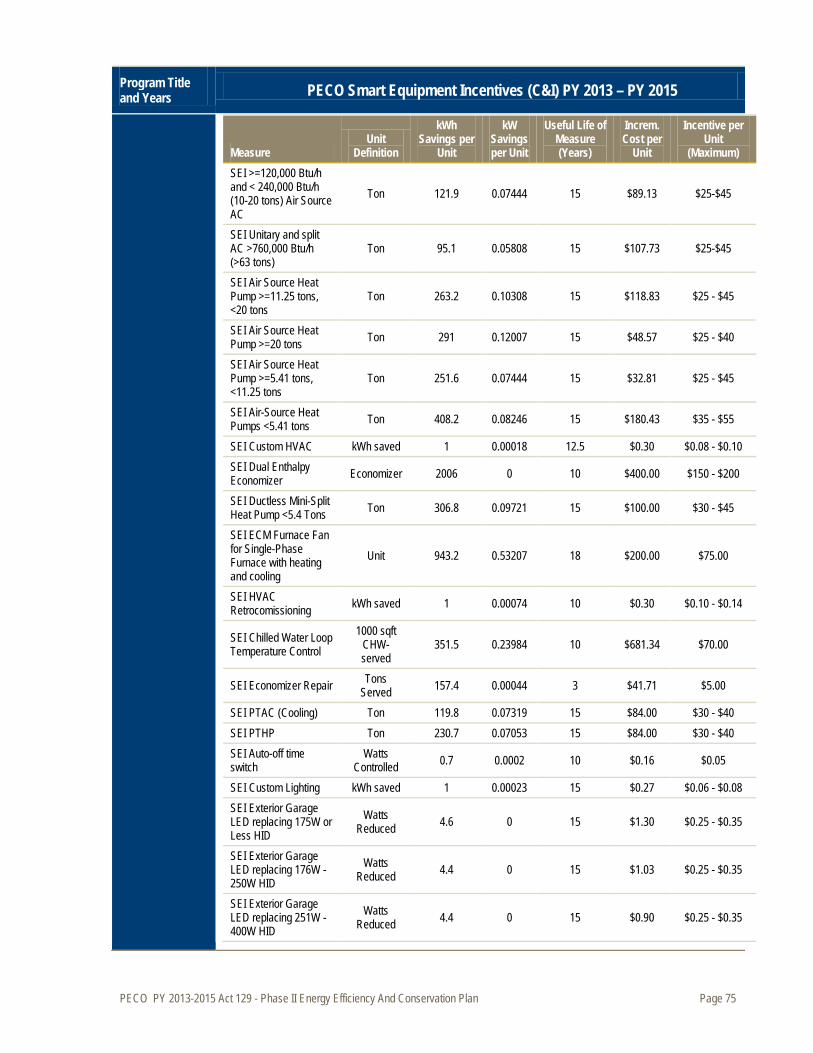
PECO PY 2013-2015 Act 129 - Phase II Energy Efficiency And Conservation Plan Page 75
Program Title and Years PECO Smart Equipment Incentives (C&I) PY 2013 – PY 2015
Measure Unit
Definition
kWh Savings per
Unit
kW Savings per Unit
Useful Life of Measure (Years)
Increm. Cost per
Unit
Incentive per Unit
(Maximum) SEI >=120,000 Btu/h and < 240,000 Btu/h (10-20 tons) Air Source AC
Ton 121.9 0.07444 15 $89.13 $25-$45
SEI Unitary and split AC >760,000 Btu/h (>63 tons)
Ton 95.1 0.05808 15 $107.73 $25-$45
SEI Air Source Heat Pump >=11.25 tons, <20 tons
Ton 263.2 0.10308 15 $118.83 $25 - $45
SEI Air Source Heat Pump >=20 tons Ton 291 0.12007 15 $48.57 $25 - $40
SEI Air Source Heat Pump >=5.41 tons, <11.25 tons
Ton 251.6 0.07444 15 $32.81 $25 - $45
SEI Air-Source Heat Pumps <5.41 tons Ton 408.2 0.08246 15 $180.43 $35 - $55
SEI Custom HVAC kWh saved 1 0.00018 12.5 $0.30 $0.08 - $0.10 SEI Dual Enthalpy Economizer Economizer 2006 0 10 $400.00 $150 - $200
SEI Ductless Mini-Split Heat Pump <5.4 Tons Ton 306.8 0.09721 15 $100.00 $30 - $45
SEI ECM Furnace Fan for Single-Phase Furnace with heating and cooling
Unit 943.2 0.53207 18 $200.00 $75.00
SEI HVAC Retrocomissioning kWh saved 1 0.00074 10 $0.30 $0.10 - $0.14
SEI Chilled Water Loop Temperature Control
1000 sqft CHW-served
351.5 0.23984 10 $681.34 $70.00
SEI Economizer Repair Tons Served 157.4 0.00044 3 $41.71 $5.00
SEI PTAC (Cooling) Ton 119.8 0.07319 15 $84.00 $30 - $40 SEI PTHP Ton 230.7 0.07053 15 $84.00 $30 - $40 SEI Auto-off time switch
Watts Controlled 0.7 0.0002 10 $0.16 $0.05
SEI Custom Lighting kWh saved 1 0.00023 15 $0.27 $0.06 - $0.08 SEI Exterior Garage LED replacing 175W or Less HID
Watts Reduced 4.6 0 15 $1.30 $0.25 - $0.35
SEI Exterior Garage LED replacing 176W - 250W HID
Watts Reduced 4.4 0 15 $1.03 $0.25 - $0.35
SEI Exterior Garage LED replacing 251W - 400W HID
Watts Reduced 4.4 0 15 $0.90 $0.25 - $0.35
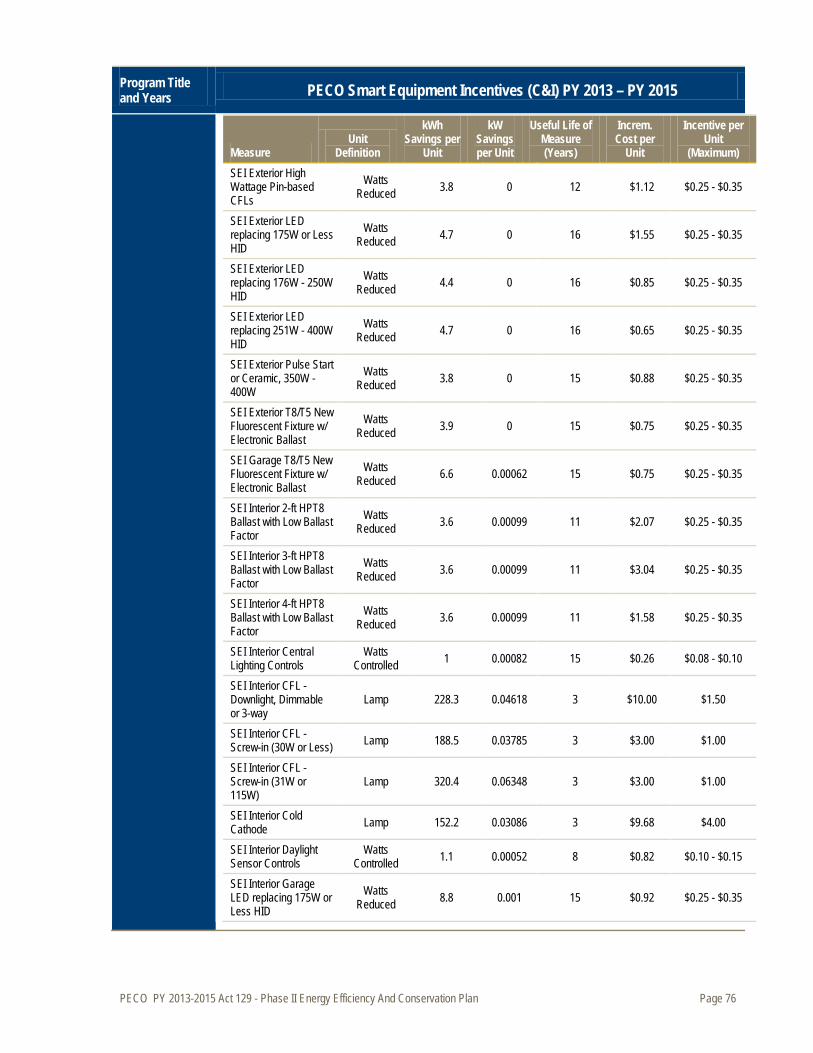
PECO PY 2013-2015 Act 129 - Phase II Energy Efficiency And Conservation Plan Page 76
Program Title and Years PECO Smart Equipment Incentives (C&I) PY 2013 – PY 2015
Measure Unit
Definition
kWh Savings per
Unit
kW Savings per Unit
Useful Life of Measure (Years)
Increm. Cost per
Unit
Incentive per Unit
(Maximum) SEI Exterior High Wattage Pin-based CFLs
Watts Reduced 3.8 0 12 $1.12 $0.25 - $0.35
SEI Exterior LED replacing 175W or Less HID
Watts Reduced 4.7 0 16 $1.55 $0.25 - $0.35
SEI Exterior LED replacing 176W - 250W HID
Watts Reduced 4.4 0 16 $0.85 $0.25 - $0.35
SEI Exterior LED replacing 251W - 400W HID
Watts Reduced 4.7 0 16 $0.65 $0.25 - $0.35
SEI Exterior Pulse Start or Ceramic, 350W - 400W
Watts Reduced 3.8 0 15 $0.88 $0.25 - $0.35
SEI Exterior T8/T5 New Fluorescent Fixture w/ Electronic Ballast
Watts Reduced 3.9 0 15 $0.75 $0.25 - $0.35
SEI Garage T8/T5 New Fluorescent Fixture w/ Electronic Ballast
Watts Reduced 6.6 0.00062 15 $0.75 $0.25 - $0.35
SEI Interior 2-ft HPT8 Ballast with Low Ballast Factor
Watts Reduced 3.6 0.00099 11 $2.07 $0.25 - $0.35
SEI Interior 3-ft HPT8 Ballast with Low Ballast Factor
Watts Reduced 3.6 0.00099 11 $3.04 $0.25 - $0.35
SEI Interior 4-ft HPT8 Ballast with Low Ballast Factor
Watts Reduced 3.6 0.00099 11 $1.58 $0.25 - $0.35
SEI Interior Central Lighting Controls
Watts Controlled 1 0.00082 15 $0.26 $0.08 - $0.10
SEI Interior CFL - Downlight, Dimmable or 3-way
Lamp 228.3 0.04618 3 $10.00 $1.50
SEI Interior CFL - Screw-in (30W or Less) Lamp 188.5 0.03785 3 $3.00 $1.00
SEI Interior CFL - Screw-in (31W or 115W)
Lamp 320.4 0.06348 3 $3.00 $1.00
SEI Interior Cold Cathode Lamp 152.2 0.03086 3 $9.68 $4.00
SEI Interior Daylight Sensor Controls
Watts Controlled 1.1 0.00052 8 $0.82 $0.10 - $0.15
SEI Interior Garage LED replacing 175W or Less HID
Watts Reduced 8.8 0.001 15 $0.92 $0.25 - $0.35

PECO PY 2013-2015 Act 129 - Phase II Energy Efficiency And Conservation Plan Page 77
Program Title and Years PECO Smart Equipment Incentives (C&I) PY 2013 – PY 2015
Measure Unit
Definition
kWh Savings per
Unit
kW Savings per Unit
Useful Life of Measure (Years)
Increm. Cost per
Unit
Incentive per Unit
(Maximum) SEI Interior Garage LED replacing 176W - 250W HID
Watts Reduced 8.8 0.001 15 $0.79 $0.25 - $0.35
SEI Interior Garage LED replacing 251W - 400W HID
Watts Reduced 8.8 0.001 15 $0.46 $0.25 - $0.35
SEI Interior RW T8 - 4-ft Reduced Watt Lamp only
Watts Reduced 0.6 0.00017 12 $0.07 $0.02
SEI Interior Hard-wired CFL - 29W or Less
Watts Reduced 4.1 0.00081 12 $0.97 $0.25 - $0.35
SEI Interior Hard-wired CFL - 30W or Greater
Watts Reduced 4 0.00078 12 $0.60 $0.25 - $0.35
SEI Interior Induction Fixture
Watts Reduced 3.9 0.00075 15 $0.86 $0.25 - $0.35
SEI Interior Integrated Ballast Ceramic Metal Halide Lamps
Watts Reduced 4 0.00076 15 $0.43 $0.25 - $0.35
SEI Interior LED Desk Lighting 7-8 W
Watts Reduced 3.3 0.00088 10 $0.92 $0.25 - $0.35
SEI Interior LED, T-1, or Electroluminescent Exit Signs
Watts Reduced 9.7 0.0013 16 $1.90 $0.25 - $0.35
SEI Interior Occupancy Sensor
Watts Controlled 1 0.00067 8 $0.32 $0.20 - $0.25
SEI Interior Permanent Lamp Removal - 2-ft Lamp
Lamp Removed 163.8 0.03321 12 $25.00 $5 - $7.50
SEI Interior Permanent Lamp Removal - 3-ft Lamp
Lamp Removed 247.6 0.05019 12 $25.70 $5 - $7.50
SEI Interior Permanent Lamp Removal - 4-ft Lamp
Lamp Removed 339.7 0.06777 12 $25.70 $5 - $7.50
SEI Interior Permanent Lamp Removal - 8-ft Lamp
Lamp Removed 500.4 0.09897 12 $25.91 $5 - $7.50
SEI Interior Recessed LED Downlighting >50 W
Watts Reduced 3.8 0.001 10 $0.49 $0.25 - $0.35
SEI Interior Recessed LED Downlighting 21-30 W
Watts Reduced 3.8 0.001 10 $1.35 $0.25 - $0.35
SEI Interior Recessed LED Downlighting 31-50 W
Watts Reduced 3.8 0.001 10 $0.88 $0.25 - $0.35
SEI Interior Recessed LED Downlighting 7-20 W
Watts Reduced 3.8 0.001 10 $2.11 $0.25 - $0.35
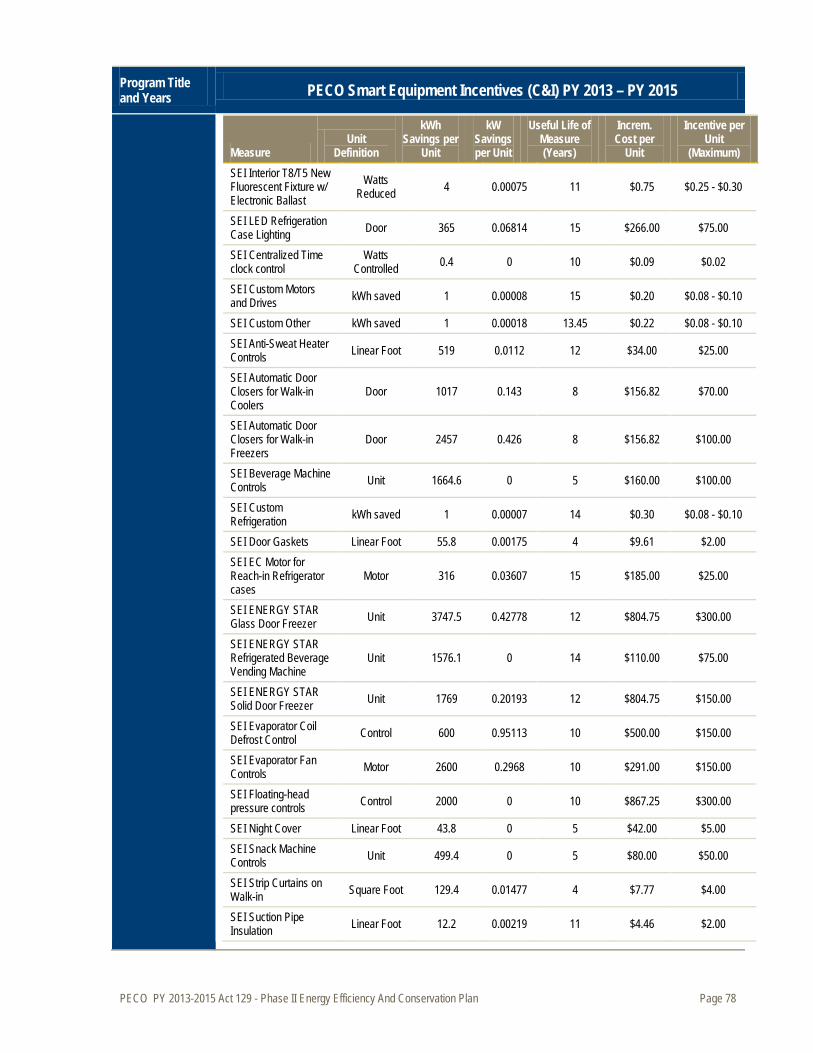
PECO PY 2013-2015 Act 129 - Phase II Energy Efficiency And Conservation Plan Page 78
Program Title and Years PECO Smart Equipment Incentives (C&I) PY 2013 – PY 2015
Measure Unit
Definition
kWh Savings per
Unit
kW Savings per Unit
Useful Life of Measure (Years)
Increm. Cost per
Unit
Incentive per Unit
(Maximum) SEI Interior T8/T5 New Fluorescent Fixture w/ Electronic Ballast
Watts Reduced 4 0.00075 11 $0.75 $0.25 - $0.30
SEI LED Refrigeration Case Lighting Door 365 0.06814 15 $266.00 $75.00
SEI Centralized Time clock control
Watts Controlled 0.4 0 10 $0.09 $0.02
SEI Custom Motors and Drives kWh saved 1 0.00008 15 $0.20 $0.08 - $0.10
SEI Custom Other kWh saved 1 0.00018 13.45 $0.22 $0.08 - $0.10 SEI Anti-Sweat Heater Controls Linear Foot 519 0.0112 12 $34.00 $25.00
SEI Automatic Door Closers for Walk-in Coolers
Door 1017 0.143 8 $156.82 $70.00
SEI Automatic Door Closers for Walk-in Freezers
Door 2457 0.426 8 $156.82 $100.00
SEI Beverage Machine Controls Unit 1664.6 0 5 $160.00 $100.00
SEI Custom Refrigeration kWh saved 1 0.00007 14 $0.30 $0.08 - $0.10
SEI Door Gaskets Linear Foot 55.8 0.00175 4 $9.61 $2.00 SEI EC Motor for Reach-in Refrigerator cases
Motor 316 0.03607 15 $185.00 $25.00
SEI ENERGY STAR Glass Door Freezer Unit 3747.5 0.42778 12 $804.75 $300.00
SEI ENERGY STAR Refrigerated Beverage Vending Machine
Unit 1576.1 0 14 $110.00 $75.00
SEI ENERGY STAR Solid Door Freezer Unit 1769 0.20193 12 $804.75 $150.00
SEI Evaporator Coil Defrost Control Control 600 0.95113 10 $500.00 $150.00
SEI Evaporator Fan Controls Motor 2600 0.2968 10 $291.00 $150.00
SEI Floating-head pressure controls Control 2000 0 10 $867.25 $300.00
SEI Night Cover Linear Foot 43.8 0 5 $42.00 $5.00 SEI Snack Machine Controls Unit 499.4 0 5 $80.00 $50.00
SEI Strip Curtains on Walk-in Square Foot 129.4 0.01477 4 $7.77 $4.00
SEI Suction Pipe Insulation Linear Foot 12.2 0.00219 11 $4.46 $2.00
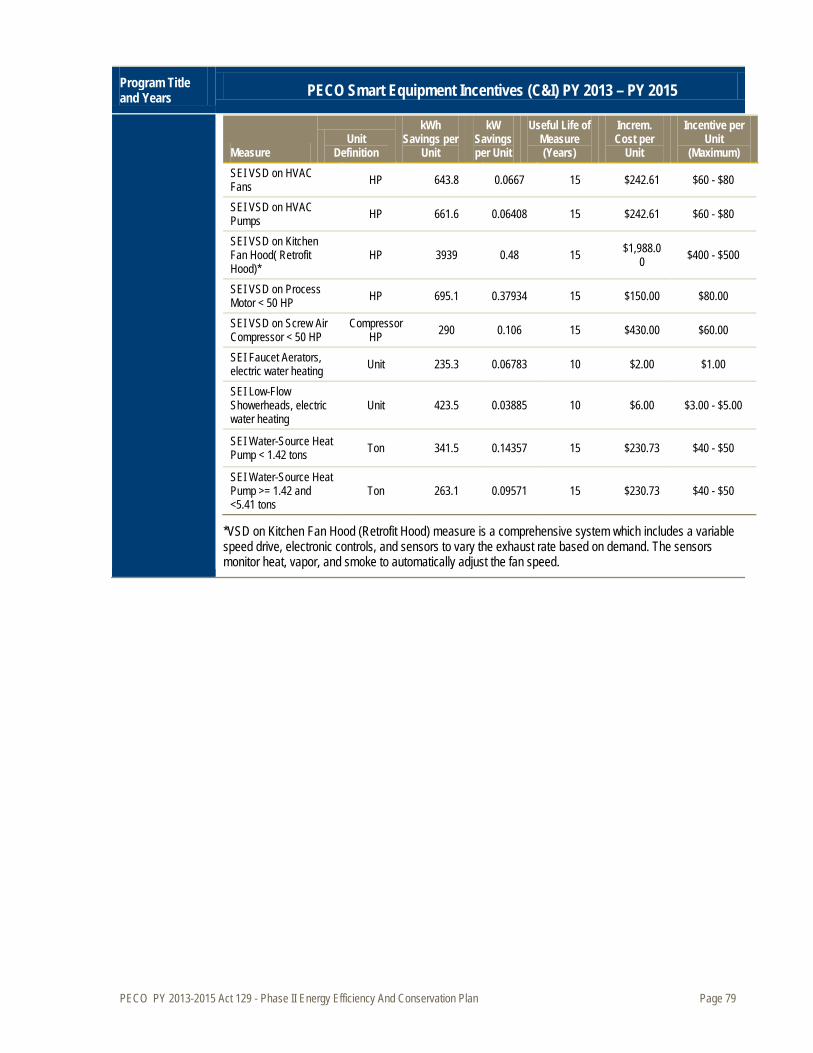
PECO PY 2013-2015 Act 129 - Phase II Energy Efficiency And Conservation Plan Page 79
Program Title and Years PECO Smart Equipment Incentives (C&I) PY 2013 – PY 2015
Measure Unit
Definition
kWh Savings per
Unit
kW Savings per Unit
Useful Life of Measure (Years)
Increm. Cost per
Unit
Incentive per Unit
(Maximum) SEI VSD on HVAC Fans HP 643.8 0.0667 15 $242.61 $60 - $80
SEI VSD on HVAC Pumps HP 661.6 0.06408 15 $242.61 $60 - $80
SEI VSD on Kitchen Fan Hood( Retrofit Hood)*
HP 3939 0.48 15 $1,988.00 $400 - $500
SEI VSD on Process Motor < 50 HP HP 695.1 0.37934 15 $150.00 $80.00
SEI VSD on Screw Air Compressor < 50 HP
Compressor HP 290 0.106 15 $430.00 $60.00
SEI Faucet Aerators, electric water heating Unit 235.3 0.06783 10 $2.00 $1.00
SEI Low-Flow Showerheads, electric water heating
Unit 423.5 0.03885 10 $6.00 $3.00 - $5.00
SEI Water-Source Heat Pump < 1.42 tons Ton 341.5 0.14357 15 $230.73 $40 - $50
SEI Water-Source Heat Pump >= 1.42 and <5.41 tons
Ton 263.1 0.09571 15 $230.73 $40 - $50
*VSD on Kitchen Fan Hood (Retrofit Hood) measure is a comprehensive system which includes a variable speed drive, electronic controls, and sensors to vary the exhaust rate based on demand. The sensors monitor heat, vapor, and smoke to automatically adjust the fan speed.

PECO PY 2013-2015 Act 129 - Phase II Energy Efficiency And Conservation Plan Page 80
Program Title and Years PECO Smart Equipment Incentives (C&I) PY 2013 – PY 2015
Program Start Date and Key Milestones
The PECO Smart Equipment Incentives (C&I) program will be rolled out to the public during PY 2013. The program will operate from PY 2013 through PY 2015. The following table provides a schedule of key milestones:
Proposed PECO Smart Equipment Incentives (C&I) Implementation Schedule Key Milestone Timing CSP Selection Process November 2012 – February 2013 Promotional Material Development and Participation Applications March-May 2013
Program Launch June 1, 2013
Evaluation, Measurement, and Verification Requirements
The evaluation methodology and data collection proposed for the program are guidelines that reflect current measurement and verification (EM&V) practices. The ultimate EM&V requirements for this program will conform to the state protocols once they are published.
Primary:
Metrics for Gauging Program Success
» Number of program measures installed » Energy and demand savings associated with installed measures » Customer satisfaction with the program and the products » Program implementation costs incurred
Secondary: » Distribution of measure popularity and cost-effectiveness of program, to enable program
improvement » Number and variety of suppliers/contractors who stock qualified products
Data for evaluating the program may come from the following sources:
Data Collection Approaches
» Impact Evaluation o Tracking system data for all projects o Review of a sample of projects to verify operation as reported o PECO customer energy consumption data for engineering or statistical analyses of
impacts » Process Evaluation » Evaluation of program design and implementation process will be conducted by gathering and
analyzing data through a variety of surveys and interviews, including: o Follow-up surveys of C&I customers from customer information provided in the PECO
tracking system and from PECO customer information system (for nonparticipants) o Surveys of upstream suppliers engaged in promoting the program and assisting customers
with project development and incentive application submittal o Interviews with the implementation CSP and PECO program staff o Review of program documents and tracking system data
The program will record energy savings and peak load reductions from the incentive applications processed. For projects with measures in the TRM, which will likely include the small business direct installation projects, recorded savings will be based on the algorithms or deemed values in the TRM. Some number of projects will be inspected for independent verification of installation and operation as
Impact Evaluation Methodology
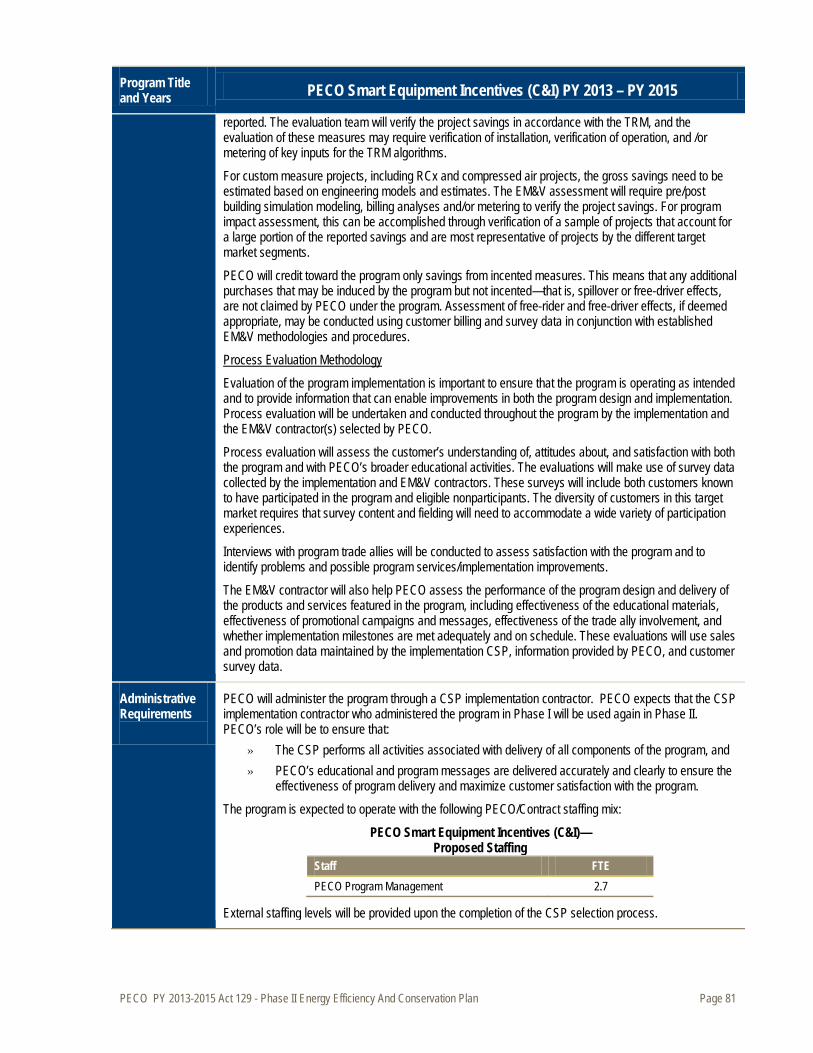
PECO PY 2013-2015 Act 129 - Phase II Energy Efficiency And Conservation Plan Page 81
Program Title and Years PECO Smart Equipment Incentives (C&I) PY 2013 – PY 2015
reported. The evaluation team will verify the project savings in accordance with the TRM, and the evaluation of these measures may require verification of installation, verification of operation, and /or metering of key inputs for the TRM algorithms.
For custom measure projects, including RCx and compressed air projects, the gross savings need to be estimated based on engineering models and estimates. The EM&V assessment will require pre/post building simulation modeling, billing analyses and/or metering to verify the project savings. For program impact assessment, this can be accomplished through verification of a sample of projects that account for a large portion of the reported savings and are most representative of projects by the different target market segments.
PECO will credit toward the program only savings from incented measures. This means that any additional purchases that may be induced by the program but not incented—that is, spillover or free-driver effects, are not claimed by PECO under the program. Assessment of free-rider and free-driver effects, if deemed appropriate, may be conducted using customer billing and survey data in conjunction with established EM&V methodologies and procedures.
Evaluation of the program implementation is important to ensure that the program is operating as intended and to provide information that can enable improvements in both the program design and implementation. Process evaluation will be undertaken and conducted throughout the program by the implementation and the EM&V contractor(s) selected by PECO.
Process Evaluation Methodology
Process evaluation will assess the customer’s understanding of, attitudes about, and satisfaction with both the program and with PECO’s broader educational activities. The evaluations will make use of survey data collected by the implementation and EM&V contractors. These surveys will include both customers known to have participated in the program and eligible nonparticipants. The diversity of customers in this target market requires that survey content and fielding will need to accommodate a wide variety of participation experiences.
Interviews with program trade allies will be conducted to assess satisfaction with the program and to identify problems and possible program services/implementation improvements.
The EM&V contractor will also help PECO assess the performance of the program design and delivery of the products and services featured in the program, including effectiveness of the educational materials, effectiveness of promotional campaigns and messages, effectiveness of the trade ally involvement, and whether implementation milestones are met adequately and on schedule. These evaluations will use sales and promotion data maintained by the implementation CSP, information provided by PECO, and customer survey data.
Administrative Requirements
PECO will administer the program through a CSP implementation contractor. PECO expects that the CSP implementation contractor who administered the program in Phase I will be used again in Phase II. PECO’s role will be to ensure that:
» The CSP performs all activities associated with delivery of all components of the program, and » PECO’s educational and program messages are delivered accurately and clearly to ensure the
effectiveness of program delivery and maximize customer satisfaction with the program. The program is expected to operate with the following PECO/Contract staffing mix:
PECO Smart Equipment Incentives (C&I)— Proposed Staffing
Staff FTE PECO Program Management 2.7
External staffing levels will be provided upon the completion of the CSP selection process.
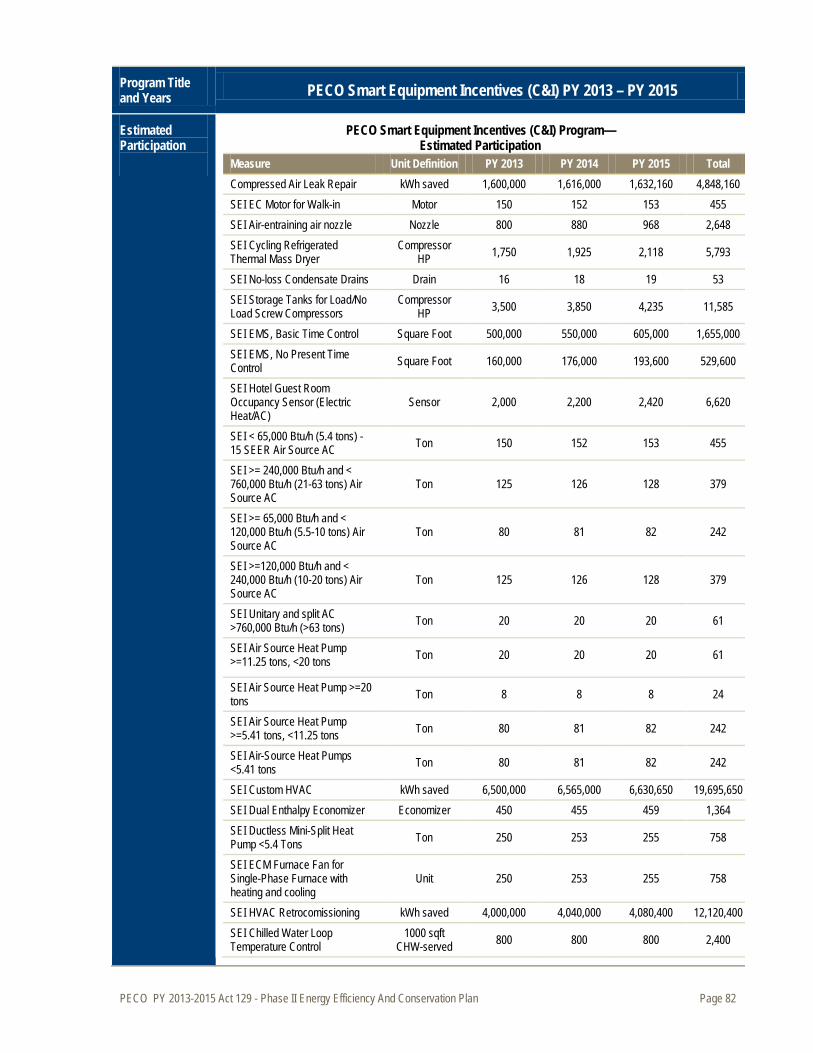
PECO PY 2013-2015 Act 129 - Phase II Energy Efficiency And Conservation Plan Page 82
Program Title and Years PECO Smart Equipment Incentives (C&I) PY 2013 – PY 2015
Estimated Participation
PECO Smart Equipment Incentives (C&I) Program— Estimated Participation
Measure Unit Definition PY 2013 PY 2014 PY 2015 Total Compressed Air Leak Repair kWh saved 1,600,000 1,616,000 1,632,160 4,848,160 SEI EC Motor for Walk-in Motor 150 152 153 455 SEI Air-entraining air nozzle Nozzle 800 880 968 2,648 SEI Cycling Refrigerated Thermal Mass Dryer
Compressor HP 1,750 1,925 2,118 5,793
SEI No-loss Condensate Drains Drain 16 18 19 53 SEI Storage Tanks for Load/No Load Screw Compressors
Compressor HP 3,500 3,850 4,235 11,585
SEI EMS, Basic Time Control Square Foot 500,000 550,000 605,000 1,655,000 SEI EMS, No Present Time Control Square Foot 160,000 176,000 193,600 529,600
SEI Hotel Guest Room Occupancy Sensor (Electric Heat/AC)
Sensor 2,000 2,200 2,420 6,620
SEI < 65,000 Btu/h (5.4 tons) - 15 SEER Air Source AC Ton 150 152 153 455
SEI >= 240,000 Btu/h and < 760,000 Btu/h (21-63 tons) Air Source AC
Ton 125 126 128 379
SEI >= 65,000 Btu/h and < 120,000 Btu/h (5.5-10 tons) Air Source AC
Ton 80 81 82 242
SEI >=120,000 Btu/h and < 240,000 Btu/h (10-20 tons) Air Source AC
Ton 125 126 128 379
SEI Unitary and split AC >760,000 Btu/h (>63 tons) Ton 20 20 20 61
SEI Air Source Heat Pump >=11.25 tons, <20 tons Ton 20 20 20 61
SEI Air Source Heat Pump >=20 tons Ton 8 8 8 24
SEI Air Source Heat Pump >=5.41 tons, <11.25 tons Ton 80 81 82 242
SEI Air-Source Heat Pumps <5.41 tons Ton 80 81 82 242
SEI Custom HVAC kWh saved 6,500,000 6,565,000 6,630,650 19,695,650 SEI Dual Enthalpy Economizer Economizer 450 455 459 1,364 SEI Ductless Mini-Split Heat Pump <5.4 Tons Ton 250 253 255 758
SEI ECM Furnace Fan for Single-Phase Furnace with heating and cooling
Unit 250 253 255 758
SEI HVAC Retrocomissioning kWh saved 4,000,000 4,040,000 4,080,400 12,120,400 SEI Chilled Water Loop Temperature Control
1000 sqft CHW-served 800 800 800 2,400
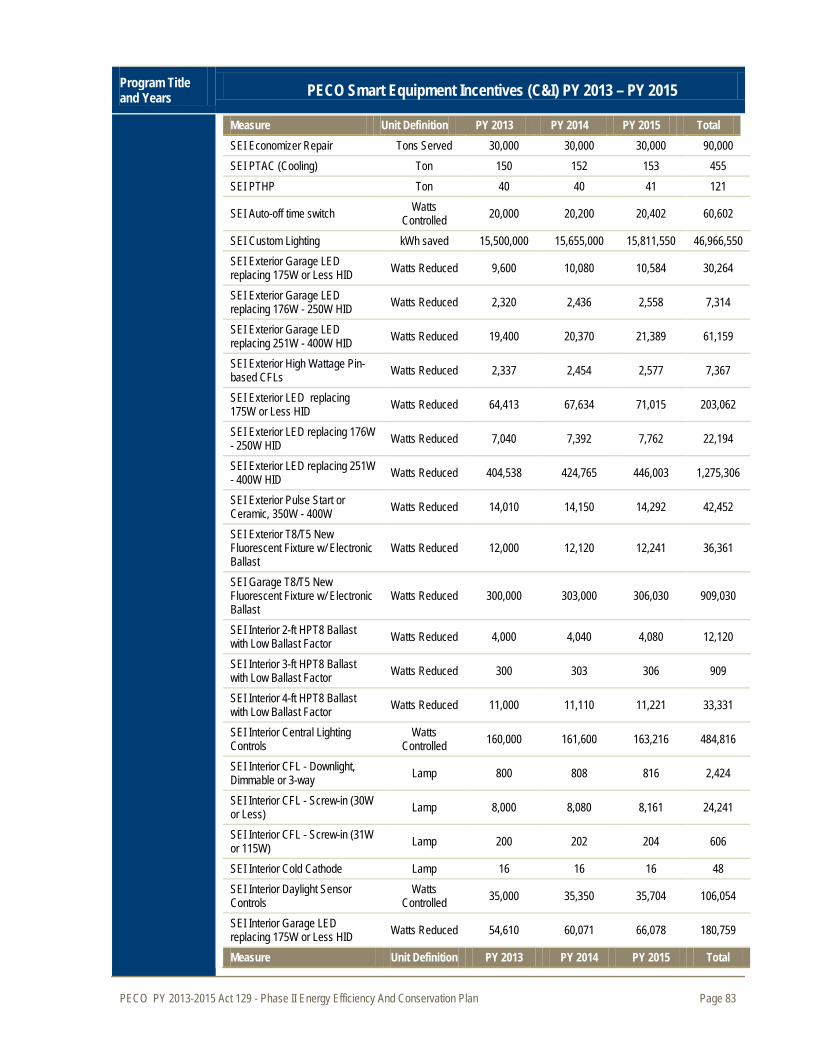
PECO PY 2013-2015 Act 129 - Phase II Energy Efficiency And Conservation Plan Page 83
Program Title and Years PECO Smart Equipment Incentives (C&I) PY 2013 – PY 2015
Measure Unit Definition PY 2013 PY 2014 PY 2015 Total SEI Economizer Repair Tons Served 30,000 30,000 30,000 90,000 SEI PTAC (Cooling) Ton 150 152 153 455 SEI PTHP Ton 40 40 41 121
SEI Auto-off time switch Watts Controlled 20,000 20,200 20,402 60,602
SEI Custom Lighting kWh saved 15,500,000 15,655,000 15,811,550 46,966,550 SEI Exterior Garage LED replacing 175W or Less HID Watts Reduced 9,600 10,080 10,584 30,264
SEI Exterior Garage LED replacing 176W - 250W HID Watts Reduced 2,320 2,436 2,558 7,314
SEI Exterior Garage LED replacing 251W - 400W HID Watts Reduced 19,400 20,370 21,389 61,159
SEI Exterior High Wattage Pin-based CFLs Watts Reduced 2,337 2,454 2,577 7,367
SEI Exterior LED replacing 175W or Less HID Watts Reduced 64,413 67,634 71,015 203,062
SEI Exterior LED replacing 176W - 250W HID Watts Reduced 7,040 7,392 7,762 22,194
SEI Exterior LED replacing 251W - 400W HID Watts Reduced 404,538 424,765 446,003 1,275,306
SEI Exterior Pulse Start or Ceramic, 350W - 400W Watts Reduced 14,010 14,150 14,292 42,452
SEI Exterior T8/T5 New Fluorescent Fixture w/ Electronic Ballast
Watts Reduced 12,000 12,120 12,241 36,361
SEI Garage T8/T5 New Fluorescent Fixture w/ Electronic Ballast
Watts Reduced 300,000 303,000 306,030 909,030
SEI Interior 2-ft HPT8 Ballast with Low Ballast Factor Watts Reduced 4,000 4,040 4,080 12,120
SEI Interior 3-ft HPT8 Ballast with Low Ballast Factor Watts Reduced 300 303 306 909
SEI Interior 4-ft HPT8 Ballast with Low Ballast Factor Watts Reduced 11,000 11,110 11,221 33,331
SEI Interior Central Lighting Controls
Watts Controlled 160,000 161,600 163,216 484,816
SEI Interior CFL - Downlight, Dimmable or 3-way Lamp 800 808 816 2,424
SEI Interior CFL - Screw-in (30W or Less) Lamp 8,000 8,080 8,161 24,241
SEI Interior CFL - Screw-in (31W or 115W) Lamp 200 202 204 606
SEI Interior Cold Cathode Lamp 16 16 16 48 SEI Interior Daylight Sensor Controls
Watts Controlled 35,000 35,350 35,704 106,054
SEI Interior Garage LED replacing 175W or Less HID Watts Reduced 54,610 60,071 66,078 180,759
Measure Unit Definition PY 2013 PY 2014 PY 2015 Total
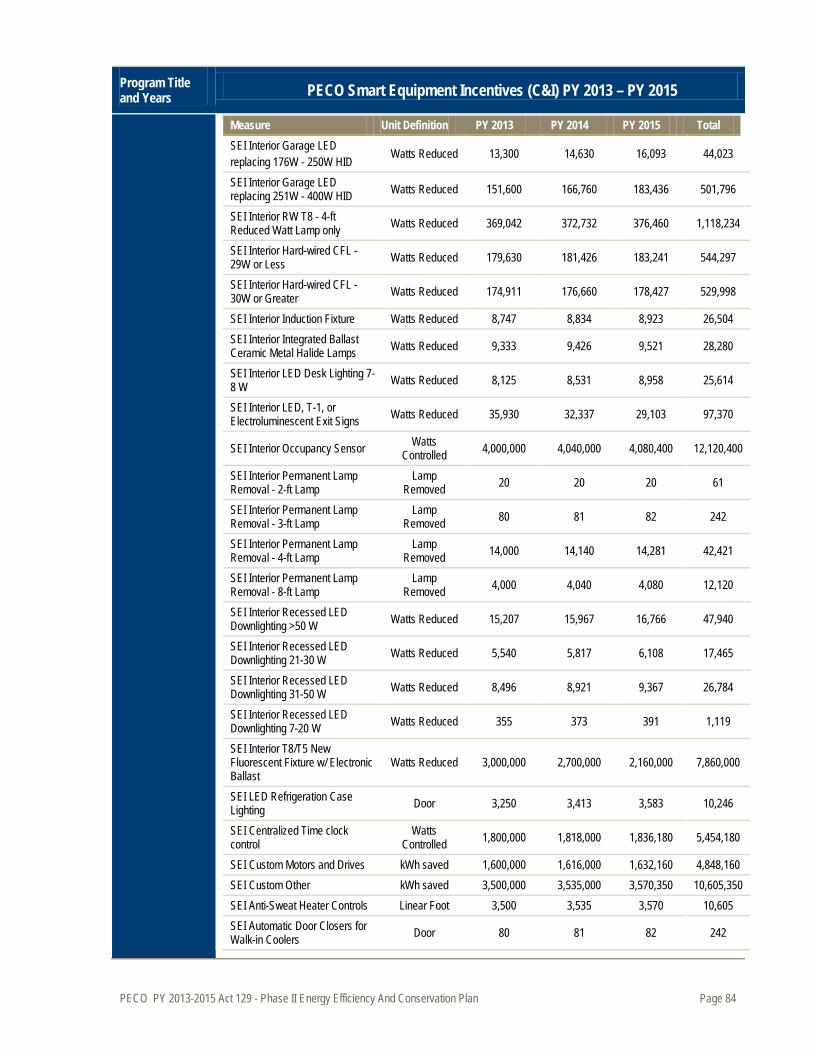
PECO PY 2013-2015 Act 129 - Phase II Energy Efficiency And Conservation Plan Page 84
Program Title and Years PECO Smart Equipment Incentives (C&I) PY 2013 – PY 2015
Measure Unit Definition PY 2013 PY 2014 PY 2015 Total SEI Interior Garage LED replacing 176W - 250W HID Watts Reduced 13,300 14,630 16,093 44,023
SEI Interior Garage LED replacing 251W - 400W HID Watts Reduced 151,600 166,760 183,436 501,796
SEI Interior RW T8 - 4-ft Reduced Watt Lamp only Watts Reduced 369,042 372,732 376,460 1,118,234
SEI Interior Hard-wired CFL - 29W or Less Watts Reduced 179,630 181,426 183,241 544,297
SEI Interior Hard-wired CFL - 30W or Greater Watts Reduced 174,911 176,660 178,427 529,998
SEI Interior Induction Fixture Watts Reduced 8,747 8,834 8,923 26,504 SEI Interior Integrated Ballast Ceramic Metal Halide Lamps Watts Reduced 9,333 9,426 9,521 28,280
SEI Interior LED Desk Lighting 7-8 W Watts Reduced 8,125 8,531 8,958 25,614
SEI Interior LED, T-1, or Electroluminescent Exit Signs Watts Reduced 35,930 32,337 29,103 97,370
SEI Interior Occupancy Sensor Watts Controlled 4,000,000 4,040,000 4,080,400 12,120,400
SEI Interior Permanent Lamp Removal - 2-ft Lamp
Lamp Removed 20 20 20 61
SEI Interior Permanent Lamp Removal - 3-ft Lamp
Lamp Removed 80 81 82 242
SEI Interior Permanent Lamp Removal - 4-ft Lamp
Lamp Removed 14,000 14,140 14,281 42,421
SEI Interior Permanent Lamp Removal - 8-ft Lamp
Lamp Removed 4,000 4,040 4,080 12,120
SEI Interior Recessed LED Downlighting >50 W Watts Reduced 15,207 15,967 16,766 47,940
SEI Interior Recessed LED Downlighting 21-30 W Watts Reduced 5,540 5,817 6,108 17,465
SEI Interior Recessed LED Downlighting 31-50 W Watts Reduced 8,496 8,921 9,367 26,784
SEI Interior Recessed LED Downlighting 7-20 W Watts Reduced 355 373 391 1,119
SEI Interior T8/T5 New Fluorescent Fixture w/ Electronic Ballast
Watts Reduced 3,000,000 2,700,000 2,160,000 7,860,000
SEI LED Refrigeration Case Lighting Door 3,250 3,413 3,583 10,246
SEI Centralized Time clock control
Watts Controlled 1,800,000 1,818,000 1,836,180 5,454,180
SEI Custom Motors and Drives kWh saved 1,600,000 1,616,000 1,632,160 4,848,160 SEI Custom Other kWh saved 3,500,000 3,535,000 3,570,350 10,605,350 SEI Anti-Sweat Heater Controls Linear Foot 3,500 3,535 3,570 10,605 SEI Automatic Door Closers for Walk-in Coolers Door 80 81 82 242
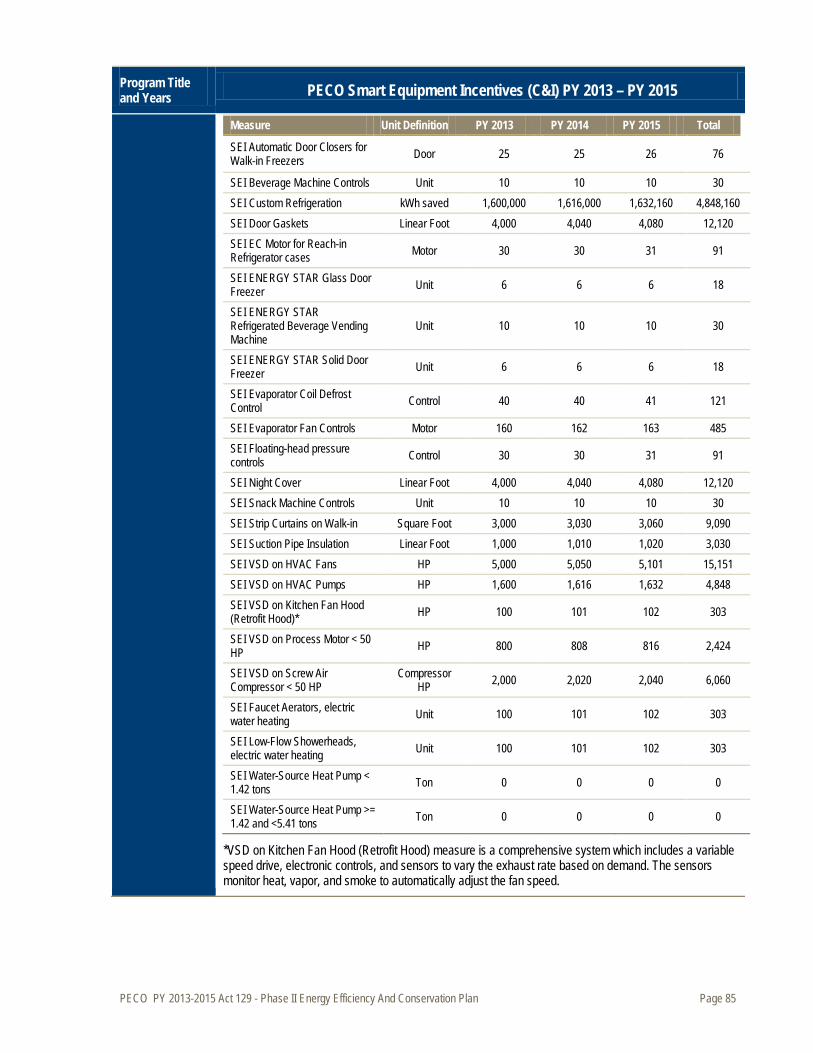
PECO PY 2013-2015 Act 129 - Phase II Energy Efficiency And Conservation Plan Page 85
Program Title and Years PECO Smart Equipment Incentives (C&I) PY 2013 – PY 2015
Measure Unit Definition PY 2013 PY 2014 PY 2015 Total
SEI Automatic Door Closers for Walk-in Freezers Door 25 25 26 76
SEI Beverage Machine Controls Unit 10 10 10 30 SEI Custom Refrigeration kWh saved 1,600,000 1,616,000 1,632,160 4,848,160 SEI Door Gaskets Linear Foot 4,000 4,040 4,080 12,120 SEI EC Motor for Reach-in Refrigerator cases Motor 30 30 31 91
SEI ENERGY STAR Glass Door Freezer Unit 6 6 6 18
SEI ENERGY STAR Refrigerated Beverage Vending Machine
Unit 10 10 10 30
SEI ENERGY STAR Solid Door Freezer Unit 6 6 6 18
SEI Evaporator Coil Defrost Control Control 40 40 41 121
SEI Evaporator Fan Controls Motor 160 162 163 485 SEI Floating-head pressure controls Control 30 30 31 91
SEI Night Cover Linear Foot 4,000 4,040 4,080 12,120 SEI Snack Machine Controls Unit 10 10 10 30 SEI Strip Curtains on Walk-in Square Foot 3,000 3,030 3,060 9,090 SEI Suction Pipe Insulation Linear Foot 1,000 1,010 1,020 3,030 SEI VSD on HVAC Fans HP 5,000 5,050 5,101 15,151 SEI VSD on HVAC Pumps HP 1,600 1,616 1,632 4,848 SEI VSD on Kitchen Fan Hood (Retrofit Hood)* HP 100 101 102 303
SEI VSD on Process Motor < 50 HP HP 800 808 816 2,424
SEI VSD on Screw Air Compressor < 50 HP
Compressor HP 2,000 2,020 2,040 6,060
SEI Faucet Aerators, electric water heating Unit 100 101 102 303
SEI Low-Flow Showerheads, electric water heating Unit 100 101 102 303
SEI Water-Source Heat Pump < 1.42 tons Ton 0 0 0 0
SEI Water-Source Heat Pump >= 1.42 and <5.41 tons Ton 0 0 0 0
*VSD on Kitchen Fan Hood (Retrofit Hood) measure is a comprehensive system which includes a variable speed drive, electronic controls, and sensors to vary the exhaust rate based on demand. The sensors monitor heat, vapor, and smoke to automatically adjust the fan speed.
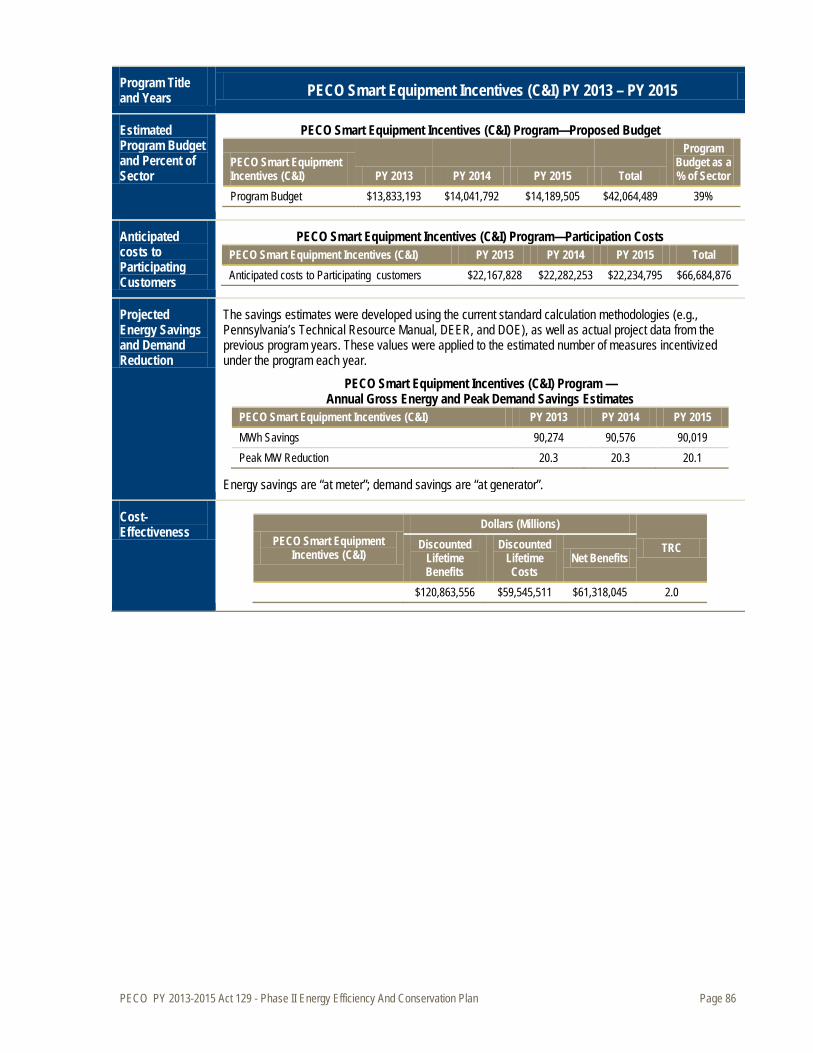
PECO PY 2013-2015 Act 129 - Phase II Energy Efficiency And Conservation Plan Page 86
Program Title and Years PECO Smart Equipment Incentives (C&I) PY 2013 – PY 2015
Estimated Program Budget and Percent of Sector
PECO Smart Equipment Incentives (C&I) Program—Proposed Budget
PECO Smart Equipment Incentives (C&I) PY 2013 PY 2014 PY 2015 Total
Program Budget as a % of Sector
Program Budget $13,833,193 $14,041,792 $14,189,505 $42,064,489 39%
Anticipated costs to Participating Customers
PECO Smart Equipment Incentives (C&I) Program—Participation Costs PECO Smart Equipment Incentives (C&I) PY 2013 PY 2014 PY 2015 Total Anticipated costs to Participating customers $22,167,828 $22,282,253 $22,234,795 $66,684,876
Projected Energy Savings and Demand Reduction
The savings estimates were developed using the current standard calculation methodologies (e.g., Pennsylvania’s Technical Resource Manual, DEER, and DOE), as well as actual project data from the previous program years. These values were applied to the estimated number of measures incentivized under the program each year.
PECO Smart Equipment Incentives (C&I) Program — Annual Gross Energy and Peak Demand Savings Estimates
PECO Smart Equipment Incentives (C&I) PY 2013 PY 2014 PY 2015 MWh Savings 90,274 90,576 90,019 Peak MW Reduction 20.3 20.3 20.1
Energy savings are “at meter”; demand savings are “at generator”.
Cost-Effectiveness
PECO Smart Equipment Incentives (C&I)
Dollars (Millions)
TRC Discounted Lifetime Benefits
Discounted Lifetime Costs
Net Benefits
$120,863,556 $59,545,511 $61,318,045 2.0
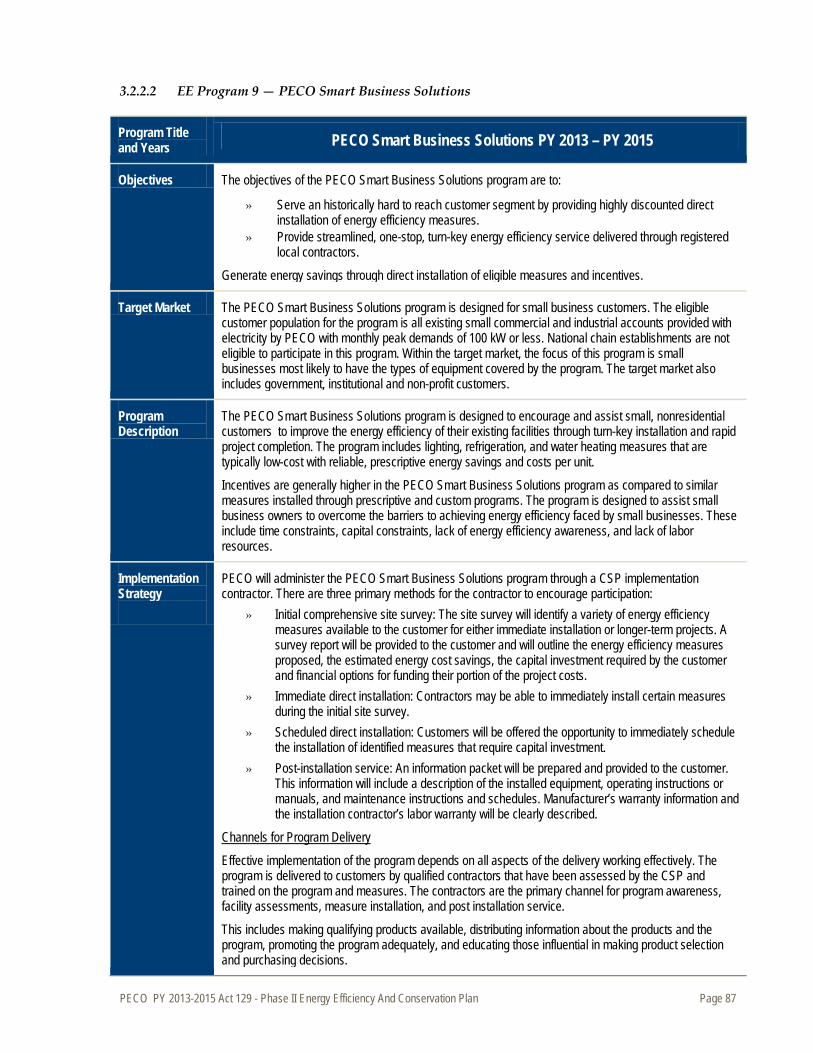
PECO PY 2013-2015 Act 129 - Phase II Energy Efficiency And Conservation Plan Page 87
3.2.2.2 EE Program 9 — PECO Smart Business Solutions
Program Title and Years PECO Smart Business Solutions PY 2013 – PY 2015
Objectives The objectives of the PECO Smart Business Solutions program are to:
» Serve an historically hard to reach customer segment by providing highly discounted direct installation of energy efficiency measures.
» Provide streamlined, one-stop, turn-key energy efficiency service delivered through registered local contractors.
Generate energy savings through direct installation of eligible measures and incentives.
Target Market The PECO Smart Business Solutions program is designed for small business customers. The eligible customer population for the program is all existing small commercial and industrial accounts provided with electricity by PECO with monthly peak demands of 100 kW or less. National chain establishments are not eligible to participate in this program. Within the target market, the focus of this program is small businesses most likely to have the types of equipment covered by the program. The target market also includes government, institutional and non-profit customers.
Program Description
The PECO Smart Business Solutions program is designed to encourage and assist small, nonresidential customers to improve the energy efficiency of their existing facilities through turn-key installation and rapid project completion. The program includes lighting, refrigeration, and water heating measures that are typically low-cost with reliable, prescriptive energy savings and costs per unit. Incentives are generally higher in the PECO Smart Business Solutions program as compared to similar measures installed through prescriptive and custom programs. The program is designed to assist small business owners to overcome the barriers to achieving energy efficiency faced by small businesses. These include time constraints, capital constraints, lack of energy efficiency awareness, and lack of labor resources.
Implementation Strategy
PECO will administer the PECO Smart Business Solutions program through a CSP implementation contractor. There are three primary methods for the contractor to encourage participation:
» Initial comprehensive site survey: The site survey will identify a variety of energy efficiency measures available to the customer for either immediate installation or longer-term projects. A survey report will be provided to the customer and will outline the energy efficiency measures proposed, the estimated energy cost savings, the capital investment required by the customer and financial options for funding their portion of the project costs.
» Immediate direct installation: Contractors may be able to immediately install certain measures during the initial site survey.
» Scheduled direct installation: Customers will be offered the opportunity to immediately schedule the installation of identified measures that require capital investment.
» Post-installation service: An information packet will be prepared and provided to the customer. This information will include a description of the installed equipment, operating instructions or manuals, and maintenance instructions and schedules. Manufacturer’s warranty information and the installation contractor’s labor warranty will be clearly described.
Effective implementation of the program depends on all aspects of the delivery working effectively. The program is delivered to customers by qualified contractors that have been assessed by the CSP and trained on the program and measures. The contractors are the primary channel for program awareness, facility assessments, measure installation, and post installation service.
Channels for Program Delivery
This includes making qualifying products available, distributing information about the products and the program, promoting the program adequately, and educating those influential in making product selection and purchasing decisions.
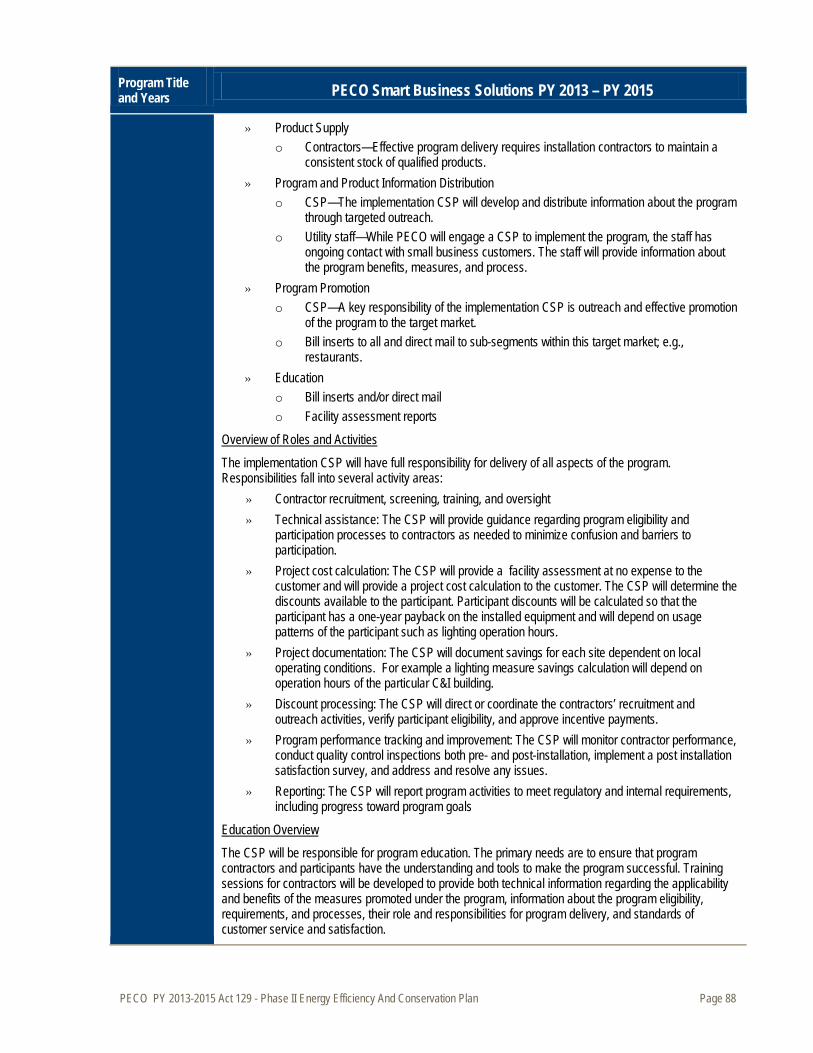
PECO PY 2013-2015 Act 129 - Phase II Energy Efficiency And Conservation Plan Page 88
Program Title and Years PECO Smart Business Solutions PY 2013 – PY 2015
» Product Supply o Contractors—Effective program delivery requires installation contractors to maintain a
consistent stock of qualified products. » Program and Product Information Distribution
o CSP—The implementation CSP will develop and distribute information about the program through targeted outreach.
o Utility staff—While PECO will engage a CSP to implement the program, the staff has ongoing contact with small business customers. The staff will provide information about the program benefits, measures, and process.
» Program Promotion o CSP—A key responsibility of the implementation CSP is outreach and effective promotion
of the program to the target market. o Bill inserts to all and direct mail to sub-segments within this target market; e.g.,
restaurants. » Education
o Bill inserts and/or direct mail o Facility assessment reports
The implementation CSP will have full responsibility for delivery of all aspects of the program. Responsibilities fall into several activity areas:
Overview of Roles and Activities
» Contractor recruitment, screening, training, and oversight » Technical assistance: The CSP will provide guidance regarding program eligibility and
participation processes to contractors as needed to minimize confusion and barriers to participation.
» Project cost calculation: The CSP will provide a facility assessment at no expense to the customer and will provide a project cost calculation to the customer. The CSP will determine the discounts available to the participant. Participant discounts will be calculated so that the participant has a one-year payback on the installed equipment and will depend on usage patterns of the participant such as lighting operation hours.
» Project documentation: The CSP will document savings for each site dependent on local operating conditions. For example a lighting measure savings calculation will depend on operation hours of the particular C&I building.
» Discount processing: The CSP will direct or coordinate the contractors’ recruitment and outreach activities, verify participant eligibility, and approve incentive payments.
» Program performance tracking and improvement: The CSP will monitor contractor performance, conduct quality control inspections both pre- and post-installation, implement a post installation satisfaction survey, and address and resolve any issues.
» Reporting: The CSP will report program activities to meet regulatory and internal requirements, including progress toward program goals
The CSP will be responsible for program education. The primary needs are to ensure that program contractors and participants have the understanding and tools to make the program successful. Training sessions for contractors will be developed to provide both technical information regarding the applicability and benefits of the measures promoted under the program, information about the program eligibility, requirements, and processes, their role and responsibilities for program delivery, and standards of customer service and satisfaction.
Education Overview
PECO PY 2013-2015 Act 129 - Phase II Energy Efficiency And Conservation Plan Page 89
Program Title and Years PECO Smart Business Solutions PY 2013 – PY 2015
Program Issues, Risks, and Risk Management Strategies
Several market barriers inhibit the participation in energy efficiency programs. Such barriers, which the program implementation activities will address, include:
» Hard-To-Reach Markets: Some small business owners may distrust those outside of certain cultures. Many ethnicities prefer to conduct business dealings within their established circles and are distrustful of outsiders, government, or corporations. The CSP will be required to conduct outreach to local community organizations to educate members on the availably of the program, its legitimacy, and the benefits to and requirements of the participants. These community organizations will include places of worship, neighborhood associations, and chambers of commerce.
» Capital Constrained Target Market: Small businesses are often capital constrained or lack access to attractive financing for capital improvements. The program largely overcomes this barrier by setting the incentives higher than the standard prescriptive incentive, greatly reducing the customers’ copayment. In addition, the implementation CSP will work with available financing entities to incorporate information about low-cost financing into the program offering and ensure that the financing process, terms, and eligibility requirements are well-understood.
» Skepticism: Some small businesses are confused or distrustful when approached by a third-party offering energy-related products or services. The program implementation strategy will overcome this in several ways. First, the CSP training will cover the appropriate messages that should be used by the program personnel when describing the program to the participants. Next, PECO’s oversight of the program will be made clear through co-branding of the printed materials and proper identification for the program personnel. Lastly, general awareness of the program in the targeted communities will be promoted through bill inserts and direct mail.
Ramp Up Strategy
Prior to program launch, considerable effort needs to go into preparing the ground for the success of the program, including:
» Screen and select the prime implementation CSP - PECO will use a competitive bidding process to select an implementation CSP for the Smart Business Solutions program. PECO will develop a request for proposal, identifying the necessary qualifications and responsibilities. The bidding CSP proposals will be thoroughly reviewed and scored.
» Recruit participating installation contractors » Develop streamlined process for reviewing and approving project applications and distributing
incentive payments » Develop and arrange training of installation contractors in promotion of the program » Develop strategies for connecting with hard-to-reach small business customers
Marketing Strategy
The primary method of participant recruitment will occur through direct and personal outreach by the CSP program personnel. The CSP will canvas a designated geographic area, offering to conduct or schedule site assessments. These areas will be selected in advance in consultation with PECO. The market will be primed through targeted bill inserts and direct mail sent to eligible customers in advance of the scheduled field visits.
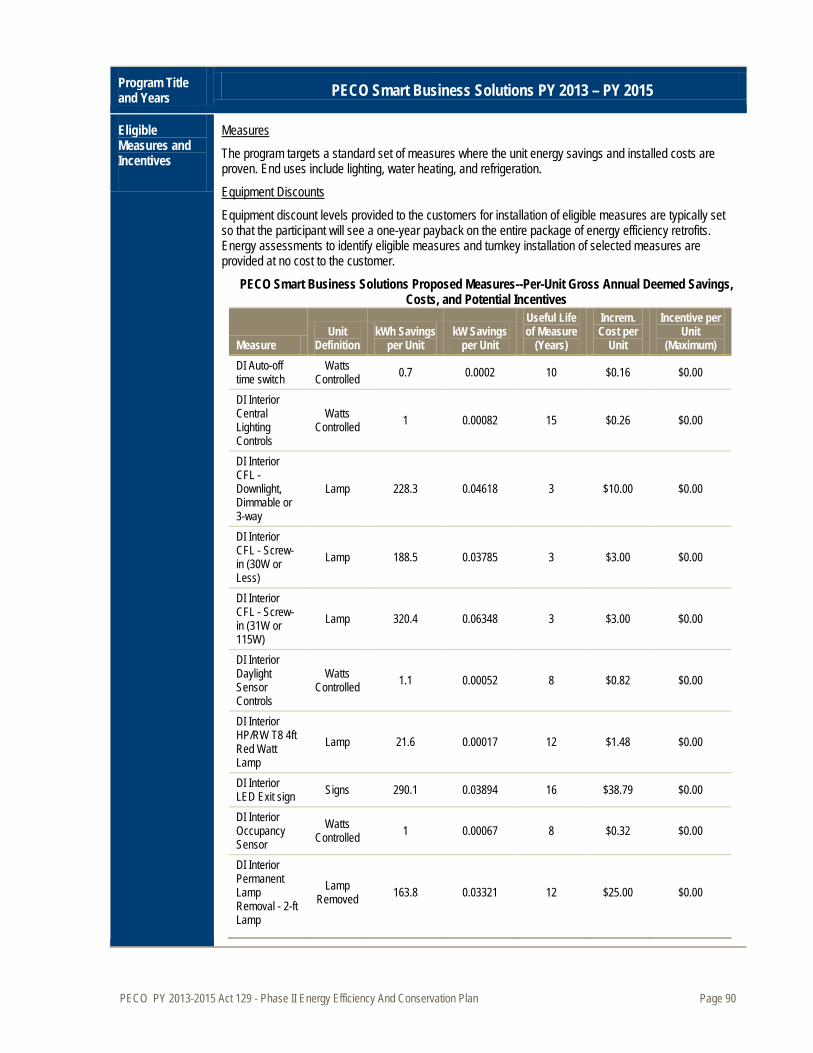
PECO PY 2013-2015 Act 129 - Phase II Energy Efficiency And Conservation Plan Page 90
Program Title and Years PECO Smart Business Solutions PY 2013 – PY 2015
Eligible Measures and Incentives
The program targets a standard set of measures where the unit energy savings and installed costs are proven. End uses include lighting, water heating, and refrigeration.
Measures
Equipment discount levels provided to the customers for installation of eligible measures are typically set so that the participant will see a one-year payback on the entire package of energy efficiency retrofits. Energy assessments to identify eligible measures and turnkey installation of selected measures are provided at no cost to the customer.
Equipment Discounts
PECO Smart Business Solutions Proposed Measures--Per-Unit Gross Annual Deemed Savings, Costs, and Potential Incentives
Measure Unit
Definition kWh Savings
per Unit kW Savings
per Unit
Useful Life of Measure
(Years)
Increm. Cost per
Unit
Incentive per Unit
(Maximum) DI Auto-off time switch
Watts Controlled 0.7 0.0002 10 $0.16 $0.00
DI Interior Central Lighting Controls
Watts Controlled 1 0.00082 15 $0.26 $0.00
DI Interior CFL - Downlight, Dimmable or 3-way
Lamp 228.3 0.04618 3 $10.00 $0.00
DI Interior CFL - Screw-in (30W or Less)
Lamp 188.5 0.03785 3 $3.00 $0.00
DI Interior CFL - Screw-in (31W or 115W)
Lamp 320.4 0.06348 3 $3.00 $0.00
DI Interior Daylight Sensor Controls
Watts Controlled 1.1 0.00052 8 $0.82 $0.00
DI Interior HP/RW T8 4ft Red Watt Lamp
Lamp 21.6 0.00017 12 $1.48 $0.00
DI Interior LED Exit sign Signs 290.1 0.03894 16 $38.79 $0.00
DI Interior Occupancy Sensor
Watts Controlled 1 0.00067 8 $0.32 $0.00
DI Interior Permanent Lamp Removal - 2-ft Lamp
Lamp Removed 163.8 0.03321 12 $25.00 $0.00
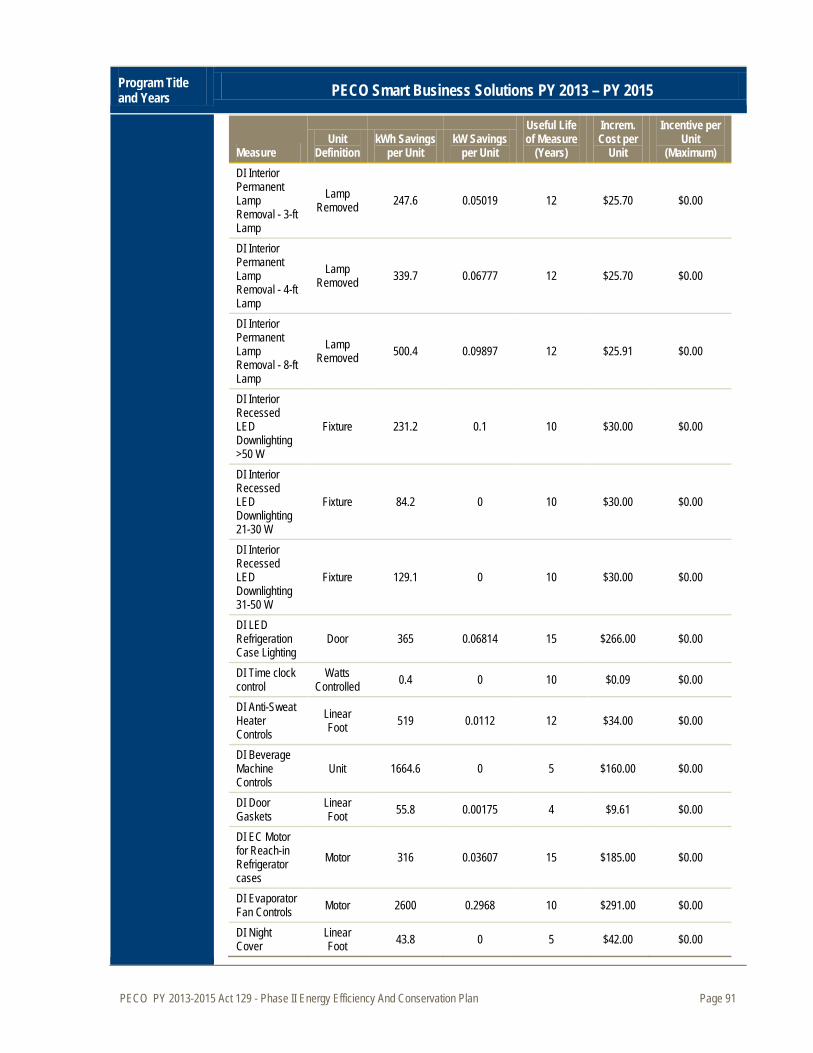
PECO PY 2013-2015 Act 129 - Phase II Energy Efficiency And Conservation Plan Page 91
Program Title and Years PECO Smart Business Solutions PY 2013 – PY 2015
Measure Unit
Definition kWh Savings
per Unit kW Savings
per Unit
Useful Life of Measure
(Years)
Increm. Cost per
Unit
Incentive per Unit
(Maximum) DI Interior Permanent Lamp Removal - 3-ft Lamp
Lamp Removed 247.6 0.05019 12 $25.70 $0.00
DI Interior Permanent Lamp Removal - 4-ft Lamp
Lamp Removed 339.7 0.06777 12 $25.70 $0.00
DI Interior Permanent Lamp Removal - 8-ft Lamp
Lamp Removed 500.4 0.09897 12 $25.91 $0.00
DI Interior Recessed LED Downlighting >50 W
Fixture 231.2 0.1 10 $30.00 $0.00
DI Interior Recessed LED Downlighting 21-30 W
Fixture 84.2 0 10 $30.00 $0.00
DI Interior Recessed LED Downlighting 31-50 W
Fixture 129.1 0 10 $30.00 $0.00
DI LED Refrigeration Case Lighting
Door 365 0.06814 15 $266.00 $0.00
DI Time clock control
Watts Controlled 0.4 0 10 $0.09 $0.00
DI Anti-Sweat Heater Controls
Linear Foot 519 0.0112 12 $34.00 $0.00
DI Beverage Machine Controls
Unit 1664.6 0 5 $160.00 $0.00
DI Door Gaskets
Linear Foot 55.8 0.00175 4 $9.61 $0.00
DI EC Motor for Reach-in Refrigerator cases
Motor 316 0.03607 15 $185.00 $0.00
DI Evaporator Fan Controls Motor 2600 0.2968 10 $291.00 $0.00
DI Night Cover
Linear Foot 43.8 0 5 $42.00 $0.00
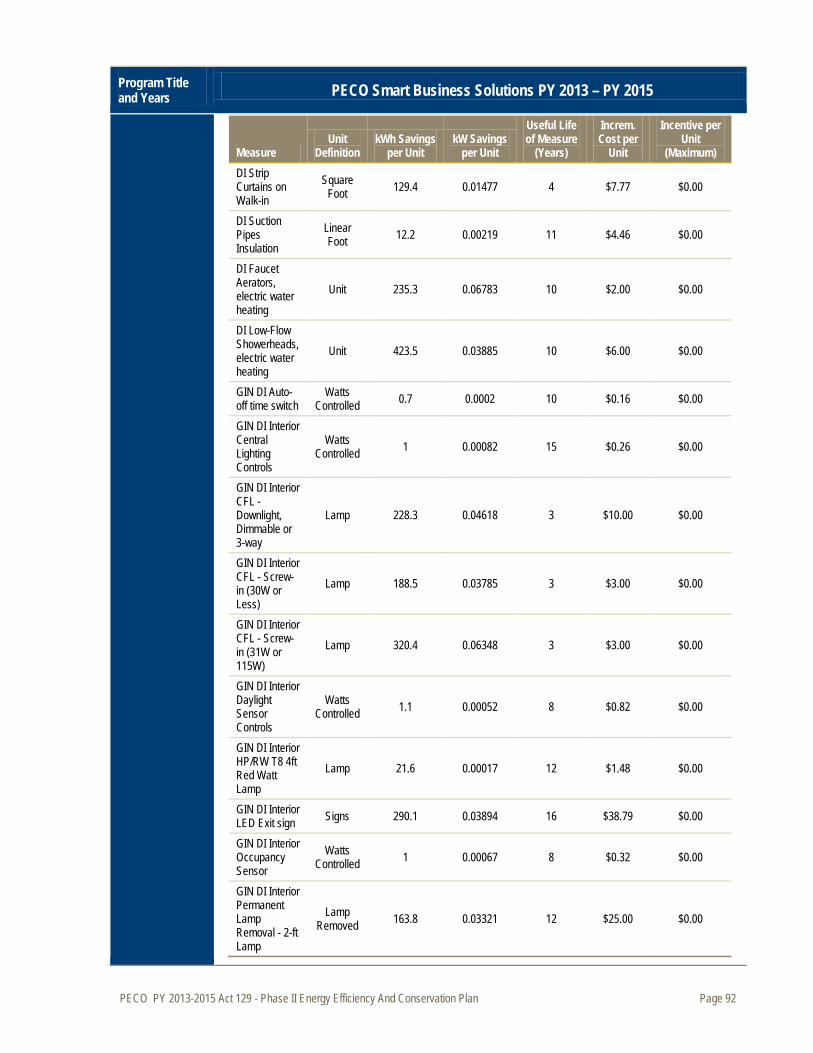
PECO PY 2013-2015 Act 129 - Phase II Energy Efficiency And Conservation Plan Page 92
Program Title and Years PECO Smart Business Solutions PY 2013 – PY 2015
Measure Unit
Definition kWh Savings
per Unit kW Savings
per Unit
Useful Life of Measure
(Years)
Increm. Cost per
Unit
Incentive per Unit
(Maximum) DI Strip Curtains on Walk-in
Square Foot 129.4 0.01477 4 $7.77 $0.00
DI Suction Pipes Insulation
Linear Foot 12.2 0.00219 11 $4.46 $0.00
DI Faucet Aerators, electric water heating
Unit 235.3 0.06783 10 $2.00 $0.00
DI Low-Flow Showerheads, electric water heating
Unit 423.5 0.03885 10 $6.00 $0.00
GIN DI Auto-off time switch
Watts Controlled 0.7 0.0002 10 $0.16 $0.00
GIN DI Interior Central Lighting Controls
Watts Controlled 1 0.00082 15 $0.26 $0.00
GIN DI Interior CFL - Downlight, Dimmable or 3-way
Lamp 228.3 0.04618 3 $10.00 $0.00
GIN DI Interior CFL - Screw-in (30W or Less)
Lamp 188.5 0.03785 3 $3.00 $0.00
GIN DI Interior CFL - Screw-in (31W or 115W)
Lamp 320.4 0.06348 3 $3.00 $0.00
GIN DI Interior Daylight Sensor Controls
Watts Controlled 1.1 0.00052 8 $0.82 $0.00
GIN DI Interior HP/RW T8 4ft Red Watt Lamp
Lamp 21.6 0.00017 12 $1.48 $0.00
GIN DI Interior LED Exit sign Signs 290.1 0.03894 16 $38.79 $0.00
GIN DI Interior Occupancy Sensor
Watts Controlled 1 0.00067 8 $0.32 $0.00
GIN DI Interior Permanent Lamp Removal - 2-ft Lamp
Lamp Removed 163.8 0.03321 12 $25.00 $0.00

PECO PY 2013-2015 Act 129 - Phase II Energy Efficiency And Conservation Plan Page 93
Program Title and Years PECO Smart Business Solutions PY 2013 – PY 2015
Measure Unit
Definition kWh Savings
per Unit kW Savings
per Unit
Useful Life of Measure
(Years)
Increm. Cost per
Unit
Incentive per Unit
(Maximum) GIN DI Interior Permanent Lamp Removal - 3-ft Lamp
Lamp Removed 247.6 0.05019 12 $25.70 $0.00
GIN DI Interior Permanent Lamp Removal - 4-ft Lamp
Lamp Removed 339.7 0.06777 12 $25.70 $0.00
GIN DI Interior Permanent Lamp Removal - 8-ft Lamp
Lamp Removed 500.4 0.09897 12 $25.91 $0.00
GIN DI Interior Recessed LED Downlighting >50 W
Fixture 231.2 0.06083 10 $30.00 $0.00
GIN DI Interior Recessed LED Downlighting 21-30 W
Fixture 84.2 0.02216 10 $30.00 $0.00
GIN DI Interior Recessed LED Downlighting 31-50 W
Fixture 129.1 0.03399 10 $30.00 $0.00
GIN DI LED Refrigeration Case Lighting
Door 365 0.06814 15 $266.00 $0.00
GIN DI Time clock control
Watts Controlled 0.4 0 10 $0.09 $0.00
GIN DI Anti-Sweat Heater Controls
Linear Foot 519 0.0112 12 $34.00 $0.00
GIN DI Beverage Machine Controls
Unit 1664.6 0 5 $160.00 $0.00
GIN DI Door Gaskets
Linear Foot 55.8 0.00175 4 $9.61 $0.00
GIN DI EC Motor for Reach-in Refrigerator cases
Motor 316 0.03607 15 $185.00 $0.00
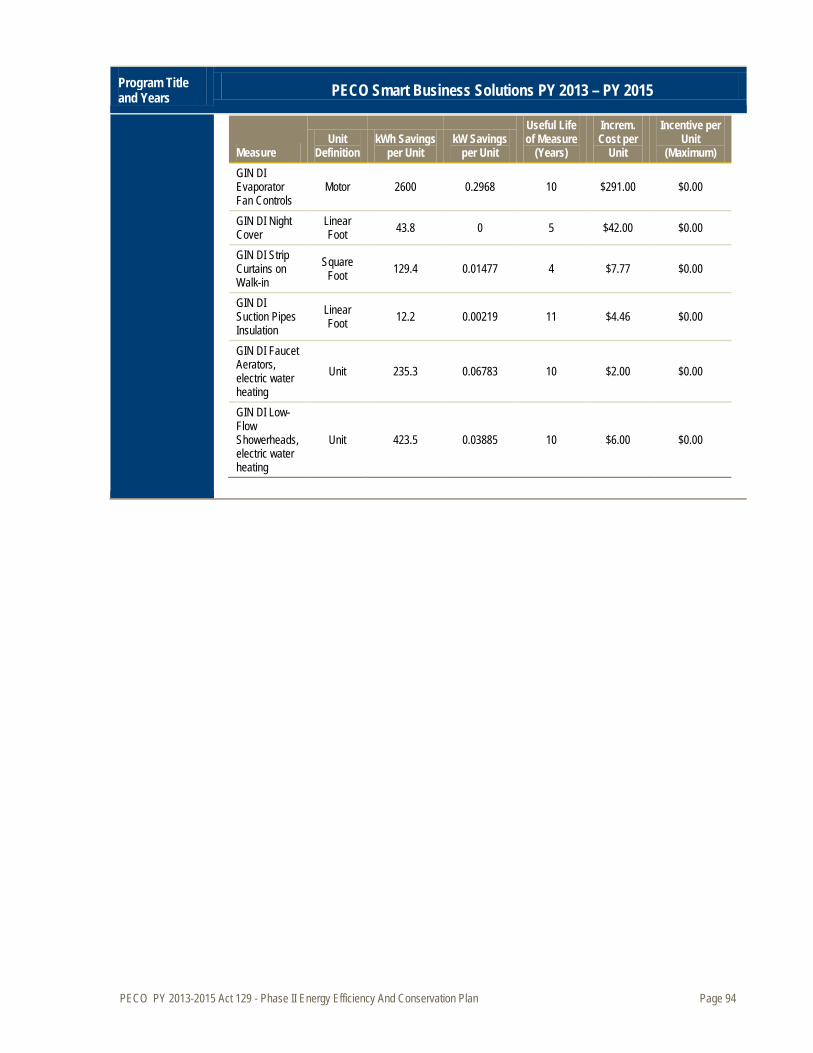
PECO PY 2013-2015 Act 129 - Phase II Energy Efficiency And Conservation Plan Page 94
Program Title and Years PECO Smart Business Solutions PY 2013 – PY 2015
Measure Unit
Definition kWh Savings
per Unit kW Savings
per Unit
Useful Life of Measure
(Years)
Increm. Cost per
Unit
Incentive per Unit
(Maximum) GIN DI Evaporator Fan Controls
Motor 2600 0.2968 10 $291.00 $0.00
GIN DI Night Cover
Linear Foot 43.8 0 5 $42.00 $0.00
GIN DI Strip Curtains on Walk-in
Square Foot 129.4 0.01477 4 $7.77 $0.00
GIN DI Suction Pipes Insulation
Linear Foot 12.2 0.00219 11 $4.46 $0.00
GIN DI Faucet Aerators, electric water heating
Unit 235.3 0.06783 10 $2.00 $0.00
GIN DI Low-Flow Showerheads, electric water heating
Unit 423.5 0.03885 10 $6.00 $0.00
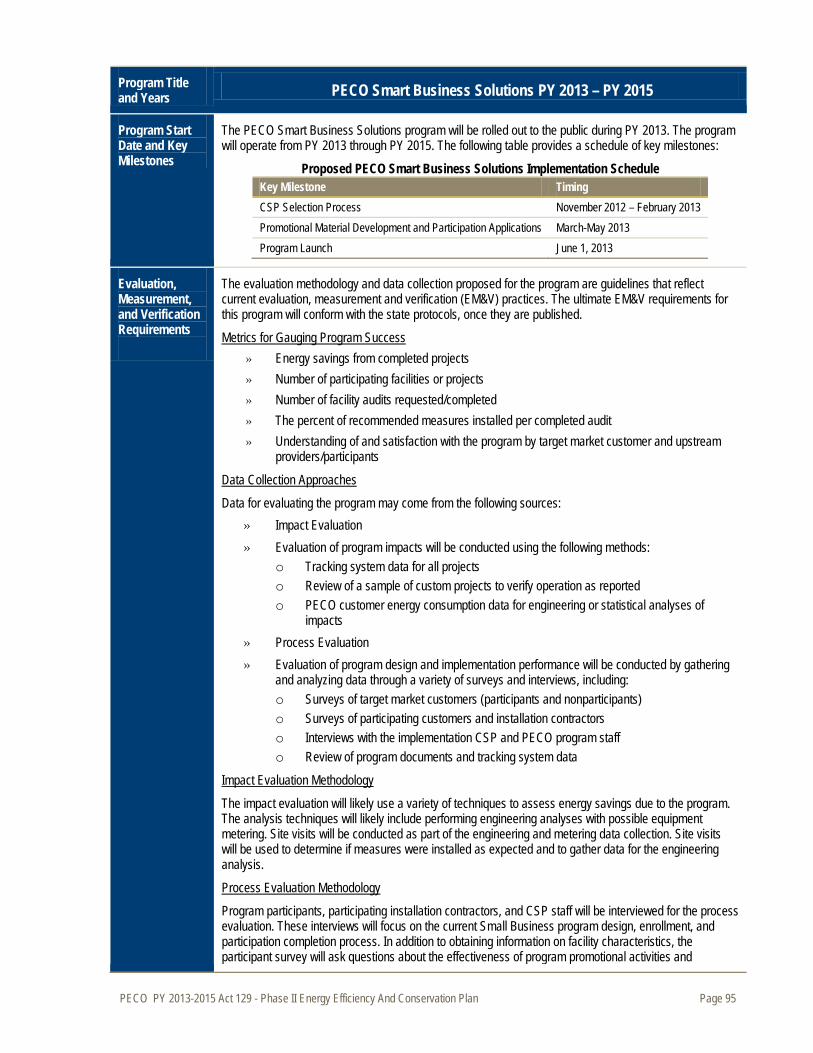
PECO PY 2013-2015 Act 129 - Phase II Energy Efficiency And Conservation Plan Page 95
Program Title and Years PECO Smart Business Solutions PY 2013 – PY 2015
Program Start Date and Key Milestones
The PECO Smart Business Solutions program will be rolled out to the public during PY 2013. The program will operate from PY 2013 through PY 2015. The following table provides a schedule of key milestones:
Proposed PECO Smart Business Solutions Implementation Schedule Key Milestone Timing CSP Selection Process November 2012 – February 2013 Promotional Material Development and Participation Applications March-May 2013 Program Launch June 1, 2013
Evaluation, Measurement, and Verification Requirements
The evaluation methodology and data collection proposed for the program are guidelines that reflect current evaluation, measurement and verification (EM&V) practices. The ultimate EM&V requirements for this program will conform with the state protocols, once they are published.
» Energy savings from completed projects Metrics for Gauging Program Success
» Number of participating facilities or projects » Number of facility audits requested/completed » The percent of recommended measures installed per completed audit » Understanding of and satisfaction with the program by target market customer and upstream
providers/participants
Data for evaluating the program may come from the following sources:
Data Collection Approaches
» Impact Evaluation » Evaluation of program impacts will be conducted using the following methods:
o Tracking system data for all projects o Review of a sample of custom projects to verify operation as reported o PECO customer energy consumption data for engineering or statistical analyses of
impacts » Process Evaluation » Evaluation of program design and implementation performance will be conducted by gathering
and analyzing data through a variety of surveys and interviews, including: o Surveys of target market customers (participants and nonparticipants) o Surveys of participating customers and installation contractors o Interviews with the implementation CSP and PECO program staff o Review of program documents and tracking system data
The impact evaluation will likely use a variety of techniques to assess energy savings due to the program. The analysis techniques will likely include performing engineering analyses with possible equipment metering. Site visits will be conducted as part of the engineering and metering data collection. Site visits will be used to determine if measures were installed as expected and to gather data for the engineering analysis.
Impact Evaluation Methodology
Program participants, participating installation contractors, and CSP staff will be interviewed for the process evaluation. These interviews will focus on the current Small Business program design, enrollment, and participation completion process. In addition to obtaining information on facility characteristics, the participant survey will ask questions about the effectiveness of program promotional activities and
Process Evaluation Methodology
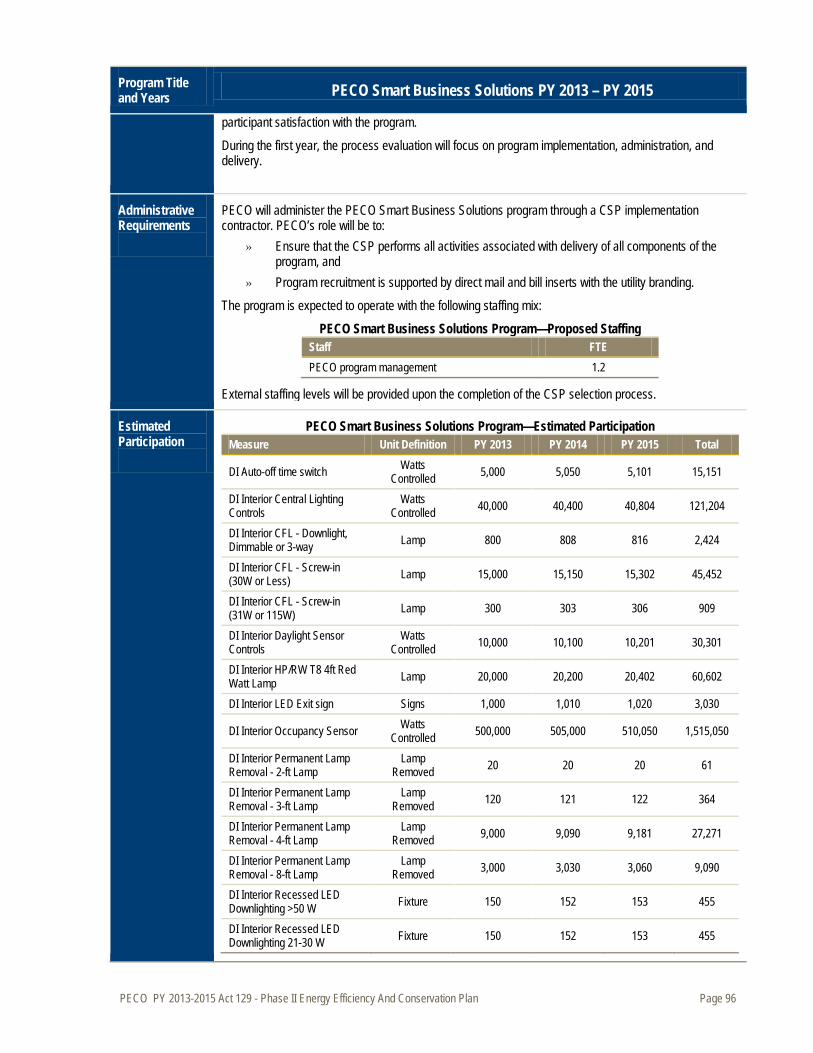
PECO PY 2013-2015 Act 129 - Phase II Energy Efficiency And Conservation Plan Page 96
Program Title and Years PECO Smart Business Solutions PY 2013 – PY 2015
participant satisfaction with the program.
During the first year, the process evaluation will focus on program implementation, administration, and delivery.
Administrative Requirements
PECO will administer the PECO Smart Business Solutions program through a CSP implementation contractor. PECO’s role will be to:
» Ensure that the CSP performs all activities associated with delivery of all components of the program, and
» Program recruitment is supported by direct mail and bill inserts with the utility branding. The program is expected to operate with the following staffing mix:
PECO Smart Business Solutions Program—Proposed Staffing Staff FTE PECO program management 1.2
External staffing levels will be provided upon the completion of the CSP selection process.
Estimated Participation
PECO Smart Business Solutions Program—Estimated Participation Measure Unit Definition PY 2013 PY 2014 PY 2015 Total
DI Auto-off time switch Watts Controlled 5,000 5,050 5,101 15,151
DI Interior Central Lighting Controls
Watts Controlled 40,000 40,400 40,804 121,204
DI Interior CFL - Downlight, Dimmable or 3-way Lamp 800 808 816 2,424
DI Interior CFL - Screw-in (30W or Less) Lamp 15,000 15,150 15,302 45,452
DI Interior CFL - Screw-in (31W or 115W) Lamp 300 303 306 909
DI Interior Daylight Sensor Controls
Watts Controlled 10,000 10,100 10,201 30,301
DI Interior HP/RW T8 4ft Red Watt Lamp Lamp 20,000 20,200 20,402 60,602
DI Interior LED Exit sign Signs 1,000 1,010 1,020 3,030
DI Interior Occupancy Sensor Watts Controlled 500,000 505,000 510,050 1,515,050
DI Interior Permanent Lamp Removal - 2-ft Lamp
Lamp Removed 20 20 20 61
DI Interior Permanent Lamp Removal - 3-ft Lamp
Lamp Removed 120 121 122 364
DI Interior Permanent Lamp Removal - 4-ft Lamp
Lamp Removed 9,000 9,090 9,181 27,271
DI Interior Permanent Lamp Removal - 8-ft Lamp
Lamp Removed 3,000 3,030 3,060 9,090
DI Interior Recessed LED Downlighting >50 W Fixture 150 152 153 455
DI Interior Recessed LED Downlighting 21-30 W Fixture 150 152 153 455
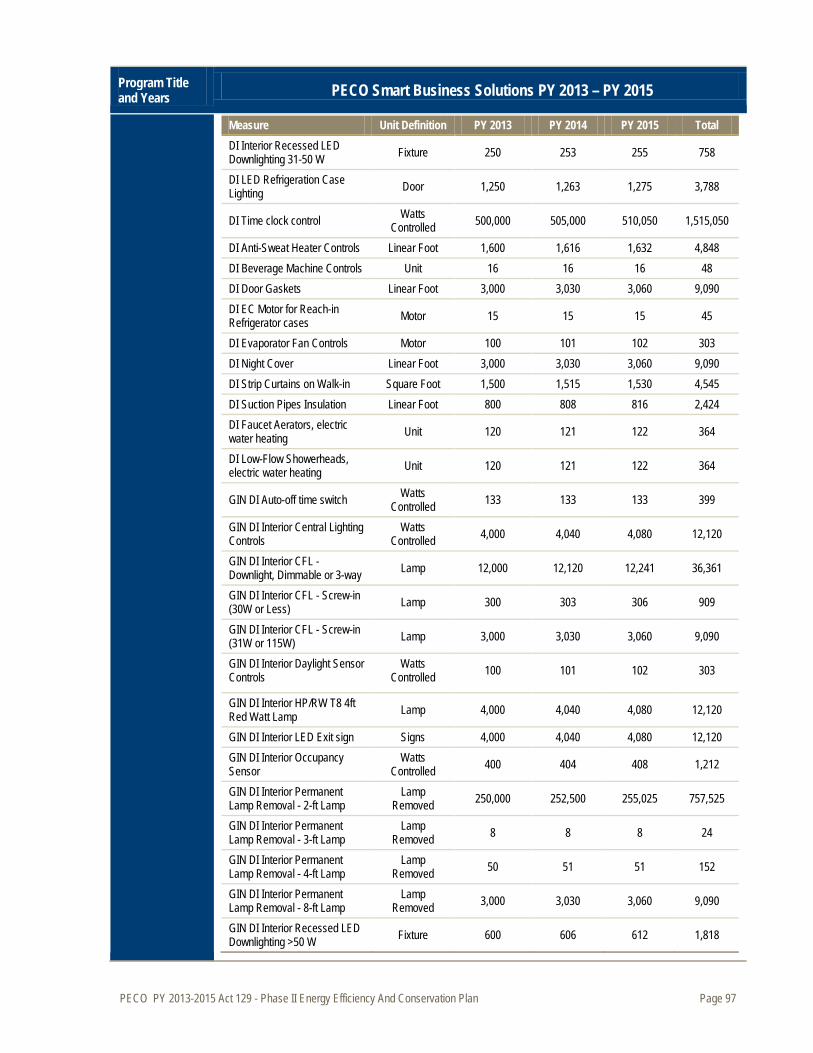
PECO PY 2013-2015 Act 129 - Phase II Energy Efficiency And Conservation Plan Page 97
Program Title and Years PECO Smart Business Solutions PY 2013 – PY 2015
Measure Unit Definition PY 2013 PY 2014 PY 2015 Total DI Interior Recessed LED Downlighting 31-50 W Fixture 250 253 255 758
DI LED Refrigeration Case Lighting Door 1,250 1,263 1,275 3,788
DI Time clock control Watts Controlled 500,000 505,000 510,050 1,515,050
DI Anti-Sweat Heater Controls Linear Foot 1,600 1,616 1,632 4,848 DI Beverage Machine Controls Unit 16 16 16 48 DI Door Gaskets Linear Foot 3,000 3,030 3,060 9,090 DI EC Motor for Reach-in Refrigerator cases Motor 15 15 15 45
DI Evaporator Fan Controls Motor 100 101 102 303 DI Night Cover Linear Foot 3,000 3,030 3,060 9,090 DI Strip Curtains on Walk-in Square Foot 1,500 1,515 1,530 4,545 DI Suction Pipes Insulation Linear Foot 800 808 816 2,424 DI Faucet Aerators, electric water heating Unit 120 121 122 364
DI Low-Flow Showerheads, electric water heating Unit 120 121 122 364
GIN DI Auto-off time switch Watts Controlled 133 133 133 399
GIN DI Interior Central Lighting Controls
Watts Controlled 4,000 4,040 4,080 12,120
GIN DI Interior CFL - Downlight, Dimmable or 3-way Lamp 12,000 12,120 12,241 36,361
GIN DI Interior CFL - Screw-in (30W or Less) Lamp 300 303 306 909
GIN DI Interior CFL - Screw-in (31W or 115W) Lamp 3,000 3,030 3,060 9,090
GIN DI Interior Daylight Sensor Controls
Watts Controlled 100 101 102 303
GIN DI Interior HP/RW T8 4ft Red Watt Lamp Lamp 4,000 4,040 4,080 12,120
GIN DI Interior LED Exit sign Signs 4,000 4,040 4,080 12,120 GIN DI Interior Occupancy Sensor
Watts Controlled 400 404 408 1,212
GIN DI Interior Permanent Lamp Removal - 2-ft Lamp
Lamp Removed 250,000 252,500 255,025 757,525
GIN DI Interior Permanent Lamp Removal - 3-ft Lamp
Lamp Removed 8 8 8 24
GIN DI Interior Permanent Lamp Removal - 4-ft Lamp
Lamp Removed 50 51 51 152
GIN DI Interior Permanent Lamp Removal - 8-ft Lamp
Lamp Removed 3,000 3,030 3,060 9,090
GIN DI Interior Recessed LED Downlighting >50 W Fixture 600 606 612 1,818
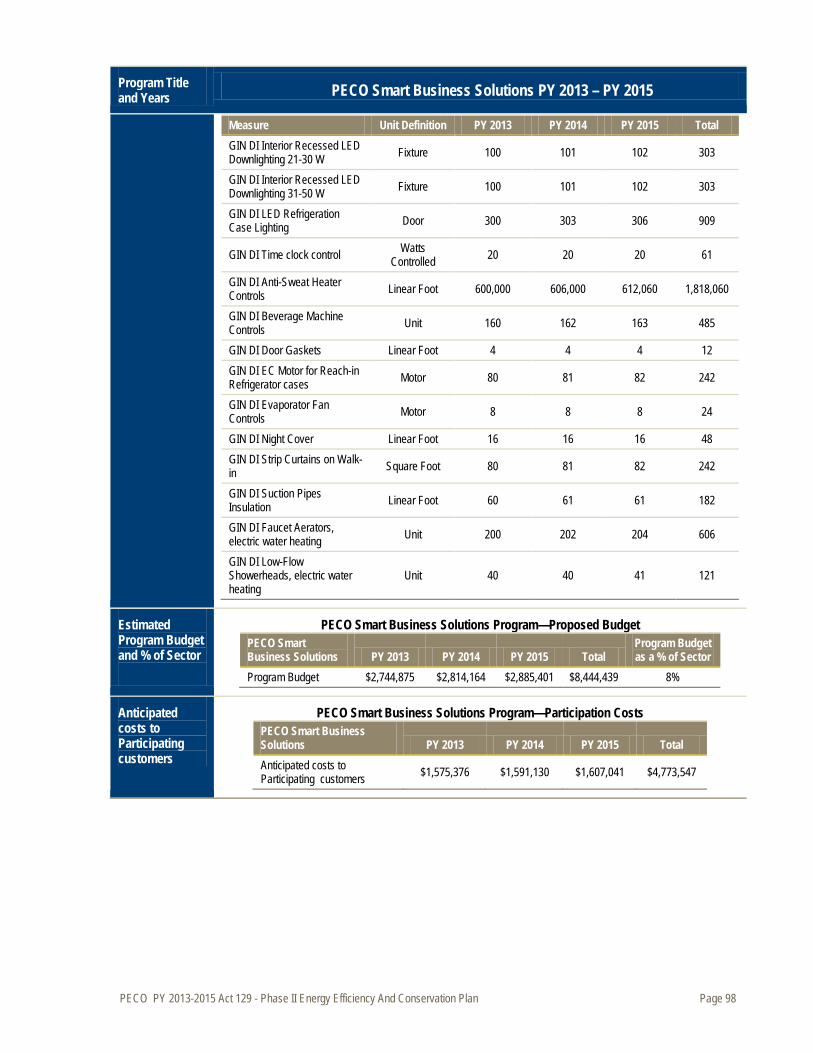
PECO PY 2013-2015 Act 129 - Phase II Energy Efficiency And Conservation Plan Page 98
Program Title and Years PECO Smart Business Solutions PY 2013 – PY 2015
Measure Unit Definition PY 2013 PY 2014 PY 2015 Total GIN DI Interior Recessed LED Downlighting 21-30 W Fixture 100 101 102 303
GIN DI Interior Recessed LED Downlighting 31-50 W Fixture 100 101 102 303
GIN DI LED Refrigeration Case Lighting Door 300 303 306 909
GIN DI Time clock control Watts Controlled 20 20 20 61
GIN DI Anti-Sweat Heater Controls Linear Foot 600,000 606,000 612,060 1,818,060
GIN DI Beverage Machine Controls Unit 160 162 163 485
GIN DI Door Gaskets Linear Foot 4 4 4 12 GIN DI EC Motor for Reach-in Refrigerator cases Motor 80 81 82 242
GIN DI Evaporator Fan Controls Motor 8 8 8 24
GIN DI Night Cover Linear Foot 16 16 16 48 GIN DI Strip Curtains on Walk-in Square Foot 80 81 82 242
GIN DI Suction Pipes Insulation Linear Foot 60 61 61 182
GIN DI Faucet Aerators, electric water heating Unit 200 202 204 606
GIN DI Low-Flow Showerheads, electric water heating
Unit 40 40 41 121
Estimated Program Budget and % of Sector
PECO Smart Business Solutions Program—Proposed Budget PECO Smart Business Solutions PY 2013 PY 2014 PY 2015 Total
Program Budget as a % of Sector
Program Budget $2,744,875 $2,814,164 $2,885,401 $8,444,439 8%
Anticipated costs to Participating customers
PECO Smart Business Solutions Program—Participation Costs PECO Smart Business Solutions PY 2013 PY 2014 PY 2015 Total Anticipated costs to Participating customers $1,575,376 $1,591,130 $1,607,041 $4,773,547

PECO PY 2013-2015 Act 129 - Phase II Energy Efficiency And Conservation Plan Page 99
Program Title and Years PECO Smart Business Solutions PY 2013 – PY 2015
Projected Energy Savings and Demand Reduction
The savings estimates were developed using the current standard calculation methodologies (e.g., Pennsylvania’s Technical Resource Manual, DEER, and DOE). These values were applied to the estimated number of measures incentivized under the program each year.
PECO Smart Business Solutions— Annual Gross Energy and Peak Demand Savings Estimates
PECO Smart Business Solutions PY 2013 PY 2014 PY 2015
MWh Savings 14,477 14,622 14,768 Peak MW Reduction 3.1 3.1 3.2
Energy savings are “at meter”; demand savings are “at generator”.
Cost-Effectiveness
PECO Smart Business Solutions
Dollars (Millions)
TRC Discounted Lifetime Benefits
Discounted Lifetime Costs
Net Benefits
$16,823,382 $11,110,192 $5,713,190 1.5
PECO PY 2013-2015 Act 129 - Phase II Energy Efficiency And Conservation Plan Page 100
3.2.2.3 EE Program 10 — PECO Smart Multi-Family Solutions Program
Program Title and Years PECO Smart Multi-Family Solutions PY 2013 – PY 2015
Objectives The PECO Smart Multi-Family Solutions program has several objectives: » Increase awareness of energy savings opportunities in multi-family buildings and assist multi-
family residents and building owners/managers to act on those opportunities. » Increase consumers’ awareness and understanding of the breadth of energy efficiency
opportunities in their facilities. » Make it easier for customers to adopt more energy-efficient equipment and equipment
maintenance. » Make a significant contribution to attainment of PECO’s energy savings goals. » Demonstrate PECO’s commitment to and confidence in the measures’ performance and their
ability to reduce customer energy use. » Strengthen customer trust in PECO as their partner in saving energy
The program is designed for retrofit and replacement projects in both master-metered common areas and individually-metered units of multi-family facilities.
Target Market The PECO Smart Multi-Family Solutions program is designed for both multi-family property owners and multi-family customers. The eligible customer population for the program is all existing multi-family buildings, including the individual tenant accounts, provided with electricity by PECO. Commercial, residential, governmental, institutional, low-income and non-profit accounts with four or more living units are eligible to participate in this program.
Within the target market, the focus for this program is the equipment retrofit or change-out market; that is, customers with existing equipment that needs replacing and multi-family residents who agree to receive free direct-install low cost measures such as CFLs. Low-flow showerheads, and low-flow faucet aerators will be provided for those units that have electric water heating.
Program Description
The PECO Smart Multi-Family Solutions program is designed to encourage and assist customers in improving the energy efficiency of their existing facilities through a broad range of energy efficiency options that address all major end uses. This program offers two main participating channels:
» Prescriptive incentives to multi-family building property owners who install high-efficiency equipment which address common areas (e.g. hallway lighting), or whole building improvements (e.g. HVAC); and
» Free direct-install of low-cost measures for multi-family residents.
Implementation Strategy
PECO will administer the PECO Smart Multi-Family Solutions program through a CSP implementation contractor. This CSP will be responsible for coordinating the full process of building owner interest in the program, address questions, and promote retrofit of comprehensive prescriptive and/or custom measures affecting the whole building, as well as overseeing the free direct-installation of low cost measures in multi-family units.
Effective implementation includes making qualifying products available, distributing information about the products and the program, promoting the program adequately, and educating those influential in making product selection and purchasing decisions. For the multi-family program, the most important decision makers are the property owners/managers, and developing a close partnership with these key stakeholders to advance installation of whole building and common area measures, as well as granting permission and assistance for the direct-install measures. Other key delivery channels, which overlap with the broader PECO C&I initiatives include:
Channels for Program Delivery
» Product Supply o Equipment suppliers—Vendors are influential in equipment selection in commercial and
PECO PY 2013-2015 Act 129 - Phase II Energy Efficiency And Conservation Plan Page 101
Program Title and Years PECO Smart Multi-Family Solutions PY 2013 – PY 2015
industrial facilities. They can be and should be engaged to recommend incentive-eligible models of equipment for retrofit and replacement projects. As appropriate, the incentives for equipment purchased under the program can be split or directed to these vendors.
o Other trade allies—Installation and maintenance contractors can provide services associated with some of the qualifying measures, such as HVAC diagnostic tune-ups, identifying and sealing air and duct leaks, and refrigeration system maintenance. Again, as appropriate, incentives offered on qualifying measures can be directed to or split with these providers to encourage them to promote program participation.
» Program and Product Information Distribution o CSP—The implementation CSP will develop and distribute information about the
qualifying products and participation assistance by establishing and leveraging existing relationships with the product and service suppliers.
o Trade allies—As both deliverers of program products and potential participants in the program, all vendors of the qualifying equipment and service measures should be engaged to receive and also provide to their public sector clients information about the program measure benefits, how the program works, and assistance with the incentive process.
o Utility staff—While PECO will engage a CSP to implement the program, the staff has ongoing contact with all key account customers. The staff will provide information about the program benefits, measures, and process.
» Program Promotion o CSP—A key responsibility of the implementation CSP is outreach and effective
promotion of the program to the target market. o Trade allies—All vendors of the qualifying equipment and service measures should be
engaged to make their clients aware of the program and encourage their participation by recommending high-efficiency equipment models and diagnostic services.
o Facility auditors—Part of auditors' services can and should include making customers aware of this program and the incentives available for installation of high-efficiency measures.
o Bill inserts to all and direct mail to sub segments within this target market; e.g., multi-family building owners and tenants.
» Education o Leave-behind efficiency information for tenants o Bill inserts and/or direct mail o Trade publication articles on the benefits of specific measures, technologies, and
diagnostic tune-ups, as well as whole facility assessments o Trade industry meetings leveraged to include product and program education as part of
them o Workshops provided by government agencies for commercial and industrial businesses
to understand how to improve energy use in their facilities o Facility assessment reports o Industry and technology experts who meet individually with facility decision makers
during outreach and project development
The implementation CSP will have full responsibility for delivery of all aspects of the program. Responsibilities fall into several activity areas:
Overview of Roles and Activities
» Supply Chain Relationship: develop relationships with equipment and maintenance suppliers to make incentive-eligible equipment and services available and to promote their support of the program
PECO PY 2013-2015 Act 129 - Phase II Energy Efficiency And Conservation Plan Page 102
Program Title and Years PECO Smart Multi-Family Solutions PY 2013 – PY 2015
» Program marketing: including development and distribution of program materials, outreach to customers or customer organizations, and assistance with direct mail or other promotion in collaboration with PECO.
» Participant recruitment and assistance: including assisting multi-family property owners and contractors with the selection of appropriate measures and completing the incentive application; and assisting building owners and contractors to develop estimates and documentation of custom measure projects.
» Turn-key coordination of a direct-install program to replace inefficient lighting and install water saving devices in the multi-family units.
» Incentive processing: including a fulfillment house to receive, review and verify applications, resolve issues, and pay the financial incentives.
» Program performance tracking and improvement: including tracking availability of qualifying products, incentive submittals and payments, and opportunities to improve the program.
» Reporting: including reporting of program activities to meet regulatory and internal requirements, including progress toward program goals.
The program will provide education and awareness meetings targeted to multi-family building owners to gain their involvement with the program. Other education channels include:
Education Overview
» Training sessions for trade allies and other product supply and program and product distribution providers—these are to provide both technical information regarding the applicability and benefits of the measures promoted under the program, information about how the program works, and their role in and incentives for having their customers participate in the program.
» Third-party certification programs - Energy auditors who can conduct building assessments and identify energy efficiency opportunities in multi-family spaces is an important element of the program’s success. Several organizations exist that provide training and certification programs to ensure that auditors are well-versed in building science principles and whole-building concepts for energy performance.
The program will promote other sources of technical and financial assistance available to multi-family building operators and tenants as applicable. Among them:
Applicable Collaborative Resources
» Pennsylvania Housing Finance Agency
Program Issues, Risks, and Risk Management Strategies
There are several issues associated with providing an energy efficiency program to multi-family customers. » Split Incentives: Split incentives are a concern for multi-family energy efficiency programs.
Property owners do not reap the cost saving benefits of implementing energy efficiency in individual units; while tenants do not see the benefit of investing in a property owned by another entity. Further complicating the issue, property owners are not local to the facilities in many cases and therefore do not have a meaningful relationship with the tenants or facility. The program seeks to deliver the program to both master-metered common areas and individually-metered units to overcome this barrier. To help address this split incentive challenge, the program design includes provision of free direct-install in the units.
» Decision Makers: The decision making process and access to capital differs among multi-family properties. Smaller properties typically fall under residential financing guidelines and the decision makers are usually individuals. Larger properties typically fall under commercial guidelines and decision makers are typically corporate, institutional, or trusts (e.g., Real Estate Investment Trusts). The program seeks to overcome such barriers by offering competitive incentives and educational materials that are compelling to various decision-makers.
PECO PY 2013-2015 Act 129 - Phase II Energy Efficiency And Conservation Plan Page 103
Program Title and Years PECO Smart Multi-Family Solutions PY 2013 – PY 2015
Ramp Up Strategy
Prior to program launch, considerable effort needs to go into preparing the ground for the success of the program, including:
» Screening and selection of prime implementation CSP – PECO will use a competitive bidding process to select an implementation CSP for the Smart Multi-Family Solutions program. PECO will develop a request for proposal, identifying the necessary qualifications and responsibilities. The bidding CSP proposals will be thoroughly reviewed and scored.
» Auditor/installation contractor education—Courses that provide the CSP’s employees or contractors with skills qualifying them to perform the assessments must be developed and scheduled; the existing commercial availability of training and even certification programs provides the option of simply arranging for courses to be offered starting immediately upon approval of program and continuing through program operation.
» Qualified auditor/installation contractor referral mechanism-The CSP must develop an adequate network of contractors to perform the services and have a mechanism for ensuring that they are qualified to do the work.
» Assessment scheduling and project tracking procedures—Procedures need to be developed regarding how and who a customer will contact to request an assessment, how the scheduling of appointments will be handled, and how the information about the assessment, the recommendations, and the installations will be tracked.
Marketing Strategy
PECO will select an implementation CSP with experience promoting and implementing multi-family energy efficiency programs. The program team will coordinate marketing and outreach with PECO where leveraging PECO’s reputation will enhance the program’s legitimacy and reach. Marketing support for the program will include outreach through rental housing associations, housing authorities, property manager organizations, building maintenance trade groups, and industry specialists.
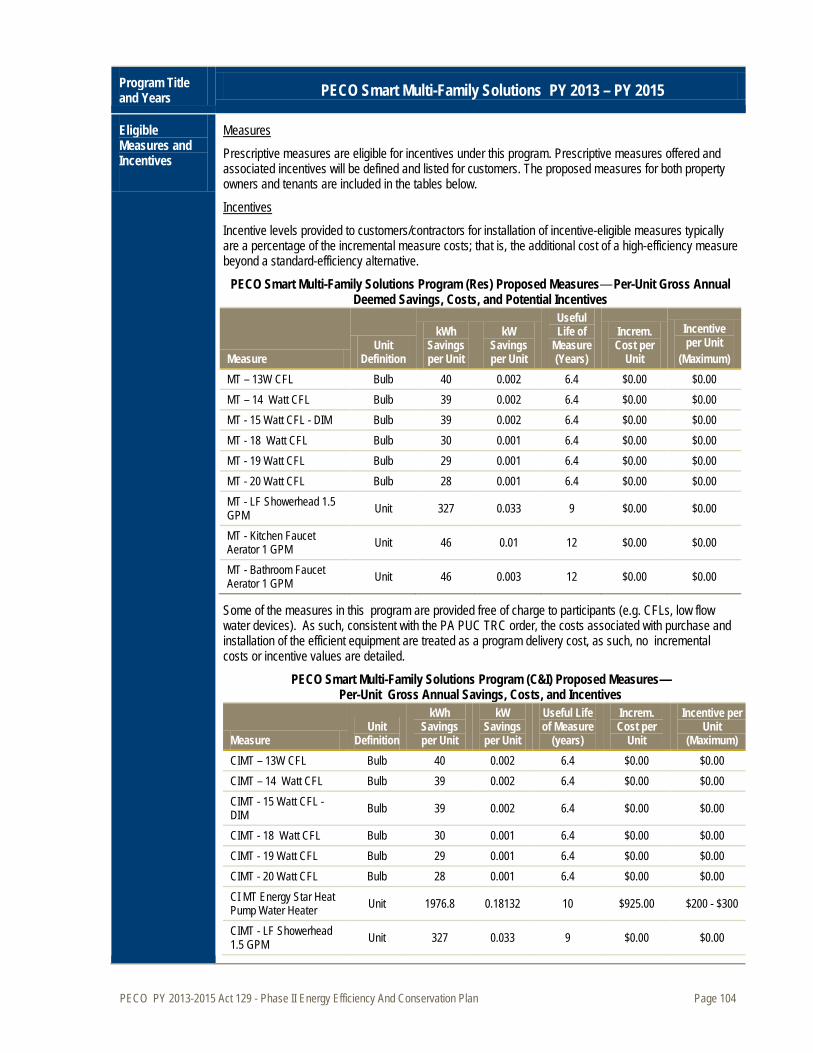
PECO PY 2013-2015 Act 129 - Phase II Energy Efficiency And Conservation Plan Page 104
Program Title and Years PECO Smart Multi-Family Solutions PY 2013 – PY 2015
Eligible Measures and Incentives
Prescriptive measures are eligible for incentives under this program. Prescriptive measures offered and associated incentives will be defined and listed for customers. The proposed measures for both property owners and tenants are included in the tables below.
Measures
Incentive levels provided to customers/contractors for installation of incentive-eligible measures typically are a percentage of the incremental measure costs; that is, the additional cost of a high-efficiency measure beyond a standard-efficiency alternative.
Incentives
PECO Smart Multi-Family Solutions Program (Res) Proposed Measures— Per-Unit Gross Annual Deemed Savings, Costs, and Potential Incentives
Measure Unit
Definition
kWh Savings per Unit
kW Savings per Unit
Useful Life of
Measure (Years)
Increm. Cost per
Unit
Incentive per Unit
(Maximum) MT – 13W CFL Bulb 40 0.002 6.4 $0.00 $0.00 MT – 14 Watt CFL Bulb 39 0.002 6.4 $0.00 $0.00 MT - 15 Watt CFL - DIM Bulb 39 0.002 6.4 $0.00 $0.00 MT - 18 Watt CFL Bulb 30 0.001 6.4 $0.00 $0.00 MT - 19 Watt CFL Bulb 29 0.001 6.4 $0.00 $0.00 MT - 20 Watt CFL Bulb 28 0.001 6.4 $0.00 $0.00 MT - LF Showerhead 1.5 GPM Unit 327 0.033 9 $0.00 $0.00
MT - Kitchen Faucet Aerator 1 GPM Unit 46 0.01 12 $0.00 $0.00
MT - Bathroom Faucet Aerator 1 GPM Unit 46 0.003 12 $0.00 $0.00
Some of the measures in this program are provided free of charge to participants (e.g. CFLs, low flow water devices). As such, consistent with the PA PUC TRC order, the costs associated with purchase and installation of the efficient equipment are treated as a program delivery cost, as such, no incremental costs or incentive values are detailed.
PECO Smart Multi-Family Solutions Program (C&I) Proposed Measures— Per-Unit Gross Annual Savings, Costs, and Incentives
Measure Unit
Definition
kWh Savings per Unit
kW Savings per Unit
Useful Life of Measure
(years)
Increm. Cost per
Unit
Incentive per Unit
(Maximum) CIMT – 13W CFL Bulb 40 0.002 6.4 $0.00 $0.00 CIMT – 14 Watt CFL Bulb 39 0.002 6.4 $0.00 $0.00 CIMT - 15 Watt CFL - DIM Bulb 39 0.002 6.4 $0.00 $0.00
CIMT - 18 Watt CFL Bulb 30 0.001 6.4 $0.00 $0.00 CIMT - 19 Watt CFL Bulb 29 0.001 6.4 $0.00 $0.00 CIMT - 20 Watt CFL Bulb 28 0.001 6.4 $0.00 $0.00 CI MT Energy Star Heat Pump Water Heater Unit 1976.8 0.18132 10 $925.00 $200 - $300
CIMT - LF Showerhead 1.5 GPM Unit 327 0.033 9 $0.00 $0.00
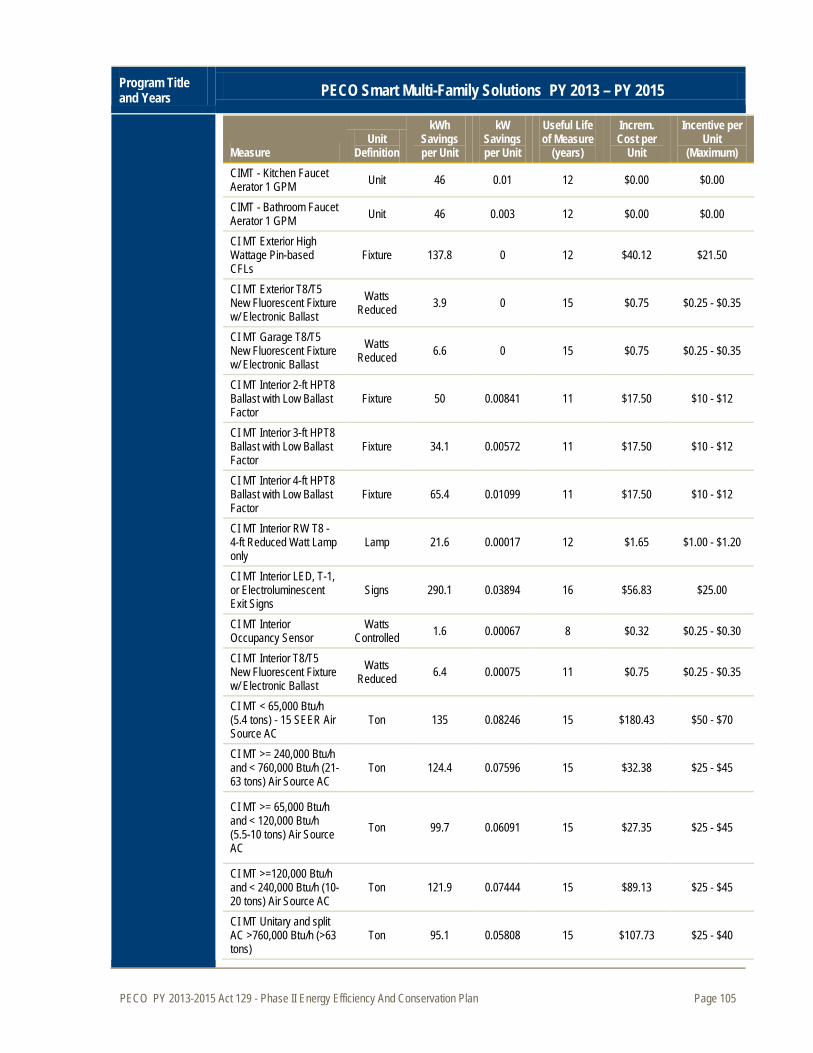
PECO PY 2013-2015 Act 129 - Phase II Energy Efficiency And Conservation Plan Page 105
Program Title and Years PECO Smart Multi-Family Solutions PY 2013 – PY 2015
Measure Unit
Definition
kWh Savings per Unit
kW Savings per Unit
Useful Life of Measure
(years)
Increm. Cost per
Unit
Incentive per Unit
(Maximum) CIMT - Kitchen Faucet Aerator 1 GPM Unit 46 0.01 12 $0.00 $0.00
CIMT - Bathroom Faucet Aerator 1 GPM Unit 46 0.003 12 $0.00 $0.00
CI MT Exterior High Wattage Pin-based CFLs
Fixture 137.8 0 12 $40.12 $21.50
CI MT Exterior T8/T5 New Fluorescent Fixture w/ Electronic Ballast
Watts Reduced 3.9 0 15 $0.75 $0.25 - $0.35
CI MT Garage T8/T5 New Fluorescent Fixture w/ Electronic Ballast
Watts Reduced 6.6 0 15 $0.75 $0.25 - $0.35
CI MT Interior 2-ft HPT8 Ballast with Low Ballast Factor
Fixture 50 0.00841 11 $17.50 $10 - $12
CI MT Interior 3-ft HPT8 Ballast with Low Ballast Factor
Fixture 34.1 0.00572 11 $17.50 $10 - $12
CI MT Interior 4-ft HPT8 Ballast with Low Ballast Factor
Fixture 65.4 0.01099 11 $17.50 $10 - $12
CI MT Interior RW T8 - 4-ft Reduced Watt Lamp only
Lamp 21.6 0.00017 12 $1.65 $1.00 - $1.20
CI MT Interior LED, T-1, or Electroluminescent Exit Signs
Signs 290.1 0.03894 16 $56.83 $25.00
CI MT Interior Occupancy Sensor
Watts Controlled 1.6 0.00067 8 $0.32 $0.25 - $0.30
CI MT Interior T8/T5 New Fluorescent Fixture w/ Electronic Ballast
Watts Reduced 6.4 0.00075 11 $0.75 $0.25 - $0.35
CI MT < 65,000 Btu/h (5.4 tons) - 15 SEER Air Source AC
Ton 135 0.08246 15 $180.43 $50 - $70
CI MT >= 240,000 Btu/h and < 760,000 Btu/h (21-63 tons) Air Source AC
Ton 124.4 0.07596 15 $32.38 $25 - $45
CI MT >= 65,000 Btu/h and < 120,000 Btu/h (5.5-10 tons) Air Source AC
Ton 99.7 0.06091 15 $27.35 $25 - $45
CI MT >=120,000 Btu/h and < 240,000 Btu/h (10-20 tons) Air Source AC
Ton 121.9 0.07444 15 $89.13 $25 - $45
CI MT Unitary and split AC >760,000 Btu/h (>63 tons)
Ton 95.1 0.05808 15 $107.73 $25 - $40
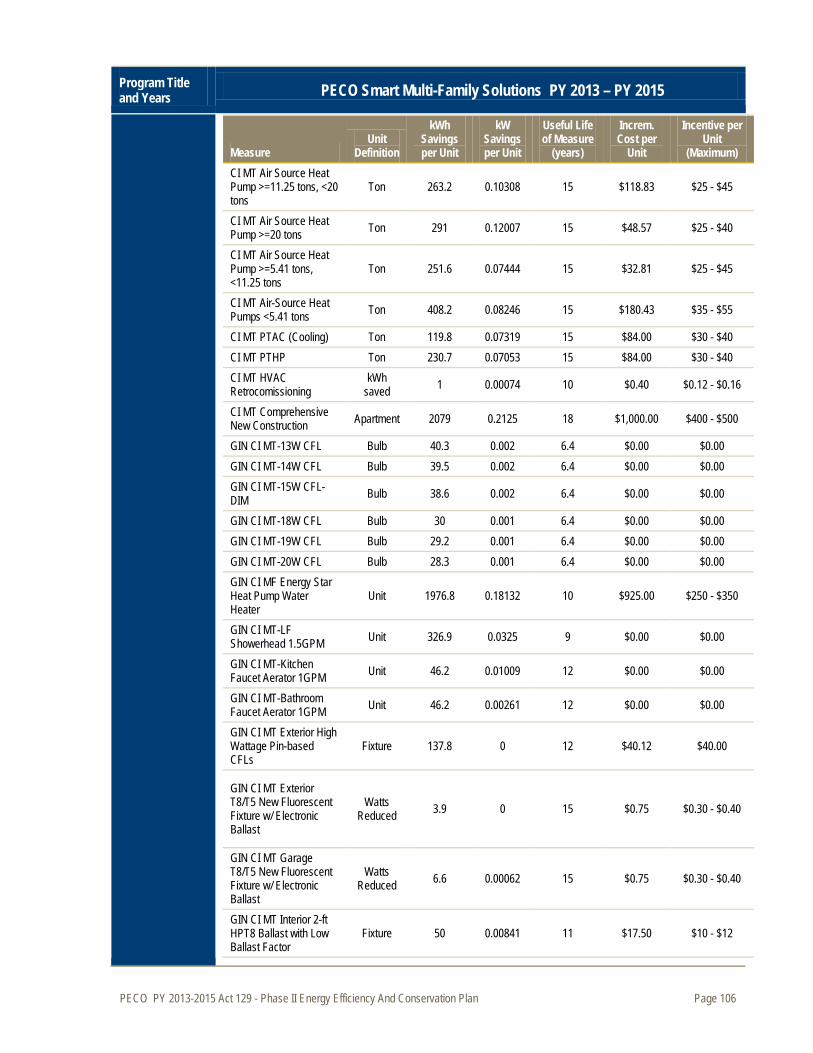
PECO PY 2013-2015 Act 129 - Phase II Energy Efficiency And Conservation Plan Page 106
Program Title and Years PECO Smart Multi-Family Solutions PY 2013 – PY 2015
Measure Unit
Definition
kWh Savings per Unit
kW Savings per Unit
Useful Life of Measure
(years)
Increm. Cost per
Unit
Incentive per Unit
(Maximum) CI MT Air Source Heat Pump >=11.25 tons, <20 tons
Ton 263.2 0.10308 15 $118.83 $25 - $45
CI MT Air Source Heat Pump >=20 tons Ton 291 0.12007 15 $48.57 $25 - $40
CI MT Air Source Heat Pump >=5.41 tons, <11.25 tons
Ton 251.6 0.07444 15 $32.81 $25 - $45
CI MT Air-Source Heat Pumps <5.41 tons Ton 408.2 0.08246 15 $180.43 $35 - $55
CI MT PTAC (Cooling) Ton 119.8 0.07319 15 $84.00 $30 - $40 CI MT PTHP Ton 230.7 0.07053 15 $84.00 $30 - $40 CI MT HVAC Retrocomissioning
kWh saved 1 0.00074 10 $0.40 $0.12 - $0.16
CI MT Comprehensive New Construction Apartment 2079 0.2125 18 $1,000.00 $400 - $500
GIN CI MT-13W CFL Bulb 40.3 0.002 6.4 $0.00 $0.00 GIN CI MT-14W CFL Bulb 39.5 0.002 6.4 $0.00 $0.00 GIN CI MT-15W CFL-DIM Bulb 38.6 0.002 6.4 $0.00 $0.00
GIN CI MT-18W CFL Bulb 30 0.001 6.4 $0.00 $0.00 GIN CI MT-19W CFL Bulb 29.2 0.001 6.4 $0.00 $0.00 GIN CI MT-20W CFL Bulb 28.3 0.001 6.4 $0.00 $0.00 GIN CI MF Energy Star Heat Pump Water Heater
Unit 1976.8 0.18132 10 $925.00 $250 - $350
GIN CI MT-LF Showerhead 1.5GPM Unit 326.9 0.0325 9 $0.00 $0.00
GIN CI MT-Kitchen Faucet Aerator 1GPM Unit 46.2 0.01009 12 $0.00 $0.00
GIN CI MT-Bathroom Faucet Aerator 1GPM Unit 46.2 0.00261 12 $0.00 $0.00
GIN CI MT Exterior High Wattage Pin-based CFLs
Fixture 137.8 0 12 $40.12 $40.00
GIN CI MT Exterior T8/T5 New Fluorescent Fixture w/ Electronic Ballast
Watts Reduced 3.9 0 15 $0.75 $0.30 - $0.40
GIN CI MT Garage T8/T5 New Fluorescent Fixture w/ Electronic Ballast
Watts Reduced 6.6 0.00062 15 $0.75 $0.30 - $0.40
GIN CI MT Interior 2-ft HPT8 Ballast with Low Ballast Factor
Fixture 50 0.00841 11 $17.50 $10 - $12
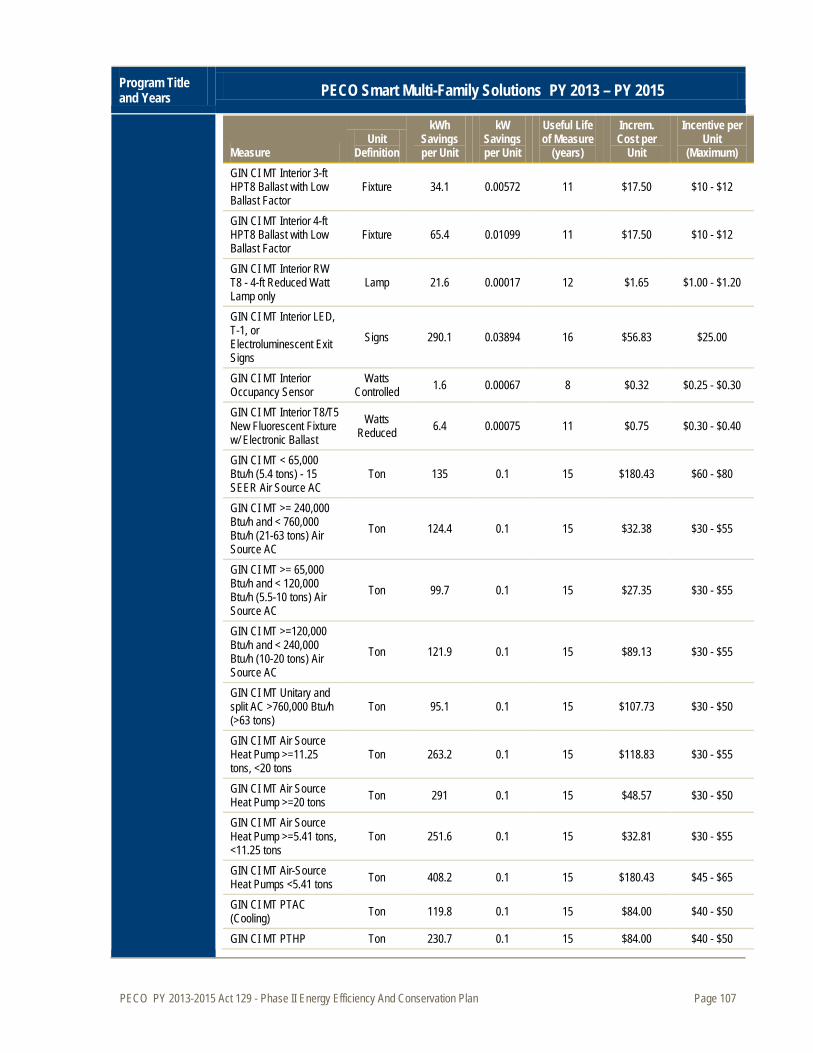
PECO PY 2013-2015 Act 129 - Phase II Energy Efficiency And Conservation Plan Page 107
Program Title and Years PECO Smart Multi-Family Solutions PY 2013 – PY 2015
Measure Unit
Definition
kWh Savings per Unit
kW Savings per Unit
Useful Life of Measure
(years)
Increm. Cost per
Unit
Incentive per Unit
(Maximum) GIN CI MT Interior 3-ft HPT8 Ballast with Low Ballast Factor
Fixture 34.1 0.00572 11 $17.50 $10 - $12
GIN CI MT Interior 4-ft HPT8 Ballast with Low Ballast Factor
Fixture 65.4 0.01099 11 $17.50 $10 - $12
GIN CI MT Interior RW T8 - 4-ft Reduced Watt Lamp only
Lamp 21.6 0.00017 12 $1.65 $1.00 - $1.20
GIN CI MT Interior LED, T-1, or Electroluminescent Exit Signs
Signs 290.1 0.03894 16 $56.83 $25.00
GIN CI MT Interior Occupancy Sensor
Watts Controlled 1.6 0.00067 8 $0.32 $0.25 - $0.30
GIN CI MT Interior T8/T5 New Fluorescent Fixture w/ Electronic Ballast
Watts Reduced 6.4 0.00075 11 $0.75 $0.30 - $0.40
GIN CI MT < 65,000 Btu/h (5.4 tons) - 15 SEER Air Source AC
Ton 135 0.1 15 $180.43 $60 - $80
GIN CI MT >= 240,000 Btu/h and < 760,000 Btu/h (21-63 tons) Air Source AC
Ton 124.4 0.1 15 $32.38 $30 - $55
GIN CI MT >= 65,000 Btu/h and < 120,000 Btu/h (5.5-10 tons) Air Source AC
Ton 99.7 0.1 15 $27.35 $30 - $55
GIN CI MT >=120,000 Btu/h and < 240,000 Btu/h (10-20 tons) Air Source AC
Ton 121.9 0.1 15 $89.13 $30 - $55
GIN CI MT Unitary and split AC >760,000 Btu/h (>63 tons)
Ton 95.1 0.1 15 $107.73 $30 - $50
GIN CI MT Air Source Heat Pump >=11.25 tons, <20 tons
Ton 263.2 0.1 15 $118.83 $30 - $55
GIN CI MT Air Source Heat Pump >=20 tons Ton 291 0.1 15 $48.57 $30 - $50
GIN CI MT Air Source Heat Pump >=5.41 tons, <11.25 tons
Ton 251.6 0.1 15 $32.81 $30 - $55
GIN CI MT Air-Source Heat Pumps <5.41 tons Ton 408.2 0.1 15 $180.43 $45 - $65
GIN CI MT PTAC (Cooling) Ton 119.8 0.1 15 $84.00 $40 - $50
GIN CI MT PTHP Ton 230.7 0.1 15 $84.00 $40 - $50
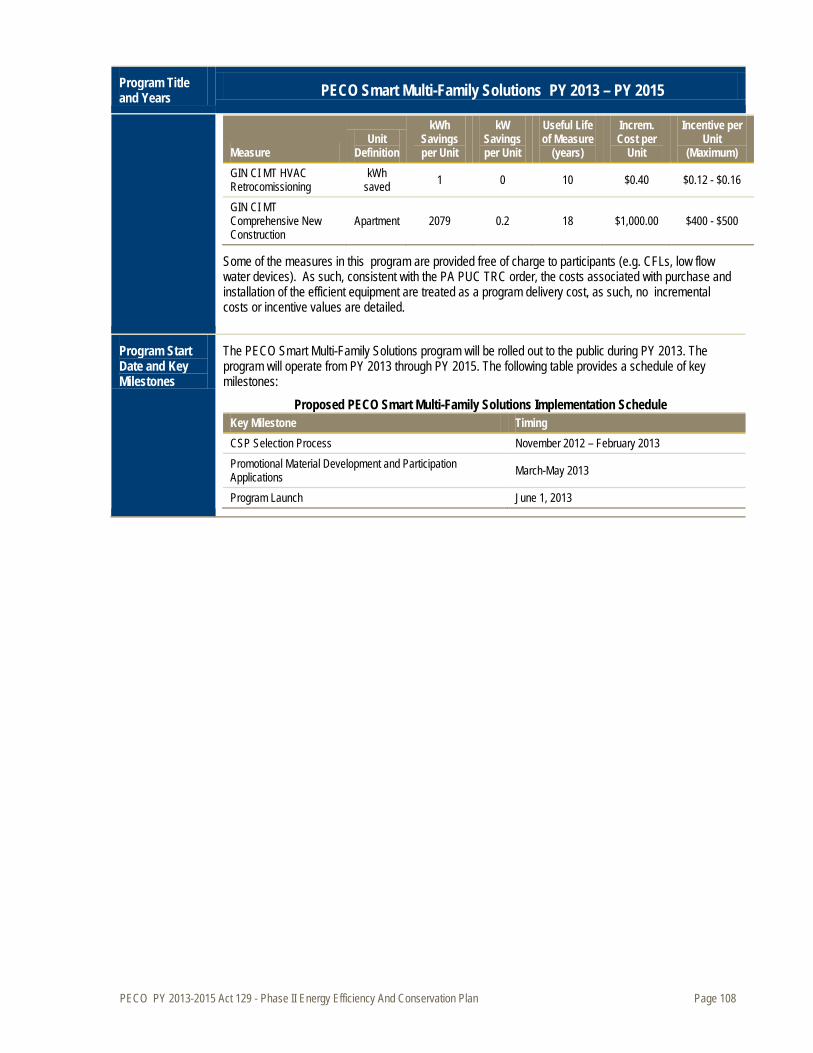
PECO PY 2013-2015 Act 129 - Phase II Energy Efficiency And Conservation Plan Page 108
Program Title and Years PECO Smart Multi-Family Solutions PY 2013 – PY 2015
Measure Unit
Definition
kWh Savings per Unit
kW Savings per Unit
Useful Life of Measure
(years)
Increm. Cost per
Unit
Incentive per Unit
(Maximum) GIN CI MT HVAC Retrocomissioning
kWh saved 1 0 10 $0.40 $0.12 - $0.16
GIN CI MT Comprehensive New Construction
Apartment 2079 0.2 18 $1,000.00 $400 - $500
Some of the measures in this program are provided free of charge to participants (e.g. CFLs, low flow water devices). As such, consistent with the PA PUC TRC order, the costs associated with purchase and installation of the efficient equipment are treated as a program delivery cost, as such, no incremental costs or incentive values are detailed.
Program Start Date and Key Milestones
The PECO Smart Multi-Family Solutions program will be rolled out to the public during PY 2013. The program will operate from PY 2013 through PY 2015. The following table provides a schedule of key milestones:
Proposed PECO Smart Multi-Family Solutions Implementation Schedule Key Milestone Timing CSP Selection Process November 2012 – February 2013 Promotional Material Development and Participation Applications March-May 2013
Program Launch June 1, 2013
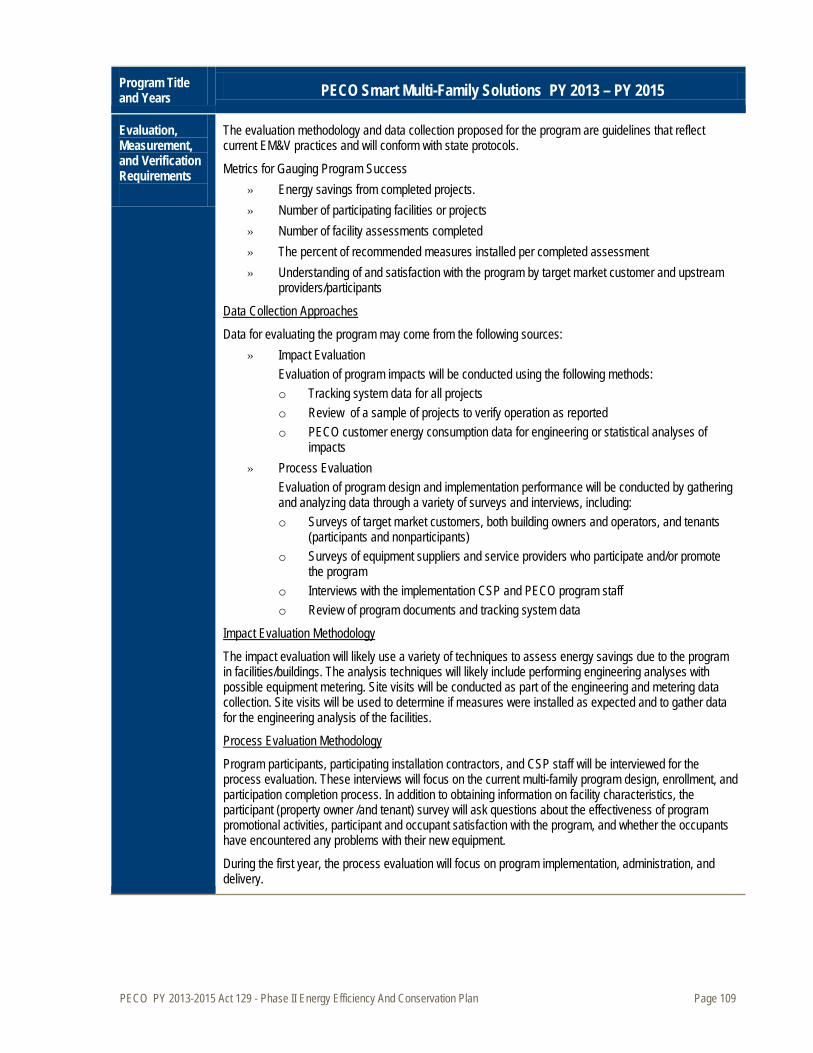
PECO PY 2013-2015 Act 129 - Phase II Energy Efficiency And Conservation Plan Page 109
Program Title and Years PECO Smart Multi-Family Solutions PY 2013 – PY 2015
Evaluation, Measurement, and Verification Requirements
The evaluation methodology and data collection proposed for the program are guidelines that reflect current EM&V practices and will conform with state protocols.
Metrics for Gauging Program Success » Energy savings from completed projects. » Number of participating facilities or projects » Number of facility assessments completed » The percent of recommended measures installed per completed assessment » Understanding of and satisfaction with the program by target market customer and upstream
providers/participants
Data for evaluating the program may come from the following sources:
Data Collection Approaches
» Impact Evaluation Evaluation of program impacts will be conducted using the following methods: o Tracking system data for all projects o Review of a sample of projects to verify operation as reported o PECO customer energy consumption data for engineering or statistical analyses of
impacts » Process Evaluation
Evaluation of program design and implementation performance will be conducted by gathering and analyzing data through a variety of surveys and interviews, including: o Surveys of target market customers, both building owners and operators, and tenants
(participants and nonparticipants) o Surveys of equipment suppliers and service providers who participate and/or promote
the program o Interviews with the implementation CSP and PECO program staff o Review of program documents and tracking system data
The impact evaluation will likely use a variety of techniques to assess energy savings due to the program in facilities/buildings. The analysis techniques will likely include performing engineering analyses with possible equipment metering. Site visits will be conducted as part of the engineering and metering data collection. Site visits will be used to determine if measures were installed as expected and to gather data for the engineering analysis of the facilities.
Impact Evaluation Methodology
Program participants, participating installation contractors, and CSP staff will be interviewed for the process evaluation. These interviews will focus on the current multi-family program design, enrollment, and participation completion process. In addition to obtaining information on facility characteristics, the participant (property owner /and tenant) survey will ask questions about the effectiveness of program promotional activities, participant and occupant satisfaction with the program, and whether the occupants have encountered any problems with their new equipment.
Process Evaluation Methodology
During the first year, the process evaluation will focus on program implementation, administration, and delivery.
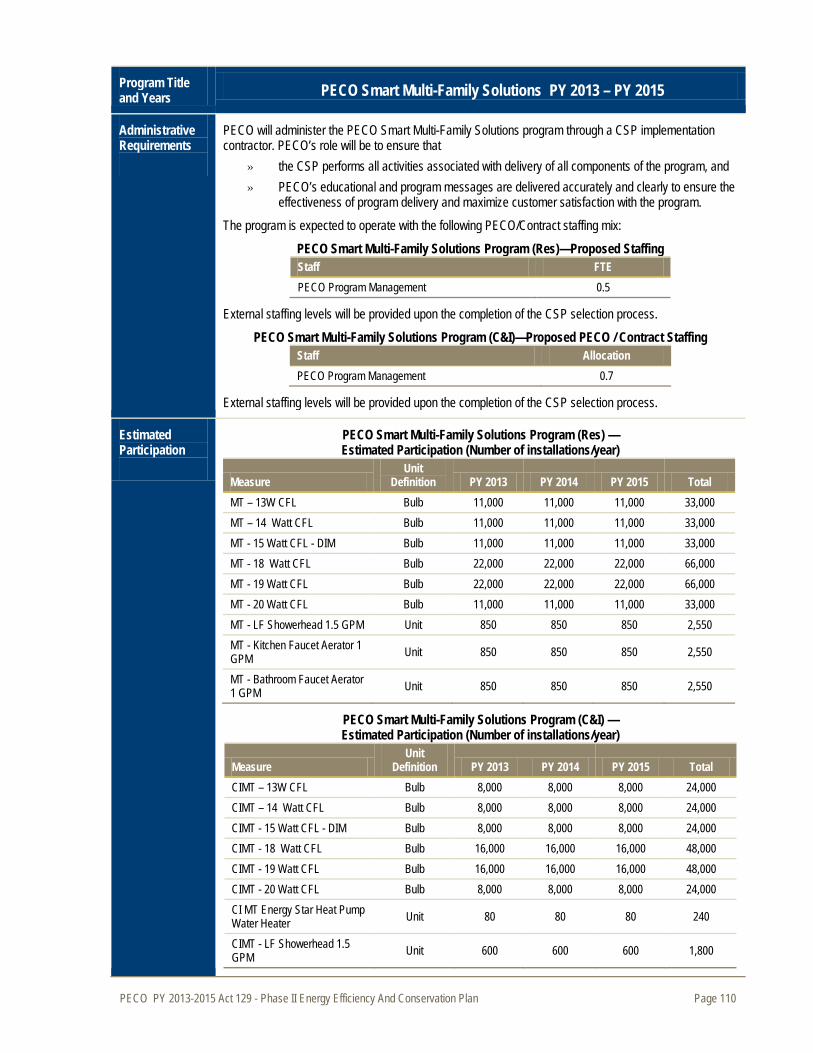
PECO PY 2013-2015 Act 129 - Phase II Energy Efficiency And Conservation Plan Page 110
Program Title and Years PECO Smart Multi-Family Solutions PY 2013 – PY 2015
Administrative Requirements
PECO will administer the PECO Smart Multi-Family Solutions program through a CSP implementation contractor. PECO’s role will be to ensure that
» the CSP performs all activities associated with delivery of all components of the program, and » PECO’s educational and program messages are delivered accurately and clearly to ensure the
effectiveness of program delivery and maximize customer satisfaction with the program.
The program is expected to operate with the following PECO/Contract staffing mix:
PECO Smart Multi-Family Solutions Program (Res)—Proposed Staffing Staff FTE PECO Program Management 0.5
External staffing levels will be provided upon the completion of the CSP selection process. PECO Smart Multi-Family Solutions Program (C&I)—Proposed PECO / Contract Staffing
Staff Allocation PECO Program Management 0.7
External staffing levels will be provided upon the completion of the CSP selection process.
Estimated Participation
PECO Smart Multi-Family Solutions Program (Res) — Estimated Participation (Number of installations/year)
Measure Unit
Definition PY 2013 PY 2014 PY 2015 Total MT – 13W CFL Bulb 11,000 11,000 11,000 33,000 MT – 14 Watt CFL Bulb 11,000 11,000 11,000 33,000 MT - 15 Watt CFL - DIM Bulb 11,000 11,000 11,000 33,000 MT - 18 Watt CFL Bulb 22,000 22,000 22,000 66,000 MT - 19 Watt CFL Bulb 22,000 22,000 22,000 66,000 MT - 20 Watt CFL Bulb 11,000 11,000 11,000 33,000 MT - LF Showerhead 1.5 GPM Unit 850 850 850 2,550 MT - Kitchen Faucet Aerator 1 GPM Unit 850 850 850 2,550
MT - Bathroom Faucet Aerator 1 GPM Unit 850 850 850 2,550
PECO Smart Multi-Family Solutions Program (C&I))— Estimated Participation (Number of installations/year)
Measure Unit
Definition PY 2013 PY 2014 PY 2015 Total CIMT – 13W CFL Bulb 8,000 8,000 8,000 24,000 CIMT – 14 Watt CFL Bulb 8,000 8,000 8,000 24,000 CIMT - 15 Watt CFL - DIM Bulb 8,000 8,000 8,000 24,000 CIMT - 18 Watt CFL Bulb 16,000 16,000 16,000 48,000 CIMT - 19 Watt CFL Bulb 16,000 16,000 16,000 48,000 CIMT - 20 Watt CFL Bulb 8,000 8,000 8,000 24,000 CI MT Energy Star Heat Pump Water Heater Unit 80 80 80 240
CIMT - LF Showerhead 1.5 GPM Unit 600 600 600 1,800
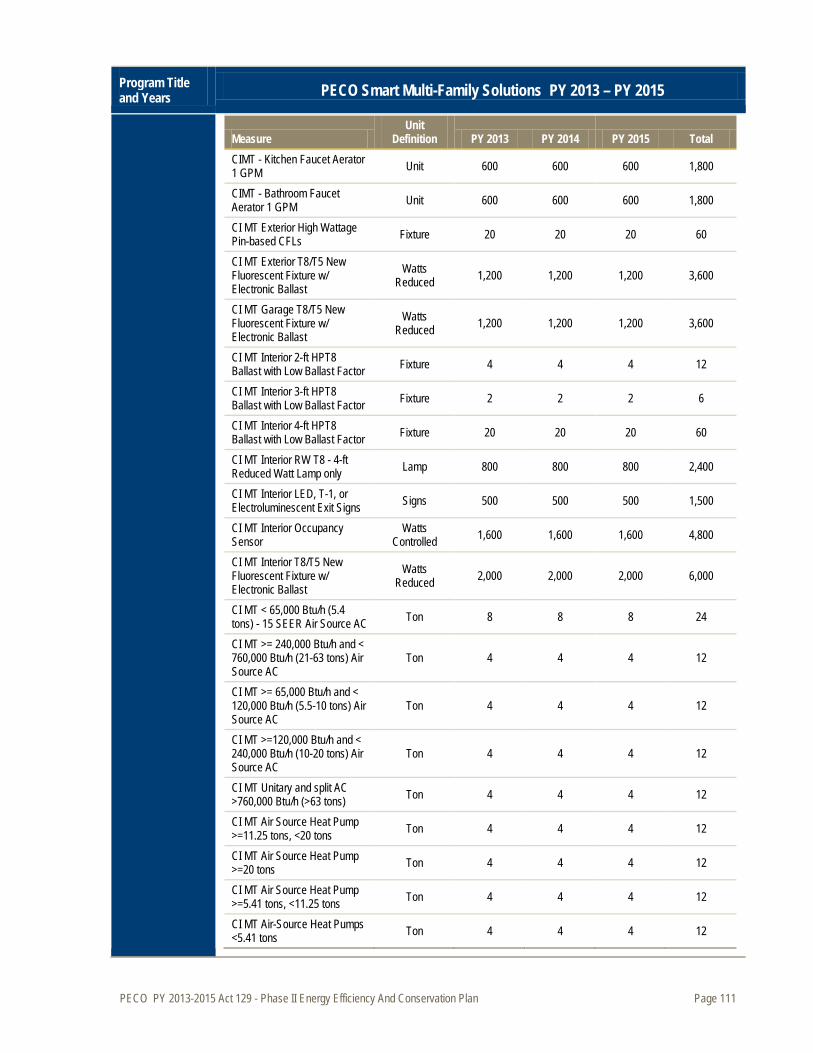
PECO PY 2013-2015 Act 129 - Phase II Energy Efficiency And Conservation Plan Page 111
Program Title and Years PECO Smart Multi-Family Solutions PY 2013 – PY 2015
Measure Unit
Definition PY 2013 PY 2014 PY 2015 Total CIMT - Kitchen Faucet Aerator 1 GPM Unit 600 600 600 1,800
CIMT - Bathroom Faucet Aerator 1 GPM Unit 600 600 600 1,800
CI MT Exterior High Wattage Pin-based CFLs Fixture 20 20 20 60
CI MT Exterior T8/T5 New Fluorescent Fixture w/ Electronic Ballast
Watts Reduced 1,200 1,200 1,200 3,600
CI MT Garage T8/T5 New Fluorescent Fixture w/ Electronic Ballast
Watts Reduced 1,200 1,200 1,200 3,600
CI MT Interior 2-ft HPT8 Ballast with Low Ballast Factor Fixture 4 4 4 12
CI MT Interior 3-ft HPT8 Ballast with Low Ballast Factor Fixture 2 2 2 6
CI MT Interior 4-ft HPT8 Ballast with Low Ballast Factor Fixture 20 20 20 60
CI MT Interior RW T8 - 4-ft Reduced Watt Lamp only Lamp 800 800 800 2,400
CI MT Interior LED, T-1, or Electroluminescent Exit Signs Signs 500 500 500 1,500
CI MT Interior Occupancy Sensor
Watts Controlled 1,600 1,600 1,600 4,800
CI MT Interior T8/T5 New Fluorescent Fixture w/ Electronic Ballast
Watts Reduced 2,000 2,000 2,000 6,000
CI MT < 65,000 Btu/h (5.4 tons) - 15 SEER Air Source AC Ton 8 8 8 24
CI MT >= 240,000 Btu/h and < 760,000 Btu/h (21-63 tons) Air Source AC
Ton 4 4 4 12
CI MT >= 65,000 Btu/h and < 120,000 Btu/h (5.5-10 tons) Air Source AC
Ton 4 4 4 12
CI MT >=120,000 Btu/h and < 240,000 Btu/h (10-20 tons) Air Source AC
Ton 4 4 4 12
CI MT Unitary and split AC >760,000 Btu/h (>63 tons) Ton 4 4 4 12
CI MT Air Source Heat Pump >=11.25 tons, <20 tons Ton 4 4 4 12
CI MT Air Source Heat Pump >=20 tons Ton 4 4 4 12
CI MT Air Source Heat Pump >=5.41 tons, <11.25 tons Ton 4 4 4 12
CI MT Air-Source Heat Pumps <5.41 tons Ton 4 4 4 12

PECO PY 2013-2015 Act 129 - Phase II Energy Efficiency And Conservation Plan Page 112
Program Title and Years PECO Smart Multi-Family Solutions PY 2013 – PY 2015
Measure Unit
Definition PY 2013 PY 2014 PY 2015 Total CI MT PTAC (Cooling) Ton 40 40 40 120 CI MT PTHP Ton 40 40 40 120 CI MT HVAC Retrocomissioning kWh saved 800 800 800 2,400
CI MT Comprehensive New Construction Apartment 400 400 400 1,200
GIN CI MT-13W CFL Bulb 360 360 360 1,080 GIN CI MT-14W CFL Bulb 1,600 1,600 1,600 4,800 GIN CI MT-15W CFL-DIM Bulb 1,600 1,600 1,600 4,800 GIN CI MT-18W CFL Bulb 1,600 1,600 1,600 4,800 GIN CI MT-19W CFL Bulb 3,000 3,000 3,000 9,000 GIN CI MT-20W CFL Bulb 3,000 3,000 3,000 9,000 GIN CI MF Energy Star Heat Pump Water Heater Unit 1,600 1,600 1,600 4,800
GIN CI MT-LF Showerhead 1.5GPM Unit 40 42 44 126
GIN CI MT-Kitchen Faucet Aerator 1GPM Unit 200 200 200 600
GIN CI MT-Bathroom Faucet Aerator 1GPM Unit 200 200 200 600
GIN CI MT Exterior High Wattage Pin-based CFLs Fixture 200 200 200 600
GIN CI MT Exterior T8/T5 New Fluorescent Fixture w/ Electronic Ballast
Watts Reduced 4 4 4 12
GIN CI MT Garage T8/T5 New Fluorescent Fixture w/ Electronic Ballast
Watts Reduced 300 300 300 900
GIN CI MT Interior 2-ft HPT8 Ballast with Low Ballast Factor Fixture 300 300 300 900
GIN CI MT Interior 3-ft HPT8 Ballast with Low Ballast Factor Fixture 2 2 2 6
GIN CI MT Interior 4-ft HPT8 Ballast with Low Ballast Factor Fixture 2 2 2 6
GIN CI MT Interior RW T8 - 4-ft Reduced Watt Lamp only Lamp 8 8 8 24
GIN CI MT Interior LED, T-1, or Electroluminescent Exit Signs
Signs 200 200 200 600
GIN CI MT Interior Occupancy Sensor
Watts Controlled 80 80 80 240
GIN CI MT Interior T8/T5 New Fluorescent Fixture w/ Electronic Ballast
Watts Reduced 400 400 400 1,200
GIN CI MT < 65,000 Btu/h (5.4 tons) - 15 SEER Air Source AC Ton 800 800 800 2,400
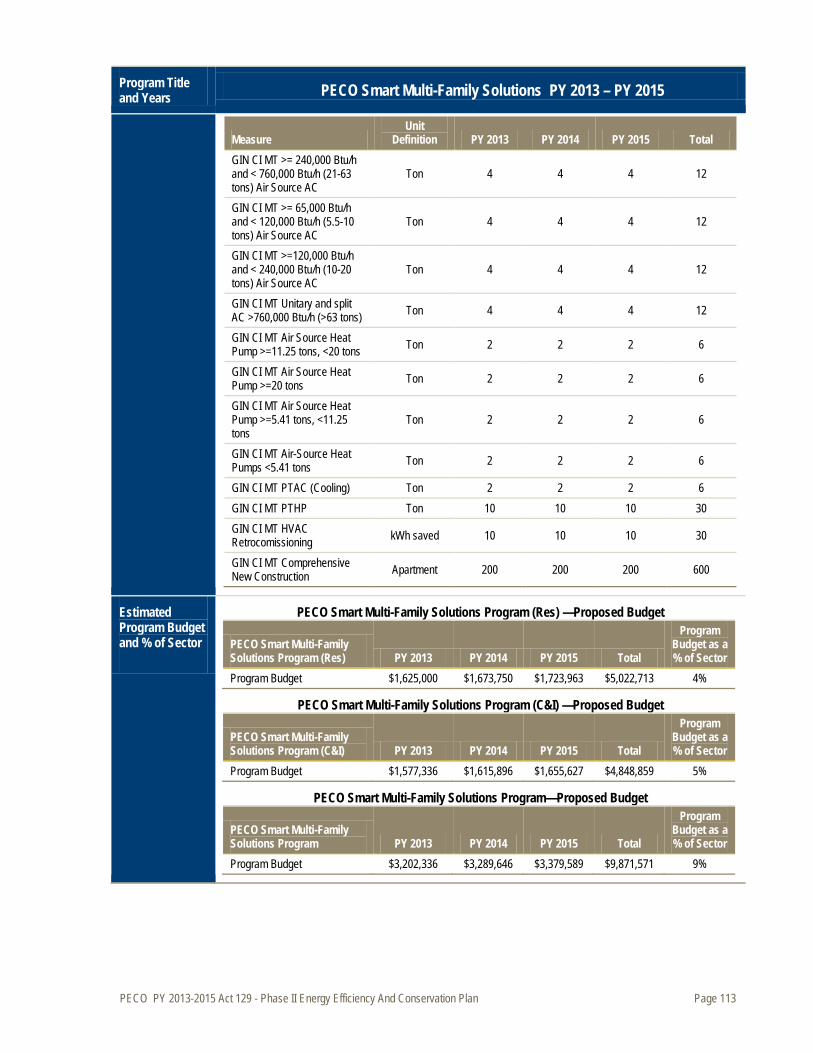
PECO PY 2013-2015 Act 129 - Phase II Energy Efficiency And Conservation Plan Page 113
Program Title and Years PECO Smart Multi-Family Solutions PY 2013 – PY 2015
Measure Unit
Definition PY 2013 PY 2014 PY 2015 Total GIN CI MT >= 240,000 Btu/h and < 760,000 Btu/h (21-63 tons) Air Source AC
Ton 4 4 4 12
GIN CI MT >= 65,000 Btu/h and < 120,000 Btu/h (5.5-10 tons) Air Source AC
Ton 4 4 4 12
GIN CI MT >=120,000 Btu/h and < 240,000 Btu/h (10-20 tons) Air Source AC
Ton 4 4 4 12
GIN CI MT Unitary and split AC >760,000 Btu/h (>63 tons) Ton 4 4 4 12
GIN CI MT Air Source Heat Pump >=11.25 tons, <20 tons Ton 2 2 2 6
GIN CI MT Air Source Heat Pump >=20 tons Ton 2 2 2 6
GIN CI MT Air Source Heat Pump >=5.41 tons, <11.25 tons
Ton 2 2 2 6
GIN CI MT Air-Source Heat Pumps <5.41 tons Ton 2 2 2 6
GIN CI MT PTAC (Cooling) Ton 2 2 2 6 GIN CI MT PTHP Ton 10 10 10 30 GIN CI MT HVAC Retrocomissioning kWh saved 10 10 10 30
GIN CI MT Comprehensive New Construction Apartment 200 200 200 600
Estimated Program Budget and % of Sector
PECO Smart Multi-Family Solutions Program (Res) —Proposed Budget
PECO Smart Multi-Family Solutions Program (Res) PY 2013 PY 2014 PY 2015 Total
Program Budget as a % of Sector
Program Budget $1,625,000 $1,673,750 $1,723,963 $5,022,713 4%
PECO Smart Multi-Family Solutions Program (C&I) —Proposed Budget
PECO Smart Multi-Family Solutions Program (C&I) PY 2013 PY 2014 PY 2015 Total
Program Budget as a % of Sector
Program Budget $1,577,336 $1,615,896 $1,655,627 $4,848,859 5%
PECO Smart Multi-Family Solutions Program—Proposed Budget
PECO Smart Multi-Family Solutions Program PY 2013 PY 2014 PY 2015 Total
Program Budget as a % of Sector
Program Budget $3,202,336 $3,289,646 $3,379,589 $9,871,571 9%
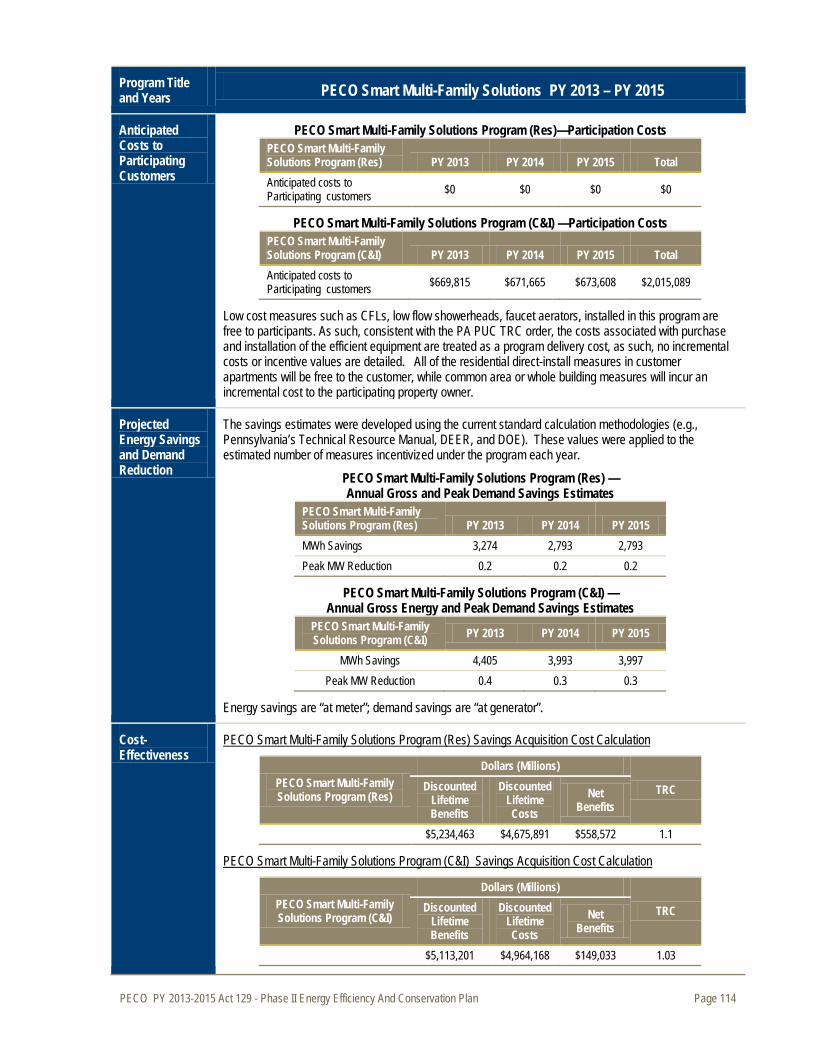
PECO PY 2013-2015 Act 129 - Phase II Energy Efficiency And Conservation Plan Page 114
Program Title and Years PECO Smart Multi-Family Solutions PY 2013 – PY 2015
Anticipated Costs to Participating Customers
PECO Smart Multi-Family Solutions Program (Res)—Participation Costs PECO Smart Multi-Family Solutions Program (Res) PY 2013 PY 2014 PY 2015 Total Anticipated costs to Participating customers $0 $0 $0 $0
PECO Smart Multi-Family Solutions Program (C&I) —Participation Costs PECO Smart Multi-Family Solutions Program (C&I) PY 2013 PY 2014 PY 2015 Total Anticipated costs to Participating customers $669,815 $671,665 $673,608 $2,015,089
Low cost measures such as CFLs, low flow showerheads, faucet aerators, installed in this program are free to participants. As such, consistent with the PA PUC TRC order, the costs associated with purchase and installation of the efficient equipment are treated as a program delivery cost, as such, no incremental costs or incentive values are detailed. All of the residential direct-install measures in customer apartments will be free to the customer, while common area or whole building measures will incur an incremental cost to the participating property owner.
Projected Energy Savings and Demand Reduction
The savings estimates were developed using the current standard calculation methodologies (e.g., Pennsylvania’s Technical Resource Manual, DEER, and DOE). These values were applied to the estimated number of measures incentivized under the program each year.
PECO Smart Multi-Family Solutions Program (Res) — Annual Gross and Peak Demand Savings Estimates
PECO Smart Multi-Family Solutions Program (Res) PY 2013 PY 2014 PY 2015 MWh Savings 3,274 2,793 2,793 Peak MW Reduction 0.2 0.2 0.2
PECO Smart Multi-Family Solutions Program (C&I) — Annual Gross Energy and Peak Demand Savings Estimates
PECO Smart Multi-Family Solutions Program (C&I) PY 2013 PY 2014 PY 2015
MWh Savings 4,405 3,993 3,997 Peak MW Reduction 0.4 0.3 0.3
Energy savings are “at meter”; demand savings are “at generator”.
Cost-Effectiveness
PECO Smart Multi-Family Solutions Program (Res)
PECO Smart Multi-Family Solutions Program (Res) Savings Acquisition Cost Calculation
Dollars (Millions)
TRC Discounted Lifetime Benefits
Discounted Lifetime Costs
Net Benefits
$5,234,463 $4,675,891 $558,572 1.1
PECO Smart Multi-Family Solutions Program (C&I)
PECO Smart Multi-Family Solutions Program (C&I) Savings Acquisition Cost Calculation
Dollars (Millions)
TRC Discounted Lifetime Benefits
Discounted Lifetime Costs
Net Benefits
$5,113,201 $4,964,168 $149,033 1.03
PECO PY 2013-2015 Act 129 - Phase II Energy Efficiency And Conservation Plan Page 115
3.2.2.4 EE Program 11 — PECO Smart Construction Incentives
Program Title and Years PECO Smart Construction Incentives PY 2013 – PY 2015
Objectives The PECO Smart Construction Incentives program has the following objectives: » Greatly improve the energy efficiency of all newly constructed facilities and facilities that are
completely renovated or reconstructed in the PECO service territory.
» Change building design and construction practices used by architects and engineers, contractors, and owners to include all cost-effective energy efficiency designs and equipment.
» Capture “lost opportunities” to reduce electric demand and energy usage in the commercial and industrial sector by providing participants with design assistance and custom incentives or performance contracting for the construction of energy-efficient buildings and facilities.
Target Market The target markets for the PECO Smart Construction Incentives program are decision makers for the design and/or construction of new facilities and renovation contractors and developers. This program will cover both new construction and buildings/facilities undergoing “major renovation,” defined as construction that involves the complete removal, redesign, and replacement of two or more major building systems. The eligible customer population for the program is all commercial and industrial projects under consideration in the PECO service territory or accounts provided with electricity by PECO including government, institutions and non-profit facilities.
While the energy and peak load savings resulting from this program will be accrued by the building owners and occupants, the key target market of the program are the professionals most responsible for the design and equipment decisions—architects and engineers, design/builders, developers, and contractors.
Program Description
The PECO Smart Construction Incentives program is designed to instill and accelerate adoption of design and construction practices so that new commercial and industrial facilities are more energy efficient than the current stock. The program provides facility designers and builders with training, design assistance, and incentives to incorporate energy efficient systems and construction practices in newly constructed and renovated facilities.
The program has the following components, directed to commercial and industrial building developers and the design and construction community: training, design assistance, and financial incentives.
» General training in best practices provided through technical workshops and other technical developmental activities for the design and engineering community to familiarize and educate them on energy efficient design methods and new technologies.
Training
» Directed to upstream providers of design and construction services, primarily architects and engineers (A&E), designers/builders, and contractors.
Design Assistance
» Project-specific design assistance will provide program participants with the services of the program CSP to evaluate the cost-effectiveness of energy-saving measures under consideration and to recommend measures that may have been overlooked.
» Sales support to design and engineering consultants to validate their proposed energy efficiency projects in presentations to clients.
» Prescriptive incentives payable per unit for itemized measures Financial Incentives
» Custom incentives payable on a per kWh savings basis as compared with local building energy code requirements for new construction or standard practices for major prescriptive measures.
Incentives are directed to facility owners but also available to upstream providers of design and construction services.

PECO PY 2013-2015 Act 129 - Phase II Energy Efficiency And Conservation Plan Page 116
Program Title and Years PECO Smart Construction Incentives PY 2013 – PY 2015
Implementation Strategy
PECO will administer the PECO Smart Construction Incentives program through a CSP implementation contractor.
» For the program to be effective PECO must educate design and construction professionals on how and why to upgrade their building practices. Once convinced, these design and construction influencers can promote the program and the efficiency benefits to their clients as well as to their suppliers and subcontractors.
Channels for Program Delivery
o Design/Builder firms that develop and build properties for investors; and o Architectural and engineering firms that provide engineering and design services for new
construction and major renovation projects. » Though not always involved in the specification of energy using systems, end use customers
will also be a channel for program delivery. o Investment funds that purchase new buildings and investments; and o Property managers who are responsible for major renovations of the buildings they
oversee. » Agents representing national retailers (e.g. CVS, 7-Eleven) (“rebate agents”) can also act as a
channel for delivering this program.
A CSP will implement the program on PECO’s behalf. The CSP will have full responsibility for delivery of all aspects of the program. Responsibilities fall into several activity areas:
Overview of Roles and Activities
» Outreach and Relationship Management – Identification and recruitment of upstream market actors for program participation and delivery channel activities.
» Education – Targeted on integrated design practices and benefits provided directly to participants through the program and to the broader market. Program staff time and resources are focused on information dissemination and teach/learn-by-example during projects with program participants, thereby facilitating projects through the process. To encourage market transformation while recruiting program participants, the program team will coordinate with outside efforts including LEED®, Advanced Buildings, ASHRAE, AIA, and others.
» Marketing - Articles and advertising in building design and engineering trade publications. Direct outreach through one-on-one meetings with individuals and presentations to architectural and engineering firms. Providing assistance with PECO’s direct program marketing.
» Design and Project Assistance – Services that assist facility designers and builders to integrate energy efficient recommendations into the design of the facility. Design assistance includes integrated design facilitation, energy calculation analysis, life-cycle costing analysis, and other services.
» Incentive Processing - including a fulfillment house to receive, review and verify applications; and pay the financial incentives.
» Program Performance Tracking and Improvement - including tracking availability of qualifying products, incentive submittals and payments, and opportunities to improve the program.
» Reporting - including reporting of program activities to meet regulatory and internal requirements, including progress toward program goals.
Education is a key component of the PECO Smart Construction Incentives program. The market will change through training, education and demonstration. The program will increase confidence in the performance of highly efficient building designs and benefits of increased energy efficiency (better performance, lower fuel bills, increased comfort, reduced maintenance, etc.). Designers and builders will be encouraged to implement more energy-efficient strategies to increase energy efficiency through the program.
Education Overview
PECO PY 2013-2015 Act 129 - Phase II Energy Efficiency And Conservation Plan Page 117
Program Title and Years PECO Smart Construction Incentives PY 2013 – PY 2015
Emphasis on the additional benefits of comprehensive energy efficiency improvements and continual maintenance to retain savings will demonstrate an overall cost-effectiveness that can be achieved without the need for financial incentives over the longer term. Ongoing deployment of these strategies will become “standard” practice by these same designers and builders in additional projects, affecting long-term market transformation.
To accomplish this, the program will offer several forms of education: » Training seminars will be conducted regularly throughout the program cycle and taught by
experts in specific aspects of high-efficiency building design and construction. In addition to teaching key design principles and promoting the program, the seminars will provide PECO with an excellent opportunity to develop strong relationships and build trust with industry professionals. PECO will consider linking the training activities with nationwide certification programs for builders, inspectors, lighting designers and with continuing education programs for architects and engineers.
» Articles and case studies with technical information, practical advice, and persuasive messages will be developed by the program. These can be included in newsletters directed to design/build, published in trade journals, sent in direct mail, distributed at seminars, and made available on a PECO website page designed for this audience.
» Demonstration projects will be supported by the program to support the advancement of emerging technologies perceived to be risky or unproven. The demonstration projects will document the project development process, highlighting likely technical issues and their resolution. Energy savings and other benefits from improved performance or reduced maintenance will also be monitored.
» ENERGY STAR has considerable material on its website directed to commercial and industrial design and construction community, which the program will leverage through links from the program Web site and references in program articles and case studies. Materials include Commercial Building Design guidelines and strategies, “Designed to Earn the ENERGY STAR” program, the “ENERGY STAR Challenge” for architecture firms, communications materials, many types of training opportunities, and an extensive tools and resources library.
Applicable Collaborative Resources
12
» ENERGY STAR also offers opportunity for buildings to apply for an ENERGY STAR rating from the Environmental Protection Agency. The program will further enhance the benefit of program participation by promoting the ENERGY STAR rating as an additional outcome.
» The Sustainable Development Fund Financing provides financing for the installation of solar PV and hot water heating systems. The program will provide information on the availability of financing when solar PV and hot water heating systems are included in the building design.
Program Issues, Risks, and Risk Management Strategies
Several market barriers inhibit the participation in new construction programs. Such barriers, which the program implementation activities will address, include:
» Perception of Increased Cost: Many designers and builders feel that increased building performance costs more, and that it is not cost-effective.
» Risk Aversion: Historically, the commercial design and engineering community has been particularly slow to adopt new technologies or solutions. A&Es prefer to design and install systems and buildings using familiar technologies and designs. Liability issues are also a concern.
» First Cost vs. Lifecycle Cost Considerations: Building developers are very concerned with first cost considerations as they often must build within a pre-determined budget. As such, they are reluctant to consider high-efficiency measures, which usually cost more.
12 http://www.energystar.gov/index.cfm?c=business.bus_index, July 2012.

PECO PY 2013-2015 Act 129 - Phase II Energy Efficiency And Conservation Plan Page 118
Program Title and Years PECO Smart Construction Incentives PY 2013 – PY 2015
» Limited Technical Information: Designers and owners have limited familiarity with new products, technologies and their applications, and their associated benefits that extend beyond energy savings (comfort, durability, health, productivity and maintenance). ENERGY STAR, AIA, and other available training programs are whittling away at this problem.
» Inadequate Operational Procedures: Building systems are usually not tested to ensure that they perform as designed. In addition, owners frequently fail to implement an ongoing maintenance and quality assurance procedure to properly operate the equipment.
Ramp Up Strategy
This program is a continuing program, and a full ramp up strategy is not anticipated. However, the program implementation staff will be trained on any revised program guidelines and eligible technologies.
Marketing Strategy
The primary focus of the program’s marketing strategy will be to leverage the influence of the building design community on the construction practices and system selection in new construction and major renovations. The program will utilize established trade ally channels for educating and developing stakeholder awareness of the benefits of designing, building and promoting energy efficient construction standards. This will be accomplished through the following:
» Training seminars addressing specific aspects of high-efficiency building design and construction and the program incentives and eligibility.
» Direct outreach through one-on-one meetings with individuals and presentations to architectural and engineering firms.
» Articles and case studies with technical information, practical advice, and persuasive messages to be included in newsletters directed to design/build, published in trade journals, sent in direct mail, distributed at seminars, and made available on a PECO website page.
» Demonstration projects to support the advancement of emerging technologies perceived to be risky or unproven.
Limited outreach to end use customers will be conducted. This outreach will target property managers and building owners. Industry groups, such as Building Owners and Managers Association (BOMA), conferences, and other similar venues will be used over direct or one-on-one strategies.
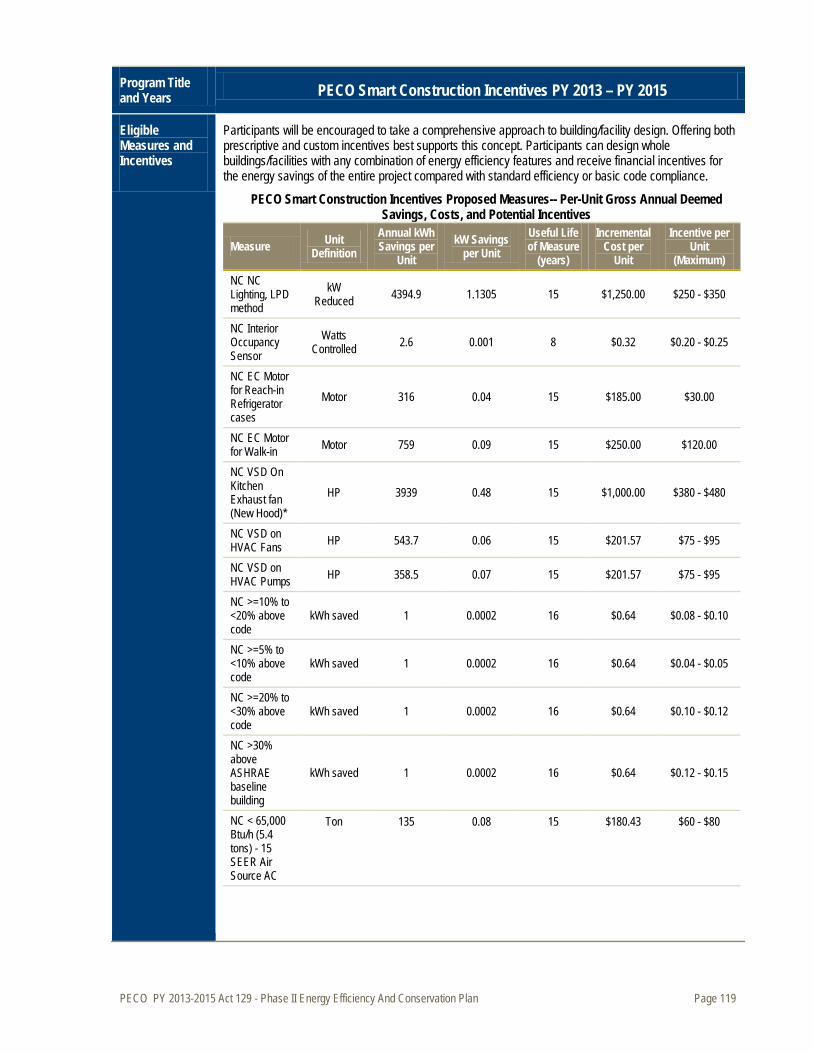
PECO PY 2013-2015 Act 129 - Phase II Energy Efficiency And Conservation Plan Page 119
Program Title and Years PECO Smart Construction Incentives PY 2013 – PY 2015
Eligible Measures and Incentives
Participants will be encouraged to take a comprehensive approach to building/facility design. Offering both prescriptive and custom incentives best supports this concept. Participants can design whole buildings/facilities with any combination of energy efficiency features and receive financial incentives for the energy savings of the entire project compared with standard efficiency or basic code compliance.
PECO Smart Construction Incentives Proposed Measures-- Per-Unit Gross Annual Deemed Savings, Costs, and Potential Incentives
Measure Unit Definition
Annual kWh Savings per
Unit kW Savings
per Unit Useful Life of Measure
(years)
Incremental Cost per
Unit
Incentive per Unit
(Maximum) NC NC Lighting, LPD method
kW Reduced 4394.9 1.1305 15 $1,250.00 $250 - $350
NC Interior Occupancy Sensor
Watts Controlled 2.6 0.001 8 $0.32 $0.20 - $0.25
NC EC Motor for Reach-in Refrigerator cases
Motor 316 0.04 15 $185.00 $30.00
NC EC Motor for Walk-in Motor 759 0.09 15 $250.00 $120.00
NC VSD On Kitchen Exhaust fan (New Hood)*
HP 3939 0.48 15 $1,000.00 $380 - $480
NC VSD on HVAC Fans HP 543.7 0.06 15 $201.57 $75 - $95
NC VSD on HVAC Pumps HP 358.5 0.07 15 $201.57 $75 - $95
NC >=10% to <20% above code
kWh saved 1 0.0002 16 $0.64 $0.08 - $0.10
NC >=5% to <10% above code
kWh saved 1 0.0002 16 $0.64 $0.04 - $0.05
NC >=20% to <30% above code
kWh saved 1 0.0002 16 $0.64 $0.10 - $0.12
NC >30% above ASHRAE baseline building
kWh saved 1 0.0002 16 $0.64 $0.12 - $0.15
NC < 65,000 Btu/h (5.4 tons) - 15 SEER Air Source AC
Ton 135 0.08 15 $180.43 $60 - $80
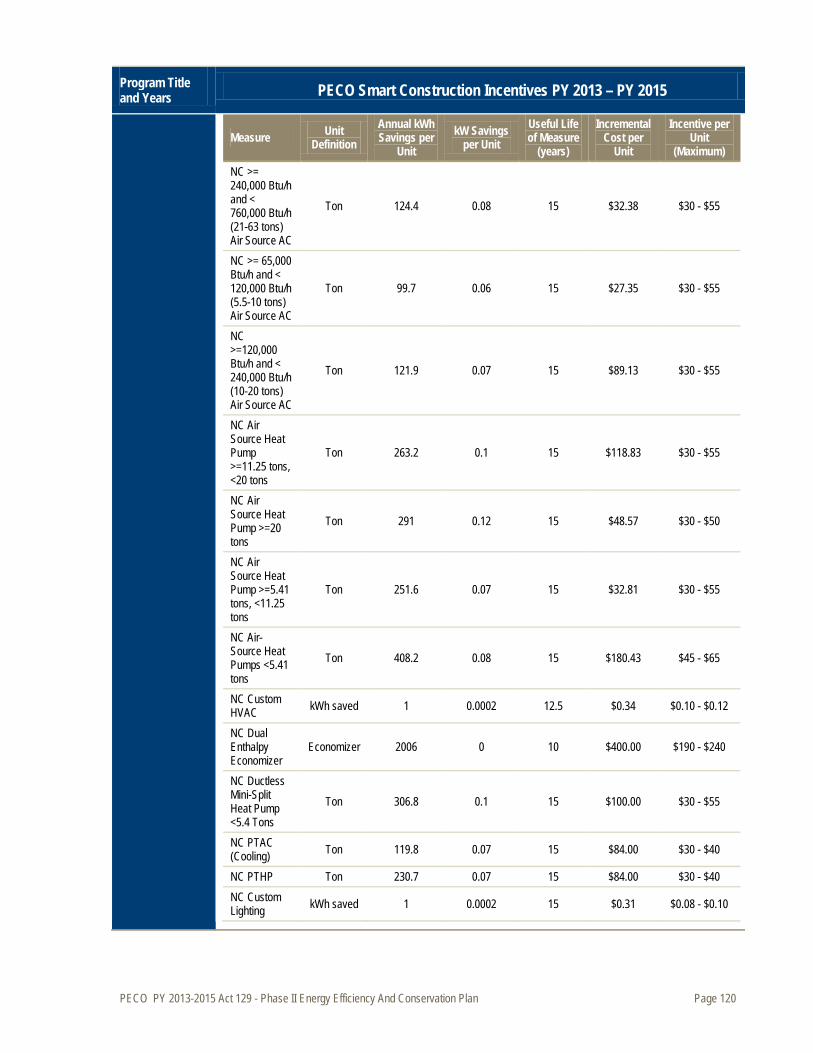
PECO PY 2013-2015 Act 129 - Phase II Energy Efficiency And Conservation Plan Page 120
Program Title and Years PECO Smart Construction Incentives PY 2013 – PY 2015
Measure Unit Definition
Annual kWh Savings per
Unit kW Savings
per Unit Useful Life of Measure
(years)
Incremental Cost per
Unit
Incentive per Unit
(Maximum) NC >= 240,000 Btu/h and < 760,000 Btu/h (21-63 tons) Air Source AC
Ton 124.4 0.08 15 $32.38 $30 - $55
NC >= 65,000 Btu/h and < 120,000 Btu/h (5.5-10 tons) Air Source AC
Ton 99.7 0.06 15 $27.35 $30 - $55
NC >=120,000 Btu/h and < 240,000 Btu/h (10-20 tons) Air Source AC
Ton 121.9 0.07 15 $89.13 $30 - $55
NC Air Source Heat Pump >=11.25 tons, <20 tons
Ton 263.2 0.1 15 $118.83 $30 - $55
NC Air Source Heat Pump >=20 tons
Ton 291 0.12 15 $48.57 $30 - $50
NC Air Source Heat Pump >=5.41 tons, <11.25 tons
Ton 251.6 0.07 15 $32.81 $30 - $55
NC Air-Source Heat Pumps <5.41 tons
Ton 408.2 0.08 15 $180.43 $45 - $65
NC Custom HVAC kWh saved 1 0.0002 12.5 $0.34 $0.10 - $0.12
NC Dual Enthalpy Economizer
Economizer 2006 0 10 $400.00 $190 - $240
NC Ductless Mini-Split Heat Pump <5.4 Tons
Ton 306.8 0.1 15 $100.00 $30 - $55
NC PTAC (Cooling) Ton 119.8 0.07 15 $84.00 $30 - $40
NC PTHP Ton 230.7 0.07 15 $84.00 $30 - $40 NC Custom Lighting kWh saved 1 0.0002 15 $0.31 $0.08 - $0.10

PECO PY 2013-2015 Act 129 - Phase II Energy Efficiency And Conservation Plan Page 121
Program Title and Years PECO Smart Construction Incentives PY 2013 – PY 2015
Measure Unit Definition
Annual kWh Savings per
Unit kW Savings
per Unit Useful Life of Measure
(years)
Incremental Cost per
Unit
Incentive per Unit
(Maximum) NC Custom Motors and Drives
kWh saved 1 0.0001 15 $0.24 $0.10 - $0.12
NC Custom Other kWh saved 1 0.0002 13.45 $0.26 $0.10 - $0.12
NC Custom Refrigeration kWh saved 1 0.0001 14 $0.34 $0.10 - $0.12
NC ENERGY STAR Glass Door Freezer
Unit 3747.5 0.43 12 $804.75 $360.00
NC ENERGY STAR Refrigerated Beverage Vending Machine
Unit 1576.1 0 14 $110.00 $90.00
NC ENERGY STAR Solid Door Freezer
Unit 1769 0.2 12 $804.75 $180.00
NC Hotel Guest Room Occupancy Sensor (Electric Heat/AC)
Sensor 1117 0.07 10 $260.00 $70.00
NC LED Refrigeration Case Lighting
Door 365 0.06814 15 $266.00 $100.00
NC Anti-Sweat Heater Controls
Linear Foot 519 0.0112 12 $34.00 $30.00
NC Automatic Door Closers for Walk-in Coolers
Door 1017 0.143 8 $156.82 $85.00
NC Automatic Door Closers for Walk-in Freezers
Door 2457 0.426 8 $156.82 $120.00
NC Beverage Machine Controls
Unit 1664.6 0 5 $160.00 $120.00
NC Night Cover Linear Foot 43.8 0 5 $42.00 $6.00
NC Snack Machine Controls
Unit 499.4 0 5 $80.00 $60.00
GIN NC NC Lighting, LPD method
kW Reduced 4394.9 1.1305 15 $1,250.00 $300 - $350
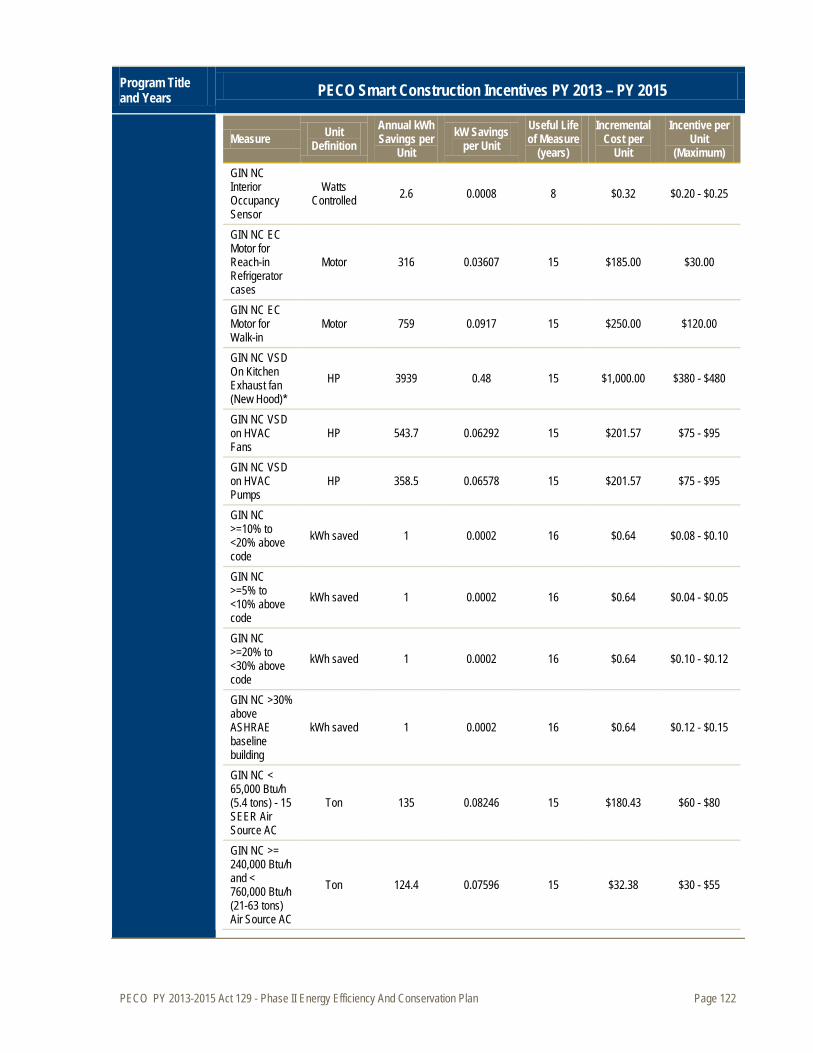
PECO PY 2013-2015 Act 129 - Phase II Energy Efficiency And Conservation Plan Page 122
Program Title and Years PECO Smart Construction Incentives PY 2013 – PY 2015
Measure Unit Definition
Annual kWh Savings per
Unit kW Savings
per Unit Useful Life of Measure
(years)
Incremental Cost per
Unit
Incentive per Unit
(Maximum) GIN NC Interior Occupancy Sensor
Watts Controlled 2.6 0.0008 8 $0.32 $0.20 - $0.25
GIN NC EC Motor for Reach-in Refrigerator cases
Motor 316 0.03607 15 $185.00 $30.00
GIN NC EC Motor for Walk-in
Motor 759 0.0917 15 $250.00 $120.00
GIN NC VSD On Kitchen Exhaust fan (New Hood)*
HP 3939 0.48 15 $1,000.00 $380 - $480
GIN NC VSD on HVAC Fans
HP 543.7 0.06292 15 $201.57 $75 - $95
GIN NC VSD on HVAC Pumps
HP 358.5 0.06578 15 $201.57 $75 - $95
GIN NC >=10% to <20% above code
kWh saved 1 0.0002 16 $0.64 $0.08 - $0.10
GIN NC >=5% to <10% above code
kWh saved 1 0.0002 16 $0.64 $0.04 - $0.05
GIN NC >=20% to <30% above code
kWh saved 1 0.0002 16 $0.64 $0.10 - $0.12
GIN NC >30% above ASHRAE baseline building
kWh saved 1 0.0002 16 $0.64 $0.12 - $0.15
GIN NC < 65,000 Btu/h (5.4 tons) - 15 SEER Air Source AC
Ton 135 0.08246 15 $180.43 $60 - $80
GIN NC >= 240,000 Btu/h and < 760,000 Btu/h (21-63 tons) Air Source AC
Ton 124.4 0.07596 15 $32.38 $30 - $55
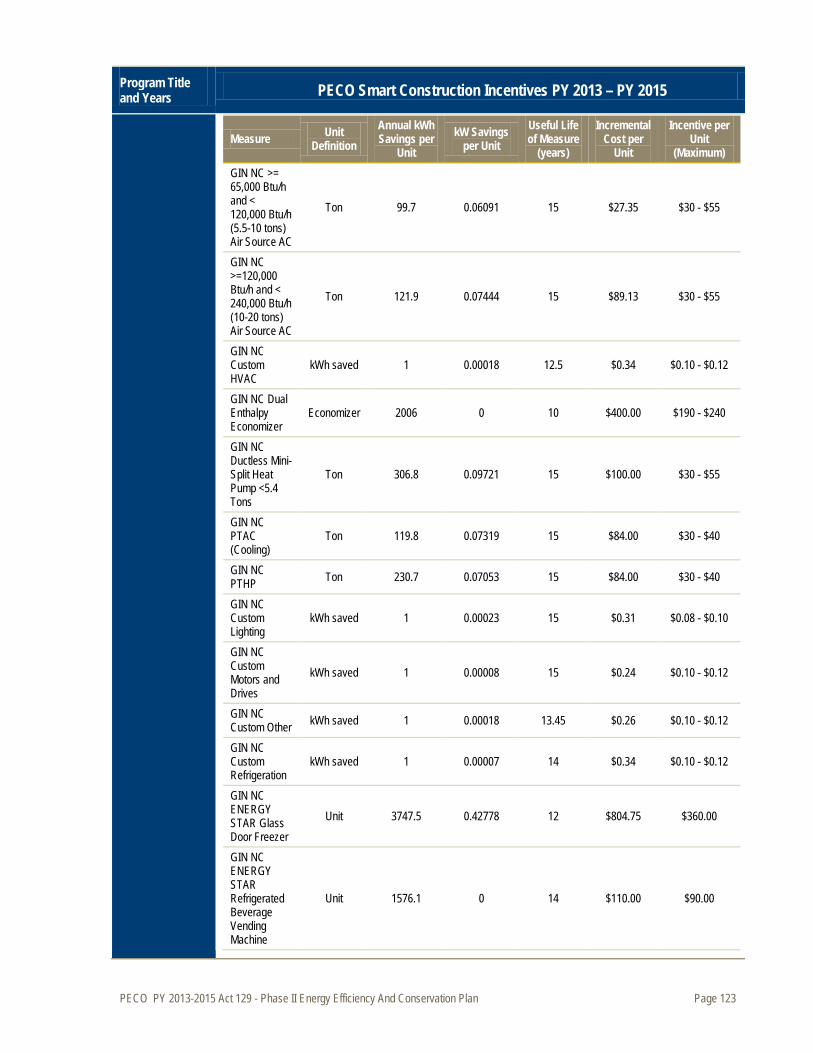
PECO PY 2013-2015 Act 129 - Phase II Energy Efficiency And Conservation Plan Page 123
Program Title and Years PECO Smart Construction Incentives PY 2013 – PY 2015
Measure Unit Definition
Annual kWh Savings per
Unit kW Savings
per Unit Useful Life of Measure
(years)
Incremental Cost per
Unit
Incentive per Unit
(Maximum) GIN NC >= 65,000 Btu/h and < 120,000 Btu/h (5.5-10 tons) Air Source AC
Ton 99.7 0.06091 15 $27.35 $30 - $55
GIN NC >=120,000 Btu/h and < 240,000 Btu/h (10-20 tons) Air Source AC
Ton 121.9 0.07444 15 $89.13 $30 - $55
GIN NC Custom HVAC
kWh saved 1 0.00018 12.5 $0.34 $0.10 - $0.12
GIN NC Dual Enthalpy Economizer
Economizer 2006 0 10 $400.00 $190 - $240
GIN NC Ductless Mini-Split Heat Pump <5.4 Tons
Ton 306.8 0.09721 15 $100.00 $30 - $55
GIN NC PTAC (Cooling)
Ton 119.8 0.07319 15 $84.00 $30 - $40
GIN NC PTHP Ton 230.7 0.07053 15 $84.00 $30 - $40
GIN NC Custom Lighting
kWh saved 1 0.00023 15 $0.31 $0.08 - $0.10
GIN NC Custom Motors and Drives
kWh saved 1 0.00008 15 $0.24 $0.10 - $0.12
GIN NC Custom Other kWh saved 1 0.00018 13.45 $0.26 $0.10 - $0.12
GIN NC Custom Refrigeration
kWh saved 1 0.00007 14 $0.34 $0.10 - $0.12
GIN NC ENERGY STAR Glass Door Freezer
Unit 3747.5 0.42778 12 $804.75 $360.00
GIN NC ENERGY STAR Refrigerated Beverage Vending Machine
Unit 1576.1 0 14 $110.00 $90.00
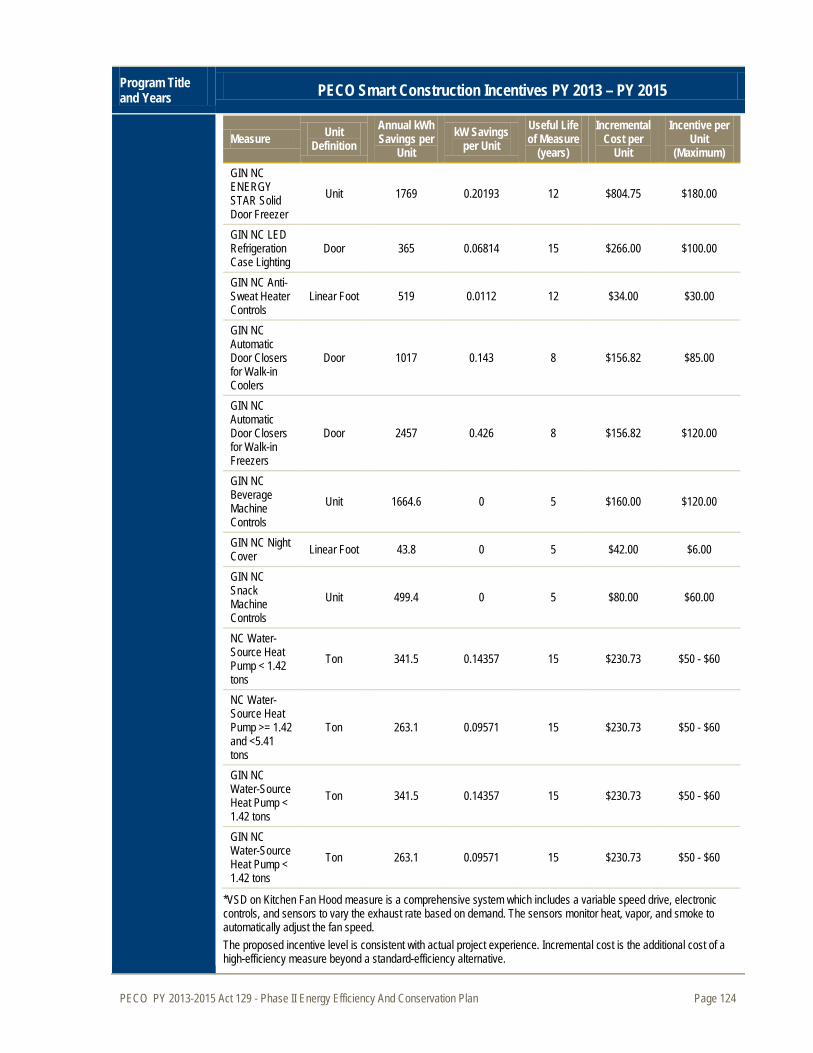
PECO PY 2013-2015 Act 129 - Phase II Energy Efficiency And Conservation Plan Page 124
Program Title and Years PECO Smart Construction Incentives PY 2013 – PY 2015
Measure Unit Definition
Annual kWh Savings per
Unit kW Savings
per Unit Useful Life of Measure
(years)
Incremental Cost per
Unit
Incentive per Unit
(Maximum) GIN NC ENERGY STAR Solid Door Freezer
Unit 1769 0.20193 12 $804.75 $180.00
GIN NC LED Refrigeration Case Lighting
Door 365 0.06814 15 $266.00 $100.00
GIN NC Anti-Sweat Heater Controls
Linear Foot 519 0.0112 12 $34.00 $30.00
GIN NC Automatic Door Closers for Walk-in Coolers
Door 1017 0.143 8 $156.82 $85.00
GIN NC Automatic Door Closers for Walk-in Freezers
Door 2457 0.426 8 $156.82 $120.00
GIN NC Beverage Machine Controls
Unit 1664.6 0 5 $160.00 $120.00
GIN NC Night Cover Linear Foot 43.8 0 5 $42.00 $6.00
GIN NC Snack Machine Controls
Unit 499.4 0 5 $80.00 $60.00
NC Water-Source Heat Pump < 1.42 tons
Ton 341.5 0.14357 15 $230.73 $50 - $60
NC Water-Source Heat Pump >= 1.42 and <5.41 tons
Ton 263.1 0.09571 15 $230.73 $50 - $60
GIN NC Water-Source Heat Pump < 1.42 tons
Ton 341.5 0.14357 15 $230.73 $50 - $60
GIN NC Water-Source Heat Pump < 1.42 tons
Ton 263.1 0.09571 15 $230.73 $50 - $60
*VSD on Kitchen Fan Hood measure is a comprehensive system which includes a variable speed drive, electronic controls, and sensors to vary the exhaust rate based on demand. The sensors monitor heat, vapor, and smoke to automatically adjust the fan speed. The proposed incentive level is consistent with actual project experience. Incremental cost is the additional cost of a high-efficiency measure beyond a standard-efficiency alternative.

PECO PY 2013-2015 Act 129 - Phase II Energy Efficiency And Conservation Plan Page 125
Program Title and Years PECO Smart Construction Incentives PY 2013 – PY 2015
Program Start Date and Key Milestones
The following schedule identifies key milestones for the PECO Smart Construction Incentives program. The program will start in PY 2013 and continue services through PY 2015.
Proposed PECO Smart Construction Incentives Implementation Schedule Key Milestone Timing CSP Selection Process November 2012 – February 2013 Promotional Material Development and Participation Applications March-May 2013 Program Launch June 1, 2013
Evaluation, Measurement, and Verification Requirements
The data collection guidelines proposed for the program reflect EM&V practices and will conform to the state protocols.
» Number of projects completed Metrics for Gauging Program Success
» Energy and demand savings associated with facilities built through participation in the program » Number of training seminar attendees and/or trades people certified in energy-efficient building
principles » Increase in receptivity/adoption of energy-efficient building practices by designers, builders, and
developers to measure the effectiveness of the marketing and education activities
Data for evaluating the program may come from the following sources:
Data Collection Approaches
» Impact Evaluation » Evaluation of program impacts will be conducted using the following data sources:
o Tracking system data for all projects o Review of a sample of projects to verify operation as reported o PECO customer energy consumption data for engineering or statistical analyses of
impacts o Energy simulation models submitted to the program for whole building projects
» Process Evaluation » Evaluation of program design and implementation performance will be conducted by gathering
and analyzing data through a variety of surveys and interviews, including: o Surveys of target market customers, both building owners and operators (participants
and nonparticipants) o Surveys of equipment suppliers and service providers who participate and/or promote the
program o Interviews with the implementation CSP and PECO program staff o Review of program documents and tracking system data
The impact evaluation will likely use a variety of techniques to assess energy savings due to the program in new facilities/buildings. The analysis techniques will likely include performing engineering analyses and perhaps metering as well, to determine whether the participant facilities operate as designed and achieve the expected savings. Site visits will be conducted as part of the engineering and metering data collection; additional site visits may be added at a later date if any installation problems are identified. Site visits will be used to determine if measures were installed as expected and to gather data for the engineering analysis of the facilities as built. For this program, the understanding and availability of baseline values for facility consumption will be critical to an assessment of energy savings.
Impact Evaluation Methodology
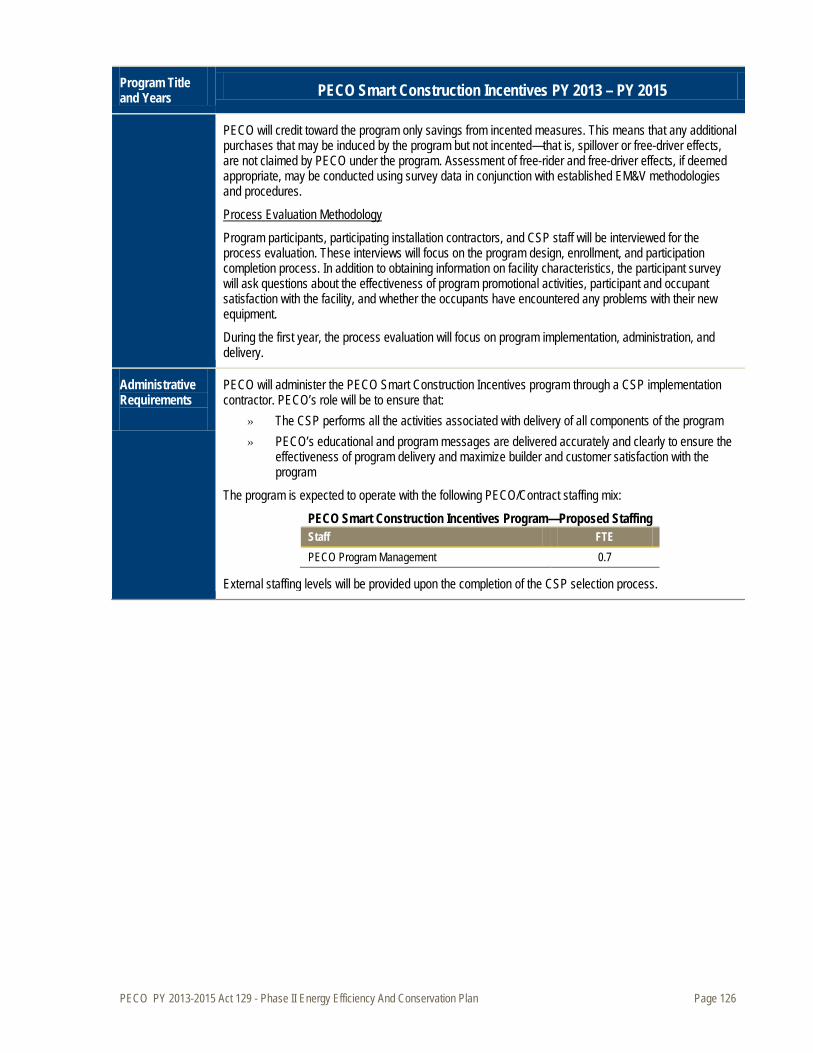
PECO PY 2013-2015 Act 129 - Phase II Energy Efficiency And Conservation Plan Page 126
Program Title and Years PECO Smart Construction Incentives PY 2013 – PY 2015
PECO will credit toward the program only savings from incented measures. This means that any additional purchases that may be induced by the program but not incented—that is, spillover or free-driver effects, are not claimed by PECO under the program. Assessment of free-rider and free-driver effects, if deemed appropriate, may be conducted using survey data in conjunction with established EM&V methodologies and procedures.
Program participants, participating installation contractors, and CSP staff will be interviewed for the process evaluation. These interviews will focus on the program design, enrollment, and participation completion process. In addition to obtaining information on facility characteristics, the participant survey will ask questions about the effectiveness of program promotional activities, participant and occupant satisfaction with the facility, and whether the occupants have encountered any problems with their new equipment.
Process Evaluation Methodology
During the first year, the process evaluation will focus on program implementation, administration, and delivery.
Administrative Requirements
PECO will administer the PECO Smart Construction Incentives program through a CSP implementation contractor. PECO’s role will be to ensure that:
» The CSP performs all the activities associated with delivery of all components of the program » PECO’s educational and program messages are delivered accurately and clearly to ensure the
effectiveness of program delivery and maximize builder and customer satisfaction with the program
The program is expected to operate with the following PECO/Contract staffing mix:
PECO Smart Construction Incentives Program—Proposed Staffing Staff FTE PECO Program Management 0.7
External staffing levels will be provided upon the completion of the CSP selection process.
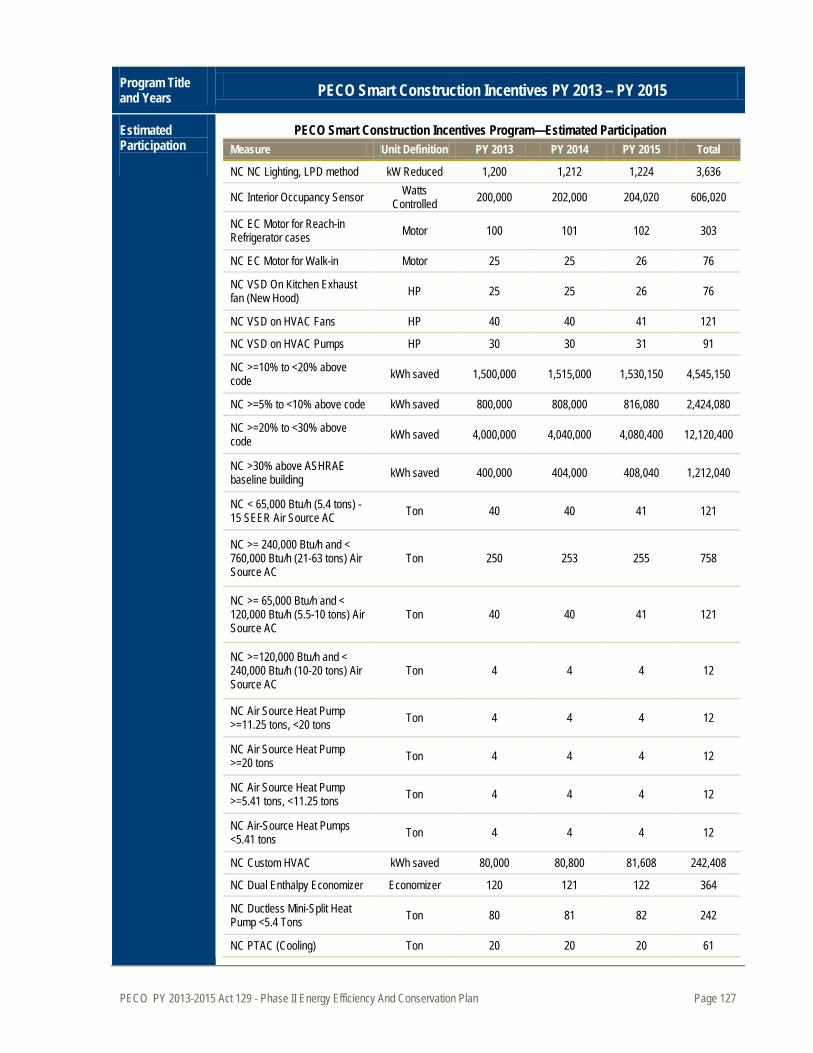
PECO PY 2013-2015 Act 129 - Phase II Energy Efficiency And Conservation Plan Page 127
Program Title and Years PECO Smart Construction Incentives PY 2013 – PY 2015
Estimated Participation
PECO Smart Construction Incentives Program—Estimated Participation Measure Unit Definition PY 2013 PY 2014 PY 2015 Total
NC NC Lighting, LPD method kW Reduced 1,200 1,212 1,224 3,636
NC Interior Occupancy Sensor Watts Controlled 200,000 202,000 204,020 606,020
NC EC Motor for Reach-in Refrigerator cases Motor 100 101 102 303
NC EC Motor for Walk-in Motor 25 25 26 76
NC VSD On Kitchen Exhaust fan (New Hood) HP 25 25 26 76
NC VSD on HVAC Fans HP 40 40 41 121
NC VSD on HVAC Pumps HP 30 30 31 91
NC >=10% to <20% above code kWh saved 1,500,000 1,515,000 1,530,150 4,545,150
NC >=5% to <10% above code kWh saved 800,000 808,000 816,080 2,424,080
NC >=20% to <30% above code kWh saved 4,000,000 4,040,000 4,080,400 12,120,400
NC >30% above ASHRAE baseline building kWh saved 400,000 404,000 408,040 1,212,040
NC < 65,000 Btu/h (5.4 tons) - 15 SEER Air Source AC Ton 40 40 41 121
NC >= 240,000 Btu/h and < 760,000 Btu/h (21-63 tons) Air Source AC
Ton 250 253 255 758
NC >= 65,000 Btu/h and < 120,000 Btu/h (5.5-10 tons) Air Source AC
Ton 40 40 41 121
NC >=120,000 Btu/h and < 240,000 Btu/h (10-20 tons) Air Source AC
Ton 4 4 4 12
NC Air Source Heat Pump >=11.25 tons, <20 tons Ton 4 4 4 12
NC Air Source Heat Pump >=20 tons Ton 4 4 4 12
NC Air Source Heat Pump >=5.41 tons, <11.25 tons Ton 4 4 4 12
NC Air-Source Heat Pumps <5.41 tons Ton 4 4 4 12
NC Custom HVAC kWh saved 80,000 80,800 81,608 242,408
NC Dual Enthalpy Economizer Economizer 120 121 122 364
NC Ductless Mini-Split Heat Pump <5.4 Tons Ton 80 81 82 242
NC PTAC (Cooling) Ton 20 20 20 61
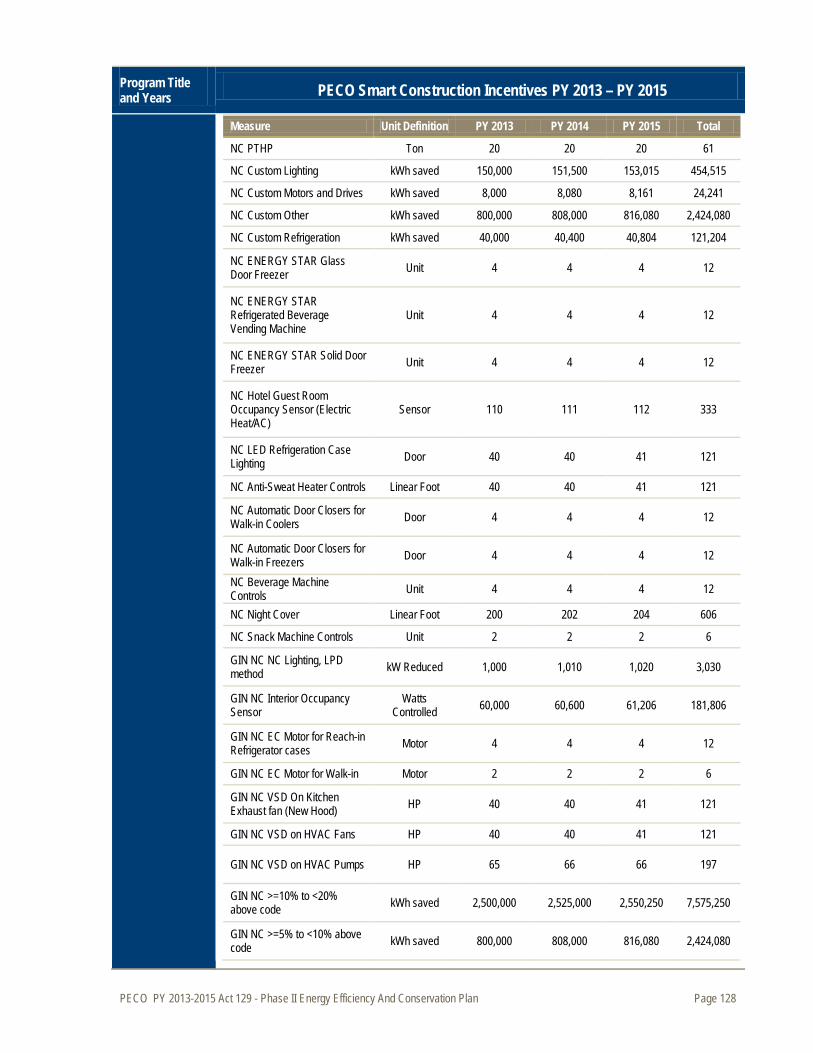
PECO PY 2013-2015 Act 129 - Phase II Energy Efficiency And Conservation Plan Page 128
Program Title and Years PECO Smart Construction Incentives PY 2013 – PY 2015
Measure Unit Definition PY 2013 PY 2014 PY 2015 Total
NC PTHP Ton 20 20 20 61
NC Custom Lighting kWh saved 150,000 151,500 153,015 454,515
NC Custom Motors and Drives kWh saved 8,000 8,080 8,161 24,241
NC Custom Other kWh saved 800,000 808,000 816,080 2,424,080
NC Custom Refrigeration kWh saved 40,000 40,400 40,804 121,204
NC ENERGY STAR Glass Door Freezer Unit 4 4 4 12
NC ENERGY STAR Refrigerated Beverage Vending Machine
Unit 4 4 4 12
NC ENERGY STAR Solid Door Freezer Unit 4 4 4 12
NC Hotel Guest Room Occupancy Sensor (Electric Heat/AC)
Sensor 110 111 112 333
NC LED Refrigeration Case Lighting Door 40 40 41 121
NC Anti-Sweat Heater Controls Linear Foot 40 40 41 121
NC Automatic Door Closers for Walk-in Coolers Door 4 4 4 12
NC Automatic Door Closers for Walk-in Freezers Door 4 4 4 12
NC Beverage Machine Controls Unit 4 4 4 12
NC Night Cover Linear Foot 200 202 204 606
NC Snack Machine Controls Unit 2 2 2 6
GIN NC NC Lighting, LPD method kW Reduced 1,000 1,010 1,020 3,030
GIN NC Interior Occupancy Sensor
Watts Controlled 60,000 60,600 61,206 181,806
GIN NC EC Motor for Reach-in Refrigerator cases Motor 4 4 4 12
GIN NC EC Motor for Walk-in Motor 2 2 2 6
GIN NC VSD On Kitchen Exhaust fan (New Hood) HP 40 40 41 121
GIN NC VSD on HVAC Fans HP 40 40 41 121
GIN NC VSD on HVAC Pumps HP 65 66 66 197
GIN NC >=10% to <20% above code kWh saved 2,500,000 2,525,000 2,550,250 7,575,250
GIN NC >=5% to <10% above code kWh saved 800,000 808,000 816,080 2,424,080

PECO PY 2013-2015 Act 129 - Phase II Energy Efficiency And Conservation Plan Page 129
Program Title and Years PECO Smart Construction Incentives PY 2013 – PY 2015
Measure Unit Definition PY 2013 PY 2014 PY 2015 Total
GIN NC >=20% to <30% above code kWh saved 3,000,000 3,030,000 3,060,300 9,090,300
GIN NC >30% above ASHRAE baseline building kWh saved 400,000 404,000 408,040 1,212,040
GIN NC < 65,000 Btu/h (5.4 tons) - 15 SEER Air Source AC Ton 20 20 20 61
GIN NC >= 240,000 Btu/h and < 760,000 Btu/h (21-63 tons) Air Source AC
Ton 35 35 36 106
GIN NC >= 65,000 Btu/h and < 120,000 Btu/h (5.5-10 tons) Air Source AC
Ton 4 4 4 12
GIN NC >=120,000 Btu/h and < 240,000 Btu/h (10-20 tons) Air Source AC
Ton 1 1 1 3
GIN NC Custom HVAC kWh saved 18,000 18,180 18,362 54,542
GIN NC Dual Enthalpy Economizer Economizer 10 10 10 30
GIN NC Ductless Mini-Split Heat Pump <5.4 Tons Ton 4 4 4 12
GIN NC PTAC (Cooling) Ton 20 20 20 61
GIN NC PTHP Ton 2 2 2 6
GIN NC Custom Lighting kWh saved 120,000 121,200 122,412 363,612
GIN NC Custom Motors and Drives kWh saved 2,500 2,525 2,550 7,575
GIN NC Custom Other kWh saved 80,000 80,800 81,608 242,408
GIN NC Custom Refrigeration kWh saved 600 606 612 1,818
GIN NC ENERGY STAR Glass Door Freezer Unit 2 2 2 6
GIN NC ENERGY STAR Refrigerated Beverage Vending Machine
Unit 2 2 2 6
GIN NC ENERGY STAR Solid Door Freezer Unit 2 2 2 6
GIN NC LED Refrigeration Case Lighting Door 2 2 2 6
GIN NC Anti-Sweat Heater Controls Linear Foot 8 8 8 24
GIN NC Automatic Door Closers for Walk-in Coolers Door 2 2 2 6
GIN NC Automatic Door Closers for Walk-in Freezers Door 2 2 2 6

PECO PY 2013-2015 Act 129 - Phase II Energy Efficiency And Conservation Plan Page 130
Program Title and Years PECO Smart Construction Incentives PY 2013 – PY 2015
Measure Unit Definition PY 2013 PY 2014 PY 2015 Total
GIN NC Beverage Machine Controls Unit 2 2 2 6
GIN NC Night Cover Linear Foot 10 10 10 30
GIN NC Snack Machine Controls Unit 2 2 2 6
NC Water-Source Heat Pump < 1.42 tons Ton 0 0 0 0
NC Water-Source Heat Pump >= 1.42 and <5.41 tons Ton 0 0 0 0
GIN NC Water-Source Heat Pump < 1.42 tons Ton 0 0 0 0
GIN NC Water-Source Heat Pump < 1.42 tons Ton 0 0 0 0
*VSD on Kitchen Fan Hood measure is a comprehensive system which includes a variable speed drive, electronic controls, and sensors to vary the exhaust rate based on demand. The sensors monitor heat, vapor, and smoke to automatically adjust the fan speed.
Estimated Program Budget and % of Sector
PECO Smart Construction Incentives Program—Proposed Budget PECO Smart Construction Incentives PY 2013 PY 2014 PY 2015 Total
Program Budget as a % of Sector
Program Budget $4,024,617 $4,094,103 $4,165,161 $12,283,882 11%
Anticipated costs to Participating customers
PECO Smart Construction Incentives Program—Participation Costs PECO Smart Construction Incentives PY 2013 PY 2014 PY 2015 Total Anticipated costs to Participating customers $12,042,648 $12,163,075 $12,284,706 $36,490,429
Projected Energy Savings and Demand Reduction
The savings estimates were developed using the current standard calculation methodologies (e.g., Pennsylvania’s Technical Resource Manual, DEER, and DOE). These values were applied to the estimated number of measures incentivized under the program each year.
PECO Smart Construction Incentives Program Annual Gross Energy and Peak Demand Savings Estimates
PECO Smart Construction Incentives PY 2013 PY 2014 PY 2015 MWh Savings 26,029 26,290 26,552 Peak MW Reduction 6.2 6.3 6.3
Energy savings are “at meter”; demand savings are “at generator”.
Cost-Effectiveness
PECO Smart Construction Incentives
Dollars (Millions)
TRC Discounted Lifetime Benefits
Discounted Lifetime Costs
Net Benefits
$41,447,703 $26,390,210 $15,057,493 1.6
PECO PY 2013-2015 Act 129 - Phase II Energy Efficiency And Conservation Plan Page 131
3.2.2.5 EE Program 12—PECO Smart Equipment Incentives (GINP)
Program Title and Years
PECO Smart Equipment Incentives (GINP) PY 2013 – PY 2015
Objectives
The PECO Smart Equipment Incentives (GINP) program has the following objectives: » Substantially improve the energy efficiency of government and public facilities. » Facilitate the monitoring of energy efficiency projects toward the goal. » Capture opportunities to reduce consumption by street lighting and traffic signal lights. » Enable eligible customers to identify and implement cost effective energy saving opportunities.
This program provides most of the same services offered to commercial customers in the Smart Equipment Incentives Program for non-GINP customers. GINP customers may also be served through the Smart Business Solutions, Multi-Family Solutions, Smart Construction, and Smart On-Site programs. Incentives are increased over the non-GINP SEI incentives to provide further financial assistance to the GINP market. Additionally, the program provides assistance with obtaining facility audits and prescriptive incentives for LED traffic signal lights.
Target Market The target market for the PECO Smart Equipment Incentives (GINP) program is all public facilities, including but not limited to federal, state, and municipal buildings, and public schools, hospitals and other non-profits.
Program Description
The PECO Smart Equipment Incentives (GINP) program provides financial incentives and technical assistance to achieve significant electricity savings in public sector facilities and for non-profit organizations. The program offers similar financial incentives to reduce energy use in public sector facilities as in other nonresidential facilities, but also provides assistance in identifying key improvement opportunities and addressing the special Planning and purchasing protocols of public and non-profit agencies.
Implementation Strategy
The program is designed to make it as easy as possible for Government, Institutional, Non-Profit Facility customers and their contractors to obtain incentives for prescriptive measures, while also accommodating the diversity of energy-savings opportunities and varying complexities of projects likely in this sector with custom measure incentives. PECO will administer the PECO Smart Equipment Incentives (GINP) program through a CSP implementation contractor.
Effective implementation of the program required effective coordination of several delivery channels. This includes ensuring that qualifying products are available, distributing information about the products and the program to the targeted GINP customers, promoting the program adequately, and educating those responsible for making product selection and purchasing decisions. This program will engage the following channels for delivery of these key aspects the program:
Channels for Program Delivery
» Product Supply o Equipment suppliers—Vendors are influential in equipment selection in commercial and
industrial facilities. They can be and should be engaged to recommend incentive-eligible models of equipment for retrofit and replacement projects. As appropriate, the incentives for equipment purchased under the program can be split or directed to these vendors.
o Architects and engineers o Other trade allies—Installation and maintenance contractors can provide services
associated with some of the qualifying measures. Again, as appropriate, incentives offered on qualifying measures can be directed to or split with these providers to encourage them to promote program participation.
» Program and Product Information Distribution o CSP—The implementation CSP will develop and distribute information about the
qualifying products and participation assistance by establishing and leveraging existing
PECO PY 2013-2015 Act 129 - Phase II Energy Efficiency And Conservation Plan Page 132
Program Title and Years
PECO Smart Equipment Incentives (GINP) PY 2013 – PY 2015
relationships with the product and service suppliers. o Trade allies & affinity groups-As both deliverers of program products and potential
participants in the program, all vendors of the qualifying equipment and service measures should be engaged to receive and also provide to their public sector clients information about the program measure benefits, how the program works, and assistance with the incentive process.
o Utility staff-While PECO will engage a CSP to implement the program, the staff has ongoing contact with all key account customers. The staff will provide information about the program benefits, measures, and process.
» Program Promotion o CSP—A key responsibility of the implementation CSP is outreach and effective promotion
of the program to the target market. o Energy Service Performance Contracting (ESPC)—The ESPC program in Pennsylvania
provides energy services to state facilities, providing an avenue to promote the program through these existing relationships.
o Trade allies & affinity groups—All vendors of the qualifying equipment and service measures should be engaged to make their clients aware of the program and encourage their participation by recommending high-efficiency equipment models and diagnostic services.
o Public agency news publications—Public relations is a key aspect of this sector’s promotion. By leveraging available publications and showcasing program availability and successes, the program will influence a range of potential participants.
» Education: Opportunities to educate both the trade allies, who themselves are both potential participants and delivery channels, and public agency facility managers include: o Trainings and workshops o Agency and industry training sessions (piggybacking program education on these
meetings) o Industry and technology experts who meet individually with facility decision makers and
provide auditor training o Facility audit reports
The implementation CSP will have full responsibility for delivery of all aspects of the program. Responsibilities fall into several activity areas:
Overview of Roles and Activities
» Relationship management: establishing relationships with equipment and maintenance suppliers operating in the GINP space to make incentive-eligible equipment and services available and to promote their participation in the program
» Auditor/contractor training: this can be provided directly or through arrangements with nationally recognized providers who conduct training and certification sessions in locations on request; CSP will maintain directory of qualified auditors
» Program marketing: including development and distribution of program materials and assistance with direct mail or other advertising in collaboration with other PECO contractors
» Participant recruitment and assistance: including scheduling audits with qualified auditors, assisting customers and contractors with incentive application submittal, assisting customers and contractors with the development of estimates and documentation for approval of custom measure projects, and providing information on applicable third party funds and/or tax credits
» Incentive processing: fulfillment house to receive, review and verify applications; and pay incentives
» Program performance tracking and improvement: including tracking of all program activities, incentive submittals and payments, and opportunities to improve the program

PECO PY 2013-2015 Act 129 - Phase II Energy Efficiency And Conservation Plan Page 133
Program Title and Years
PECO Smart Equipment Incentives (GINP) PY 2013 – PY 2015
» Reporting: including reporting of program activities to meet regulatory and internal requirements, in particular progress toward program goals
The program will provide education to ensure that program channels and participants have the understanding and tools to make the program successful. The program will leverage educational opportunities provided by other groups, where possible. These include:
Education Overview
» PECO will offer a series of municipal forums designed to educate and inform municipalities about programs and incentives. These forums will include technical information about opportunities for GINP organizations, case studies of successful projects, and strategies for funding energy efficiency initiatives specific to governmental and non-profit organizations.
» Training sessions for trade allies and other product supply and program and product distribution providers will be held to provide technical information regarding the applicability and benefits of the measures promoted under the program, information about the program requirements, process and , incentives, and strategies for overcoming barriers related to government agency procurement practices.
» The audit component of the program will provide one-on-one customer education about energy efficiency benefits in general and the recommended measure benefits more specifically, Pennsylvania’s commitment to reducing energy use in public facilities, and the availability of resources designed to enable energy efficiency improvement projects.
» Energy auditors who can conduct building assessments and identify energy efficiency opportunities in GINP facilities is an important element of the program’s success. Several organizations exist that provide training and certification programs to ensure that auditors are well-versed in building science principles and whole-building concepts for energy performance.
There are a number of resources that this program may be able to leverage to help in its successful operation. These include:
Applicable Collaborative Resources
» The Reinvestment Fund/Sustainable Development Fund (SDF) Financing—provides financing to companies and also has a lease-financing product for large nonprofit institutions (schools and hospitals) for energy conservation improvements.
» Energy Service Performance Contracting (ESPC)—Pennsylvania has an ESPC program for state facilities. This infrastructure can be leveraged to extend the reach of the PECO program to an even greater number of government facilities.13
Program Issues, Risks, and Risk Management Strategies
There are several challenges inherent in delivering energy efficiency services to government, public, and non-profit customers. Key challenges are identified below, along with how the PECO Smart Equipment Incentives (GINP) program can address them.
» Governmental agencies typically have complex procurement practices with requirements that exceed those of private businesses. For implementation of the program to be successful the CSP must have a solid understanding of these practices and tailor the GINP outreach, project scheduling, and incentive fulfillment process, and trade ally involvement strategies need to accommodate these practices.
» Identifying whether a customer has non-profit status, and is therefore eligible to participate in this program may not be readily discernible. This is particularly true of hospitals, which sometimes change status from public to private or vice-versa. The program addresses this potential problem by offering the same incentives on applicable measures in both programs and clearly defining eligibility criteria for audit incentives. This will avoid possible dissatisfaction among customers whose status changes during their participation in the program.
13 Potential for Energy Efficiency, Demand Response, and Onsite Solar Energy in Pennsylvania, prepared by ACEEE, April 2009.
PECO PY 2013-2015 Act 129 - Phase II Energy Efficiency And Conservation Plan Page 134
Program Title and Years
PECO Smart Equipment Incentives (GINP) PY 2013 – PY 2015
Ramp Up Strategy
This program is a continuing program, and a full ramp up strategy is not anticipated. However, the program implementation staff will be trained on any revised program guidelines and eligible technologies.
Marketing Strategy
The unique nature of the supply chain for energy efficiency products and services provides the opportunity to coordinate program marketing along two distinct channels. Though PECO’s GINP customers are the ultimate target market for the program, trade allies sell and install the ultimate efficiency measures and have significant influence with customers in their decision-making process. Therefore, the two channels will be focused on the end use customer and trade allies. The marketing activities that will be targeted toward each channel are described below:
Direct Marketing to GINP Customers: » Print: opportunities for printed materials include bill inserts and messages, direct mail to
targeted customer groups, and program brochures and other literature such as case studies and resource listings.
» Electronic: The PECO Web site will include detailed program information on eligibility, incentive levels, and other requirements. E-mail updates announcements will be sent to assigned accounts.
» Account Executives: Larger C&I customers have an assigned account representatives who maintains an ongoing, one-on-one relationship with key customer contacts. The account executives will be leveraged to present the program to each of their assigned accounts as well as identify opportunities throughout the program cycle.
» Industry Groups: The program will seek out opportunities to present the program to industry groups whose membership falls within the targeted population of C&I customers. Good candidates are the local chapter of the Building Owners and Managers Association (BOMA), Chambers of Commerce, and the Association of Facilities Engineering.
Marketing to Trade Allies: » Industry Associations: The program will develop relationships with industry association who
represent trades working along the energy efficiency supply chain. These include local chapters of the American Society of Heating, Refrigeration, and Air-Conditioning Engineers (ASHRAE) and the National Association of Energy Service Companies (NAESCO).
» Workshops and Trainings: A series of workshops will be held to educate trade allies on the availably of incentives, program requirements, and strategies for incorporating energy efficiency into their sales process.
Eligible Measures and Incentives
Both prescriptive and custom measures are eligible for incentives under this program. Prescriptive measures offered and associated incentives will be defined and listed for customers. Custom projects, consisting of energy-saving measures not listed or involving multiple systems are also eligible. The proposed measures are included in the table below.
Measures
Incentive levels provided to customers/contractors for installation of incentive-eligible measures typically are a percentage of the incremental measure costs. That is, the additional cost of a high-efficiency measure beyond a standard-efficiency alternative.
Incentives
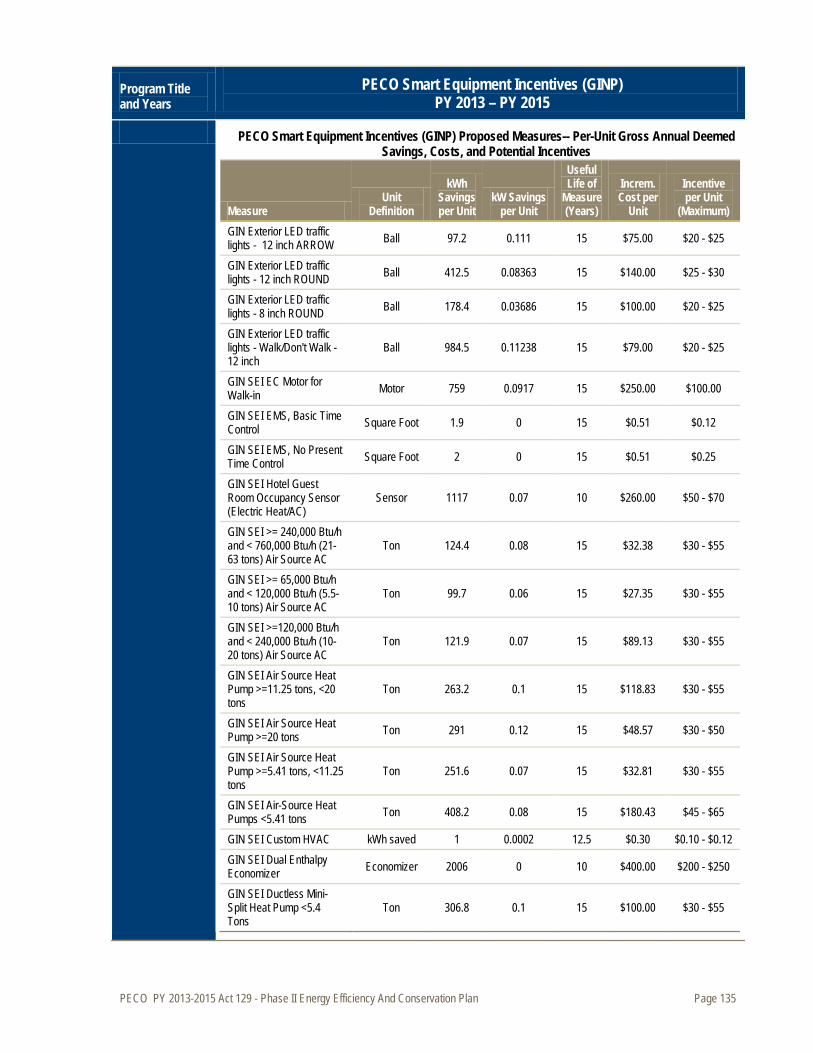
PECO PY 2013-2015 Act 129 - Phase II Energy Efficiency And Conservation Plan Page 135
Program Title and Years
PECO Smart Equipment Incentives (GINP) PY 2013 – PY 2015
PECO Smart Equipment Incentives (GINP) Proposed Measures-- Per-Unit Gross Annual Deemed Savings, Costs, and Potential Incentives
Measure Unit
Definition
kWh Savings per Unit
kW Savings per Unit
Useful Life of
Measure (Years)
Increm. Cost per
Unit
Incentive per Unit
(Maximum) GIN Exterior LED traffic lights - 12 inch ARROW Ball 97.2 0.111 15 $75.00 $20 - $25
GIN Exterior LED traffic lights - 12 inch ROUND Ball 412.5 0.08363 15 $140.00 $25 - $30
GIN Exterior LED traffic lights - 8 inch ROUND Ball 178.4 0.03686 15 $100.00 $20 - $25
GIN Exterior LED traffic lights - Walk/Don't Walk - 12 inch
Ball 984.5 0.11238 15 $79.00 $20 - $25
GIN SEI EC Motor for Walk-in Motor 759 0.0917 15 $250.00 $100.00
GIN SEI EMS, Basic Time Control Square Foot 1.9 0 15 $0.51 $0.12
GIN SEI EMS, No Present Time Control Square Foot 2 0 15 $0.51 $0.25
GIN SEI Hotel Guest Room Occupancy Sensor (Electric Heat/AC)
Sensor 1117 0.07 10 $260.00 $50 - $70
GIN SEI >= 240,000 Btu/h and < 760,000 Btu/h (21-63 tons) Air Source AC
Ton 124.4 0.08 15 $32.38 $30 - $55
GIN SEI >= 65,000 Btu/h and < 120,000 Btu/h (5.5-10 tons) Air Source AC
Ton 99.7 0.06 15 $27.35 $30 - $55
GIN SEI >=120,000 Btu/h and < 240,000 Btu/h (10-20 tons) Air Source AC
Ton 121.9 0.07 15 $89.13 $30 - $55
GIN SEI Air Source Heat Pump >=11.25 tons, <20 tons
Ton 263.2 0.1 15 $118.83 $30 - $55
GIN SEI Air Source Heat Pump >=20 tons Ton 291 0.12 15 $48.57 $30 - $50
GIN SEI Air Source Heat Pump >=5.41 tons, <11.25 tons
Ton 251.6 0.07 15 $32.81 $30 - $55
GIN SEI Air-Source Heat Pumps <5.41 tons Ton 408.2 0.08 15 $180.43 $45 - $65
GIN SEI Custom HVAC kWh saved 1 0.0002 12.5 $0.30 $0.10 - $0.12 GIN SEI Dual Enthalpy Economizer Economizer 2006 0 10 $400.00 $200 - $250
GIN SEI Ductless Mini-Split Heat Pump <5.4 Tons
Ton 306.8 0.1 15 $100.00 $30 - $55
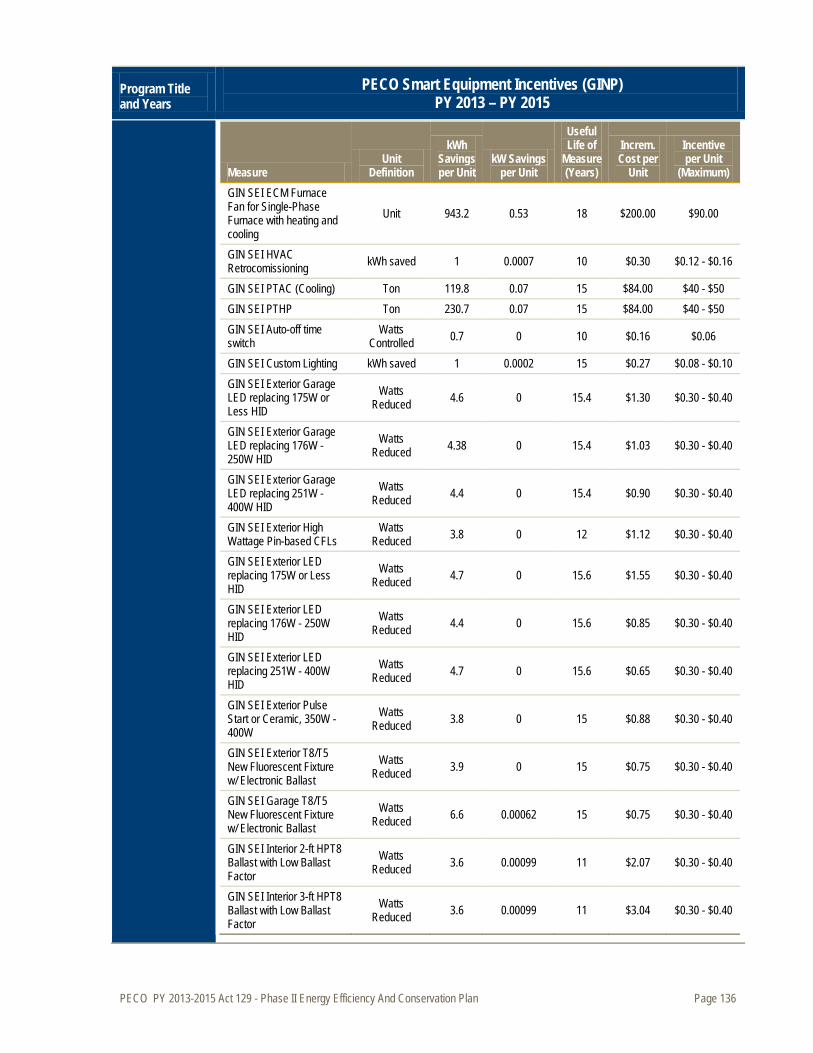
PECO PY 2013-2015 Act 129 - Phase II Energy Efficiency And Conservation Plan Page 136
Program Title and Years
PECO Smart Equipment Incentives (GINP) PY 2013 – PY 2015
Measure Unit
Definition
kWh Savings per Unit
kW Savings per Unit
Useful Life of
Measure (Years)
Increm. Cost per
Unit
Incentive per Unit
(Maximum) GIN SEI ECM Furnace Fan for Single-Phase Furnace with heating and cooling
Unit 943.2 0.53 18 $200.00 $90.00
GIN SEI HVAC Retrocomissioning kWh saved 1 0.0007 10 $0.30 $0.12 - $0.16
GIN SEI PTAC (Cooling) Ton 119.8 0.07 15 $84.00 $40 - $50 GIN SEI PTHP Ton 230.7 0.07 15 $84.00 $40 - $50 GIN SEI Auto-off time switch
Watts Controlled 0.7 0 10 $0.16 $0.06
GIN SEI Custom Lighting kWh saved 1 0.0002 15 $0.27 $0.08 - $0.10 GIN SEI Exterior Garage LED replacing 175W or Less HID
Watts Reduced 4.6 0 15.4 $1.30 $0.30 - $0.40
GIN SEI Exterior Garage LED replacing 176W - 250W HID
Watts Reduced 4.38 0 15.4 $1.03 $0.30 - $0.40
GIN SEI Exterior Garage LED replacing 251W - 400W HID
Watts Reduced 4.4 0 15.4 $0.90 $0.30 - $0.40
GIN SEI Exterior High Wattage Pin-based CFLs
Watts Reduced 3.8 0 12 $1.12 $0.30 - $0.40
GIN SEI Exterior LED replacing 175W or Less HID
Watts Reduced 4.7 0 15.6 $1.55 $0.30 - $0.40
GIN SEI Exterior LED replacing 176W - 250W HID
Watts Reduced 4.4 0 15.6 $0.85 $0.30 - $0.40
GIN SEI Exterior LED replacing 251W - 400W HID
Watts Reduced 4.7 0 15.6 $0.65 $0.30 - $0.40
GIN SEI Exterior Pulse Start or Ceramic, 350W - 400W
Watts Reduced 3.8 0 15 $0.88 $0.30 - $0.40
GIN SEI Exterior T8/T5 New Fluorescent Fixture w/ Electronic Ballast
Watts Reduced 3.9 0 15 $0.75 $0.30 - $0.40
GIN SEI Garage T8/T5 New Fluorescent Fixture w/ Electronic Ballast
Watts Reduced 6.6 0.00062 15 $0.75 $0.30 - $0.40
GIN SEI Interior 2-ft HPT8 Ballast with Low Ballast Factor
Watts Reduced 3.6 0.00099 11 $2.07 $0.30 - $0.40
GIN SEI Interior 3-ft HPT8 Ballast with Low Ballast Factor
Watts Reduced 3.6 0.00099 11 $3.04 $0.30 - $0.40
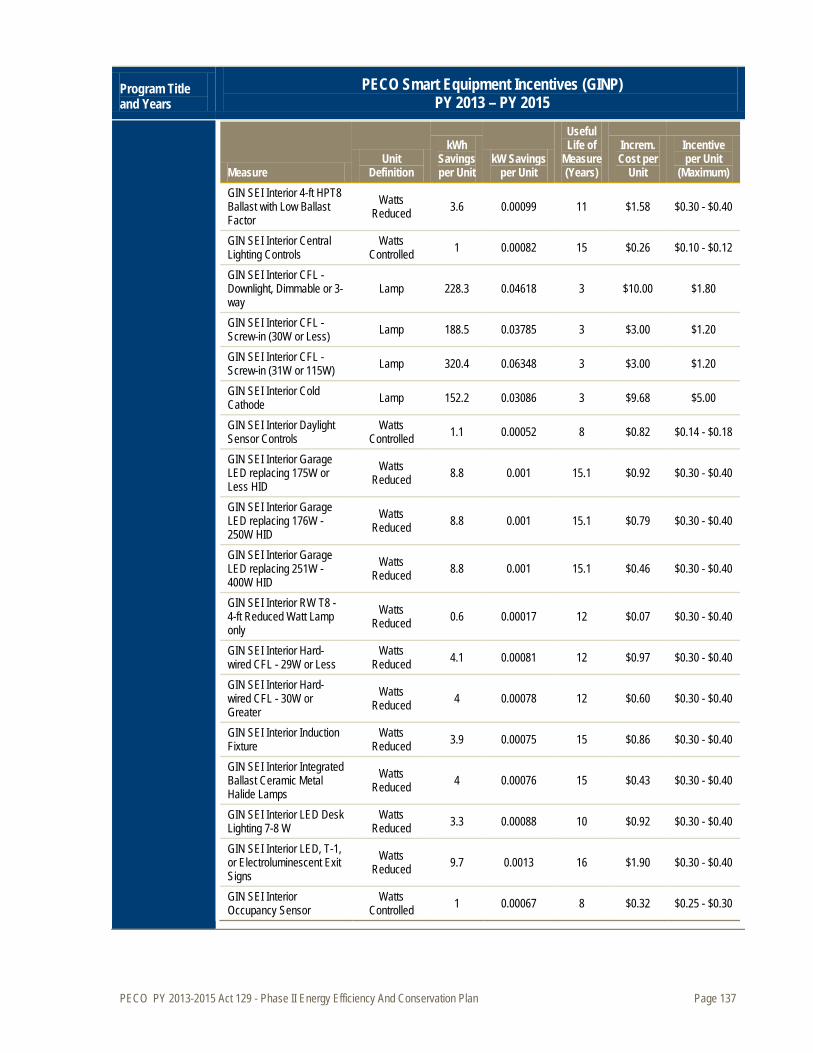
PECO PY 2013-2015 Act 129 - Phase II Energy Efficiency And Conservation Plan Page 137
Program Title and Years
PECO Smart Equipment Incentives (GINP) PY 2013 – PY 2015
Measure Unit
Definition
kWh Savings per Unit
kW Savings per Unit
Useful Life of
Measure (Years)
Increm. Cost per
Unit
Incentive per Unit
(Maximum) GIN SEI Interior 4-ft HPT8 Ballast with Low Ballast Factor
Watts Reduced 3.6 0.00099 11 $1.58 $0.30 - $0.40
GIN SEI Interior Central Lighting Controls
Watts Controlled 1 0.00082 15 $0.26 $0.10 - $0.12
GIN SEI Interior CFL - Downlight, Dimmable or 3-way
Lamp 228.3 0.04618 3 $10.00 $1.80
GIN SEI Interior CFL - Screw-in (30W or Less) Lamp 188.5 0.03785 3 $3.00 $1.20
GIN SEI Interior CFL - Screw-in (31W or 115W) Lamp 320.4 0.06348 3 $3.00 $1.20
GIN SEI Interior Cold Cathode Lamp 152.2 0.03086 3 $9.68 $5.00
GIN SEI Interior Daylight Sensor Controls
Watts Controlled 1.1 0.00052 8 $0.82 $0.14 - $0.18
GIN SEI Interior Garage LED replacing 175W or Less HID
Watts Reduced 8.8 0.001 15.1 $0.92 $0.30 - $0.40
GIN SEI Interior Garage LED replacing 176W - 250W HID
Watts Reduced 8.8 0.001 15.1 $0.79 $0.30 - $0.40
GIN SEI Interior Garage LED replacing 251W - 400W HID
Watts Reduced 8.8 0.001 15.1 $0.46 $0.30 - $0.40
GIN SEI Interior RW T8 - 4-ft Reduced Watt Lamp only
Watts Reduced 0.6 0.00017 12 $0.07 $0.30 - $0.40
GIN SEI Interior Hard-wired CFL - 29W or Less
Watts Reduced 4.1 0.00081 12 $0.97 $0.30 - $0.40
GIN SEI Interior Hard-wired CFL - 30W or Greater
Watts Reduced 4 0.00078 12 $0.60 $0.30 - $0.40
GIN SEI Interior Induction Fixture
Watts Reduced 3.9 0.00075 15 $0.86 $0.30 - $0.40
GIN SEI Interior Integrated Ballast Ceramic Metal Halide Lamps
Watts Reduced 4 0.00076 15 $0.43 $0.30 - $0.40
GIN SEI Interior LED Desk Lighting 7-8 W
Watts Reduced 3.3 0.00088 10 $0.92 $0.30 - $0.40
GIN SEI Interior LED, T-1, or Electroluminescent Exit Signs
Watts Reduced 9.7 0.0013 16 $1.90 $0.30 - $0.40
GIN SEI Interior Occupancy Sensor
Watts Controlled 1 0.00067 8 $0.32 $0.25 - $0.30

PECO PY 2013-2015 Act 129 - Phase II Energy Efficiency And Conservation Plan Page 138
Program Title and Years
PECO Smart Equipment Incentives (GINP) PY 2013 – PY 2015
Measure Unit
Definition
kWh Savings per Unit
kW Savings per Unit
Useful Life of
Measure (Years)
Increm. Cost per
Unit
Incentive per Unit
(Maximum) GIN SEI Interior Permanent Lamp Removal - 2-ft Lamp
Lamp Removed 163.8 0.03321 12 $25.00 $7.50 - $10
GIN SEI Interior Permanent Lamp Removal - 3-ft Lamp
Lamp Removed 247.6 0.05019 12 $25.70 $7.50 - $10
GIN SEI Interior Permanent Lamp Removal - 4-ft Lamp
Lamp Removed 339.7 0.06777 12 $25.70 $7.50 - $10
GIN SEI Interior Permanent Lamp Removal - 8-ft Lamp
Lamp Removed 500.4 0.09897 12 $25.91 $7.50 - $10
GIN SEI Interior Recessed LED Downlighting >50 W
Watts Reduced 3.8 0.001 10 $0.49 $0.30 - $0.40
GIN SEI Interior Recessed LED Downlighting 21-30 W
Watts Reduced 3.8 0.001 10 $1.35 $0.30 - $0.40
GIN SEI Interior Recessed LED Downlighting 31-50 W
Watts Reduced 3.8 0.001 10 $0.88 $0.30 - $0.40
GIN SEI Interior Recessed LED Downlighting 7-20 W
Watts Reduced 3.8 0.001 10 $2.11 $0.30 - $0.40
GIN SEI Interior T8/T5 New Fluorescent Fixture w/ Electronic Ballast
Watts Reduced 4 0.00075 11 $0.75 $0.30 - $0.40
GIN SEI LED Refrigeration Case Lighting Door 365 0.06814 15 $266.00 $100.00
GIN SEI Centralized Time clock control
Watts Controlled 0.4 0 10 $0.09 $0.03
GIN SEI Custom Motors and Drives kWh saved 1 0.00008 15 $0.20 $0.10 - $0.12
GIN SEI Custom Other kWh saved 1 0.00018 13.45 $0.22 $0.10 - $0.12 GIN SEI Anti-Sweat Heater Controls Linear Foot 519 0.0112 12 $34.00 $30.00
GIN SEI Automatic Door Closers for Walk-in Coolers
Door 1017 0.143 8 $156.82 $85.00
GIN SEI Automatic Door Closers for Walk-in Freezers
Door 2457 0.426 8 $156.82 $120.00
GIN SEI Beverage Machine Controls Unit 1664.6 0 5 $160.00 $120.00
GIN SEI Custom Refrigeration kWh saved 1 0.00007 14 $0.30 $0.10 - $0.12
GIN SEI Door Gaskets Linear Foot 55.8 0.00175 4 $9.61 $2.50
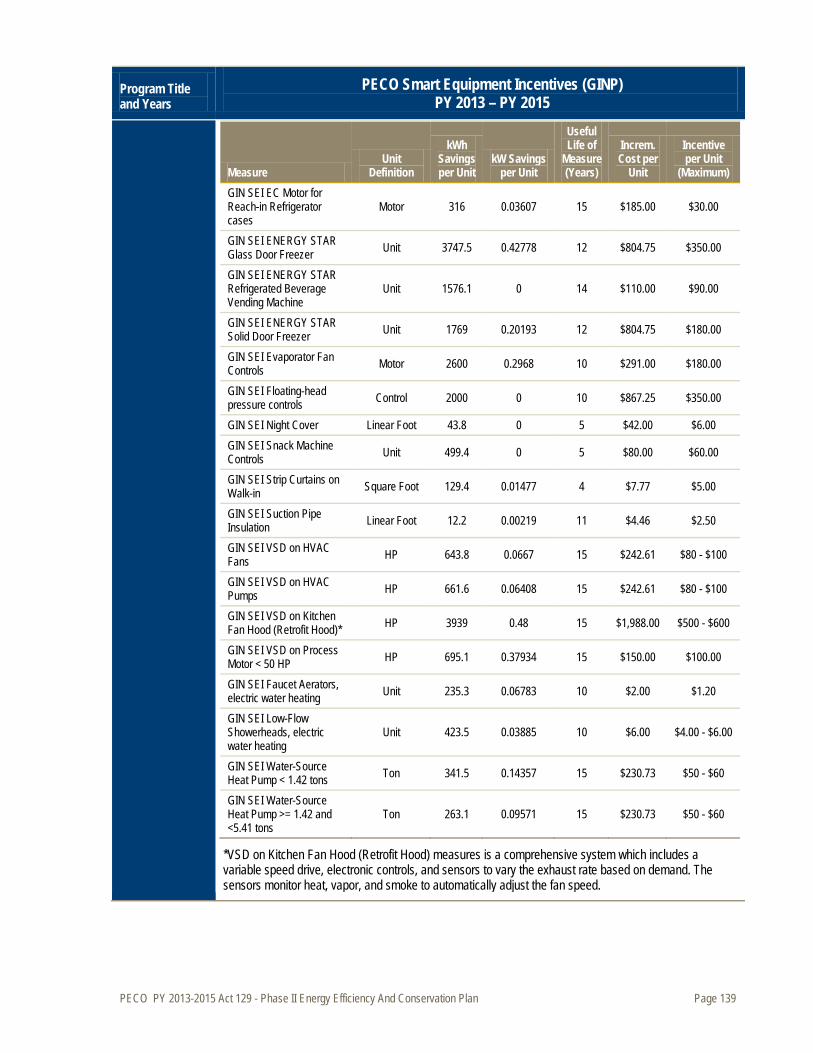
PECO PY 2013-2015 Act 129 - Phase II Energy Efficiency And Conservation Plan Page 139
Program Title and Years
PECO Smart Equipment Incentives (GINP) PY 2013 – PY 2015
Measure Unit
Definition
kWh Savings per Unit
kW Savings per Unit
Useful Life of
Measure (Years)
Increm. Cost per
Unit
Incentive per Unit
(Maximum) GIN SEI EC Motor for Reach-in Refrigerator cases
Motor 316 0.03607 15 $185.00 $30.00
GIN SEI ENERGY STAR Glass Door Freezer Unit 3747.5 0.42778 12 $804.75 $350.00
GIN SEI ENERGY STAR Refrigerated Beverage Vending Machine
Unit 1576.1 0 14 $110.00 $90.00
GIN SEI ENERGY STAR Solid Door Freezer Unit 1769 0.20193 12 $804.75 $180.00
GIN SEI Evaporator Fan Controls Motor 2600 0.2968 10 $291.00 $180.00
GIN SEI Floating-head pressure controls Control 2000 0 10 $867.25 $350.00
GIN SEI Night Cover Linear Foot 43.8 0 5 $42.00 $6.00 GIN SEI Snack Machine Controls Unit 499.4 0 5 $80.00 $60.00
GIN SEI Strip Curtains on Walk-in Square Foot 129.4 0.01477 4 $7.77 $5.00
GIN SEI Suction Pipe Insulation Linear Foot 12.2 0.00219 11 $4.46 $2.50
GIN SEI VSD on HVAC Fans HP 643.8 0.0667 15 $242.61 $80 - $100
GIN SEI VSD on HVAC Pumps HP 661.6 0.06408 15 $242.61 $80 - $100
GIN SEI VSD on Kitchen Fan Hood (Retrofit Hood)* HP 3939 0.48 15 $1,988.00 $500 - $600
GIN SEI VSD on Process Motor < 50 HP HP 695.1 0.37934 15 $150.00 $100.00
GIN SEI Faucet Aerators, electric water heating Unit 235.3 0.06783 10 $2.00 $1.20
GIN SEI Low-Flow Showerheads, electric water heating
Unit 423.5 0.03885 10 $6.00 $4.00 - $6.00
GIN SEI Water-Source Heat Pump < 1.42 tons Ton 341.5 0.14357 15 $230.73 $50 - $60
GIN SEI Water-Source Heat Pump >= 1.42 and <5.41 tons
Ton 263.1 0.09571 15 $230.73 $50 - $60
*VSD on Kitchen Fan Hood (Retrofit Hood) measures is a comprehensive system which includes a variable speed drive, electronic controls, and sensors to vary the exhaust rate based on demand. The sensors monitor heat, vapor, and smoke to automatically adjust the fan speed.
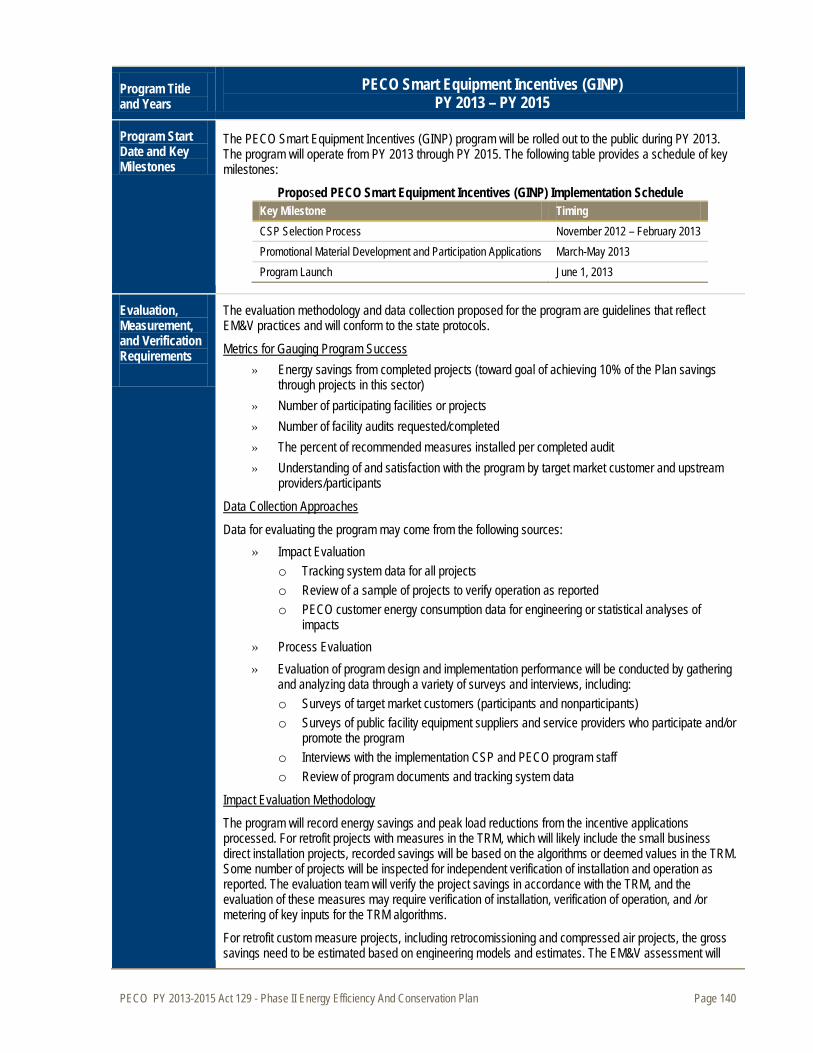
PECO PY 2013-2015 Act 129 - Phase II Energy Efficiency And Conservation Plan Page 140
Program Title and Years
PECO Smart Equipment Incentives (GINP) PY 2013 – PY 2015
Program Start Date and Key Milestones
The PECO Smart Equipment Incentives (GINP) program will be rolled out to the public during PY 2013. The program will operate from PY 2013 through PY 2015. The following table provides a schedule of key milestones:
Proposed PECO Smart Equipment Incentives (GINP) Implementation Schedule Key Milestone Timing CSP Selection Process November 2012 – February 2013 Promotional Material Development and Participation Applications March-May 2013 Program Launch June 1, 2013
Evaluation, Measurement, and Verification Requirements
The evaluation methodology and data collection proposed for the program are guidelines that reflect EM&V practices and will conform to the state protocols.
» Energy savings from completed projects (toward goal of achieving 10% of the Plan savings through projects in this sector)
Metrics for Gauging Program Success
» Number of participating facilities or projects » Number of facility audits requested/completed » The percent of recommended measures installed per completed audit » Understanding of and satisfaction with the program by target market customer and upstream
providers/participants
Data for evaluating the program may come from the following sources:
Data Collection Approaches
» Impact Evaluation o Tracking system data for all projects o Review of a sample of projects to verify operation as reported o PECO customer energy consumption data for engineering or statistical analyses of
impacts » Process Evaluation » Evaluation of program design and implementation performance will be conducted by gathering
and analyzing data through a variety of surveys and interviews, including: o Surveys of target market customers (participants and nonparticipants) o Surveys of public facility equipment suppliers and service providers who participate and/or
promote the program o Interviews with the implementation CSP and PECO program staff o Review of program documents and tracking system data
The program will record energy savings and peak load reductions from the incentive applications processed. For retrofit projects with measures in the TRM, which will likely include the small business direct installation projects, recorded savings will be based on the algorithms or deemed values in the TRM. Some number of projects will be inspected for independent verification of installation and operation as reported. The evaluation team will verify the project savings in accordance with the TRM, and the evaluation of these measures may require verification of installation, verification of operation, and /or metering of key inputs for the TRM algorithms.
Impact Evaluation Methodology
For retrofit custom measure projects, including retrocomissioning and compressed air projects, the gross savings need to be estimated based on engineering models and estimates. The EM&V assessment will

PECO PY 2013-2015 Act 129 - Phase II Energy Efficiency And Conservation Plan Page 141
Program Title and Years
PECO Smart Equipment Incentives (GINP) PY 2013 – PY 2015
require pre/post building simulation modeling, billing analyses and/or metering to verify the project savings. For program impact assessment, this can be accomplished through verification of a sample of projects that account for a large portion of the reported savings and are most representative of projects by the different target market segments.
PECO will credit toward the program only savings from incented measures. This means that any additional purchases that may be induced by the program but not incented—that is, spillover or free-driver effects, are not claimed by PECO under the program. Assessment of free-rider and free-driver effects, if deemed appropriate, may be conducted using customer billing and survey data in conjunction with established EM&V methodologies and procedures.
Evaluation of the program implementation is important to ensure that the program is operating as intended and to provide information that can enable improvements in both the program design and implementation. Process evaluations will be undertaken and conducted throughout the program by the implementation and the EM&V contractor(s) selected by PECO.
Process Evaluation Methodology
Process evaluations will assess customer understanding, attitudes about, and satisfaction with both the program and with PECO’s broader educational activities. The evaluations will make use of survey data collected by the implementation and EM&V contractors. These surveys will include both customers known to have participated in the program and eligible nonparticipants. The diversity of customers in this target market, including large and small government agencies, traffic signal and street light operators, local schools and public colleges, public health facilities, and other non-profit agencies means that survey content and fielding will need to accommodate a wide variety of participation experiences.
Interviews with program service providers, including auditors, will be conducted to assess satisfaction with the program and to identify problems and possible program services/implementation improvements.
The EM&V contractor will also help PECO assess the performance of the program design and delivery of the products and services featured in the program, including effectiveness of the marketing and educational materials, effectiveness of advertising and promotional campaigns and messages, effectiveness of the trade ally involvement, and whether implementation milestones are met adequately and on schedule. These evaluations will use data maintained by the implementation CSP, information provided by PECO, and customer survey data.
Administrative Requirements
PECO will administer the PECO Smart Equipment Incentives (GINP) program through a CSP implementation contractor. It is anticipated the current implementation CSP will be contracted to administer this program. PECO’s role will be to ensure that
» The CSP performs all activities associated with delivery of all components of the program, and » PECO’s educational and program messages are delivered accurately and clearly to ensure the
effectiveness of program delivery and maximize customer satisfaction with the program. The program is expected to operate with the following PECO/Contract staffing mix
PECO Smart Equipment Incentives (GINP)—Proposed Staffing Staff FTE PECO Program Management 1.2
External staffing levels will be provided upon the completion of the CSP selection process.
Estimated Participation
PECO Smart Equipment Incentives (GINP) Program— Estimated Participation
Measure Unit Definition PY 2013 PY 2014 PY 2015 Total
GIN Exterior LED traffic lights - 12 inch ARROW Ball 400 404 408 1,212
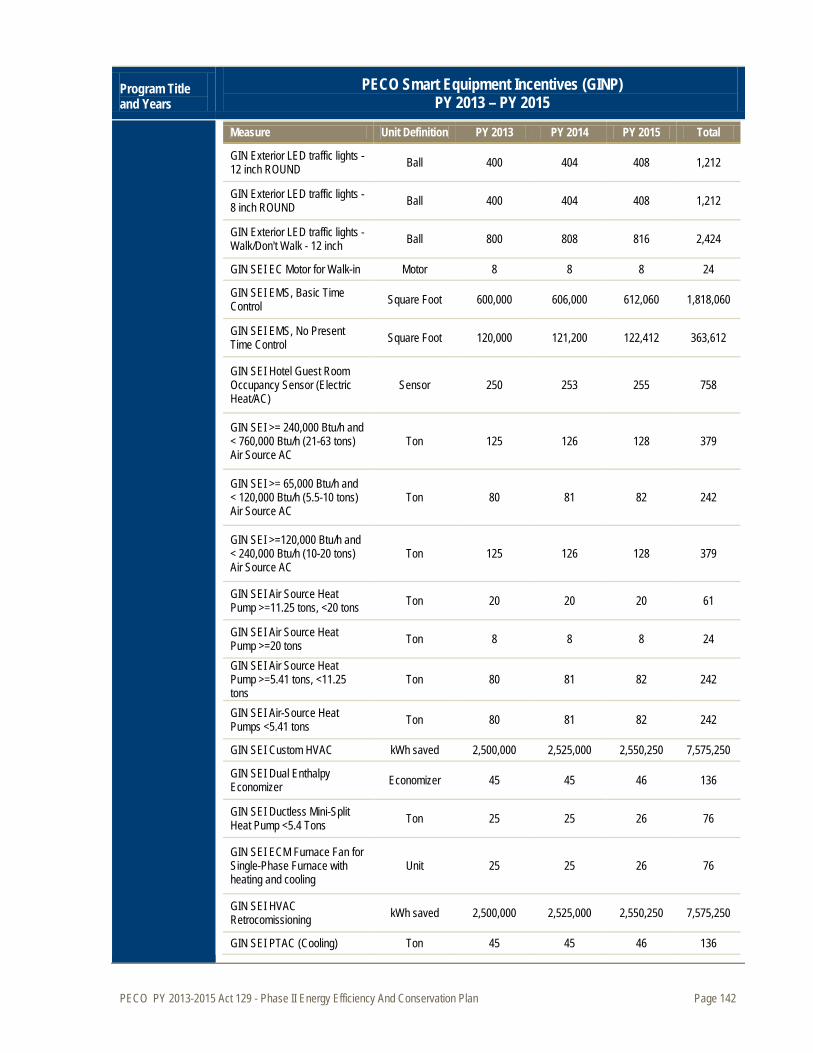
PECO PY 2013-2015 Act 129 - Phase II Energy Efficiency And Conservation Plan Page 142
Program Title and Years
PECO Smart Equipment Incentives (GINP) PY 2013 – PY 2015
Measure Unit Definition PY 2013 PY 2014 PY 2015 Total
GIN Exterior LED traffic lights - 12 inch ROUND Ball 400 404 408 1,212
GIN Exterior LED traffic lights - 8 inch ROUND Ball 400 404 408 1,212
GIN Exterior LED traffic lights - Walk/Don't Walk - 12 inch Ball 800 808 816 2,424
GIN SEI EC Motor for Walk-in Motor 8 8 8 24
GIN SEI EMS, Basic Time Control Square Foot 600,000 606,000 612,060 1,818,060
GIN SEI EMS, No Present Time Control Square Foot 120,000 121,200 122,412 363,612
GIN SEI Hotel Guest Room Occupancy Sensor (Electric Heat/AC)
Sensor 250 253 255 758
GIN SEI >= 240,000 Btu/h and < 760,000 Btu/h (21-63 tons) Air Source AC
Ton 125 126 128 379
GIN SEI >= 65,000 Btu/h and < 120,000 Btu/h (5.5-10 tons) Air Source AC
Ton 80 81 82 242
GIN SEI >=120,000 Btu/h and < 240,000 Btu/h (10-20 tons) Air Source AC
Ton 125 126 128 379
GIN SEI Air Source Heat Pump >=11.25 tons, <20 tons Ton 20 20 20 61
GIN SEI Air Source Heat Pump >=20 tons Ton 8 8 8 24
GIN SEI Air Source Heat Pump >=5.41 tons, <11.25 tons
Ton 80 81 82 242
GIN SEI Air-Source Heat Pumps <5.41 tons Ton 80 81 82 242
GIN SEI Custom HVAC kWh saved 2,500,000 2,525,000 2,550,250 7,575,250
GIN SEI Dual Enthalpy Economizer Economizer 45 45 46 136
GIN SEI Ductless Mini-Split Heat Pump <5.4 Tons Ton 25 25 26 76
GIN SEI ECM Furnace Fan for Single-Phase Furnace with heating and cooling
Unit 25 25 26 76
GIN SEI HVAC Retrocomissioning kWh saved 2,500,000 2,525,000 2,550,250 7,575,250
GIN SEI PTAC (Cooling) Ton 45 45 46 136
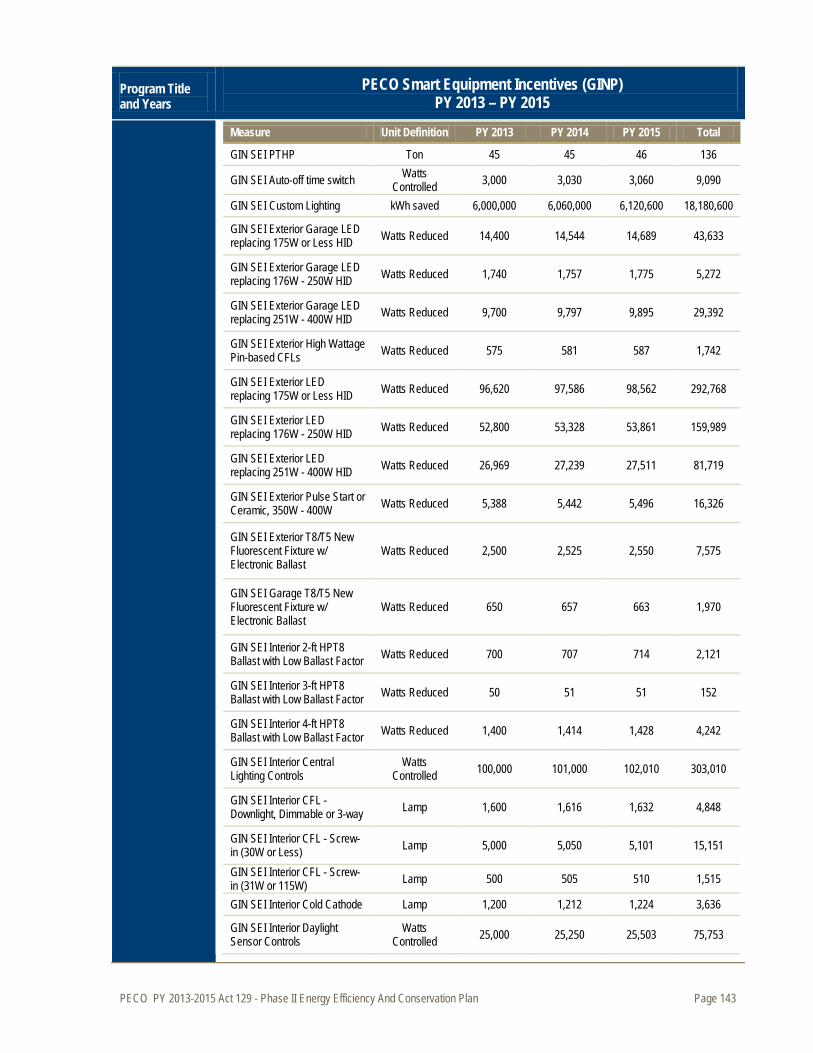
PECO PY 2013-2015 Act 129 - Phase II Energy Efficiency And Conservation Plan Page 143
Program Title and Years
PECO Smart Equipment Incentives (GINP) PY 2013 – PY 2015
Measure Unit Definition PY 2013 PY 2014 PY 2015 Total
GIN SEI PTHP Ton 45 45 46 136
GIN SEI Auto-off time switch Watts Controlled 3,000 3,030 3,060 9,090
GIN SEI Custom Lighting kWh saved 6,000,000 6,060,000 6,120,600 18,180,600
GIN SEI Exterior Garage LED replacing 175W or Less HID Watts Reduced 14,400 14,544 14,689 43,633
GIN SEI Exterior Garage LED replacing 176W - 250W HID Watts Reduced 1,740 1,757 1,775 5,272
GIN SEI Exterior Garage LED replacing 251W - 400W HID Watts Reduced 9,700 9,797 9,895 29,392
GIN SEI Exterior High Wattage Pin-based CFLs Watts Reduced 575 581 587 1,742
GIN SEI Exterior LED replacing 175W or Less HID Watts Reduced 96,620 97,586 98,562 292,768
GIN SEI Exterior LED replacing 176W - 250W HID Watts Reduced 52,800 53,328 53,861 159,989
GIN SEI Exterior LED replacing 251W - 400W HID Watts Reduced 26,969 27,239 27,511 81,719
GIN SEI Exterior Pulse Start or Ceramic, 350W - 400W Watts Reduced 5,388 5,442 5,496 16,326
GIN SEI Exterior T8/T5 New Fluorescent Fixture w/ Electronic Ballast
Watts Reduced 2,500 2,525 2,550 7,575
GIN SEI Garage T8/T5 New Fluorescent Fixture w/ Electronic Ballast
Watts Reduced 650 657 663 1,970
GIN SEI Interior 2-ft HPT8 Ballast with Low Ballast Factor Watts Reduced 700 707 714 2,121
GIN SEI Interior 3-ft HPT8 Ballast with Low Ballast Factor Watts Reduced 50 51 51 152
GIN SEI Interior 4-ft HPT8 Ballast with Low Ballast Factor Watts Reduced 1,400 1,414 1,428 4,242
GIN SEI Interior Central Lighting Controls
Watts Controlled 100,000 101,000 102,010 303,010
GIN SEI Interior CFL - Downlight, Dimmable or 3-way Lamp 1,600 1,616 1,632 4,848
GIN SEI Interior CFL - Screw-in (30W or Less) Lamp 5,000 5,050 5,101 15,151
GIN SEI Interior CFL - Screw-in (31W or 115W) Lamp 500 505 510 1,515
GIN SEI Interior Cold Cathode Lamp 1,200 1,212 1,224 3,636
GIN SEI Interior Daylight Sensor Controls
Watts Controlled 25,000 25,250 25,503 75,753
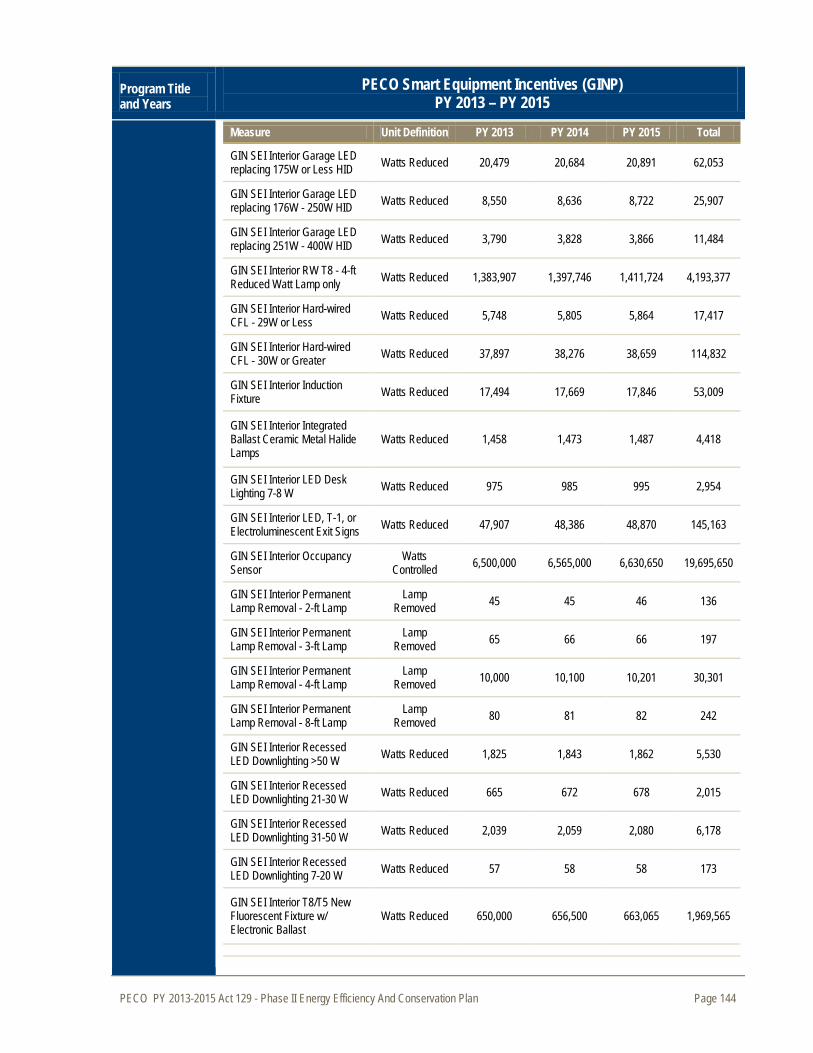
PECO PY 2013-2015 Act 129 - Phase II Energy Efficiency And Conservation Plan Page 144
Program Title and Years
PECO Smart Equipment Incentives (GINP) PY 2013 – PY 2015
Measure Unit Definition PY 2013 PY 2014 PY 2015 Total
GIN SEI Interior Garage LED replacing 175W or Less HID Watts Reduced 20,479 20,684 20,891 62,053
GIN SEI Interior Garage LED replacing 176W - 250W HID Watts Reduced 8,550 8,636 8,722 25,907
GIN SEI Interior Garage LED replacing 251W - 400W HID Watts Reduced 3,790 3,828 3,866 11,484
GIN SEI Interior RW T8 - 4-ft Reduced Watt Lamp only Watts Reduced 1,383,907 1,397,746 1,411,724 4,193,377
GIN SEI Interior Hard-wired CFL - 29W or Less Watts Reduced 5,748 5,805 5,864 17,417
GIN SEI Interior Hard-wired CFL - 30W or Greater Watts Reduced 37,897 38,276 38,659 114,832
GIN SEI Interior Induction Fixture Watts Reduced 17,494 17,669 17,846 53,009
GIN SEI Interior Integrated Ballast Ceramic Metal Halide Lamps
Watts Reduced 1,458 1,473 1,487 4,418
GIN SEI Interior LED Desk Lighting 7-8 W Watts Reduced 975 985 995 2,954
GIN SEI Interior LED, T-1, or Electroluminescent Exit Signs Watts Reduced 47,907 48,386 48,870 145,163
GIN SEI Interior Occupancy Sensor
Watts Controlled 6,500,000 6,565,000 6,630,650 19,695,650
GIN SEI Interior Permanent Lamp Removal - 2-ft Lamp
Lamp Removed 45 45 46 136
GIN SEI Interior Permanent Lamp Removal - 3-ft Lamp
Lamp Removed 65 66 66 197
GIN SEI Interior Permanent Lamp Removal - 4-ft Lamp
Lamp Removed 10,000 10,100 10,201 30,301
GIN SEI Interior Permanent Lamp Removal - 8-ft Lamp
Lamp Removed 80 81 82 242
GIN SEI Interior Recessed LED Downlighting >50 W Watts Reduced 1,825 1,843 1,862 5,530
GIN SEI Interior Recessed LED Downlighting 21-30 W Watts Reduced 665 672 678 2,015
GIN SEI Interior Recessed LED Downlighting 31-50 W Watts Reduced 2,039 2,059 2,080 6,178
GIN SEI Interior Recessed LED Downlighting 7-20 W Watts Reduced 57 58 58 173
GIN SEI Interior T8/T5 New Fluorescent Fixture w/ Electronic Ballast
Watts Reduced 650,000 656,500 663,065 1,969,565
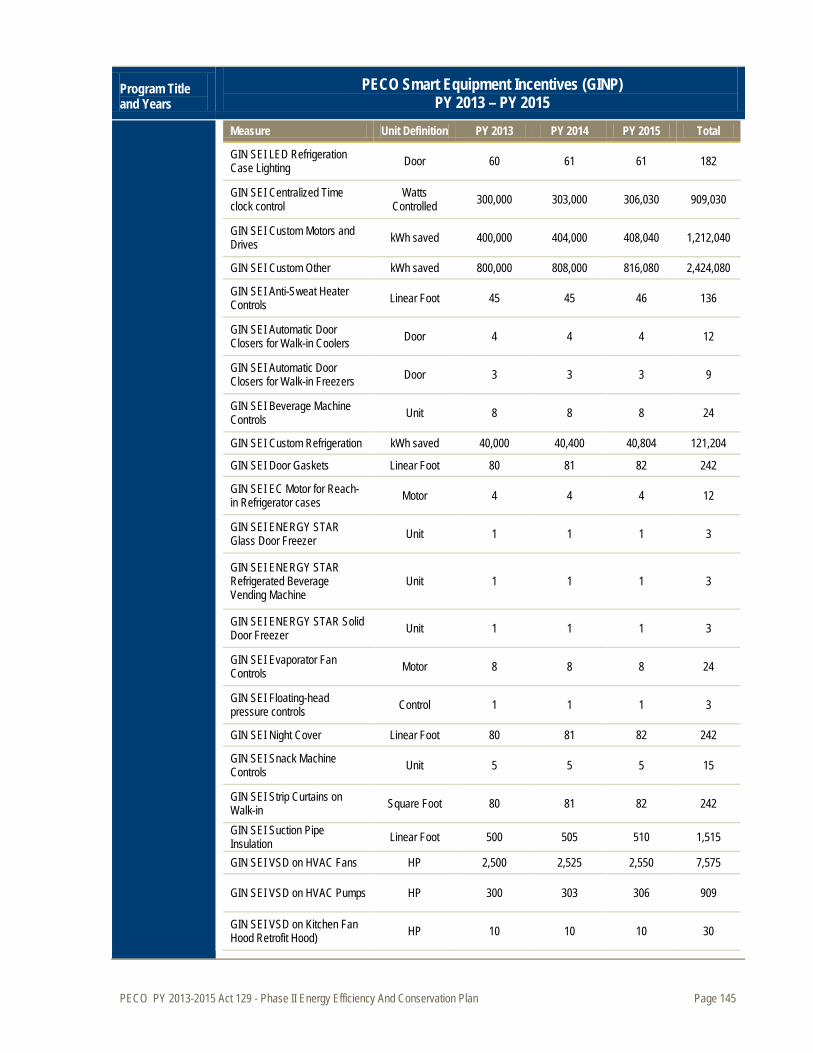
PECO PY 2013-2015 Act 129 - Phase II Energy Efficiency And Conservation Plan Page 145
Program Title and Years
PECO Smart Equipment Incentives (GINP) PY 2013 – PY 2015
Measure Unit Definition PY 2013 PY 2014 PY 2015 Total
GIN SEI LED Refrigeration Case Lighting Door 60 61 61 182
GIN SEI Centralized Time clock control
Watts Controlled 300,000 303,000 306,030 909,030
GIN SEI Custom Motors and Drives kWh saved 400,000 404,000 408,040 1,212,040
GIN SEI Custom Other kWh saved 800,000 808,000 816,080 2,424,080
GIN SEI Anti-Sweat Heater Controls Linear Foot 45 45 46 136
GIN SEI Automatic Door Closers for Walk-in Coolers Door 4 4 4 12
GIN SEI Automatic Door Closers for Walk-in Freezers Door 3 3 3 9
GIN SEI Beverage Machine Controls Unit 8 8 8 24
GIN SEI Custom Refrigeration kWh saved 40,000 40,400 40,804 121,204
GIN SEI Door Gaskets Linear Foot 80 81 82 242
GIN SEI EC Motor for Reach-in Refrigerator cases Motor 4 4 4 12
GIN SEI ENERGY STAR Glass Door Freezer Unit 1 1 1 3
GIN SEI ENERGY STAR Refrigerated Beverage Vending Machine
Unit 1 1 1 3
GIN SEI ENERGY STAR Solid Door Freezer Unit 1 1 1 3
GIN SEI Evaporator Fan Controls Motor 8 8 8 24
GIN SEI Floating-head pressure controls Control 1 1 1 3
GIN SEI Night Cover Linear Foot 80 81 82 242
GIN SEI Snack Machine Controls Unit 5 5 5 15
GIN SEI Strip Curtains on Walk-in Square Foot 80 81 82 242
GIN SEI Suction Pipe Insulation Linear Foot 500 505 510 1,515
GIN SEI VSD on HVAC Fans HP 2,500 2,525 2,550 7,575
GIN SEI VSD on HVAC Pumps HP 300 303 306 909
GIN SEI VSD on Kitchen Fan Hood Retrofit Hood) HP 10 10 10 30

PECO PY 2013-2015 Act 129 - Phase II Energy Efficiency And Conservation Plan Page 146
Program Title and Years
PECO Smart Equipment Incentives (GINP) PY 2013 – PY 2015
Measure Unit Definition PY 2013 PY 2014 PY 2015 Total
GIN SEI VSD on Process Motor < 50 HP HP 65 66 66 197
GIN SEI Faucet Aerators, electric water heating Unit 8 8 8 24
GIN SEI Low-Flow Showerheads, electric water heating
Unit 8 8 8 24
GIN SEI Water-Source Heat Pump < 1.42 tons Ton 0 0 0 0
GIN SEI Water-Source Heat Pump >= 1.42 and <5.41 tons Ton 0 0 0 0
*VSD on Kitchen Fan Hood (Retrofit Hood) measures is a comprehensive system which includes a variable speed drive, electronic controls, and sensors to vary the exhaust rate based on demand. The sensors monitor heat, vapor, and smoke to automatically adjust the fan speed.
Estimated Program Budget and % of Budget
PECO Smart Equipment Incentives (GINP)—Proposed Budget
PECO Smart Equipment Incentives (GINP) PY 2013 PY 2014 PY 2015 Total
Program Budget as a %
of Sector Program Budget $7,966,225 $8,115,727 $8,268,819 $24,350,771 23%
Anticipated costs to Participating customers
PECO Smart Equipment Incentives (GINP)—Participation Costs PECO Smart Equipment Incentives (GINP) PY 2013 PY 2014 PY 2015 Total Anticipated costs to Participating customers $8,468,432 $8,553,117 $8,638,648 $25,660,197
Projected Energy Savings and Demand Reduction
The savings estimates were developed using the current standard calculation methodologies (e.g., Pennsylvania’s Technical Resource Manual, DEER, and DOE). These values were applied to the estimated number of measures incentivized under the program each year.
PECO Smart Equipment Incentives (GINP)— Annual Gross Energy and Peak Demand Savings Estimates
PECO Smart Equipment Incentives (GINP) PY 2013 PY 2014 PY 2015 MWh Savings 34,239 34,582 34,927 Peak MW Reduction 11.5 11.7 11.8
Energy savings are “at meter”; demand savings are “at generator”.
Cost-Effectiveness
PECO Smart Equipment Incentives (GINP)
Dollars (Millions)
TRC Discounted Lifetime Benefits
Discounted Lifetime Costs
Net Benefits
$48,677,752 $26,192,376 $22,485,376 1.9
PECO PY 2013-2015 Act 129 - Phase II Energy Efficiency And Conservation Plan Page 147
3.2.2.6 EE Program 13 —PECO Smart On-Site
Program Title and Years PECO Smart On-Site PY 2013 – PY 2015
Objectives The PECO Smart On-Site program has several objectives: » Increase consumers’ awareness and understanding of combined heat and power (CHP)
technologies and opportunities in their facilities.
» Assist customers interested in acting on opportunities to install various types of CHP and fuel cell systems.
» Overcome financial barriers to allow customers to integrate CHP technologies into their facilities energy systems.
» Make a significant contribution to attainment of PECO’s energy savings goals. » Demonstrate PECO’s commitment to and confidence in innovative energy savings
technologies. » Strengthen customer trust in PECO as their partner in saving energy.
Target Market All existing commercial and industrial accounts, including government, public, and non-profit facilities, provided with electricity by PECO are eligible to participate in the PECO Smart On-Site program.
» Within this target market, the focus for this program is customers installing any type of CHP technology that helps offset facility demand.
Program Description
The PECO Smart On-Site program is designed to build interest in combined heat and power (CHP) technologies by making the customer economics attractive. The program offers incentives to customers who install CHP technologies to reduce facility energy use.
Combined heat and power technologies generate electric and thermal energy from a single fuel source. Customers with steady base load electricity usage coupled with steady thermal demand can realize significant efficiencies and savings by incorporating CHP (sometimes referred to as cogeneration) in their facilities. The best economics are realized for CHP systems that are sized to match the minimum electric and thermal loads. The PECO Smart On-Site program will be designed to ensure participating customers install economic CHP projects that maximize operational savings and minimize operational and maintenance costs.
The program incentives are paid on a declining tiered incentive rate by installed capacity with a bonus performance payment. The capacity tiers are as follows:
» <= 0.5 MW
» > 0.5 MW, <= 1.5 MW
» > 1.5 MW, <= 10.0 MW
Each tier has a fixed per MW incentive paid toward the incremental capacity within each tier. Capacity-based incentives will not be paid for incremental capacity above 10 MW. The performance payment is paid on a fixed per kWh basis based on actual energy savings after a one-year monitoring period. For projects occurring within the final year of the program, an accelerated performance payment will be available based on the projects expected first year energy savings. Savings for all projects are claimed upon implementation and can be adjusted based on the performance monitoring results.
Implementation Strategy
PECO will administer the PECO Smart On-Site program through a CSP implementation contractor who will oversee all aspects of the program’s implementation, outlined in the sections below.
Effective implementation includes distributing information about the technology offerings and the program,
Channels for Program Delivery
PECO PY 2013-2015 Act 129 - Phase II Energy Efficiency And Conservation Plan Page 148
Program Title and Years PECO Smart On-Site PY 2013 – PY 2015
promoting the program adequately, and educating those influential in making project selection and purchasing decisions. Because of the high cost, technical complexity, and operational commitment inherent in CHP systems, project developer and manufacturers are as important as the customer in terms of program delivery. As a result, the key delivery channels are limited to:
» Program and Technology Information Distribution o CSP—The implementation CSP will develop and distribute information about the
qualifying products and participation assistance by establishing and leveraging existing relationships with the product and service suppliers.
o Manufacturers—The program will leverage the expertise of equipment manufacturers to enable implementation decisions at project sites.
o Project developers—Project developers can act as an initial screen of potential projects. The developers generally conduct feasibility analyses and are involved in equipment procurement and implementation.
o Utility staff—While PECO will engage a CSP to implement the program, the staff has ongoing contact with all key account customers. The staff will provide information about the program benefits, measures, and process.
» Program Promotion o CSP—A key responsibility of the implementation CSP is outreach and effective
promotion of the program to the target market. o Manufacturers—Manufacturers will be trained in the program rules and requirements and
can use the information to determine appropriate solutions for project sites. o Project developers—The program will enable project developers to use available
incentives and program benefits to generate interest among potential eligible customers. o Utility account executives—Leveraging regular communication with key accounts, utility
staff will have a unique opportunity to drive program awareness and interest. » Education
o CSP to meet individually with facility decision makers during outreach and project development.
o Trade publication articles on the benefits of specific measures, technologies, and diagnostic tune-ups, as well as whole facility assessments.
o Trade industry meetings leveraged to include product and program education as part of them.
o Utility account executives
The implementation CSP will have full responsibility for delivery of all aspects of the program. Responsibilities fall into several activity areas:
Overview of Roles and Activities
» Development of relationships with project developers and manufacturers to promote their participation in the program.
» Program marketing: including development and distribution of program materials, as well as: o Market segmentation strategies will be developed to identify and target facilities with
good potential for CHP. o Screening guidelines will be developed to help account managers and trade allies identify
and qualify candidates having the highest potential for successful completion of projects. » Participant recruitment and assistance: including assisting customers and project developers
with incentive application submittal, assisting customers. » Incentive processing: including a fulfillment house to receive, review and verify applications;
and pay the financial incentives . » Program performance tracking and improvement: including tracking availability of qualifying
PECO PY 2013-2015 Act 129 - Phase II Energy Efficiency And Conservation Plan Page 149
Program Title and Years PECO Smart On-Site PY 2013 – PY 2015
products, incentive submittals and payments, and opportunities to improve the program. » Reporting: including reporting of program activities to meet regulatory and internal
requirements, including progress toward program goals.
The program will develop presentations for project developers and manufacturers on the availability of incentives available for CHP, eligibility requirements, and program process. Where possible, the program will leverage education provided by other groups.
Education Overview
Several other sources of technical and financial assistance are available to commercial and industrial energy users to enable energy efficiency improvements. Information about these resources will be made available to the program participants and trade allies through the program trainings and resources. They include:
Applicable Collaborative Resources
» United States Clean Heat and Power Association (U.S. CHPA) offers advocacy, networking, education, and market information to companies in the business of CHP and works to develop sound clean energy policy and market place solutions. The U.S. CHPA documents the benefits of CHP to both the public and to decision-makers by sponsoring conferences and workshops and preparing reports to educate and overcome barriers to CHP. U.S. CHPA offers their members the opportunity to network with each other and key government officials to promote greater understanding of the benefits of CHP and to ensure a strong industry.
Program Issues, Risks, and Risk Management Strategies
There are many challenges associated with providing an energy efficiency program to commercial and industrial customers. Key challenges are identified below, along with how the PECO Smart On-Site program can address them.
» Technical Diversity: The uses of thermal and electrical energy by commercial and industrial customers are complex and site-specific, requiring extensive expertise in building systems and CHP technologies. The CSP will develop a team of technical and process experts to support commercial and industrial customers throughout the project development process.
» Natural Gas Prices: Since CHP systems operate on natural gas, cost increases have a significant influence on the financial attractiveness of a proposed system. A customer with a bearish outlook on natural gas prices will be reluctant to make the investment. The program will look into options for customers to enter into long-term natural gas contracts which will hold the resource cost steady over a known time frame.
» Trade Ally Relationships: Project developers and manufacturer have considerable influence in a customer’s decision to install a CHP system. This effectively makes these trade allies part of the participant target market. Several strategies will be used to engage those trade allies including trainings and other resources.
» Capital and Resource Intensive Projects: CHP technologies and strategies often require significant facility resources to implement. Projects can have lengthy lead times and implementation durations. The program will accommodate and support the needs of facilities throughout the implementation process.
» Integration with Comprehensive Energy Efficiency: CHP technologies seek to help meet a facility’s base energy load. Similar to the implementation of renewable energy technologies, it is important for facilities to optimize base loads prior to implementing CHP systems. PECO’s comprehensive energy efficiency program portfolio will facilitate overall energy efficiency and complement the PECO Smart On-Site program.

PECO PY 2013-2015 Act 129 - Phase II Energy Efficiency And Conservation Plan Page 150
Program Title and Years PECO Smart On-Site PY 2013 – PY 2015
Ramp Up Strategy
Prior to program launch, considerable effort needs to go into preparing the ground for the success of the program, including:
» Screening and selection of prime implementation CSP – PECO will use a competitive bidding process to select an implementation CSP for the Smart On-Site program. PECO will develop a request for proposal, identifying the necessary qualifications and responsibilities. The bidding CSP proposals will be thoroughly reviewed and scored.
» Recruit and develop relationships with equipment manufacturers and project developers. » Program delivery education—Training sessions that provide the CSP’s employees, equipment
manufacturers, and project developers information regarding program rules and regulations will be offered immediately upon program approval and will continue through program operation.
Marketing Strategy
CHP systems are significant investments for customers not only in terms of cost but in operational commitment. The CHP market is heavily driven by project developers and manufacturers who have significant influence with customers in their decision-making process. The sales cycle for a CHP system is long, complex and requires a significant investment of time by the project developer. Therefore, program marketing efforts will be directed primarily at this group with supplemental activities directed at the end use customer. The marketing activities that will be targeted toward each channel are described below:
Marketing to Project Developers and Manufacturers: » Industry Associations: The program will develop relationships with industry association who
represent project developers and manufactures working along the CHP supply chain. Good candidates are the local chapter of the U.S. CHPA and the U.S. Department of Energy Mid-Atlantic Clean Energy Application Center.
» Workshops and Trainings: A series of workshops will be held to educate project developers and manufacturers on the availably of incentives, program requirements, and strategies for incorporating energy efficiency into their sales process.
Direct Marketing to Customers: » Industry Groups: The program will include the CHP program when presenting to industry
groups whose membership falls within the targeted population of C&I customers. » Account Executives: Larger C&I customers have an assigned account representatives who
maintains an ongoing, one-on-one relationship with key customer contacts. The account executives will screen each of their assigned accounts to determine which are good candidates for CHP.
» Electronic: The PECO Web site will include detailed program information on eligibility, incentive levels, and other requirements.
Eligible Measures and Incentives
Any type of CHP configuration may be installed through this program including but not limited to:
Measures
» Reciprocating engines » Steam Turbines » Gas Turbines » Micro turbines » Fuel cells
Incentives for this program are paid on a declining tiered incentive rate by installed capacity with a bonus performance payment. Capacity incentives are paid as follows:
Incentives
» $250 - $300/kW for first 500 kW
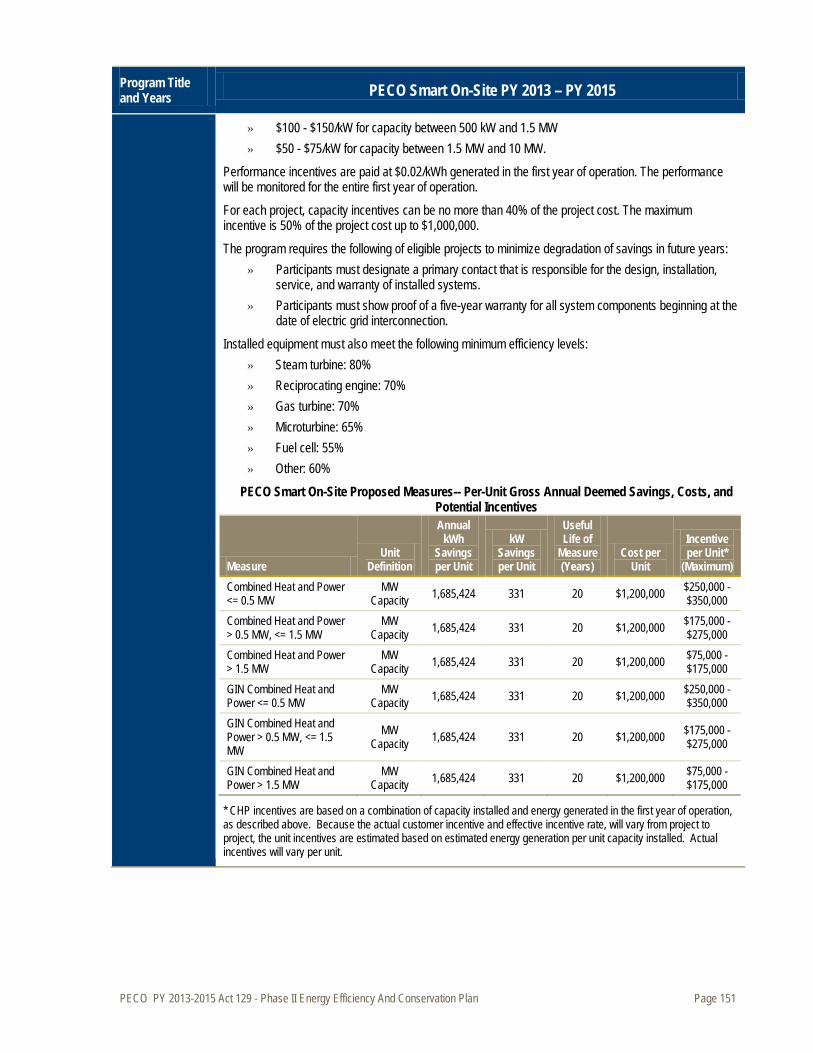
PECO PY 2013-2015 Act 129 - Phase II Energy Efficiency And Conservation Plan Page 151
Program Title and Years PECO Smart On-Site PY 2013 – PY 2015
» $100 - $150/kW for capacity between 500 kW and 1.5 MW » $50 - $75/kW for capacity between 1.5 MW and 10 MW.
Performance incentives are paid at $0.02/kWh generated in the first year of operation. The performance will be monitored for the entire first year of operation.
For each project, capacity incentives can be no more than 40% of the project cost. The maximum incentive is 50% of the project cost up to $1,000,000.
The program requires the following of eligible projects to minimize degradation of savings in future years: » Participants must designate a primary contact that is responsible for the design, installation,
service, and warranty of installed systems. » Participants must show proof of a five-year warranty for all system components beginning at the
date of electric grid interconnection.
Installed equipment must also meet the following minimum efficiency levels: » Steam turbine: 80% » Reciprocating engine: 70% » Gas turbine: 70% » Microturbine: 65% » Fuel cell: 55% » Other: 60%
PECO Smart On-Site Proposed Measures-- Per-Unit Gross Annual Deemed Savings, Costs, and Potential Incentives
Measure Unit
Definition
Annual kWh
Savings per Unit
kW Savings per Unit
Useful Life of
Measure (Years)
Cost per Unit
Incentive per Unit*
(Maximum) Combined Heat and Power <= 0.5 MW
MW Capacity 1,685,424 331 20 $1,200,000 $250,000 -
$350,000 Combined Heat and Power > 0.5 MW, <= 1.5 MW
MW Capacity 1,685,424 331 20 $1,200,000 $175,000 -
$275,000 Combined Heat and Power > 1.5 MW
MW Capacity 1,685,424 331 20 $1,200,000 $75,000 -
$175,000 GIN Combined Heat and Power <= 0.5 MW
MW Capacity 1,685,424 331 20 $1,200,000 $250,000 -
$350,000 GIN Combined Heat and Power > 0.5 MW, <= 1.5 MW
MW Capacity 1,685,424 331 20 $1,200,000 $175,000 -
$275,000
GIN Combined Heat and Power > 1.5 MW
MW Capacity 1,685,424 331 20 $1,200,000 $75,000 -
$175,000
* CHP incentives are based on a combination of capacity installed and energy generated in the first year of operation, as described above. Because the actual customer incentive and effective incentive rate, will vary from project to project, the unit incentives are estimated based on estimated energy generation per unit capacity installed. Actual incentives will vary per unit.
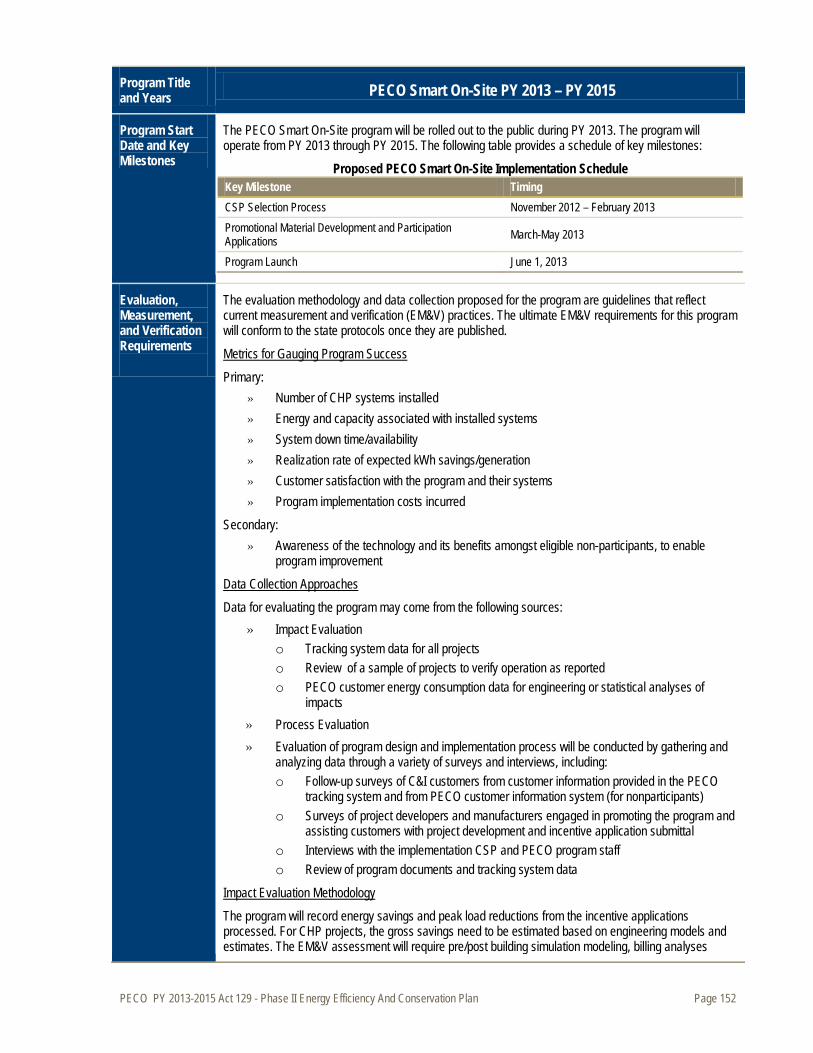
PECO PY 2013-2015 Act 129 - Phase II Energy Efficiency And Conservation Plan Page 152
Program Title and Years PECO Smart On-Site PY 2013 – PY 2015
Program Start Date and Key Milestones
The PECO Smart On-Site program will be rolled out to the public during PY 2013. The program will operate from PY 2013 through PY 2015. The following table provides a schedule of key milestones:
Proposed PECO Smart On-Site Implementation Schedule Key Milestone Timing CSP Selection Process November 2012 – February 2013 Promotional Material Development and Participation Applications March-May 2013
Program Launch June 1, 2013
Evaluation, Measurement, and Verification Requirements
The evaluation methodology and data collection proposed for the program are guidelines that reflect current measurement and verification (EM&V) practices. The ultimate EM&V requirements for this program will conform to the state protocols once they are published.
Primary:
Metrics for Gauging Program Success
» Number of CHP systems installed » Energy and capacity associated with installed systems » System down time/availability » Realization rate of expected kWh savings/generation » Customer satisfaction with the program and their systems » Program implementation costs incurred
Secondary: » Awareness of the technology and its benefits amongst eligible non-participants, to enable
program improvement
Data for evaluating the program may come from the following sources:
Data Collection Approaches
» Impact Evaluation o Tracking system data for all projects o Review of a sample of projects to verify operation as reported o PECO customer energy consumption data for engineering or statistical analyses of
impacts » Process Evaluation » Evaluation of program design and implementation process will be conducted by gathering and
analyzing data through a variety of surveys and interviews, including: o Follow-up surveys of C&I customers from customer information provided in the PECO
tracking system and from PECO customer information system (for nonparticipants) o Surveys of project developers and manufacturers engaged in promoting the program and
assisting customers with project development and incentive application submittal o Interviews with the implementation CSP and PECO program staff o Review of program documents and tracking system data
The program will record energy savings and peak load reductions from the incentive applications processed. For CHP projects, the gross savings need to be estimated based on engineering models and estimates. The EM&V assessment will require pre/post building simulation modeling, billing analyses
Impact Evaluation Methodology
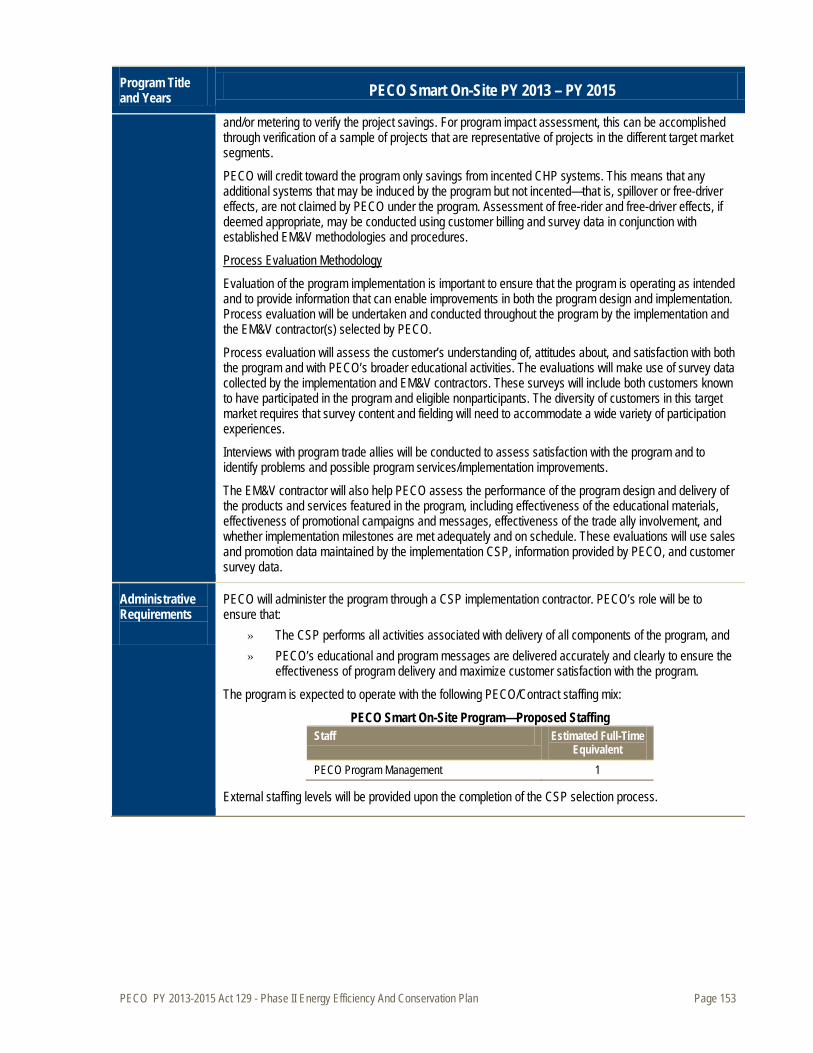
PECO PY 2013-2015 Act 129 - Phase II Energy Efficiency And Conservation Plan Page 153
Program Title and Years PECO Smart On-Site PY 2013 – PY 2015
and/or metering to verify the project savings. For program impact assessment, this can be accomplished through verification of a sample of projects that are representative of projects in the different target market segments.
PECO will credit toward the program only savings from incented CHP systems. This means that any additional systems that may be induced by the program but not incented—that is, spillover or free-driver effects, are not claimed by PECO under the program. Assessment of free-rider and free-driver effects, if deemed appropriate, may be conducted using customer billing and survey data in conjunction with established EM&V methodologies and procedures.
Evaluation of the program implementation is important to ensure that the program is operating as intended and to provide information that can enable improvements in both the program design and implementation. Process evaluation will be undertaken and conducted throughout the program by the implementation and the EM&V contractor(s) selected by PECO.
Process Evaluation Methodology
Process evaluation will assess the customer’s understanding of, attitudes about, and satisfaction with both the program and with PECO’s broader educational activities. The evaluations will make use of survey data collected by the implementation and EM&V contractors. These surveys will include both customers known to have participated in the program and eligible nonparticipants. The diversity of customers in this target market requires that survey content and fielding will need to accommodate a wide variety of participation experiences.
Interviews with program trade allies will be conducted to assess satisfaction with the program and to identify problems and possible program services/implementation improvements.
The EM&V contractor will also help PECO assess the performance of the program design and delivery of the products and services featured in the program, including effectiveness of the educational materials, effectiveness of promotional campaigns and messages, effectiveness of the trade ally involvement, and whether implementation milestones are met adequately and on schedule. These evaluations will use sales and promotion data maintained by the implementation CSP, information provided by PECO, and customer survey data.
Administrative Requirements
PECO will administer the program through a CSP implementation contractor. PECO’s role will be to ensure that:
» The CSP performs all activities associated with delivery of all components of the program, and » PECO’s educational and program messages are delivered accurately and clearly to ensure the
effectiveness of program delivery and maximize customer satisfaction with the program. The program is expected to operate with the following PECO/Contract staffing mix:
PECO Smart On-Site Program—Proposed Staffing Staff Estimated Full-Time
Equivalent PECO Program Management 1
External staffing levels will be provided upon the completion of the CSP selection process.
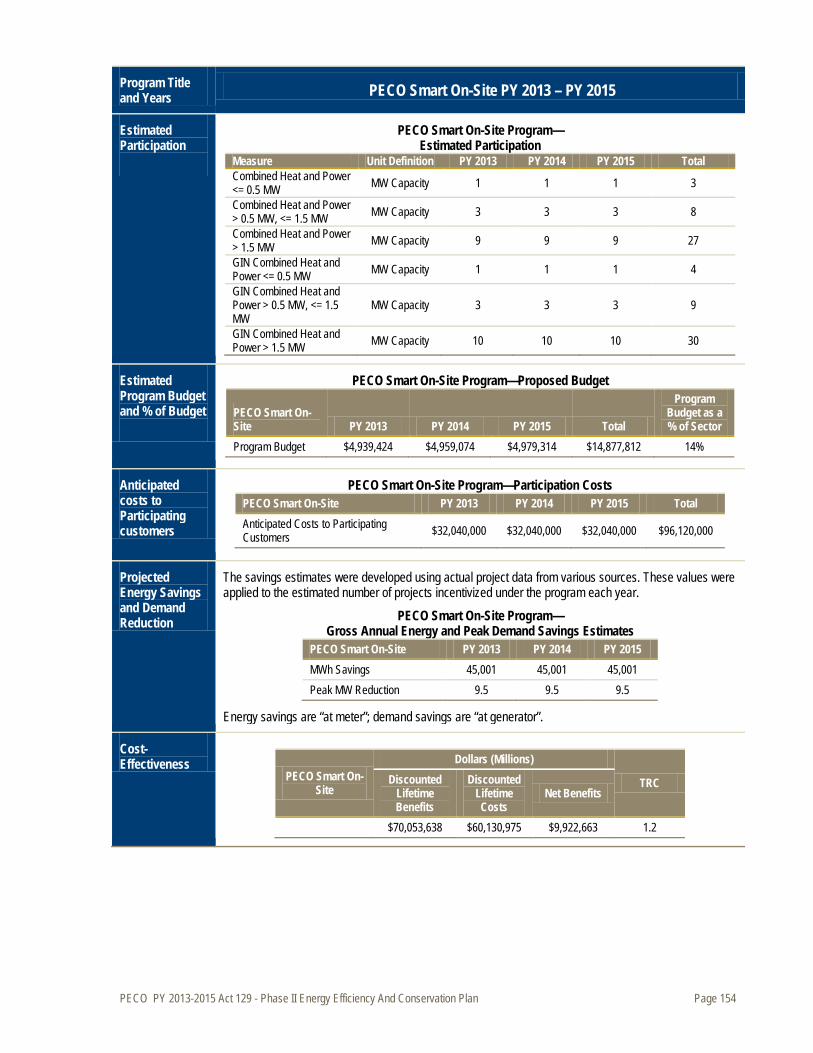
PECO PY 2013-2015 Act 129 - Phase II Energy Efficiency And Conservation Plan Page 154
Program Title and Years PECO Smart On-Site PY 2013 – PY 2015
Estimated Participation
PECO Smart On-Site Program— Estimated Participation
Measure Unit Definition PY 2013 PY 2014 PY 2015 Total Combined Heat and Power <= 0.5 MW MW Capacity 1 1 1 3
Combined Heat and Power > 0.5 MW, <= 1.5 MW MW Capacity 3 3 3 8
Combined Heat and Power > 1.5 MW MW Capacity 9 9 9 27
GIN Combined Heat and Power <= 0.5 MW MW Capacity 1 1 1 4
GIN Combined Heat and Power > 0.5 MW, <= 1.5 MW
MW Capacity 3 3 3 9
GIN Combined Heat and Power > 1.5 MW MW Capacity 10 10 10 30
Estimated Program Budget and % of Budget
PECO Smart On-Site Program—Proposed Budget
PECO Smart On-Site PY 2013 PY 2014 PY 2015 Total
Program Budget as a % of Sector
Program Budget $4,939,424 $4,959,074 $4,979,314 $14,877,812 14%
Anticipated costs to Participating customers
PECO Smart On-Site Program—Participation Costs PECO Smart On-Site PY 2013 PY 2014 PY 2015 Total Anticipated Costs to Participating Customers $32,040,000 $32,040,000 $32,040,000 $96,120,000
Projected Energy Savings and Demand Reduction
The savings estimates were developed using actual project data from various sources. These values were applied to the estimated number of projects incentivized under the program each year.
PECO Smart On-Site Program— Gross Annual Energy and Peak Demand Savings Estimates
PECO Smart On-Site PY 2013 PY 2014 PY 2015 MWh Savings 45,001 45,001 45,001 Peak MW Reduction 9.5 9.5 9.5
Energy savings are “at meter”; demand savings are “at generator”.
Cost-Effectiveness
PECO Smart On-Site
Dollars (Millions)
TRC Discounted Lifetime Benefits
Discounted Lifetime Costs
Net Benefits
$70,053,638 $60,130,975 $9,922,663 1.2
PECO PY 2013-2015 Act 129 - Phase II Energy Efficiency And Conservation Plan Page 155
4. Program Management and Implementation Strategies
4.1 Overview of PECO Management and Implementation Strategies
4.1.1 Types of services offered by PECO and other parties
The objective of PECO energy efficiency activities is to deliver cost effective energy savings for the benefit of all rate classes. This is accomplished through a portfolio of customized program offerings, delivered through the most effective means available. PECO will support the Plan implementation through a combination of internal resources, CSPs, and the use of trade allies and retail distribution outlets. The programs will employ multiple implementation and communication strategies providing for numerous opportunities for customers to be made aware of the programs and to participate. PECO assumes responsibility across all CSPs to provide strategic direction, develop and review Request for Proposals (RFPs), analyze program performance, develop, coordinate and execute education and awareness raising activities and promotions, develop and recommend program changes, and ensure overall program success and budget management. CSPs will provide final program design guidance, delivery of program services, development of program policies procedures, marketing Plans, and materials, recruitment of participants and participating trade allies, tracking and reporting, resolution of issues, and payment of incentives and rebates. As per PUC requirements, PECO will engage an evaluation contractor to be responsible for measurement, verification and evaluation. Evaluation will verify that programs are meeting their goals and are being operated consistently with the approved program implementation Plans. The evaluation contractor will interface with the Statewide Evaluator to ensure measurement and verification protocols are aligned with the state’s requirements, in addition to providing feedback periodically to PECO on the identified areas where delivery performance could be improved.
4.1.2 Risk categories and risk mitigation strategies
There are risks inherent in the delivery of any energy efficiency portfolio. The following are some key steps PECO is taking to manage those risks:
1. Selecting programs that are diversified in design and implementation strategy, including some that are relatively simple, flexible and have a history of delivering results in other states (e.g. CFL lighting), combined with comprehensive program offerings that strive for deeper energy savings (e.g. Smart House Call).
2. Developing a Plan with a broad mix of programs to avoid over reliance on any single measure, channel or customer segment.
3. Forecasting to achieve approximately 105% of the overall savings target to hedge unknown performance across the entire portfolio.
4.1.2.1 Performance Risk
Program benchmarking is the first step PECO took to ensure the portfolio was well balanced with a high likelihood of success. The types of programs proposed have been operating for many years in states such as California, Vermont and New York. Lessons learned from these programs have been incorporated into the program Plans.

PECO PY 2013-2015 Act 129 - Phase II Energy Efficiency And Conservation Plan Page 156
Performance risk will also be managed using a clear and robust RFP process for bidding programs to the CSP marketplace. A disciplined RFP evaluation and selection process will be utilized to ensure experienced CSPs are engaged in the final design and delivery of the programs. CSPs will be required to demonstrate a proven track record of performance. CSP contracts, where possible, will include performance clauses to ensure CSPs have a strong financial incentive to succeed. PECO program managers will be responsible for the continual oversight and modifications to the programs and will promptly implement corrective actions if goals are not being met and to optimize the performance of programs that are meeting goals. Lastly, PECO Plans to continue to meet with stakeholders and other Pennsylvania EDCs to share learnings and draw on program experience across the state to improve the programs in its portfolio.
4.1.2.2 Technology Risk
This Plan focuses the majority of the incentives on known technologies and products with established energy efficiency savings. The TRM provides the majority of standards upon which prescriptive or deemed energy savings will be determined. Using this approach removes much of the technology risk from the prescriptive measures in the Plan and results in a more cost effective measurement and verification process. Custom savings will be determined on a project by project basis, using the existing (or code-required) equipment as the baseline of energy use. Pre- and post-inspections will be conducted, where appropriate, to verify equipment and operating conditions. Incentive payment estimates will be based on standard engineering and energy calculation principles and final payments will be based on the confirmed savings.
4.1.2.3 Market Risk
PECO has worked diligently to ensure a strong portfolio of programs, benchmarked for success in other jurisdictions, and developed with input from key stakeholders. Program success is a function of uncovering barriers to participation and developing approaches that address these barriers. PECO has significant experience and connection to the market given the Phase I implementation experiences. Below are some of PECO’s strategies to reduce market risk:
1. Education and awareness will be a component of every program. This will include not only program awareness but also the benefits of becoming more energy efficient.
2. All trade allies will be offered training opportunities and provided appropriate materials and support. The intent will be to ensure awareness and knowledge of the programs, to provide strategies for selling efficiency to their customers, and to educate the trade allies on the how these programs will help them further their business goals.
3. Strong promotional advertising will be implemented to drive awareness and call to action. 4. As appropriate, point of sale material will be placed in participating retail stores. 5. Clear program eligibility and streamlined application processes will make participation as easy
as possible for customers. 6. Strong program design and implementation experience will be a minimum requirement of all
CSPs hired by PECO. This will ensure that each program strategy is implemented by a strong team and has the best chance for success.
PECO PY 2013-2015 Act 129 - Phase II Energy Efficiency And Conservation Plan Page 157
4.1.2.4 Evaluation Risk
Several strategies will be used to minimize evaluation risk. Eliminating evaluation risk begins with program design, to ensure all assumptions and EM&V protocols are agreed to in advance. PECO will work very closely with the Statewide Evaluator to ensure consistent assumptions and processes are used. The TRM will provide a known set of assumptions for most prescriptive measures for PY 2013, however it is uncertain how future TRM adjustments will impact projected per unit savings in this Plan. A disciplined verification procedure will be in place to ensure measures that customers received incentives for have, in fact, been installed. This will be a key role of the Manager of EM&V as well as the EM&V contractor. PECO will use industry standard and state-approved methods to perform the measurement and verification process.
4.1.3 Human resource and contractor resource constraints
PECO understands that flexibility in resource staffing is needed to effectively implement the Plan and will manage human resource and contractor resources constraints through effective staffing and training. To ensure that each program has the right mix and level of human resources, staffing Plans will be developed for each program. Detailed process flows will be developed for all functions of program delivery and the proper mix of resources needed at each step identified. Then estimates of program participation will be plotted against the expected throughput for each staff member. Programs will be staffed appropriately to meet the Planned program activity. Understanding that program activity is not consistent over the year or program cycle, implementation staff will be cross trained so they can be moved into different functional areas at times of high volume. For instance, supervisors or engineers may be trained on the procedures for field inspections so they can be deployed if a backlog develops. Internally, the organization will be overseen by Energy and Marketing Services and will be further broken out in the marketing department by the following groups: Residential Energy Efficiency Programs, Commercial and Industrial Programs, Measurement and Verification, Business Planning and Promotions.
4.1.4 Early warning systems to indicate progress towards goals and process for adjustment
PECO has several methods for monitoring progress towards goals and ensuring that corrective actions are taken. Program Managers will closely monitor the programs through direct interface with the CSPs and through the DSM program tracking database. Performance indicators will be developed for each program and will be tracked on a monthly basis. Regular review of performance metrics as well as feedback from CSPs will allow the Program Manager to identify potential issues and take prompt corrective actions. Issues that may impede a program’s ability to effectively reach its goals will also be identified through regular program evaluation. Evaluations will be conducted early in the program cycle, especially for new programs, to make sure that issues are identified early. It will be the responsibility of the Evaluation Manager to ensure that recommended improvements are promptly and fully incorporated into the program design.

PECO PY 2013-2015 Act 129 - Phase II Energy Efficiency And Conservation Plan Page 158
PECO will also be proactive in monitoring efforts to update building and appliance codes that may affect the building or equipment baselines, and develop strategies to adapt these changes into any affected program’s design. Whether from codes and standards changes or evaluation results, PECO will quickly react to actual or potential changes in the TRM to ensure that programs are claiming appropriate energy savings.
4.1.5 Implementation schedules with milestones
Figure 6 illustrates PECO’s proposed portfolio implementation schedule with key milestones:
Figure 6. Implementation Schedule
4.2 Executive Management Structure
4.2.1 PECO Structure for Addressing Portfolio Strategy
Responsibility for the entire portfolio of programs resides within a single organization, with executive-level leadership provided by the Director of Energy and Marketing Services. Individual Managers are assigned responsibility for each of the major market sector groupings and key functional support areas. This executive team is responsible for overall portfolio strategy and Planning. Primary program management is organized by market sector: government, commercial and industrial, residential, and low income. Individual Program Managers are assigned to each program and have overall responsibility for the programs with support from the functional support groups. Program Manager responsibilities include program management, internal and external communications, Quality Assurance and Quality Control, review and tracking of program metrics, and procurement of the necessary resources.
YEARQUARTER 4
MONTH S O N D J F M A M J J A S O N D J F M A M J J A S O N D J F M A M J J A S O N D J F M A MResidential Programs (not including Low-Income)
PECO Smart Appliance Recycling
PECO Smart Home Rebates PECO Smmart House Call PECO Smart Builder Rebates PECO Smart Energy Saver PECO Smart Usage Profile
PECO Smart Multi-Family Solutions (Res)
Residential Programs including (Low-Income)
PECO Low-Income Energy Efficiency Program
Commercial and Industrial Programs (Small)
PECO - Smart Equipment Incentives (C&I)
PECO Smart Business Solutions PECO Smart Multi-Family Solutions (C&I) PECO Smart Construction Incentives PECO Smart On-Site Commercial and Industrial Programs (Large)
PECO - Smart Equipment Incentives (C&I)
PECO Smart Multi-Family Solutions PECO Smart Construction Incentives PECO Smart On-Site
Govt, Inst. Non-Profit Progam
PECO - Smart Equipment Incentives (GINP)
CSP Selection Process Promotional Materials Development and Participant ApplicationsProgram Launch Program Implementation PeriodConclusion of Program Cycle
20161 21
2014 20153 4 1 2 3 42
201320121 2 3 4
PECO PY 2013-2015 Act 129 - Phase II Energy Efficiency And Conservation Plan Page 159
Three functional support groups report to the Manger of Energy Efficiency and Conservation. They provide specialized support services to the Program Managers in the following areas:
» Promotions and Communications coordinates all internal and external communications; » Business Planning and Budgets is responsible for all financial aspects of the portfolio. This
includes budget and financial management as well as maintaining the portfolio tracking database to provide performance tracking and reporting.
» EM&V oversees the evaluation contractor and interfaces with the Statewide Evaluator. Figure 7 illustrates management-level support for the programs.
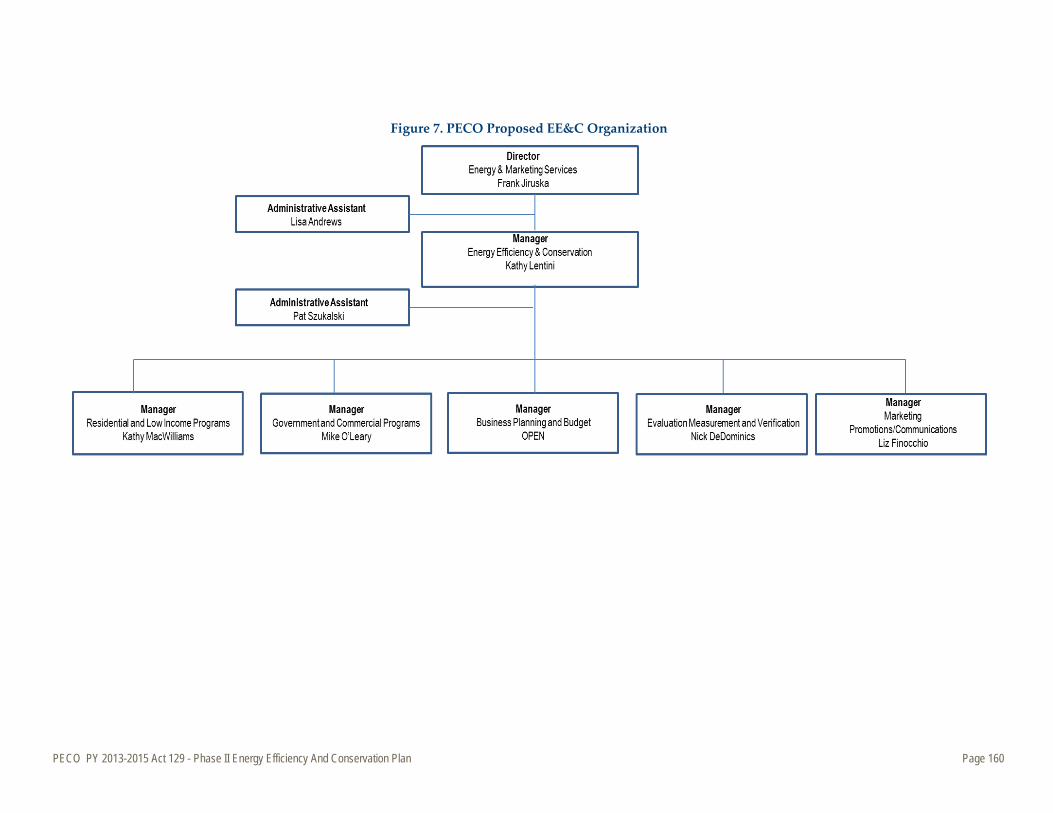
PECO PY 2013-2015 Act 129 - Phase II Energy Efficiency And Conservation Plan Page 160
Figure 7. PECO Proposed EE&C Organization

PECO PY 2013-2015 Act 129 - Phase II Energy Efficiency And Conservation Plan Page 161
4.2.2 Approach for overseeing the performance of CSPs and other providers
Oversight of CSPs will be a key factor in the managing of programs. PECO will incorporate performance metrics into its contracts with the CSPs. Individual Program Managers will monitor performance closely through the tracking system that will measure key indicators such as participants, costs, savings and other indicators. The Program Manager will work closely with the CSP to understand how the program is performing and if changes may be needed to make the program more successful. Customer and trade ally satisfaction will be assessed through each program’s EM&V and will provide each Program Manager with feedback on this dimension of each CSP’s performance.
4.2.3 Basis for Administrative Budget
The administrative expenses fall into the following categories as detailed in the Table 5: Administrative Costs 2013-2015 and the costs will be factored into the overall portfolio benefit-cost analysis. These costs include estimated PECO staff and procurement costs as well as costs associated with third parties (e.g. EM&V and Data Tracking Database contractors).
Table 5: Administrative Costs 2013-2015
Administrative Costs PY 2013 PY 2014 PY 2015
Total (2013-2015)
Percent of Total
Administrative Costs
General Education & Awareness $3,240,000 $3,337,200 $3,437,316 $10,014,516 27%
Utility Administration $2,675,000 $2,755,250 $2,837,908 $8,268,158 22%
Tracking System $3,070,000 $870,000 $885,678 $4,825,678 13%
Technical Support $500,000 $500,000 $500,000 $1,500,000 4%
EM&V $4,219,087 $4,345,660 $4,476,029 $13,040,776 35%
Total Cost $13,704,087 $11,808,110 $12,136,931 $37,649,128 100%
» General Education and Awareness- represents broad marketing and education efforts to promote the overall portfolio of energy efficiency programs. This will include expenditures on radio, newspaper, social media, sponsorships, etc. to promote the portfolio of programs.
» Utility Administration - represents PECO employees and contractors required to develop, oversee, execute, and evaluate all programs in the portfolio. Also included in this cost category are expenses associated with: a) customer service call center to support Phase II implementation; b) estimated costs for PECO staff energy efficiency training, energy efficiency industry conference sponsorships and participation.
» Tracking System- represents costs for updating and expanding the data tracking system used by PECO for overall tracking and reporting of energy efficiency savings.
» Technical Support- represents costs for on-going program design and research activities which may include new program research, emerging technology research, updating avoided costs or load shape research.
» EM&V- represents costs associated with third party independent evaluation, measurement, and verification (EM&V) for the full portfolio process and impact evaluation activities.
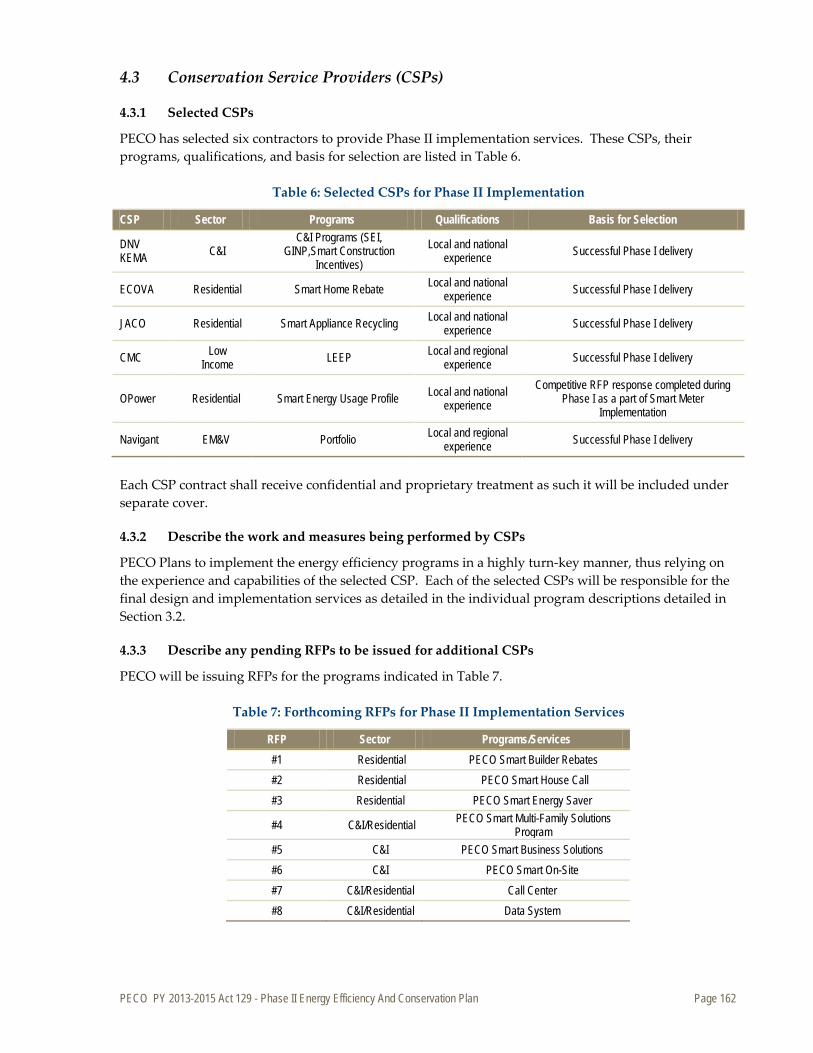
PECO PY 2013-2015 Act 129 - Phase II Energy Efficiency And Conservation Plan Page 162
4.3 Conservation Service Providers (CSPs)
4.3.1 Selected CSPs
PECO has selected six contractors to provide Phase II implementation services. These CSPs, their programs, qualifications, and basis for selection are listed in Table 6.
Table 6: Selected CSPs for Phase II Implementation
CSP Sector Programs Qualifications Basis for Selection
DNV KEMA C&I
C&I Programs (SEI, GINP,Smart Construction
Incentives) Local and national
experience Successful Phase I delivery
ECOVA Residential Smart Home Rebate Local and national experience Successful Phase I delivery
JACO Residential Smart Appliance Recycling Local and national experience Successful Phase I delivery
CMC Low Income LEEP Local and regional
experience Successful Phase I delivery
OPower Residential Smart Energy Usage Profile Local and national experience
Competitive RFP response completed during Phase I as a part of Smart Meter
Implementation
Navigant EM&V Portfolio Local and regional experience Successful Phase I delivery
Each CSP contract shall receive confidential and proprietary treatment as such it will be included under separate cover.
4.3.2 Describe the work and measures being performed by CSPs
PECO Plans to implement the energy efficiency programs in a highly turn-key manner, thus relying on the experience and capabilities of the selected CSP. Each of the selected CSPs will be responsible for the final design and implementation services as detailed in the individual program descriptions detailed in Section 3.2.
4.3.3 Describe any pending RFPs to be issued for additional CSPs
PECO will be issuing RFPs for the programs indicated in Table 7.
Table 7: Forthcoming RFPs for Phase II Implementation Services
RFP Sector Programs/Services #1 Residential PECO Smart Builder Rebates #2 Residential PECO Smart House Call #3 Residential PECO Smart Energy Saver
#4 C&I/Residential PECO Smart Multi-Family Solutions Program
#5 C&I PECO Smart Business Solutions #6 C&I PECO Smart On-Site #7 C&I/Residential Call Center #8 C&I/Residential Data System
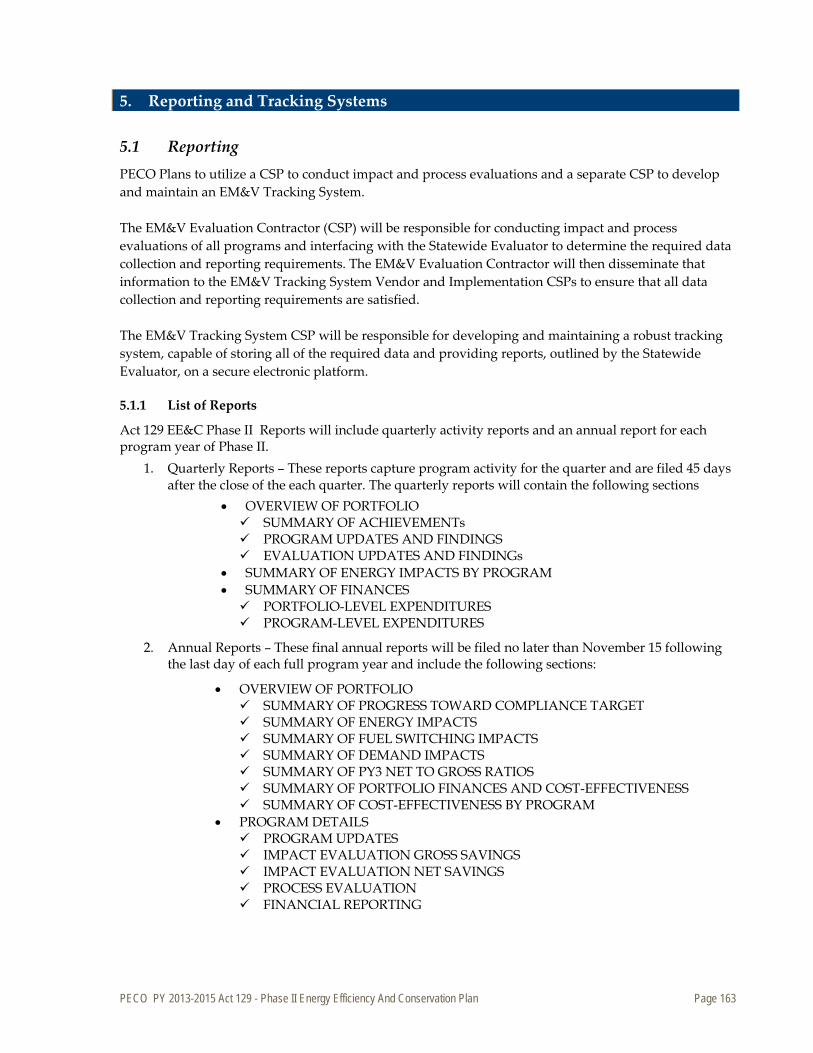
PECO PY 2013-2015 Act 129 - Phase II Energy Efficiency And Conservation Plan Page 163
5. Reporting and Tracking Systems
5.1 Reporting PECO Plans to utilize a CSP to conduct impact and process evaluations and a separate CSP to develop and maintain an EM&V Tracking System. The EM&V Evaluation Contractor (CSP) will be responsible for conducting impact and process evaluations of all programs and interfacing with the Statewide Evaluator to determine the required data collection and reporting requirements. The EM&V Evaluation Contractor will then disseminate that information to the EM&V Tracking System Vendor and Implementation CSPs to ensure that all data collection and reporting requirements are satisfied. The EM&V Tracking System CSP will be responsible for developing and maintaining a robust tracking system, capable of storing all of the required data and providing reports, outlined by the Statewide Evaluator, on a secure electronic platform.
5.1.1 List of Reports
Act 129 EE&C Phase II Reports will include quarterly activity reports and an annual report for each program year of Phase II.
1. Quarterly Reports – These reports capture program activity for the quarter and are filed 45 days after the close of the each quarter. The quarterly reports will contain the following sections
• OVERVIEW OF PORTFOLIO SUMMARY OF ACHIEVEMENTs PROGRAM UPDATES AND FINDINGS EVALUATION UPDATES AND FINDINGs
• SUMMARY OF ENERGY IMPACTS BY PROGRAM • SUMMARY OF FINANCES PORTFOLIO-LEVEL EXPENDITURES PROGRAM-LEVEL EXPENDITURES
2. Annual Reports – These final annual reports will be filed no later than November 15 following the last day of each full program year and include the following sections:
• OVERVIEW OF PORTFOLIO SUMMARY OF PROGRESS TOWARD COMPLIANCE TARGET SUMMARY OF ENERGY IMPACTS SUMMARY OF FUEL SWITCHING IMPACTS SUMMARY OF DEMAND IMPACTS SUMMARY OF PY3 NET TO GROSS RATIOS SUMMARY OF PORTFOLIO FINANCES AND COST-EFFECTIVENESS SUMMARY OF COST-EFFECTIVENESS BY PROGRAM
• PROGRAM DETAILS PROGRAM UPDATES IMPACT EVALUATION GROSS SAVINGS IMPACT EVALUATION NET SAVINGS PROCESS EVALUATION FINANCIAL REPORTING
PECO PY 2013-2015 Act 129 - Phase II Energy Efficiency And Conservation Plan Page 164
3. Reporting Schedule – All Act 129 EE&C Phase II reports shall be filed with the Secretary, with a copy provided to the SWE, Further, all reports shall be posted to the PECO website. Reporting for each program year of Phase II shall follow the schedule below:
Quarterly Reports • October 15 - First Quarterly Report including Phase II activity beginning June
and ending August • January 15 – Second Quarterly Report including Phase II activity beginning
September and ending November • April 15 – Third Quarterly Report including Phase II activity beginning
December and ending February • July 15 - Quarterly Report including Phase II activity beginning June and ending
May
Annual Report • November 15 - Final Annual Report including Phase II activity beginning June
and ending May
5.1.2 Data Submissions
Please refer to sections 5.2.1 and 5.2.2 for data that would be available to the Commission and its Statewide Evaluator.
5.2 Project Management Tracking Systems This section presents the EM&V Tracking System requirements that PECO anticipates will meet internal and external (Statewide Evaluator) needs.
5.2.1 Data Tracking System Overview
The EM&V Tracking System will provide a variety of standard reports as well as support an ad hoc query and report development process. The standard reports will support PECO’s tracking of incentive commitments, incentives paid, and kWh and kW achieved as well as other pertinent data.
Examples of standard reports include, but are not limited to:
» Incentives committed year-to-date and current reporting period » kWh and kW achieved year-to-date and current reporting period » Incentives paid out year-to-date and current reporting period » kWh and kW variance reports, by vendor, by program element, by measure » kWh and kW incentive forecast based on application completion dates » MW of demand reduction resources based on program performance
In addition to the report functions, it is expected that the system would also be capable of exporting data for use in other software (e.g. Microsoft Excel). The primary critical metric is that all financial components of the programs will be tracked. For this reason, tracking of incentives, paid during any Plan year, is a critical component for this system. All of PECO’s programs are subject to strict budgetary controls and oversight. The EM&V Tracking System will ensure and adhere to parameters and specified protocols. In addition, implementation, administrative, and forecasts will be tracked to ensure all elements of the program qualify for cost recovery treatment.
PECO PY 2013-2015 Act 129 - Phase II Energy Efficiency And Conservation Plan Page 165
The second critical metric that will be tracked is total kWh of energy conservation and kW of demand reductions achieved. PECO’s programs will use both deemed and partially deemed savings values and custom measure values. Deemed savings values will be provided by the Technical Reference Manual (TRM) in two ways: 1) table based pre-calculated savings and reductions that could be loaded into the database and updated periodically as the TRM is updated, and 2) formula based savings and reductions that will need a calculation to determine the savings and/or reductions based on variable inputs – the formulas would reside in the database and be updated periodically as the TRM is updated. Custom measures will all be formula based but the formulas will not be standardized so that the system would allow for direct entry of kWh savings and kW reductions for each measure.
5.2.2 Software Format, Data Exchange Format and Database Structure
The EM&V tracking system will receive data from PECO’s customer Billing and Data Management Systems. PECO’s Customer Information and Marketing System (CIMS) and Chronological Energy Demand Activity Repository (CEDAR) are customer information management systems that are Mainframe/MVS based. The data is stored in a DB2 (relational model database server) system. There are two standard interface methods with CIMS:
» File transfer o The CSP must have a file transfer protocol (FTP) server where a CIMS batch process can
either send to or receive files from. o The CSP must be able to support the following secure file transfer process:
Secure file transfer protocol (SFTP); or FTP with a Procedures Generation Package (PGP) encrypted file process.
o The files must be standard text files. » Extensible Mark-up Language (XML) communication.
PECO’s internal customer systems include: CIMS, CEDAR, and Customer Data Warehouse (CDW). It is anticipated that the EM&V Tracking System will need to track a number of items that facilitate effective project tracking and regulatory reporting. This data will also support PECO’s Quality Assurance process as well as Evaluation, Measurement and Verification requirements. PECO envisions data being collected at several levels including, but not limited to, the following:
» Customer
» Class » Building or Premise » Program » Measure » Service Point » Interval Meter/Historical Usage » Meter Reading Types » CSP Invoices
It is expected that this hierarchy would interface with PECO’s existing CIMS, and must facilitate future data analyses. PECO will provide an initial population of customer, premise and account data that would be used to qualify customers for programs. Some of the fields in the initial data set are expected to include, but not be limited to, the following:
PECO PY 2013-2015 Act 129 - Phase II Energy Efficiency And Conservation Plan Page 166
» Bill Account Number » Customer Number » Premise Number » Customer First Name » Customer Last Name » Customer Name Compressed (for Commercial Accounts) » Premise Address 1 » Premise Address 2 » Premise City » Premise State » Premise Zip Code » Customer Primary Phone Number » Customer Alternate Phone Number » County of Premise Address » Code for Type of Premise (Residential or Commercial Premise) » Code for Rate Information
Additional data would then be entered by the CSP or PECO to complete the application process. In addition to the pertinent data listed above, it is anticipated that the EM&V Tracking System would also track application status, such that PECO will be able to identify progress at each point from initiation to completion. PECO will provide a full set of customer data information in regular bases to update CSP records.
5.2.3 Access for Commission and Statewide Plan Evaluator
DSM program information will be available for review by the Commission and Statewide Evaluator upon request. PECO will provide select customer account data to the EM&V Tracking System Vendor as part of the customer validation process for application enrollment. This data must be considered highly confidential and must be protected against unauthorized access or disclosure. In addition, all of the data collected from CSPs related to PECO’s programs will be considered confidential and subject to the same protections. Security processes and protocols will be established to secure all data from unauthorized access. PECO and the EM&V Tracking System Vendor will jointly develop processes for data backup and disaster recovery. An anticipated key to the real-time data aspects of the EM&V Tracking System will be a web-based interface for the CSP and/or third-party vendors. Such a thin-client platform will support the central location of all data and help maintain currency for tracking, reporting and fulfillment. PECO Plans to provide some level of linking between the tracking interface and its existing PECO websites. As such, the web client is expected to have a look and feel that is similar to PECO’s other websites. PECO will provide the specifications for this requirement to the selected EM&V Tracking System Vendor. PECO envisions integrating the user interface components of the EM&V Tracking System website more fully into PECO’s website. While on-line data entry is the preferred method for this system, PECO acknowledges that there are situations where access to the web may be limited or non-existent. It is expected that the tracking system would be designed with consideration for limited use of off-line data entry. This may be accommodated via a software solution or by using off-line electronic forms (e.g., Adobe Acrobat forms). It is expected
PECO PY 2013-2015 Act 129 - Phase II Energy Efficiency And Conservation Plan Page 167
that the EM&V Tracking System will offer an off-line solution for CSPs and users. Such a solution will include a process for ensuring timely updates of the on-line database from off-line tools. It is expected that vendors will be capable of using this system to input projects and determine incentives on behalf of their customers. The interface would facilitate easy retrieval of project information by vendors. It would also facilitate vendor tracking of projects by status, giving the vendors a tool to manage multiple customer projects. It is possible that a single project may contain multiple measures, with more than one vendor fulfilling different measures. PECO and the EM&V Tracking System Vendor will address such situations so that a vendor cannot arbitrarily access other vendor’s measures or projects.
PECO PY 2013-2015 Act 129 - Phase II Energy Efficiency And Conservation Plan Page 168
6. Quality Assurance and Evaluation, Measurement and Verification
6.1 Quality Assurance/Quality Control PECO will incorporate quality assurance/quality control (QA/QC) into the implementation of this Energy Efficiency and Conservation Plan. The Plan proposes an infrastructure for monitoring program activity that identifies key components and explicitly identifies the relationships among them. The importance of this is to establish the role that each contributor will have and to facilitate communication between the implementation CSPs, the database vendor, program evaluators, and the Statewide Evaluator.
6.1.1 Overall Approach to Quality Assurance/Quality Control
PECO will leverage the experience of program implementation professionals by selecting CSPs to implement the programs in this Plan who have the following qualifications:
» Demonstrated experience in implementing programs for the specific target market associated with the program
» Demonstrated understanding of the measures and features of the program the CSP will implement
» Existing relationships and experience in establishing relationships with upstream equipment suppliers and contractors, as appropriate for the program
» Experience in providing and/or coordinating training by other qualified providers about the program and measures to program delivery channels (e.g., equipment suppliers, contractors, auditors) and the target participant market
» Capabilities for processing incentives. PECO and the CSPs will develop specific protocols and procedures for the implementation of each program. These will govern various aspects of the program implementation, including:
» CSP representation of PECO » appropriate outreach methods » development and content of promotional messages » assessment of participant/project eligibility » procedures for site visits and audits » required documentation and reporting of program activities » data collection, maintenance, and entry in PECO’s program database, for projects and rebate
applications » handling of incentive applications » addressing customer and equipment supplier/contractor satisfaction, problems, and complaints
Verification of project eligibility and proper installation, and operation of measures is important. Documentation of purchases and verifications done will ensure that programs are implemented in top quality fashion and will provide the basis for defensible program evaluations. Specific procedures for verification, documentation, and feedback from participants and upstream suppliers are described below.
PECO PY 2013-2015 Act 129 - Phase II Energy Efficiency And Conservation Plan Page 169
PECO will contract with an EM&V contractor before the programs are launched. PECO’s EM&V contractor shall conduct unbiased independent estimations of verified gross energy impacts on all programs. Estimations of verified gross energy impacts will be based on statistically significant verified savings measured as described in the EM&V contractor’s Plan to be developed prior to Phase II program implementation. The EM&V Plan will contain a detailed evaluation methodology for each program, including definition of the impact and process evaluation methods they will employ and the data needed to support them. Then, prior to the launch of each program, the implementation CSP will know what data PECO will need to be tracked and the Database Vendor will be able to accommodate housing of those data. Having the evaluation Plan completed and available to the PECO and CSP staff for each program will help ensure that the implementers will maintain appropriate and high quality records so that savings can be verified.
6.1.2 Procedures for Measure and Project Installation Verification, QA/QC and Savings Documentation
Although the procedures for measure and project installation verification, quality assurance and control, and savings documentation will vary by program and measure, it is anticipated that the general process outlined below will be applied to impact evaluations:
» A random sampling of customers for on-site evaluations will be determined utilizing statistical methods consistent with established state protocols.
» Pre-evaluation data gathering and preparation of field data forms will be performed. » On-site measure and project installation verifications will be performed, and equipment
nameplate data and other pertinent data will be collected. » Equipment data will be cross-referenced with customer application data contained in the
tracking system for accuracy. » Equipment operational tests will be observed and noted. » Quality of the equipment installation will be noted. » For prescriptive measures, data will be analyzed, and measure savings will be calculated using
the methodologies and algorithms detailed in the TRM. » For custom measures, energy simulation modeling (such as eQuest or DOE-2) or pre/post-
measure metering will be required to determine measure savings.
6.1.3 Process for Collecting and Addressing Participant, Contractor and Trade Ally Feedback
It is anticipated that the general process outlined below will be applied to process evaluations: » At a minimum, a sampling of participants, non-participants, contractors and trade ally staff will
be interviewed to support the process evaluation. » A random sampling of customers for surveys will be determined utilizing common statistical
methods. » Telephone, in-person or on-line surveys of participants will be conducted to understand their
satisfaction with the program, why they chose to participate, how the program could be improved and their views on the incentive levels.
» Similarly, non-participants will be surveyed to understand why they chose not to participate, their views on incentive levels (and at what level of incentive would be necessary to move them to participate), and recommendations on how to improve the program. This information is valuable in understanding market barriers that inhibit greater acceptance of the measures.
» Contractors and trade allies will be interviewed to gauge their understanding of how the program works and to get front-line assessment of the market. Suggestions on program
PECO PY 2013-2015 Act 129 - Phase II Energy Efficiency And Conservation Plan Page 170
improvement, staff motivation, contractor incentives and customer attitudes will provide valuable feedback in the evaluation.
» The data will be analyzed and process improvement recommendations will be outlined.
6.2 Market and Process Evaluations Market and process evaluations will be conducted for each program throughout the life of the program. These will examine satisfaction with and the effectiveness of the:
» Program design and protocols for implementation » Market characteristics » Implementation of those protocols and procedures » Marketing materials and strategies » Outreach and recruitment activities » Documentation and compliance with incentive eligibility requirements » Processing and timely payment of incentives
The process evaluations conducted during the operation of the programs will be used to improve their program design (e.g., modify measures offered, eligibility requirements) and implementation procedures (e.g., modify recruitment, advertising methods, monitoring, database maintenance) within this Planning cycle. Final process evaluations will be used to revise the programs, as appropriate, for the next Planning period. They will assess the effectiveness of using CSPs to implement programs, identify additional opportunities for CSPs to support program development and/or activities (e.g. provide technical expertise, contractors/auditor/staff training, marketing strategies and materials, specific promotional events). The frequency and schedule of the process evaluations will be determined for each program individually. Process evaluations will be conducted by the implementation CSP to help maintain best practices, and annually by the independent EM&V contractor that PECO hires and the Statewide Evaluator. Additionally, the EM&V contractor will annually conduct impact evaluations to document and verify net energy and demand savings associated with the programs. The EM&V contractor will interact with the Statewide Evaluator to make sure that the reporting protocols are in alignment with the state requirements.
6.3 Strategy for Coordinating with Statewide Evaluator The schematic of the documentation and EM&V infrastructure in Section 6.1 explicitly includes and shows the role of the Statewide Evaluator.
The program database will contain data on the prescriptive and custom measures as well as projects performed within each program in the Plan. To the extent feasible and appropriate, the Statewide Evaluator will be consulted to ensure that the database will contain information relevant and needed for evaluation of the programs.
The individual program descriptions contained in Section 3 of this report address the considerations associated with these evaluations. The EM&V Vendor and the Statewide Evaluator will use the most appropriate methods for determining the impacts of the different programs in the Plan.
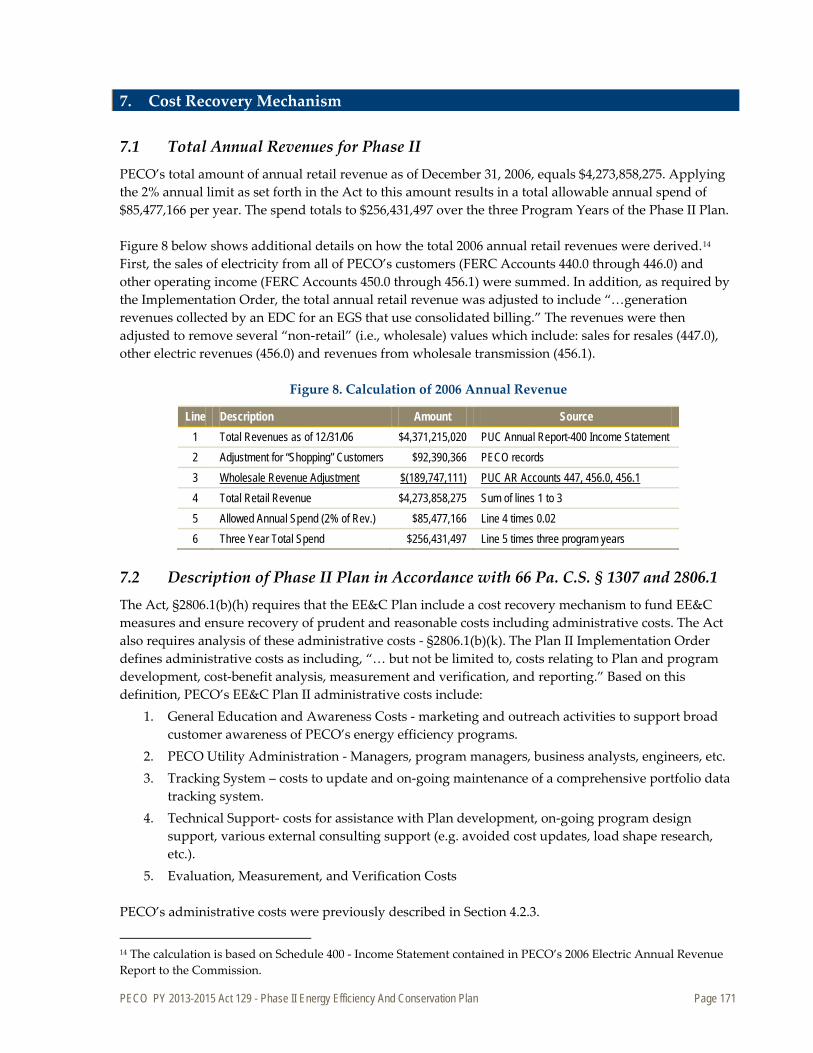
PECO PY 2013-2015 Act 129 - Phase II Energy Efficiency And Conservation Plan Page 171
7. Cost Recovery Mechanism
7.1 Total Annual Revenues for Phase II PECO’s total amount of annual retail revenue as of December 31, 2006, equals $4,273,858,275. Applying the 2% annual limit as set forth in the Act to this amount results in a total allowable annual spend of $85,477,166 per year. The spend totals to $256,431,497 over the three Program Years of the Phase II Plan. Figure 8 below shows additional details on how the total 2006 annual retail revenues were derived.14
First, the sales of electricity from all of PECO’s customers (FERC Accounts 440.0 through 446.0) and other operating income (FERC Accounts 450.0 through 456.1) were summed. In addition, as required by the Implementation Order, the total annual retail revenue was adjusted to include “…generation revenues collected by an EDC for an EGS that use consolidated billing.” The revenues were then adjusted to remove several “non-retail” (i.e., wholesale) values which include: sales for resales (447.0), other electric revenues (456.0) and revenues from wholesale transmission (456.1).
Figure 8. Calculation of 2006 Annual Revenue
Line Description Amount Source 1 Total Revenues as of 12/31/06 $4,371,215,020 PUC Annual Report-400 Income Statement 2 Adjustment for “Shopping” Customers $92,390,366 PECO records 3 Wholesale Revenue Adjustment $(189,747,111) 4
PUC AR Accounts 447, 456.0, 456.1 Total Retail Revenue $4,273,858,275 Sum of lines 1 to 3
5 Allowed Annual Spend (2% of Rev.) $85,477,166 Line 4 times 0.02 6 Three Year Total Spend $256,431,497 Line 5 times three program years
7.2 Description of Phase II Plan in Accordance with 66 Pa. C.S. § 1307 and 2806.1 The Act, §2806.1(b)(h) requires that the EE&C Plan include a cost recovery mechanism to fund EE&C measures and ensure recovery of prudent and reasonable costs including administrative costs. The Act also requires analysis of these administrative costs - §2806.1(b)(k). The Plan II Implementation Order defines administrative costs as including, “… but not be limited to, costs relating to Plan and program development, cost-benefit analysis, measurement and verification, and reporting.” Based on this definition, PECO’s EE&C Plan II administrative costs include:
1. General Education and Awareness Costs - marketing and outreach activities to support broad customer awareness of PECO’s energy efficiency programs.
2. PECO Utility Administration - Managers, program managers, business analysts, engineers, etc. 3. Tracking System – costs to update and on-going maintenance of a comprehensive portfolio data
tracking system. 4. Technical Support- costs for assistance with Plan development, on-going program design
support, various external consulting support (e.g. avoided cost updates, load shape research, etc.).
5. Evaluation, Measurement, and Verification Costs PECO’s administrative costs were previously described in Section 4.2.3.
14 The calculation is based on Schedule 400 - Income Statement contained in PECO’s 2006 Electric Annual Revenue Report to the Commission.
PECO PY 2013-2015 Act 129 - Phase II Energy Efficiency And Conservation Plan Page 172
7.3 Data Tables
Appendix C contains the following data tables as required by the Commission’s EE&C Plan template: » Table C-6A: Portfolio Specific Assignment of EE&C Costs (PY2013-2015) » Table C-6B: Allocation of Common Costs to Applicable Customer Sectors (PY2013-2015) » Table C-6C: Summary of Portfolio EE&C Costs (PY2013-2015)
7.4 Tariffs and Section 1307 Cost Recovery Mechanism for Phase II Plan
7.4.1 Tariffs
As part of the implementation of PECO’s Energy Efficiency and Conservation Plan (“EE&C Phase II” or “Phase II”), PECO proposes to use a tariff cost recovery mechanism similar to that used for EE&C Phase I. The Phase I Energy Efficiency Cost Recovery tariff and mechanism however requires a few revisions that are described below. See PECO Statement No. 3, Exhibit RAS-1, for a copy of the proposed Electric Service Tariff which contains the revised tariff provisions designed to implement PECO’s proposed EE&C Phase II Plan. A high-level summary description of the cost recovery mechanism was described in Section 1.7. However, additional details on the Section 1307 cost recovery mechanism, calculations and supporting cost documentation are provided in this section.
7.4.2 Cost Recovery Mechanism
PECO proposes to recover the cost of its EE&C Phase II Plan through an Energy Efficiency & Conservation Program Charge (“EEPC”) in a manner similar to that used in Phase I. The EEPC in Phase I was designed to comply with Section 1307 of the Public Utility Code and was reconcilable and non-bypassable. As required by the Commission in PECO’s EE&C Phase I Final Order, Docket No. M-2009-2093215, the EEPC was not a separate line item on residential customers’ bills and was not included in the price to compare. Instead, residential customers’ distribution rates were adjusted by the amount of the charge calculated for each rate class. For small commercial customers, the EEPC was based on energy use or kWh. For large commercial customers, the charge was based on a PJM Peak Load Contribution (“PLC”). The EEPC was listed as a separate item on small and large commercial customer’s bills and was not included in the price to compare. For EE&C Phase II Plan, PECO proposes to follow the same format as used in Phase I. The revised cost recovery mechanism for Phase II is shown in the proposed Electric ServiceTariff at page 40C. The tariff language provides a description of the cost recovery method, the formula for calculating the charge and the charges specific to each rate class. PECO Exhibit RAS-2 contains a summary of the projected expenditures for each of the 13 Programs across these rate classes. The cost recovery rates were developed based on the total program expenditures allocated to each rate class for the duration of the Plan. To develop the recovery charge for each rate class, the total expenditure for that class was divided by the appropriate projected class billing units for the period from June 1, 2013 through May 31, 2016. The resulting charge per billing unit was grossed up to provide for recovery of Pennsylvania Gross Receipts Tax. This calculation produces a charge that will recover the total expenditures on a levelized basis over the recovery period.
PECO PY 2013-2015 Act 129 - Phase II Energy Efficiency And Conservation Plan Page 173
The Phase II Implementation Order requires PECO to remove the Statewide Evaluator (“SWE”) costs from the EE&C Phase II budget in a same manner as was done in Phase I. 15
PECO will thus track the Phase II SWE costs separately from the EE&C costs but will still recover them through the EEPC.
The Phase II SWE costs will be determined through an RFP bidding process that will have a contract effective as of March 1, 2013. Until the final SWE costs are known, PECO has included an estimate of these costs for the Phase II EEPC. PECO has used the same costs ($2.6M) as that used for the Phase I SWE. PECO Exhibit RAS-3 contains the detailed calculations for the development of the EE&C cost recovery charges for each class as well as the SWE costs which are reflected as a separate line item.
7.4.3 True-Up
For Phase II Plan, PECO proposes to develop a levelized cost, similar to Phase I, so that the EEPC can remain constant in each of the three program years. PECO’s Phase II Plan program costs will not be reconciled to the yearly revenues collected from the EEPC. A final true-up adjustment is Planned at the end of the EE&C Plan on May 31, 2016. A revised recovery rate will be established which will run from June 1, 2016 to May 31, 2017 to adjust for any Phase II under or over recoveries that exist. This will allow for the start of a new recovery mechanism if the Commission adopts new incremental consumption requirements as allowed by the Act at 2806.1(b)(II). The goal is to recover on average $85.5M per year for the three program years. The actual program spend however is expected to vary each year in accordance with PECO’s EE&C Phase II Plan.
7.5 Cost Recovery Mechanism PECO’s cost recovery mechanism for its EE&C Plan is designed to ensure that measures are paid for by the same customer class(es) that receive the EE&C benefits. This is accomplished by creating separate EE&C charges for the residential class, the Small Commercial/Industrial class, for the Large Commercial/Industrial class, and for the Municipal Lighting class that are based on only the cost of the measures that apply to each class See PECO Exhibits RAS-2 and RAS-3, for allocation of program costs by rate class and for the spreadsheet that shows how the EEPC was developed for each customer class according to the method just described. PECO proposes to start the recovery period for Plan II with bills sent to customers during July 2013 (June usage) and will continue through bills sent to customers in June 2016 (May usage).
7.6 Accounting for Phase II Costs verses Phase I Costs In accordance with Final Implementation Order, PECO must provide a description of how Phase II costs will be accounted for separate from Phase I costs . In order meet this requirement, PECO will do the following:
» PECO will account for the Phase II costs and revenues on its books separately from Phase I, by setting up new general ledger accounts for Phase II costs and revenues. Thus there will be no comingling of Phase I and Phase II costs or funds in PECO’s accounting records.
» Phase I and Phase II costs and revenues will also be clearly identified and tracked separately in the EEPC cost recovery and reconciliation mechanism. Thus the Phase II costs will be reconciled against the Phase II funds collected. See Exhibit RAS-1.
15 EE&C Plan II Implementation Order, Pgs. 69-70
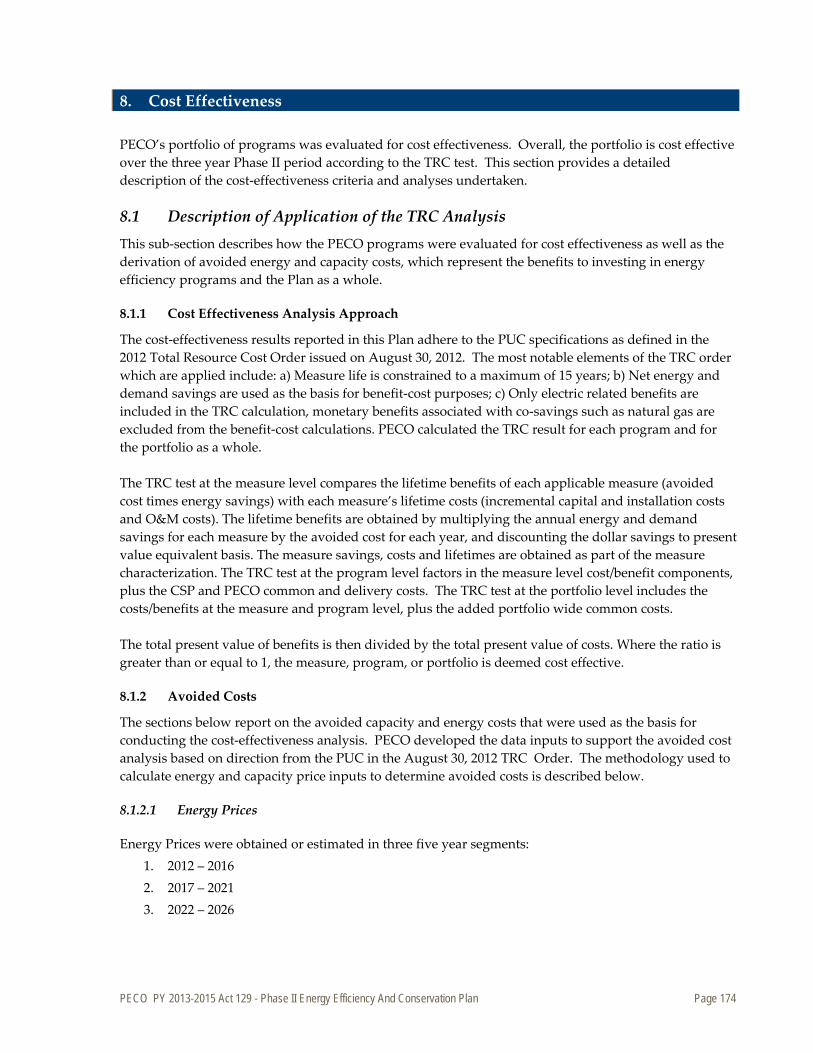
PECO PY 2013-2015 Act 129 - Phase II Energy Efficiency And Conservation Plan Page 174
8. Cost Effectiveness
PECO’s portfolio of programs was evaluated for cost effectiveness. Overall, the portfolio is cost effective over the three year Phase II period according to the TRC test. This section provides a detailed description of the cost-effectiveness criteria and analyses undertaken.
8.1 Description of Application of the TRC Analysis This sub-section describes how the PECO programs were evaluated for cost effectiveness as well as the derivation of avoided energy and capacity costs, which represent the benefits to investing in energy efficiency programs and the Plan as a whole.
8.1.1 Cost Effectiveness Analysis Approach
The cost-effectiveness results reported in this Plan adhere to the PUC specifications as defined in the 2012 Total Resource Cost Order issued on August 30, 2012. The most notable elements of the TRC order which are applied include: a) Measure life is constrained to a maximum of 15 years; b) Net energy and demand savings are used as the basis for benefit-cost purposes; c) Only electric related benefits are included in the TRC calculation, monetary benefits associated with co-savings such as natural gas are excluded from the benefit-cost calculations. PECO calculated the TRC result for each program and for the portfolio as a whole. The TRC test at the measure level compares the lifetime benefits of each applicable measure (avoided cost times energy savings) with each measure’s lifetime costs (incremental capital and installation costs and O&M costs). The lifetime benefits are obtained by multiplying the annual energy and demand savings for each measure by the avoided cost for each year, and discounting the dollar savings to present value equivalent basis. The measure savings, costs and lifetimes are obtained as part of the measure characterization. The TRC test at the program level factors in the measure level cost/benefit components, plus the CSP and PECO common and delivery costs. The TRC test at the portfolio level includes the costs/benefits at the measure and program level, plus the added portfolio wide common costs. The total present value of benefits is then divided by the total present value of costs. Where the ratio is greater than or equal to 1, the measure, program, or portfolio is deemed cost effective.
8.1.2 Avoided Costs
The sections below report on the avoided capacity and energy costs that were used as the basis for conducting the cost-effectiveness analysis. PECO developed the data inputs to support the avoided cost analysis based on direction from the PUC in the August 30, 2012 TRC Order. The methodology used to calculate energy and capacity price inputs to determine avoided costs is described below.
8.1.2.1 Energy Prices
Energy Prices were obtained or estimated in three five year segments: 1. 2012 – 2016 2. 2017 – 2021 3. 2022 – 2026
PECO PY 2013-2015 Act 129 - Phase II Energy Efficiency And Conservation Plan Page 175
Monthly energy prices for each of the calendar years during 2012-2021 were calculated using futures prices quoted by the New York Mercantile Exchange (“NYMEX”) as of September 14, 2012.16
Table 8
For 2022 – 2026, annual prices were calculated by converting data from the Energy Information Administration into monthly prices. These monthly prices were then combined into four time periods corresponding to Winter On-Peak, Winter Off-Peak, Summer On-Peak and Summer Off-Peak, based on the data provided in draft versions of the Pennsylvania TRM, as shown in below. These seasonal avoided energy costs were then divided into program years, from June 2012 – June 2027.17
Table 8: Periods for Energy and Coincident Peak Demand Savings
Period Energy Savings Coincident Peak Demand Savings Summer May through September June through September Winter October through April N/A Peak 8:00 a.m. to 8:00 p.m. Mon. – Fri. 12:00 p.m. to 8:00 p.m.
Off-Peak 8:00 p.m. to 8:00 a.m. Mon. – Fri. 12 a.m. to 12 p.m. Sat/Sun & holidays N/A
2012 – 2016:
PECO Zone energy futures prices, both on-peak and off-peak, were taken from NYMEX for energy prices for 2012-2016, as these are the years for which both on-peak and off-peak PECO Zone energy futures prices were fully available.
2017 – 2021:
For the calendar years between and including 2017-2021, NYMEX did not report PECO Zone energy futures prices for both the on-peak and off-peak periods, but NYMEX did report Henry Hub natural gas futures prices by month extending through December 2021. Monthly electricity prices were calculated by first calculating annual electricity prices, by averaging the monthly natural gas futures prices and multiplying a heat rate for a combustion turbine18
, as well as subtracting a correction factor. The correction factor was calculated by comparing the calculated electricity price, using the future gas price and heat rate, for the 2012 – 2016 period with the future PECO Zone NYMEX prices. These annual electricity prices were then proportioned into each month based on the ratios of monthly to average annual prices for the 2012 – 2016 period.
2022 – 2026:
The monthly electricity prices for the 2022 – 2026 period were calculated in the same way as the 2017 – 2021 period, however instead of the using NYMEX natural gas futures, annual natural gas prices were taken from the Energy Information Administrations, Annual Energy Outlook 2011.19
16 The data source for all prices quoted by NYMEX is the Ventyx Velocity Suite.
17 This required extending the calendar year forecast from 2012 – 2026 by six months. All monthly energy values were assumed to grow at a 2% rate of inflation. 18 The heat rate was based on a combustion turbine heat rate of 10,450 Btu/kWh as per the Energy Information Administration, http://www.eia.gov/forecasts/aeo/assumptions/pdf/electricity.pdf 19 Annual Energy Outlook 2011, Report Number: DOE/EIA-0383 (2011), http://www.eia.gov/forecasts/aeo/data.cfm
PECO PY 2013-2015 Act 129 - Phase II Energy Efficiency And Conservation Plan Page 176
8.1.2.2 Capacity Prices
The capacity prices were based on capacity prices cleared in PJM’s Reliability Pricing Model (“RPM”) base residual auctions, as well as other data published by PJM. For each June-May year during the period ending in May 2014, the RPM base residual auction prices applicable to the PECO Zone were used. Since no base residual auctions have been held for June-May years after May 2014, the capacity prices for these years were calculated by escalating the May 2014 capacity price. The escalation factor used, consistent with the 2012 TRC order, was calculated from a five year rolling average of the producer price index data for Electric Power Generation calculated by the Bureau of Labor Statistics.20
8.1.2.3 Transmission and Distribution
PECO utilized avoided transmission and distribution charges that are consistent with the direction provided in the 2012 TRC order. The 2012 TRC Order states [p. 13 and p. 14] that “. . . transmission prices, as set by FERC, to the EDC zone will be included as will EDC distribution rates.” PECO included transmission prices and EDC distribution rates as avoided costs in its TRC calculation, as shown in Table D-1 and Table D-2 in the Appendix. Data Tables
8.2 Data Tables Appendix C contains the following data tables as required by the Commission’s EE&C Plan template:
» Table C-7: TRC Benefits Table
20 Bureau of Labor Statistics, http://data.bls.gov/timeseries/PCU221110221110
PECO PY 2013-2015 Act 129 - Phase II Energy Efficiency And Conservation Plan Page 177
9. Plan Compliance Information and Other Key Issues
9.1 Plan Compliance
9.1.1 Description of Plan
As discussed in Section 3 of this document, PECO’s EE&C Plan provides energy efficiency and conservation programs to each of its customer classes, including specific programs for government, educational and non-profit entities, and for low-income households.21
9.1.2 Statement Delineating the EE&C Plan
The Plan portfolio contains financial incentives for energy efficient Residential and Commercial and Industrial equipment and construction, and financial incentives to promote retrofitting government buildings, schools, hospitals and non-profits with energy efficiency measures. PECO believes that its programs are equitably provided across its customer classes consistent with the Commission’s Implementation.
Section 2806.1(d) of Act 129 requires PECO to achieve 2.9% energy sales reduction by May 31, 2016, as measured against PECO’s actual forecasted consumption for June 1, 2009 through May 31, 2010 adjusted for weather and extraordinary loads. PECO’s Plan, as set forth in Section 3, is projected to meet or exceed its 2.9% consumption reduction target by May 31, 2016. This represents a total savings of at least 1,125,852 MWh by the end of Phase II. The Plan is projected to achieve these energy savings requirements of the Act through the use of a broad array of financial incentives. These incentives will be provided to PECO’s customers through CSPs, installation companies, and trade allies (e.g., HVAC contractors and retail stores).
9.1.3 Low-Income requirements
PECO’s Plan will meet the requirements of this section by using and building upon its existing Low Income Usage Reduction Program (“LIURP”). Specifically, as part of the Plan, PECO will increase the number of low-income customers receiving weatherization services (e.g., in-home energy audits and education) in its service territory, and will provide services to install CFLs for low-income customers, and install ENERGY STAR appliances for these customers, as applicable. PECO Plans that the low income program will meet the minimum requirement of 4.5% of total portfolio savings coming from this program area. 22
9.1.4 Government/Non-Profit requirements
Section § 2806.1(b)(1)(i)(B) of the Act requires that “[a] minimum of 10% of the required reductions in consumption . . . be obtained from units of Federal, State and local government, including municipalities, school districts, institutions of higher education and nonprofit entities.” PECO’s Plan will meet the provisions of this section by achieving the required 10% of the total energy efficiency Plan projected savings via its governmental and institutional energy efficiency programs.
21 Consistent with Act 129, PECO’s reference to low-income households means households at or below 150% of the Federal poverty income guidelines. See 66 Pa.C.S. 2806.1(b)(1)(i)(B). 22 See PECO’s Discussion in Sections 3 and 4 of this document for a detailed description of its EE&C programs and its implementation strategy.
PECO PY 2013-2015 Act 129 - Phase II Energy Efficiency And Conservation Plan Page 178
9.1.5 Spending on experimental equipment or devices limited to two percent
As noted in section 4.1.2., PECO developed its Plan by benchmarking proven programs and technologies from states such as California, Vermont and New York. Accordingly, since PECO’s Plan focuses on known technologies and products, it is not anticipating the use of experimental equipment and devices.
9.1.6 Competitively neutral to all electric distribution customers
With PECO's suite of energy efficiency programs will be available to all PECO electric distribution customers, regardless of whether they receive generation supply from PECO as a default service provider or an EGS.
9.2 Other Key Issues
9.2.1 Describe how this EE&C Plan will lead to long-term, sustainable energy efficiency savings in the EDC’s service territory and in Pennsylvania
PECO’s EE&C Plan was developed to meet or exceed the requirements of Act 129. In developing the EE&C Plan, PECO benchmarked successful utility DSM throughout the country, and selected measures and programs for inclusion in the Plan that have demonstrated a history of providing reliable, documented and sustainable energy and demand savings. The proposed Plan includes a variety of proven programs effective across all customer classes. PECO believes that providing programs along with comprehensive education will lead to long term sustainability through ongoing customer participation.
9.2.2 Describe how this EE&C Plan, and the EDC, will avoid possible overlaps between programs offered in different Pennsylvania EDC service territories as well as possible programs offered in neighboring states
While PECO’s EE&C Plan is unique and tailored towards the particular demographics of its customer base, PECO has taken steps to collaborate with other EDCs in Pennsylvania to offer common incentives for certain programs and measures, where it makes sense. For example, PECO has discussed the Smart Builder Rebates program design with First Energy, and Plans to offer a similar program eligibility threshold and incentive structure to simplify the messaging to the builder community. To limit the possibility of overlaps, PECO has included an educational and promotional component in its EE&C Plan, to promote general energy efficiency awareness and education, and provide program specific details to its customers.
9.2.3 Describe how this EE&C Plan will leverage and utilize other financial resources, including funds from other public and private sector energy efficiency and solar energy programs
PECO’s EE&C Plan program descriptions contain specific references to third-party financial resources and rebates such as Keystone HELP, the Redevelopment Fund/Sustainable Development Fund (TRF/SDF), and the Electrical Association of Philadelphia (EAP) among others. PECO will make this information available on its website as well as in general educational and program specific promotional materials.
9.2.4 Describe how the EDC will address consumer education for its programs
PECO has included a comprehensive consumer education program in its EE&C Plan. In addition to the Residential Behavior and School Education Programs, PECO will engage consumers through direct interactions as part of our continuous participation in community events throughout the PECO service territory. PECO’s Energy Efficiency Outreach team’s presence in the community builds general awareness of the programs as well as educates customers about how these programs can help them save
PECO PY 2013-2015 Act 129 - Phase II Energy Efficiency And Conservation Plan Page 179
on their energy bills. As part of the promotion of the various programs PECO Plans to include extensive education in all of its materials. In addition, the Plan includes website enhancements to include an update of both the online residential and commercial energy audits providing customers with one-stop shopping in tracking their energy savings and learning more ways to save.
9.2.5 Indicate how the EDC will provide a list of all eligible federal and state funding programs available to ratepayers for energy efficiency and conservation
PECO does now and will continue to include information regarding all known federal and state funding programs that could be available to ratepayers via the PECO company website.
9.2.6 Describe how the EDC will provide the public with information about the results from the programs
Once the Statewide Evaluator has completed its accepted annual reports, PECO will periodically issue press releases to inform the public of the progress of its EE&C Plan.

PECO PY 2013-2015 Act 129 - Phase II Energy Efficiency And Conservation Plan Page 180
Appendix A. PECO Electricity Consumption Forecast
PECO’s electricity consumption forecast for the period of June 1, 2009 through May 31st, 2010 is 39,385,000 MWh.
PECO PY 2013-2015 Act 129 - Phase II Energy Efficiency And Conservation Plan Page 181
Appendix B. CSP Contract(s)
Confidential. Submitted under separate cover.
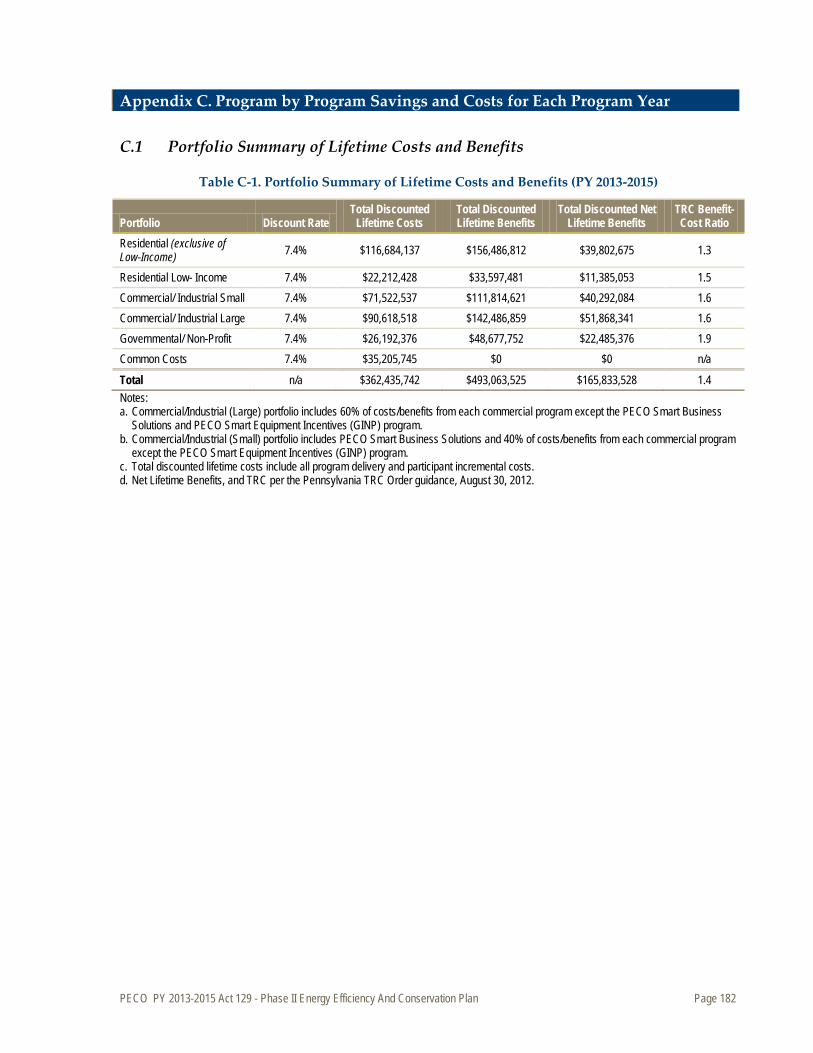
PECO PY 2013-2015 Act 129 - Phase II Energy Efficiency And Conservation Plan Page 182
Appendix C. Program by Program Savings and Costs for Each Program Year
C.1 Portfolio Summary of Lifetime Costs and Benefits
Table C-1. Portfolio Summary of Lifetime Costs and Benefits (PY 2013-2015)
Portfolio Discount Rate Total Discounted
Lifetime Costs Total Discounted Lifetime Benefits
Total Discounted Net Lifetime Benefits
TRC Benefit-Cost Ratio
Residential (exclusive of Low-Income) 7.4% $116,684,137 $156,486,812 $39,802,675 1.3
Residential Low- Income 7.4% $22,212,428 $33,597,481 $11,385,053 1.5 Commercial/ Industrial Small 7.4% $71,522,537 $111,814,621 $40,292,084 1.6 Commercial/ Industrial Large 7.4% $90,618,518 $142,486,859 $51,868,341 1.6 Governmental/ Non-Profit 7.4% $26,192,376 $48,677,752 $22,485,376 1.9 Common Costs 7.4% $35,205,745 $0 $0 n/a
Total n/a $362,435,742 $493,063,525 $165,833,528 1.4 Notes: a. Commercial/Industrial (Large) portfolio includes 60% of costs/benefits from each commercial program except the PECO Smart Business
Solutions and PECO Smart Equipment Incentives (GINP) program. b. Commercial/Industrial (Small) portfolio includes PECO Smart Business Solutions and 40% of costs/benefits from each commercial program
except the PECO Smart Equipment Incentives (GINP) program. c. Total discounted lifetime costs include all program delivery and participant incremental costs. d. Net Lifetime Benefits, and TRC per the Pennsylvania TRC Order guidance, August 30, 2012.
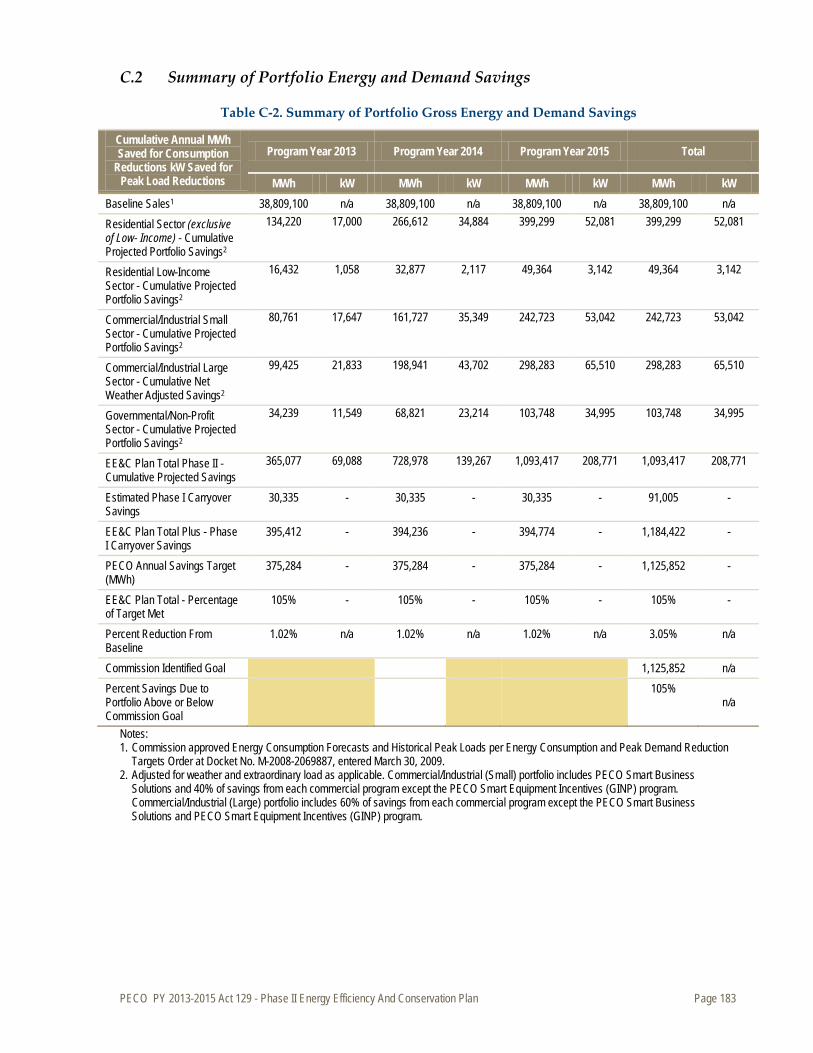
PECO PY 2013-2015 Act 129 - Phase II Energy Efficiency And Conservation Plan Page 183
C.2 Summary of Portfolio Energy and Demand Savings
Table C-2. Summary of Portfolio Gross Energy and Demand Savings
Cumulative Annual MWh Saved for Consumption
Reductions kW Saved for Peak Load Reductions
Program Year 2013 Program Year 2014 Program Year 2015 Total
MWh kW MWh kW MWh kW MWh kW Baseline Sales1 38,809,100 n/a 38,809,100 n/a 38,809,100 n/a 38,809,100 n/a Residential Sector (exclusive of Low- Income) - Cumulative Projected Portfolio Savings2
134,220 17,000 266,612 34,884 399,299 52,081 399,299 52,081
Residential Low-Income Sector - Cumulative Projected Portfolio Savings2
16,432 1,058 32,877 2,117 49,364 3,142 49,364 3,142
Commercial/Industrial Small Sector - Cumulative Projected Portfolio Savings2
80,761 17,647 161,727 35,349 242,723 53,042 242,723 53,042
Commercial/Industrial Large Sector - Cumulative Net Weather Adjusted Savings2
99,425 21,833 198,941 43,702 298,283 65,510 298,283 65,510
Governmental/Non-Profit Sector - Cumulative Projected Portfolio Savings2
34,239 11,549 68,821 23,214 103,748 34,995 103,748 34,995
EE&C Plan Total Phase II - Cumulative Projected Savings
365,077 69,088 728,978 139,267 1,093,417 208,771 1,093,417 208,771
Estimated Phase I Carryover Savings
30,335 - 30,335 - 30,335 - 91,005 -
EE&C Plan Total Plus - Phase I Carryover Savings
395,412 - 394,236 - 394,774 - 1,184,422 -
PECO Annual Savings Target (MWh)
375,284 - 375,284 - 375,284 - 1,125,852 -
EE&C Plan Total - Percentage of Target Met
105% - 105% - 105% - 105% -
Percent Reduction From Baseline
1.02% n/a 1.02% n/a 1.02% n/a 3.05% n/a
Commission Identified Goal
1,125,852 n/a Percent Savings Due to Portfolio Above or Below Commission Goal
105% n/a
Notes: 1. Commission approved Energy Consumption Forecasts and Historical Peak Loads per Energy Consumption and Peak Demand Reduction
Targets Order at Docket No. M-2008-2069887, entered March 30, 2009. 2. Adjusted for weather and extraordinary load as applicable. Commercial/Industrial (Small) portfolio includes PECO Smart Business
Solutions and 40% of savings from each commercial program except the PECO Smart Equipment Incentives (GINP) program. Commercial/Industrial (Large) portfolio includes 60% of savings from each commercial program except the PECO Smart Business Solutions and PECO Smart Equipment Incentives (GINP) program.

PECO PY 2013-2015 Act 129 - Phase II Energy Efficiency And Conservation Plan Page 184
C.3 Summary of Portfolio Costs
Table C-3. Summary of Portfolio Costs (PY 2013-2015)
Portfolio
Program Year 2013
Portfolio Budget
Program Year 2013
% Portfolio Budget
Program Year 2014
Portfolio Budget
Program Year 2014
% Portfolio Budget
Program Year 2015
Portfolio Budget
Program Year 2015
% Portfolio Budget
Residential Portfolio Annual Budget ($ and percent of Portfolio Budget)
$28,426,680 33% $29,801,146 35% $29,841,216 35%
Residential Low-Income Portfolio Annual Budget ($ and percent of Portfolio Budget)
$7,827,520 9% $7,953,602 9% $8,061,955 9%
Commercial/Industrial Small Portfolio Annual Budget ($ and percent of Portfolio Budget)
$12,494,703 15% $12,698,510 15% $12,881,243 15%
Commercial/Industrial Large Portfolio Annual Budget ($ and percent of Portfolio Budget)
$14,624,742 17% $14,826,519 17% $14,993,764 17%
Governmental/Non-Profit Portfolio Annual Budget ($ and percent of Portfolio Budget)
$7,966,225 9% $8,115,727 10% $8,268,819 10%
Total Portfolio-specific Budget
$71,339,870 84% $73,395,503 86% $74,046,997 86%
Portfolio Common Costs $13,704,087 16% $11,808,110 14% $12,136,931 14% Total Portfolio Annual Budget $85,043,957 100% $85,203,613 100% $86,183,928 100% Notes: Commercial/Industrial (Small) portfolio includes PECO Smart Business Solutions and 40% of spending from each commercial program except the PECO Smart Equipment Incentives (GINP) program. Commercial/Industrial (Large) portfolios include 60% of spending from each commercial program except the PECO Smart Business Solutions and PECO Smart Equipment Incentives (GINP) program.

PECO PY 2013-2015 Act 129 - Phase II Energy Efficiency And Conservation Plan Page 185
C.4 Program Summaries
Table C-4. Program Summaries
Program Name
Program Market Program Two Sentence Summary
Program Years
Operated Lifetime Gross MWh Savings
Peak Demand Gross kW Savings
Percentage of Portfolio and Total Lifetime MWh savings %
Residential Portfolio Programs (exclusive of Low Income)
PECO Smart Appliance Recycling
Residential
The PECO Smart Appliance Recycling program is designed to eliminate retention of old refrigeration equipment from operation as secondary units in homes and to ensure these units don’t re-enter the market place by providing safe disposal of these units. The program offers free pickup of units from residences plus customer incentives and education about the benefits of secondary unit disposal to encourage their participation.
2013-2015 317,846 5,033 11% 3%
PECO Smart Home Rebates Residential
The PECO Smart Home Rebates Program is designed to encourage and assist PECO's residential electric customers in improving the energy efficiency of their homes through a broad range of energy efficiency options that address all major energy end uses. This program offers cash rebates to residential electric customers who install high-efficiency electric equipment and upstream payments to lighting manufacturers. The program also engages equipment suppliers and contractors to promote the rebate-eligible equipment.
2013-2015 2,229,547 38,417 80% 20%
PECO Smart House Call Program
Residential
PECO proposes to launch the PECO Smart House Call program as part of a long-term strategy to address comprehensive energy efficiency improvements for existing residential electric customers. The SHC program targets all PECO residential electric customers with single-family detached, attached, and multi-family buildings with less than four individually metered units
2013-2015 119,986 1,642 4% 1%
PECO Smart Builder Rebates
Residential
The PECO Smart Builder Rebates program is intended to accelerate the adoption of energy efficiency in the design, construction and operation of new single-family electrically heated homes by leveraging the EPA’s ENERGY STAR® Homes certification.
2013-2015 6,134 59 0.22% 0.1%
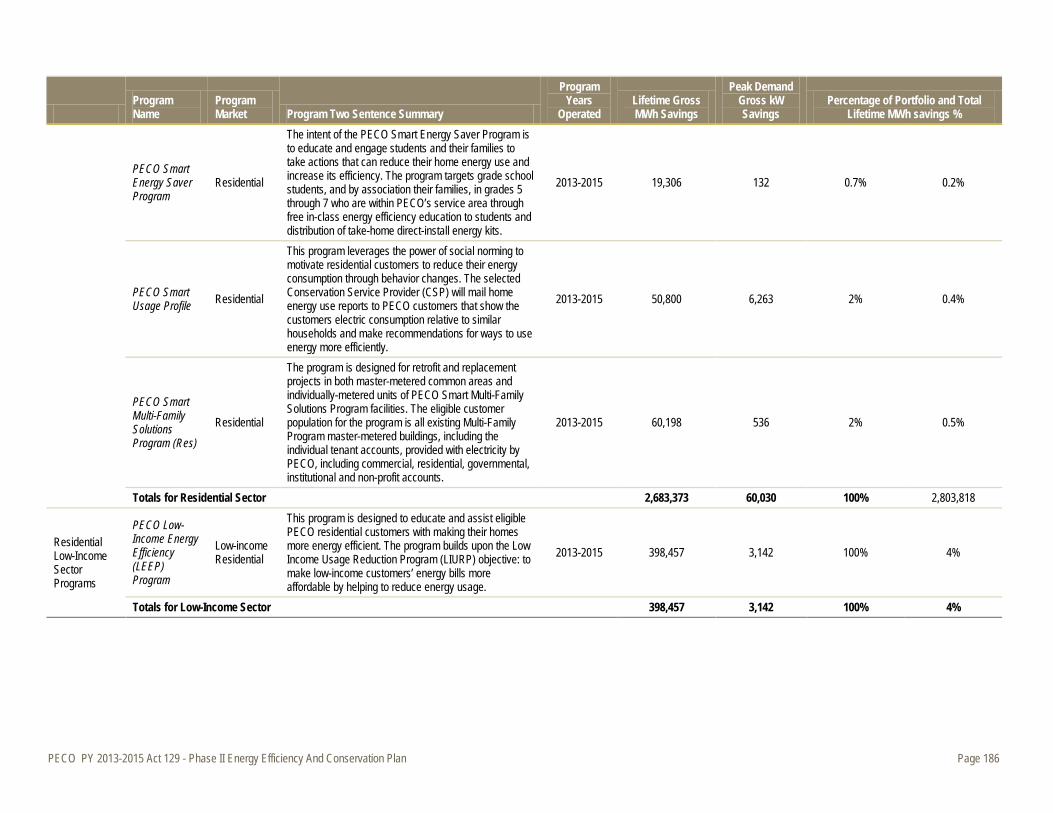
PECO PY 2013-2015 Act 129 - Phase II Energy Efficiency And Conservation Plan Page 186
Program Name
Program Market Program Two Sentence Summary
Program Years
Operated Lifetime Gross MWh Savings
Peak Demand Gross kW Savings
Percentage of Portfolio and Total Lifetime MWh savings %
PECO Smart Energy Saver Program
Residential
The intent of the PECO Smart Energy Saver Program is to educate and engage students and their families to take actions that can reduce their home energy use and increase its efficiency. The program targets grade school students, and by association their families, in grades 5 through 7 who are within PECO’s service area through free in-class energy efficiency education to students and distribution of take-home direct-install energy kits.
2013-2015 19,306 132 0.7% 0.2%
PECO Smart Usage Profile Residential
This program leverages the power of social norming to motivate residential customers to reduce their energy consumption through behavior changes. The selected Conservation Service Provider (CSP) will mail home energy use reports to PECO customers that show the customers electric consumption relative to similar households and make recommendations for ways to use energy more efficiently.
2013-2015 50,800 6,263 2% 0.4%
PECO Smart Multi-Family Solutions Program (Res)
Residential
The program is designed for retrofit and replacement projects in both master-metered common areas and individually-metered units of PECO Smart Multi-Family Solutions Program facilities. The eligible customer population for the program is all existing Multi-Family Program master-metered buildings, including the individual tenant accounts, provided with electricity by PECO, including commercial, residential, governmental, institutional and non-profit accounts.
2013-2015 60,198 536 2% 0.5%
Totals for Residential Sector 2,683,373 60,030 100% 2,803,818
Residential Low-Income Sector Programs
PECO Low-Income Energy Efficiency (LEEP) Program
Low-income Residential
This program is designed to educate and assist eligible PECO residential customers with making their homes more energy efficient. The program builds upon the Low Income Usage Reduction Program (LIURP) objective: to make low-income customers’ energy bills more affordable by helping to reduce energy usage.
2013-2015 398,457 3,142 100% 4%
Totals for Low-Income Sector 398,457 3,142 100% 4%
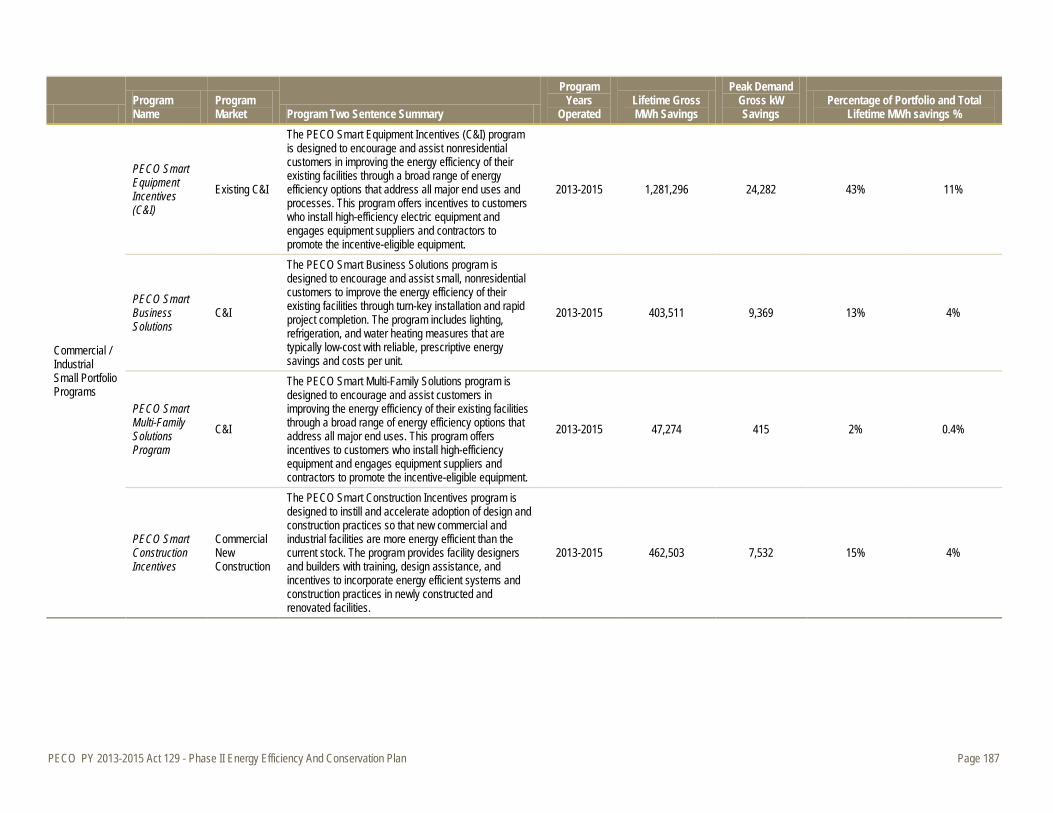
PECO PY 2013-2015 Act 129 - Phase II Energy Efficiency And Conservation Plan Page 187
Program Name
Program Market Program Two Sentence Summary
Program Years
Operated Lifetime Gross MWh Savings
Peak Demand Gross kW Savings
Percentage of Portfolio and Total Lifetime MWh savings %
Commercial / Industrial Small Portfolio Programs
PECO Smart Equipment Incentives (C&I)
Existing C&I
The PECO Smart Equipment Incentives (C&I) program is designed to encourage and assist nonresidential customers in improving the energy efficiency of their existing facilities through a broad range of energy efficiency options that address all major end uses and processes. This program offers incentives to customers who install high-efficiency electric equipment and engages equipment suppliers and contractors to promote the incentive-eligible equipment.
2013-2015 1,281,296 24,282 43% 11%
PECO Smart Business Solutions
C&I
The PECO Smart Business Solutions program is designed to encourage and assist small, nonresidential customers to improve the energy efficiency of their existing facilities through turn-key installation and rapid project completion. The program includes lighting, refrigeration, and water heating measures that are typically low-cost with reliable, prescriptive energy savings and costs per unit.
2013-2015 403,511 9,369 13% 4%
PECO Smart Multi-Family Solutions Program
C&I
The PECO Smart Multi-Family Solutions program is designed to encourage and assist customers in improving the energy efficiency of their existing facilities through a broad range of energy efficiency options that address all major end uses. This program offers incentives to customers who install high-efficiency equipment and engages equipment suppliers and contractors to promote the incentive-eligible equipment.
2013-2015 47,274 415 2% 0.4%
PECO Smart Construction Incentives
Commercial New Construction
The PECO Smart Construction Incentives program is designed to instill and accelerate adoption of design and construction practices so that new commercial and industrial facilities are more energy efficient than the current stock. The program provides facility designers and builders with training, design assistance, and incentives to incorporate energy efficient systems and construction practices in newly constructed and renovated facilities.
2013-2015 462,503 7,532 15% 4%

PECO PY 2013-2015 Act 129 - Phase II Energy Efficiency And Conservation Plan Page 188
Program Name
Program Market Program Two Sentence Summary
Program Years
Operated Lifetime Gross MWh Savings
Peak Demand Gross kW Savings
Percentage of Portfolio and Total Lifetime MWh savings %
PECO Smart On-Site C&I
The PECO Smart On-Site program will be designed to ensure participating customers install economic CHP projects that maximize operational savings and minimize operational and maintenance costs The program offers incentives to customers who install CHP technologies to reduce facility energy use. All existing commercial and industrial accounts, including government, public, and non-project facilities, provided with electricity by PECO are eligible to participate in the CHP program.
2013-2015 810,015 11,444 27% 7%
Totals for C/I Small Sector 3,004,599
53,042
100% 27%
Commercial/ Industrial Large Portfolio Programs
PECO Smart Equipment Incentives (C&I)
Existing C&I
The PECO Smart Equipment Incentives program is designed to encourage and assist nonresidential customers in improving the energy efficiency of their existing facilities through a broad range of energy efficiency options that address all major end uses and processes. This program offers incentives to customers who install high-efficiency electric equipment and engages equipment suppliers and contractors to promote the incentive-eligible equipment.
2013-2015 1,921,944.01 36,422.40 49% 17%
PECO Smart Multi-Family Solutions Program
C&I
The PECO Smart Multi-Family Solutions program is designed to encourage and assist customers in improving the energy efficiency of their existing facilities through a broad range of energy efficiency options that address all major end uses. This program offers incentives to customers who install high-efficiency equipment and engages equipment suppliers and contractors to promote the incentive-eligible equipment.
2013-2015 70,910.98 623 2% 1%
PECO Smart Construction Incentives
C&I
The PECO Smart Construction Incentives program is designed to instill and accelerate adoption of design and construction practices so that new commercial and industrial facilities are more energy efficient than the current stock. The program provides facility designers and builders with training, design assistance, and incentives to incorporate energy efficient systems and construction practices in newly constructed and renovated facilities.
2013-2015 693,754.69 11,298 18% 6%
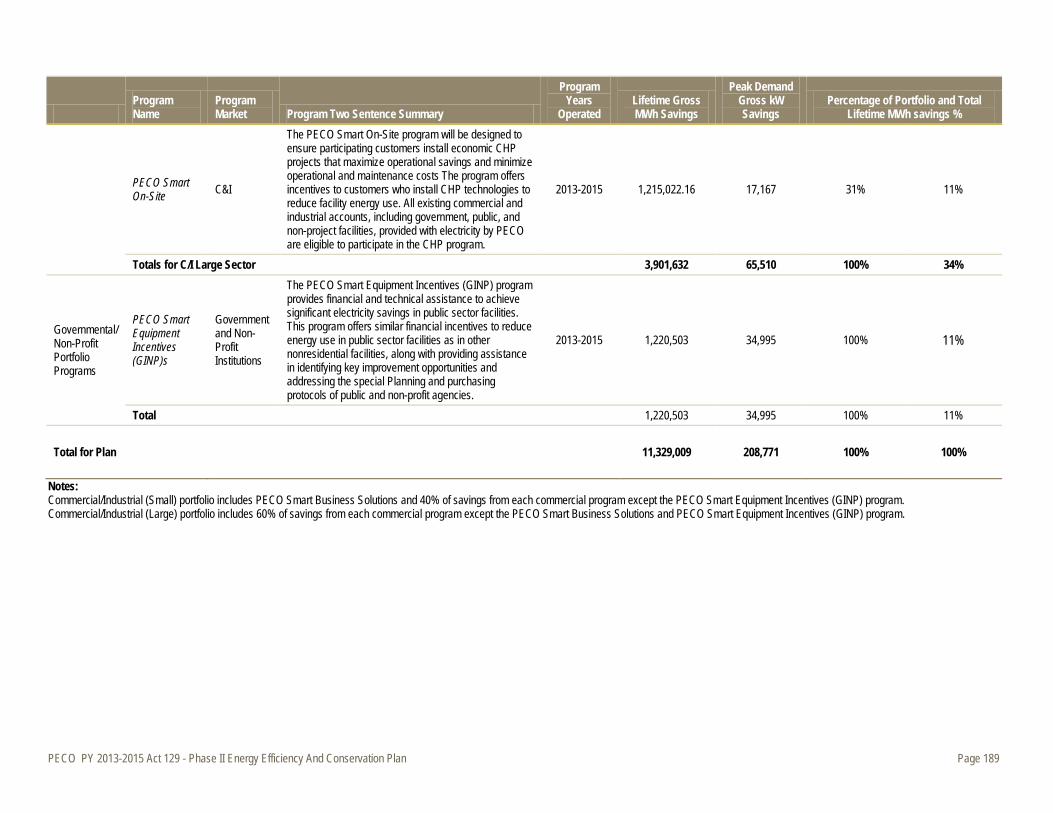
PECO PY 2013-2015 Act 129 - Phase II Energy Efficiency And Conservation Plan Page 189
Program Name
Program Market Program Two Sentence Summary
Program Years
Operated Lifetime Gross MWh Savings
Peak Demand Gross kW Savings
Percentage of Portfolio and Total Lifetime MWh savings %
PECO Smart On-Site C&I
The PECO Smart On-Site program will be designed to ensure participating customers install economic CHP projects that maximize operational savings and minimize operational and maintenance costs The program offers incentives to customers who install CHP technologies to reduce facility energy use. All existing commercial and industrial accounts, including government, public, and non-project facilities, provided with electricity by PECO are eligible to participate in the CHP program.
2013-2015 1,215,022.16 17,167 31% 11%
Totals for C/I Large Sector 3,901,632 65,510 100% 34%
Governmental/ Non-Profit Portfolio Programs
PECO Smart Equipment Incentives (GINP)s
Government and Non-Profit Institutions
The PECO Smart Equipment Incentives (GINP) program provides financial and technical assistance to achieve significant electricity savings in public sector facilities. This program offers similar financial incentives to reduce energy use in public sector facilities as in other nonresidential facilities, along with providing assistance in identifying key improvement opportunities and addressing the special Planning and purchasing protocols of public and non-profit agencies.
2013-2015 1,220,503 34,995 100% 11%
Total
1,220,503 34,995 100% 11%
Total for Plan
11,329,009
208,771
100% 100%
Notes: Commercial/Industrial (Small) portfolio includes PECO Smart Business Solutions and 40% of savings from each commercial program except the PECO Smart Equipment Incentives (GINP) program. Commercial/Industrial (Large) portfolio includes 60% of savings from each commercial program except the PECO Smart Business Solutions and PECO Smart Equipment Incentives (GINP) program.
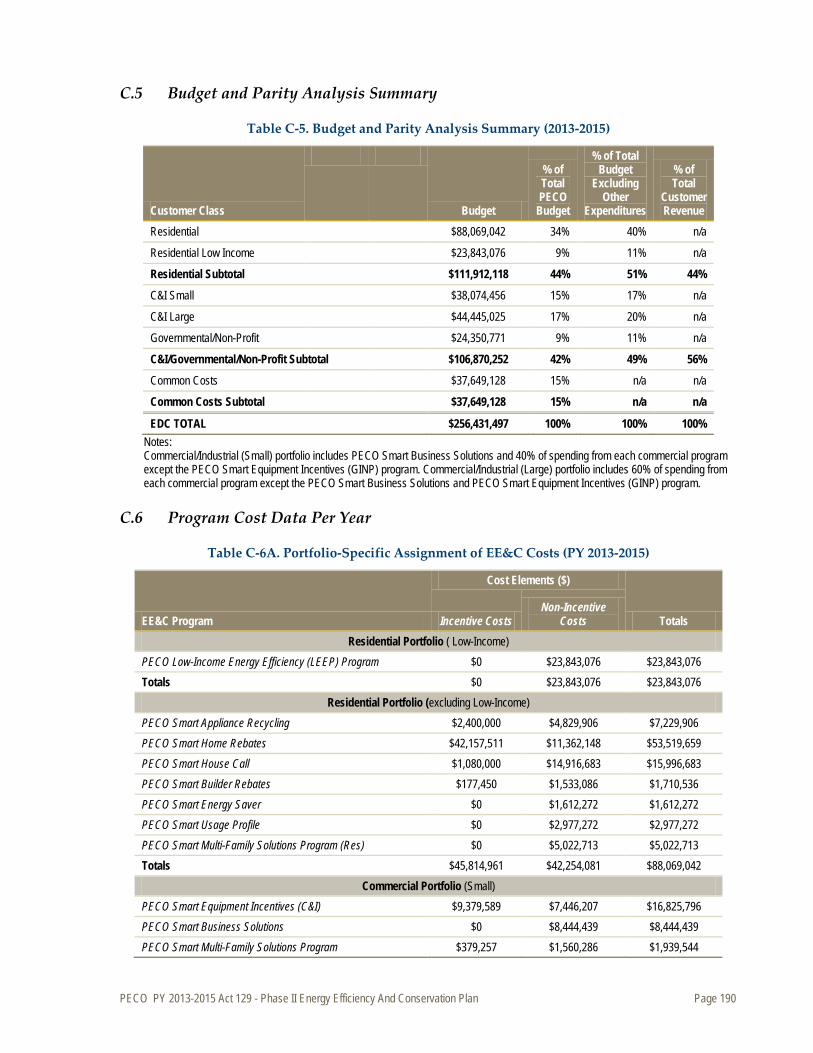
PECO PY 2013-2015 Act 129 - Phase II Energy Efficiency And Conservation Plan Page 190
C.5 Budget and Parity Analysis Summary
Table C-5. Budget and Parity Analysis Summary (2013-2015)
Customer Class
Budget
% of Total PECO
Budget
% of Total Budget
Excluding Other
Expenditures
% of Total
Customer Revenue
Residential $88,069,042 34% 40% n/a
Residential Low Income $23,843,076 9% 11% n/a
Residential Subtotal $111,912,118 44% 51% 44%
C&I Small $38,074,456 15% 17% n/a
C&I Large $44,445,025 17% 20% n/a
Governmental/Non-Profit $24,350,771 9% 11% n/a
C&I/Governmental/Non-Profit Subtotal $106,870,252 42% 49% 56%
Common Costs $37,649,128 15% n/a n/a
Common Costs Subtotal $37,649,128 15% n/a n/a
EDC TOTAL $256,431,497 100% 100% 100% Notes: Commercial/Industrial (Small) portfolio includes PECO Smart Business Solutions and 40% of spending from each commercial program except the PECO Smart Equipment Incentives (GINP) program. Commercial/Industrial (Large) portfolio includes 60% of spending from each commercial program except the PECO Smart Business Solutions and PECO Smart Equipment Incentives (GINP) program.
C.6 Program Cost Data Per Year
Table C-6A. Portfolio-Specific Assignment of EE&C Costs (PY 2013-2015)
EE&C Program
Cost Elements ($)
Totals Incentive Costs Non-Incentive
Costs Residential Portfolio ( Low-Income)
PECO Low-Income Energy Efficiency (LEEP) Program $0 $23,843,076 $23,843,076 Totals $0 $23,843,076 $23,843,076
Residential Portfolio (excluding Low-Income) PECO Smart Appliance Recycling $2,400,000 $4,829,906 $7,229,906 PECO Smart Home Rebates $42,157,511 $11,362,148 $53,519,659 PECO Smart House Call $1,080,000 $14,916,683 $15,996,683 PECO Smart Builder Rebates $177,450 $1,533,086 $1,710,536 PECO Smart Energy Saver $0 $1,612,272 $1,612,272 PECO Smart Usage Profile $0 $2,977,272 $2,977,272 PECO Smart Multi-Family Solutions Program (Res) $0 $5,022,713 $5,022,713 Totals $45,814,961 $42,254,081 $88,069,042
Commercial Portfolio (Small) PECO Smart Equipment Incentives (C&I) $9,379,589 $7,446,207 $16,825,796 PECO Smart Business Solutions $0 $8,444,439 $8,444,439 PECO Smart Multi-Family Solutions Program $379,257 $1,560,286 $1,939,544
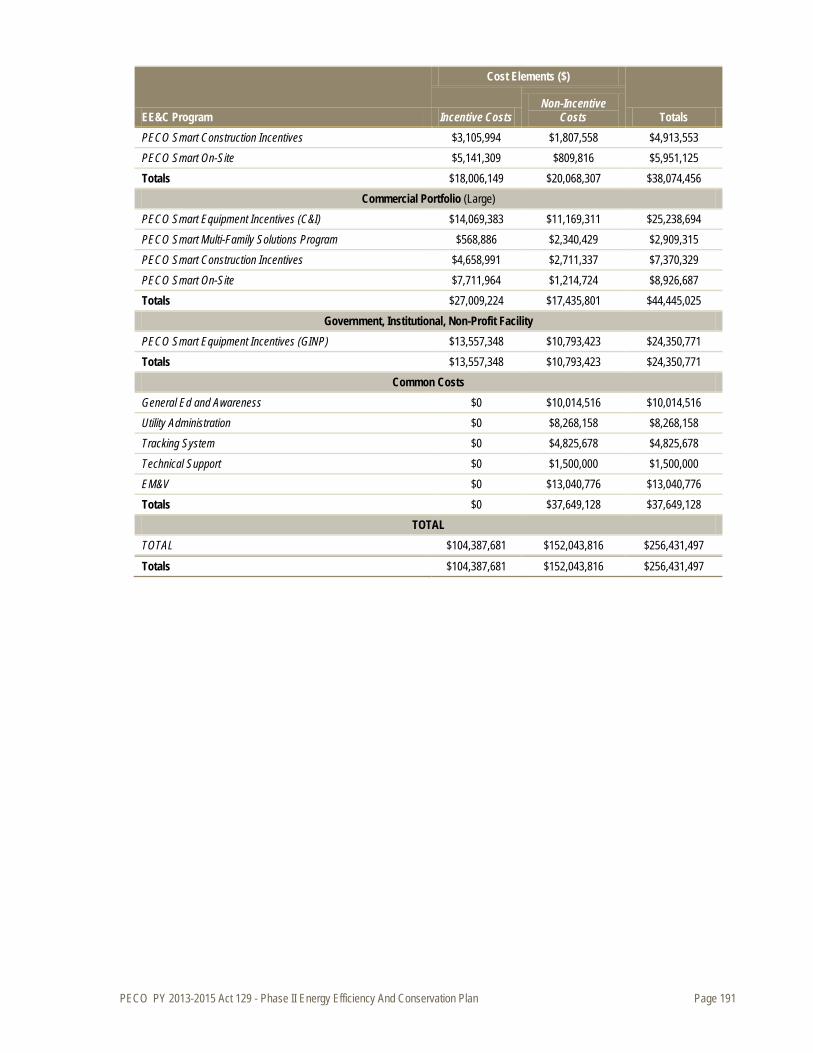
PECO PY 2013-2015 Act 129 - Phase II Energy Efficiency And Conservation Plan Page 191
EE&C Program
Cost Elements ($)
Totals Incentive Costs Non-Incentive
Costs PECO Smart Construction Incentives $3,105,994 $1,807,558 $4,913,553 PECO Smart On-Site $5,141,309 $809,816 $5,951,125 Totals $18,006,149 $20,068,307 $38,074,456
Commercial Portfolio (Large) PECO Smart Equipment Incentives (C&I) $14,069,383 $11,169,311 $25,238,694 PECO Smart Multi-Family Solutions Program $568,886 $2,340,429 $2,909,315 PECO Smart Construction Incentives $4,658,991 $2,711,337 $7,370,329 PECO Smart On-Site $7,711,964 $1,214,724 $8,926,687 Totals $27,009,224 $17,435,801 $44,445,025
Government, Institutional, Non-Profit Facility PECO Smart Equipment Incentives (GINP) $13,557,348 $10,793,423 $24,350,771 Totals $13,557,348 $10,793,423 $24,350,771
Common Costs General Ed and Awareness $0 $10,014,516 $10,014,516 Utility Administration $0 $8,268,158 $8,268,158 Tracking System $0 $4,825,678 $4,825,678 Technical Support $0 $1,500,000 $1,500,000 EM&V $0 $13,040,776 $13,040,776 Totals $0 $37,649,128 $37,649,128
TOTAL TOTAL $104,387,681 $152,043,816 $256,431,497
Totals $104,387,681 $152,043,816 $256,431,497

PECO PY 2013-2015 Act 129 - Phase II Energy Efficiency And Conservation Plan Page 192
Table C-6B. Allocation of Common Costs to Applicable Customer Sector (PY 2013-2015)
Common Cost Element Total Cost ($)
Basis for Cost Allocation
Class Cost Allocation ($) Residential (Excluding
Low-Income)
Residential (Low-
Income)
Commercial / Industrial --
Small
Commercial / Industrial -
- Large Governmental/
Non-profit
General Ed and Awareness $10,014,516
Costs Allocated according to
%Budget (portfolio) of Program
$4,031,261 $1,091,390 $1,742,815 $2,034,421 $1,114,629
Utility Administration $8,268,158
Costs Allocated according to
%Budget (portfolio) of Program
$3,328,279 $901,070 $1,438,898 $1,679,653 $920,257
Tracking System $4,825,678 Costs Allocated
according to %Budget (portfolio)
of Program $1,942,537 $525,906 $839,807 $980,323 $537,104
Technical Support $1,500,000 Costs Allocated
according to %Budget (portfolio)
of Program $603,813 $163,471 $261,043 $304,721 $166,952
EM&V $13,040,776 Costs Allocated
according to %Budget (portfolio)
of Program $5,249,457 $1,421,194 $2,269,472 $2,649,197 $1,451,456
Totals $37,649,128
$15,155,346 $4,103,032 $6,552,036 $7,648,315 $4,190,398 Notes: Commercial/Industrial (Small) portfolio includes PECO Smart Business Solutions and 40% of costs from each commercial program except the PECO Smart Equipment Incentives (GINP) program. Commercial/Industrial (Large) portfolio includes 60% of costs from each commercial program except the PECO Smart Business Solutions and PECO Smart Equipment Incentives (GINP) program.
Table C-6C. Summary of Portfolio EE&C Costs (PY 2013-2015)
Portfolio Total Sector Portfolio
Specific Costs 1 Total Common Costs 2 Total of All Costs Residential (excluding Low-Income) $88,069,042 $15,155,346 $103,224,388
Residential (Including Low-Income) $23,843,076 $4,103,032 $27,946,108
Commercial/Industrial -- Small $38,074,456 $6,552,036 $44,626,493 Commercial/Industrial -- Large $44,445,025 $7,648,315 $52,093,340 Governmental/Non-profit $24,350,771 $4,190,398 $28,541,169
Totals $218,782,370 $37,649,128 $256,431,497 Notes: 1. Cost figures are to be carried over from the last column ("Totals") of Error! Reference source not found.C-6A. 2. Cost figures are to be carried over from the bottom row ("Totals") of C-6B. Commercial/Industrial (Small) portfolio includes PECO Smart Business Solutions and 40% of costs from each commercial program except the PECO Smart Equipment Incentives (GINP) program. Commercial/Industrial (Large) portfolio includes 60% of costs from each commercial program except the PECO Smart Business Solutions and PECO Smart Equipment Incentives (GINP) program.
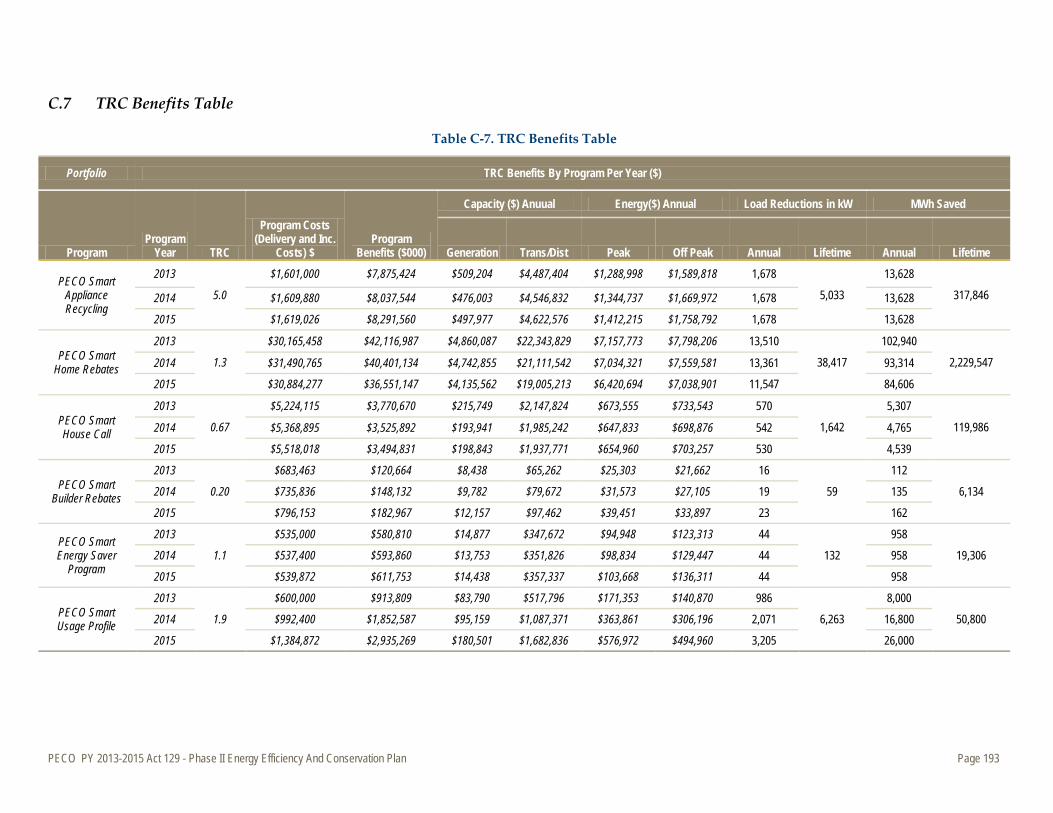
PECO PY 2013-2015 Act 129 - Phase II Energy Efficiency And Conservation Plan Page 193
C.7 TRC Benefits Table
Table C-7. TRC Benefits Table
Portfolio TRC Benefits By Program Per Year ($)
Program Program
Year TRC
Program Costs (Delivery and Inc.
Costs) $ Program
Benefits ($000)
Capacity ($) Anuual Energy($) Annual Load Reductions in kW MWh Saved
Generation Trans/Dist Peak Off Peak Annual Lifetime Annual Lifetime
PECO Smart Appliance Recycling
2013
5.0
$1,601,000 $7,875,424 $509,204 $4,487,404 $1,288,998 $1,589,818 1,678
5,033
13,628
317,846 2014 $1,609,880 $8,037,544 $476,003 $4,546,832 $1,344,737 $1,669,972 1,678 13,628
2015 $1,619,026 $8,291,560 $497,977 $4,622,576 $1,412,215 $1,758,792 1,678 13,628
PECO Smart Home Rebates
2013
1.3
$30,165,458 $42,116,987 $4,860,087 $22,343,829 $7,157,773 $7,798,206 13,510
38,417
102,940
2,229,547 2014 $31,490,765 $40,401,134 $4,742,855 $21,111,542 $7,034,321 $7,559,581 13,361 93,314
2015 $30,884,277 $36,551,147 $4,135,562 $19,005,213 $6,420,694 $7,038,901 11,547 84,606
PECO Smart House Call
2013
0.67
$5,224,115 $3,770,670 $215,749 $2,147,824 $673,555 $733,543 570
1,642
5,307
119,986 2014 $5,368,895 $3,525,892 $193,941 $1,985,242 $647,833 $698,876 542 4,765
2015 $5,518,018 $3,494,831 $198,843 $1,937,771 $654,960 $703,257 530 4,539
PECO Smart Builder Rebates
2013
0.20
$683,463 $120,664 $8,438 $65,262 $25,303 $21,662 16
59
112
6,134 2014 $735,836 $148,132 $9,782 $79,672 $31,573 $27,105 19 135
2015 $796,153 $182,967 $12,157 $97,462 $39,451 $33,897 23 162
PECO Smart Energy Saver
Program
2013
1.1
$535,000 $580,810 $14,877 $347,672 $94,948 $123,313 44
132
958
19,306 2014 $537,400 $593,860 $13,753 $351,826 $98,834 $129,447 44 958
2015 $539,872 $611,753 $14,438 $357,337 $103,668 $136,311 44 958
PECO Smart Usage Profile
2013
1.9
$600,000 $913,809 $83,790 $517,796 $171,353 $140,870 986
6,263
8,000
50,800 2014 $992,400 $1,852,587 $95,159 $1,087,371 $363,861 $306,196 2,071 16,800
2015 $1,384,872 $2,935,269 $180,501 $1,682,836 $576,972 $494,960 3,205 26,000
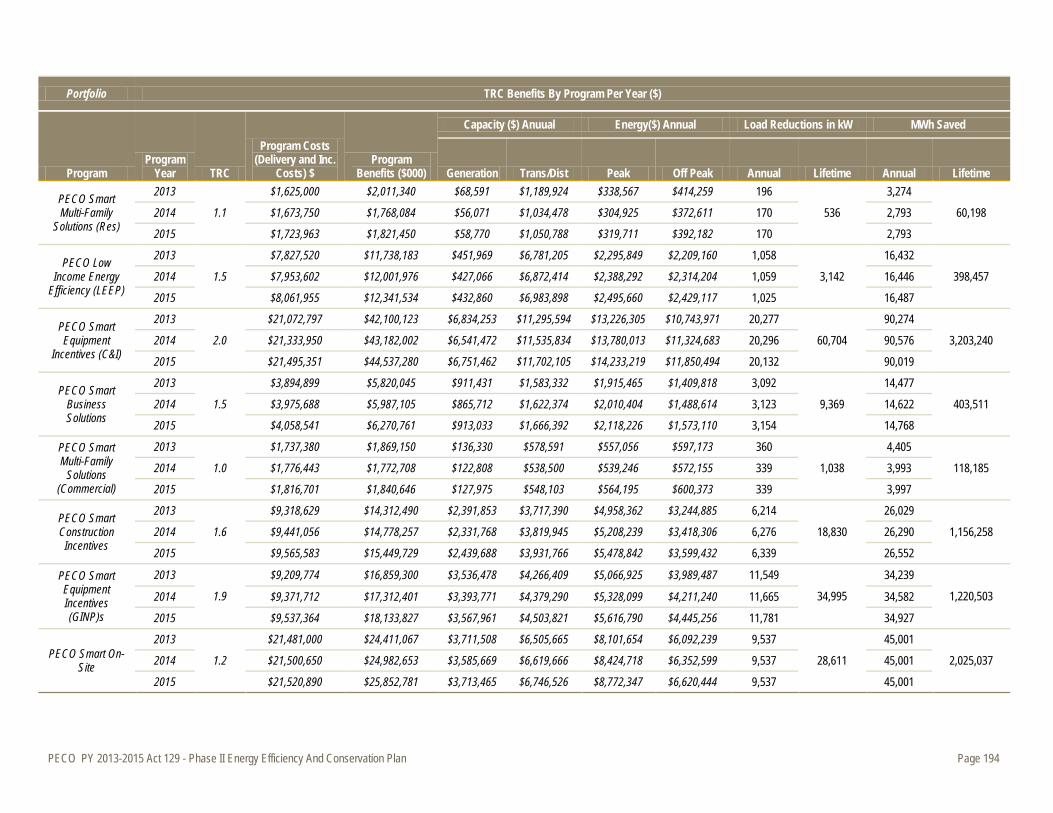
PECO PY 2013-2015 Act 129 - Phase II Energy Efficiency And Conservation Plan Page 194
Portfolio TRC Benefits By Program Per Year ($)
Program Program
Year TRC
Program Costs (Delivery and Inc.
Costs) $ Program
Benefits ($000)
Capacity ($) Anuual Energy($) Annual Load Reductions in kW MWh Saved
Generation Trans/Dist Peak Off Peak Annual Lifetime Annual Lifetime
PECO Smart Multi-Family
Solutions (Res)
2013
1.1
$1,625,000 $2,011,340 $68,591 $1,189,924 $338,567 $414,259 196
536
3,274
60,198 2014 $1,673,750 $1,768,084 $56,071 $1,034,478 $304,925 $372,611 170 2,793
2015 $1,723,963 $1,821,450 $58,770 $1,050,788 $319,711 $392,182 170 2,793
PECO Low Income Energy
Efficiency (LEEP)
2013
1.5
$7,827,520 $11,738,183 $451,969 $6,781,205 $2,295,849 $2,209,160 1,058
3,142
16,432
398,457 2014 $7,953,602 $12,001,976 $427,066 $6,872,414 $2,388,292 $2,314,204 1,059 16,446
2015 $8,061,955 $12,341,534 $432,860 $6,983,898 $2,495,660 $2,429,117 1,025 16,487
PECO Smart Equipment
Incentives (C&I)
2013
2.0
$21,072,797 $42,100,123 $6,834,253 $11,295,594 $13,226,305 $10,743,971 20,277
60,704
90,274
3,203,240 2014 $21,333,950 $43,182,002 $6,541,472 $11,535,834 $13,780,013 $11,324,683 20,296 90,576
2015 $21,495,351 $44,537,280 $6,751,462 $11,702,105 $14,233,219 $11,850,494 20,132 90,019
PECO Smart Business Solutions
2013
1.5
$3,894,899 $5,820,045 $911,431 $1,583,332 $1,915,465 $1,409,818 3,092
9,369
14,477
403,511 2014 $3,975,688 $5,987,105 $865,712 $1,622,374 $2,010,404 $1,488,614 3,123 14,622
2015 $4,058,541 $6,270,761 $913,033 $1,666,392 $2,118,226 $1,573,110 3,154 14,768
PECO Smart Multi-Family
Solutions (Commercial)
2013
1.0
$1,737,380 $1,869,150 $136,330 $578,591 $557,056 $597,173 360
1,038
4,405
118,185 2014 $1,776,443 $1,772,708 $122,808 $538,500 $539,246 $572,155 339 3,993
2015 $1,816,701 $1,840,646 $127,975 $548,103 $564,195 $600,373 339 3,997
PECO Smart Construction Incentives
2013
1.6
$9,318,629 $14,312,490 $2,391,853 $3,717,390 $4,958,362 $3,244,885 6,214
18,830
26,029
1,156,258 2014 $9,441,056 $14,778,257 $2,331,768 $3,819,945 $5,208,239 $3,418,306 6,276 26,290
2015 $9,565,583 $15,449,729 $2,439,688 $3,931,766 $5,478,842 $3,599,432 6,339 26,552
PECO Smart Equipment Incentives (GINP)s
2013
1.9
$9,209,774 $16,859,300 $3,536,478 $4,266,409 $5,066,925 $3,989,487 11,549
34,995
34,239
1,220,503 2014 $9,371,712 $17,312,401 $3,393,771 $4,379,290 $5,328,099 $4,211,240 11,665 34,582
2015 $9,537,364 $18,133,827 $3,567,961 $4,503,821 $5,616,790 $4,445,256 11,781 34,927
PECO Smart On-Site
2013
1.2
$21,481,000 $24,411,067 $3,711,508 $6,505,665 $8,101,654 $6,092,239 9,537
28,611
45,001
2,025,037 2014 $21,500,650 $24,982,653 $3,585,669 $6,619,666 $8,424,718 $6,352,599 9,537 45,001
2015 $21,520,890 $25,852,781 $3,713,465 $6,746,526 $8,772,347 $6,620,444 9,537 45,001
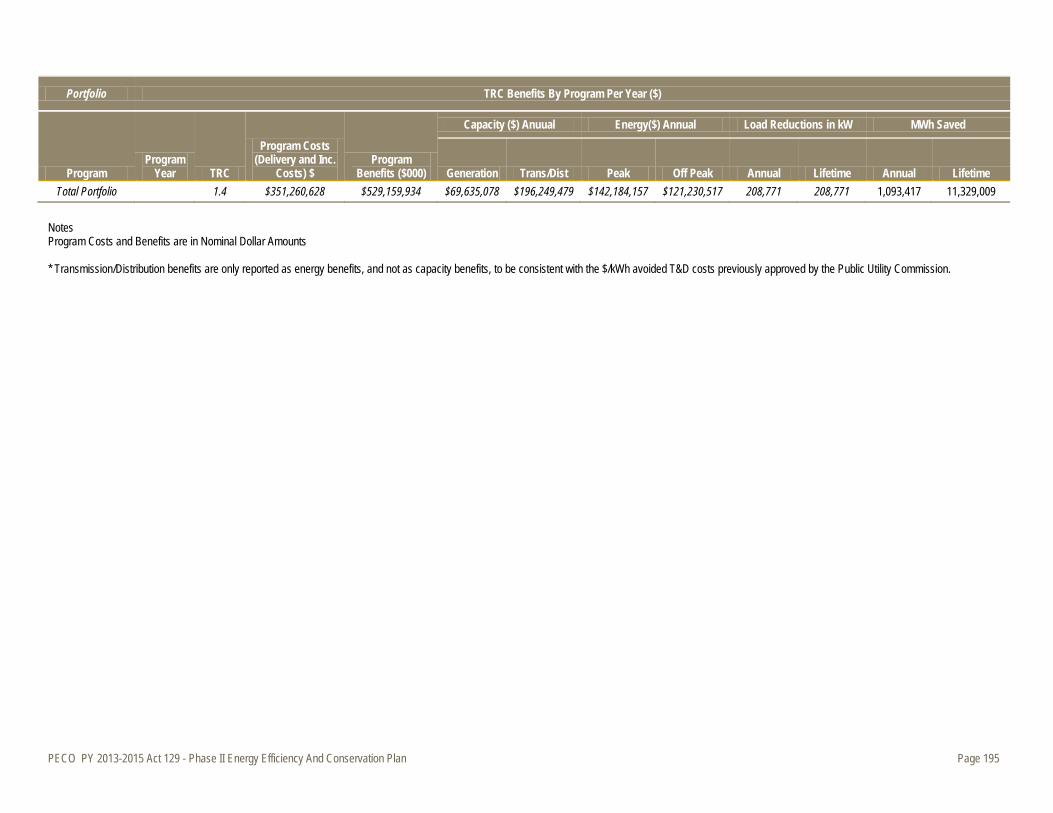
PECO PY 2013-2015 Act 129 - Phase II Energy Efficiency And Conservation Plan Page 195
Portfolio TRC Benefits By Program Per Year ($)
Program Program
Year TRC
Program Costs (Delivery and Inc.
Costs) $ Program
Benefits ($000)
Capacity ($) Anuual Energy($) Annual Load Reductions in kW MWh Saved
Generation Trans/Dist Peak Off Peak Annual Lifetime Annual Lifetime Total Portfolio 1.4 $351,260,628 $529,159,934 $69,635,078 $196,249,479 $142,184,157 $121,230,517 208,771 208,771 1,093,417 11,329,009
Notes Program Costs and Benefits are in Nominal Dollar Amounts * Transmission/Distribution benefits are only reported as energy benefits, and not as capacity benefits, to be consistent with the $/kWh avoided T&D costs previously approved by the Public Utility Commission.
PECO PY 2013-2015 Act 129 - Phase II Energy Efficiency And Conservation Plan Page 196
Appendix D. Calculation Methods and Assumptions
D.1 Total Resource Cost Test Calculation Methods
Benefit-cost analysis of PECO’s portfolio of energy efficiency programs was conducted through the use of a comprehensive benefit-cost screening tool. The tool utilizes the most recent savings values and inputs from the Pennsylvania Technical Reference Manual (TRM) when available, supplemented by inputs gathered from other Technical Reference Manuals and industry literature as necessary for those measures that are not in the PA TRM. The tool uses inputs at the individual measure level (electric savings, incremental cost, participation levels, avoided costs, and energy costs) to calculate measure level savings and cost effectiveness. The savings at the measure level are subtotaled for each program and sector and finally for the utility as a whole. At the program and sector level the model also calculates program level cost effectiveness, program incentive and non-incentive costs, total program costs, and cost of conserved energy. The outputs are compared against target savings goals, spending caps, and cost effectiveness limits. The Total Resource Cost (TRC) test was the primary test used to analyze the cost-effectiveness of PECO’s energy efficiency portfolio. The TRC test measures the total net resource expenditures of an energy efficiency program from the point of view of the utility and its ratepayers. Resource costs include changes in supply and participant costs. A program that passes this test (i.e., a ratio greater than 1) is viewed as beneficial to the utility and its customers because the savings in electric costs outweigh the costs incurred by the utility and its customers. Of particular note, per the PA PUC guidelines, measure lifetime is capped at 15 years, and non-electric benefits are excluded from the savings calculations (e.g. complementary natural gas savings from an electric efficiency measure are excluded from the analysis). The following section outlines Navigant’s methodology for conducting the cost-effectiveness analysis including an exPlanation of inputs and assumptions.
Incremental Measure costs Estimates of incremental measure costs were developed using the Pennsylvania TRM and a number of secondary sources including, DEER, Mid-Atlantic TRM, Efficiency Vermont TRM, other measure databases for other utilities and municipalities and databases of emerging technologies. Measure costs for each program are detailed separately for each program in Sections 4.1 and 4.2. Incentive Costs Incentive amounts for each measure were initially determined using industry standard benchmarks of portion of incremental measure cost covered by the incentive, typically in the range of 30%-50%, but at times up to 100%. These initial estimates were further refined through in-depth discussion with PECO program staff and CSPs, based on careful consideration of the market for each measure or set of measures. Incentive costs for each program are detailed along with measure savings and costs for each program in Sections 4.1 and 4.2. Utility Administrative Costs Program administrative non-incentive costs were estimated for each program. Initial estimates were developed using industry standard benchmarks of admin costs per kWh saved and per incentive. These initial estimates were refined through discussion with implementation contractors, incorporating considerations of each programs’ unique market conditions. Common costs such as EM&V, technical support, and tracking system costs were estimated for the each program portfolio using industry

PECO PY 2013-2015 Act 129 - Phase II Energy Efficiency And Conservation Plan Page 197
standard benchmarks, supplemented by program staff and CSP input. Utility administration costs are detailed in Appendix C.
Measure Level Total Resource Cost Test Calculation
= Measure Level TRC Benefits / Measure Level TRC Costs
Where:
Measure Level TRC Benefits = -PV (Electric Discount Rate, Measure Life, (AVCOS Demand * Coincident Demand Savings * LLF) + [(Summer-On kWh Savings * Summer-On kWh AVCOS) + (Summer-Off kWh Savings * Summer-Off kWh AVCOS) + (Winter-On kWh Savings * Winter-On kWh AVCOS) + (Winter-Off kWh Savings * Winter-Off kWh AVCOS)* LLF] * NTG
Where: PV = Present value Discount Rate = 7.45% Measure Life = variable (15 year max) AVCOS Demand = $/kW LLF = Line Loss Factor Summer-On kWh = kWh savings * summer on-peak load factor Summer-Off kWh = kWh savings * summer off-peak load factor Winter-On kWh = kWh savings * winter on-peak load factor Winter-Off kWh = kWh savings * winter off-peak load factor Summer-On kWh AVCOS = summer on-peak $/kWh Summer-On kWh AVCOS = summer off-peak $/kWh Winter-On kWh AVCOS = winter on-peak $/kWh Winter-On kWh AVCOS = winter off-peak $/kWh NTG = Net-to-gross factor
Measure Level TRC Cost = Incremental Measure Cost * NTG
= Program Level TRC Benefits / Program Level TRC Costs Program Level Total Resource Cost Test Calculation
Where: Program Level TRC Benefits = sum (Measure Level TRC Benefits) Program Level TRC Costs = sum (Measure Level TRC Costs) + Program Admin Costs
Where: Program Admin Costs = Sum of Annual Program Costs
Including:
• Direct Install Measure Costs • Program Delivery Costs • Program Marketing Costs
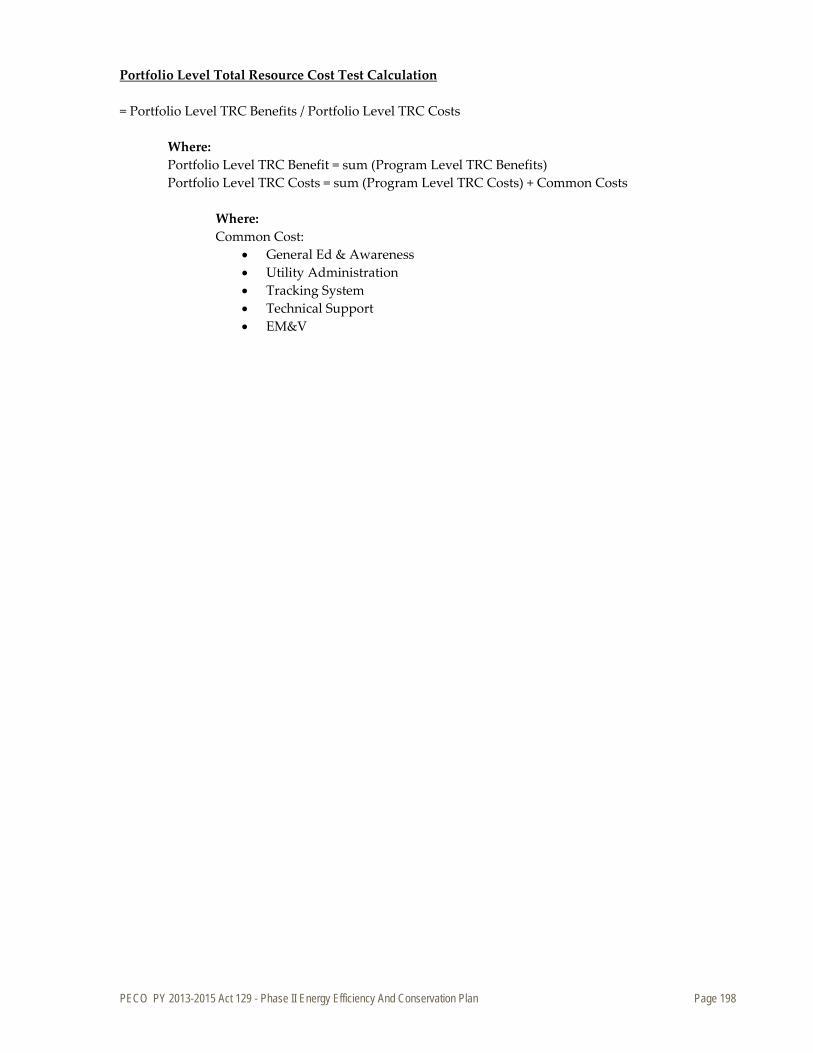
PECO PY 2013-2015 Act 129 - Phase II Energy Efficiency And Conservation Plan Page 198
Portfolio Level Total Resource Cost Test Calculation
= Portfolio Level TRC Benefits / Portfolio Level TRC Costs
Where: Portfolio Level TRC Benefit = sum (Program Level TRC Benefits) Portfolio Level TRC Costs = sum (Program Level TRC Costs) + Common Costs
Where: Common Cost:
• General Ed & Awareness • Utility Administration • Tracking System • Technical Support • EM&V

PECO PY 2013-2015 Act 129 - Phase II Energy Efficiency And Conservation Plan Page 199
D.2 Seasonal Avoided Costs for Electricity
Table D-1. Avoided Costs for Electricity ($/kWh)
$/kW ($/kWh)
Year Demand Summer On Summer Off Winter On Winter Off
PY 5-2013 $91.29 $0.053 $0.030 $0.033 $0.044
2014 $49.37 $0.053 $0.031 $0.034 $0.045
2015 $60.51 $0.054 $0.032 $0.036 $0.046
2016 $61.67 $0.056 $0.034 $0.038 $0.047
2017 $62.86 $0.058 $0.036 $0.040 $0.050
2018 $64.07 $0.062 $0.037 $0.042 $0.052
2019 $65.30 $0.066 $0.039 $0.044 $0.056
2020 $66.56 $0.070 $0.042 $0.047 $0.059
2021 $67.84 $0.074 $0.044 $0.049 $0.063
2022 $69.15 $0.079 $0.047 $0.052 $0.067
2023 $70.48 $0.083 $0.049 $0.055 $0.070
2024 $71.83 $0.088 $0.051 $0.055 $0.070
2025 $73.22 $0.085 $0.050 $0.055 $0.071
2026 $74.63 $0.089 $0.052 $0.058 $0.074
2027 $76.06 $0.092 $0.054 $0.060 $0.077
2028 $77.53 $0.094 $0.055 $0.061 $0.079
2029 $79.02 $0.096 $0.056 $0.062 $0.081
2030 $80.54 $0.098 $0.057 $0.063 $0.082
2031 $82.09 $0.100 $0.058 $0.065 $0.084
2032 $83.67 $0.102 $0.060 $0.066 $0.085
2033 $85.28 $0.104 $0.061 $0.067 $0.087
2034 $86.92 $0.106 $0.062 $0.069 $0.089
2035 $88.59 $0.108 $0.063 $0.070 $0.091
2036 $90.30 $0.110 $0.064 $0.071 $0.093
2037 $92.04 $0.113 $0.066 $0.073 $0.094
2038 $93.81 $0.115 $0.067 $0.074 $0.096
2039 $95.61 $0.117 $0.068 $0.076 $0.098 Source: Updated PECO avoided cost estimates as of September 14, 2012
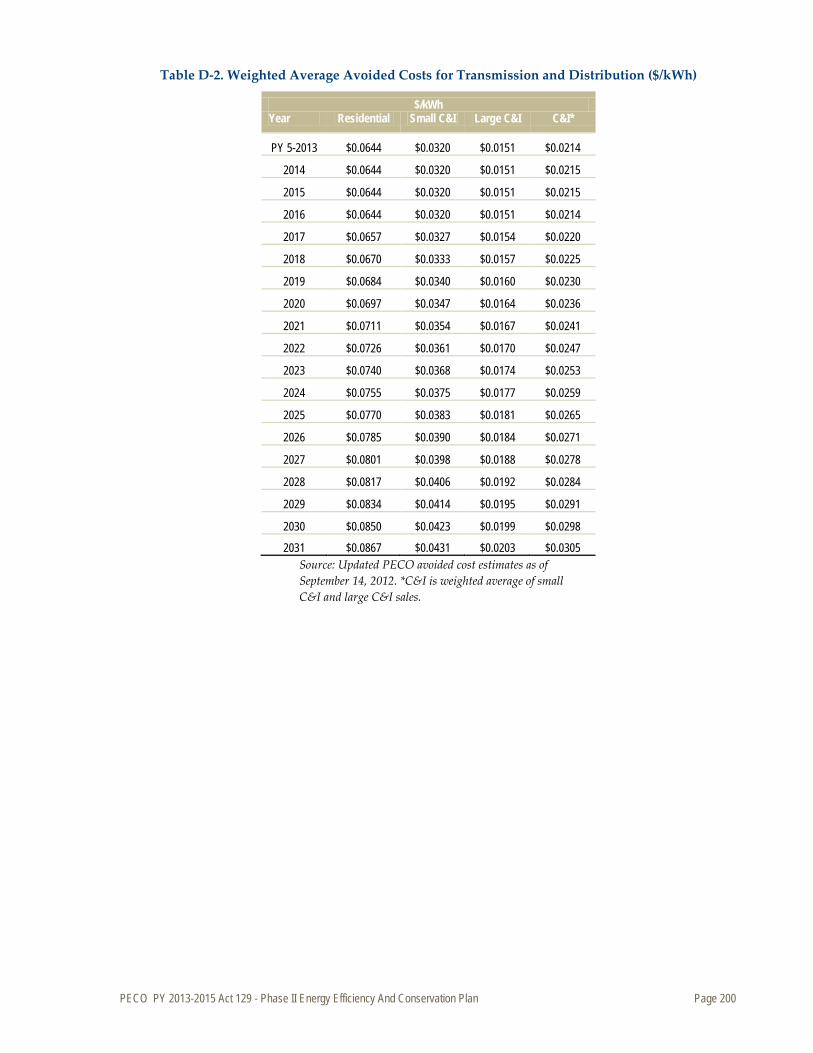
PECO PY 2013-2015 Act 129 - Phase II Energy Efficiency And Conservation Plan Page 200
Table D-2. Weighted Average Avoided Costs for Transmission and Distribution ($/kWh)
$/kWh Year Residential Small C&I Large C&I C&I*
PY 5-2013 $0.0644 $0.0320 $0.0151 $0.0214
2014 $0.0644 $0.0320 $0.0151 $0.0215
2015 $0.0644 $0.0320 $0.0151 $0.0215
2016 $0.0644 $0.0320 $0.0151 $0.0214
2017 $0.0657 $0.0327 $0.0154 $0.0220
2018 $0.0670 $0.0333 $0.0157 $0.0225
2019 $0.0684 $0.0340 $0.0160 $0.0230
2020 $0.0697 $0.0347 $0.0164 $0.0236
2021 $0.0711 $0.0354 $0.0167 $0.0241
2022 $0.0726 $0.0361 $0.0170 $0.0247
2023 $0.0740 $0.0368 $0.0174 $0.0253
2024 $0.0755 $0.0375 $0.0177 $0.0259
2025 $0.0770 $0.0383 $0.0181 $0.0265
2026 $0.0785 $0.0390 $0.0184 $0.0271
2027 $0.0801 $0.0398 $0.0188 $0.0278
2028 $0.0817 $0.0406 $0.0192 $0.0284
2029 $0.0834 $0.0414 $0.0195 $0.0291
2030 $0.0850 $0.0423 $0.0199 $0.0298
2031 $0.0867 $0.0431 $0.0203 $0.0305 Source: Updated PECO avoided cost estimates as of September 14, 2012. *C&I is weighted average of small C&I and large C&I sales.
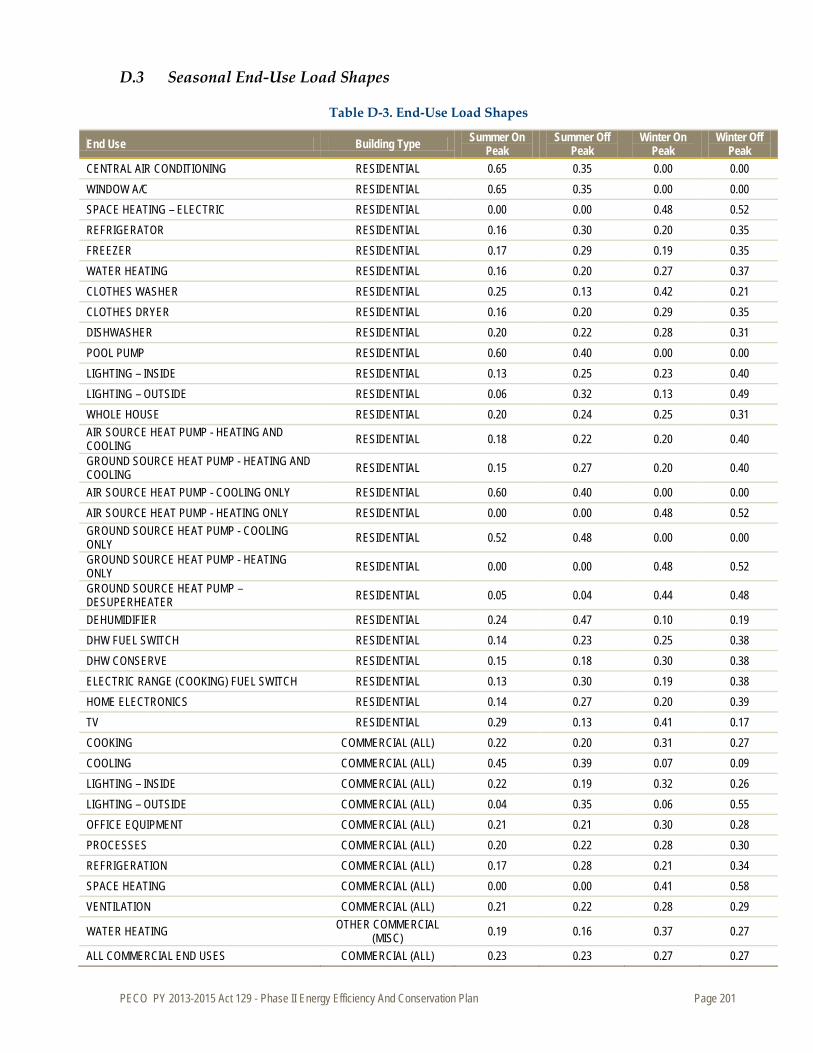
PECO PY 2013-2015 Act 129 - Phase II Energy Efficiency And Conservation Plan Page 201
D.3 Seasonal End-Use Load Shapes
Table D-3. End-Use Load Shapes
End Use Building Type Summer On Peak
Summer Off Peak
Winter On Peak
Winter Off Peak
CENTRAL AIR CONDITIONING RESIDENTIAL 0.65 0.35 0.00 0.00 WINDOW A/C RESIDENTIAL 0.65 0.35 0.00 0.00 SPACE HEATING – ELECTRIC RESIDENTIAL 0.00 0.00 0.48 0.52 REFRIGERATOR RESIDENTIAL 0.16 0.30 0.20 0.35 FREEZER RESIDENTIAL 0.17 0.29 0.19 0.35 WATER HEATING RESIDENTIAL 0.16 0.20 0.27 0.37 CLOTHES WASHER RESIDENTIAL 0.25 0.13 0.42 0.21 CLOTHES DRYER RESIDENTIAL 0.16 0.20 0.29 0.35 DISHWASHER RESIDENTIAL 0.20 0.22 0.28 0.31 POOL PUMP RESIDENTIAL 0.60 0.40 0.00 0.00 LIGHTING – INSIDE RESIDENTIAL 0.13 0.25 0.23 0.40 LIGHTING – OUTSIDE RESIDENTIAL 0.06 0.32 0.13 0.49 WHOLE HOUSE RESIDENTIAL 0.20 0.24 0.25 0.31 AIR SOURCE HEAT PUMP - HEATING AND COOLING RESIDENTIAL 0.18 0.22 0.20 0.40
GROUND SOURCE HEAT PUMP - HEATING AND COOLING RESIDENTIAL 0.15 0.27 0.20 0.40
AIR SOURCE HEAT PUMP - COOLING ONLY RESIDENTIAL 0.60 0.40 0.00 0.00 AIR SOURCE HEAT PUMP - HEATING ONLY RESIDENTIAL 0.00 0.00 0.48 0.52 GROUND SOURCE HEAT PUMP - COOLING ONLY RESIDENTIAL 0.52 0.48 0.00 0.00
GROUND SOURCE HEAT PUMP - HEATING ONLY RESIDENTIAL 0.00 0.00 0.48 0.52
GROUND SOURCE HEAT PUMP – DESUPERHEATER RESIDENTIAL 0.05 0.04 0.44 0.48
DEHUMIDIFIER RESIDENTIAL 0.24 0.47 0.10 0.19 DHW FUEL SWITCH RESIDENTIAL 0.14 0.23 0.25 0.38 DHW CONSERVE RESIDENTIAL 0.15 0.18 0.30 0.38 ELECTRIC RANGE (COOKING) FUEL SWITCH RESIDENTIAL 0.13 0.30 0.19 0.38 HOME ELECTRONICS RESIDENTIAL 0.14 0.27 0.20 0.39 TV RESIDENTIAL 0.29 0.13 0.41 0.17 COOKING COMMERCIAL (ALL) 0.22 0.20 0.31 0.27 COOLING COMMERCIAL (ALL) 0.45 0.39 0.07 0.09 LIGHTING – INSIDE COMMERCIAL (ALL) 0.22 0.19 0.32 0.26 LIGHTING – OUTSIDE COMMERCIAL (ALL) 0.04 0.35 0.06 0.55 OFFICE EQUIPMENT COMMERCIAL (ALL) 0.21 0.21 0.30 0.28 PROCESSES COMMERCIAL (ALL) 0.20 0.22 0.28 0.30 REFRIGERATION COMMERCIAL (ALL) 0.17 0.28 0.21 0.34 SPACE HEATING COMMERCIAL (ALL) 0.00 0.00 0.41 0.58 VENTILATION COMMERCIAL (ALL) 0.21 0.22 0.28 0.29
WATER HEATING OTHER COMMERCIAL (MISC) 0.19 0.16 0.37 0.27
ALL COMMERCIAL END USES COMMERCIAL (ALL) 0.23 0.23 0.27 0.27

PECO PY 2013-2015 Act 129 - Phase II Energy Efficiency And Conservation Plan Page 202
End Use Building Type Summer On Peak
Summer Off Peak
Winter On Peak
Winter Off Peak
VENDING MACHINE CONTROLS COMMERCIAL 0.04 0.33 0.06 0.57 COMPRESSED AIR - 1-SHIFT (8/5) COMMERCIAL 0.30 0.12 0.41 0.17 COMPRESSED AIR - 2-SHIFT (16/5) COMMERCIAL 0.28 0.14 0.38 0.20 COMPRESSED AIR - 3-SHIFT (24/5) COMMERCIAL 0.20 0.22 0.27 0.31 COMPRESSED AIR- 4-SHIFT (24/7) COMMERCIAL 0.14 0.28 0.20 0.39 COMPRESSED AIR GENERAL COMMERCIAL 0.23 0.19 0.32 0.27 VFD SUPPLY FANS <10 HP COMMERCIAL 0.22 0.23 0.31 0.24 VFD RETURN FANS <10 HP COMMERCIAL 0.22 0.23 0.31 0.24 VFD EXHAUST FANS <10 HP COMMERCIAL 0.15 0.27 0.27 0.31 VFD BOILER FEEDWATER PUMPS <10 HP COMMERCIAL 0.05 0.08 0.33 0.54 VFD CHILLED WATER PUMPS <10 HP COMMERCIAL 0.31 0.52 0.09 0.08 VFD BOILER CIRCULATION PUMPS <10 HP COMMERCIAL 0.05 0.08 0.33 0.54 VFD HVAC PUMP COMMERCIAL 0.17 0.23 0.27 0.33 REFRIGERATION ECONOMIZER COMMERCIAL 0.04 0.09 0.27 0.60 EVAP FAN CONTROL COMMERCIAL 0.12 0.28 0.18 0.42 COMPUTER OFFICE COMMERCIAL 0.13 0.29 0.18 0.40 NIGHT COVERS FOR REFRIGERATION COMMERCIAL 0.03 0.39 0.04 0.55 DOOR HEATER CONTROL COMMERCIAL 0.04 0.09 0.29 0.58 FLOATING HEAD PRESSURE CONTROL COMMERCIAL 0.12 0.27 0.21 0.41 STANDBY LOSSES - COMMERCIAL OFFICE COMMERCIAL 0.03 0.39 0.04 0.54 HVAC ECONOMIZER COMMERCIAL 0.18 0.40 0.15 0.27 DATA CENTER COMMERCIAL 0.14 0.24 0.21 0.41 LIGHTING DAYLIGHT CONTROL OTHER 0.24 0.18 0.33 0.26 STAIRWAY/GARAGE LIGHTING CONTROL COMMERCIAL 0.00 0.42 0.00 0.58 TIME CLOCK CONTROL COMMERCIAL 0.00 0.42 0.00 0.58 HVAC GENERAL OR EMS COMMERCIAL 0.16 0.32 0.18 0.35 HOTEL OCCUPANCY CONTROL COMMERCIAL 0.11 0.27 0.22 0.40 AIR SOURCE HEAT PUMP COMMERCIAL 0.18 0.19 0.19 0.44 GEO THERMAL HEAT PUMP COMMERCIAL 0.18 0.19 0.19 0.44 WATER SOURCE HEAT PUMP COMMERCIAL 0.24 0.23 0.17 0.36 GENERIC INDUSTRIAL PROCESS OTHER 0.28 0.14 0.38 0.20 PHOTOVOLTAIC SOLAR POWER OTHER 0.24 0.18 0.33 0.26 TRAFFIC LIGHTS OTHER 0.15 0.27 0.21 0.38 EXIT SIGNS OTHER 0.15 0.27 0.21 0.38 Kit-B: LF-SH, 1-13W, 1-20W, LED NL OTHER 0.16 0.21 0.29 0.34 Kit-C: 2-13W, 1-20W CFLs, FW OTHER 0.22 0.12 0.38 0.29 Kit-D: 2-13W, 1-20W, 1-23W, 2-LED NL, 1-SS OTHER 0.28 0.14 0.40 0.19 SEP.1: 5-13W CFLs, 2-Lime Lights, FW OTHER 0.19 0.10 0.41 0.29 SEP.2&3: 3-13W, 1-20W, 1-23W, 2-Lime lite, FW OTHER 0.20 0.11 0.41 0.28 FLAT (8760) OTHER 0.15 0.27 0.21 0.38 Source: Loadshapes sourced from several sources depending on availability of information. Primary source, for eligible measures was the PA TRM 2011, Table 2-1. Other necessary loadshape sources were modified to conform with PECO’s climate profile referencing Efficiency Vermont TRM, CA CEUS Statewide Profile, and Ontario Power Authority.

PECO PY 2013-2015 Act 129 - Phase II Energy Efficiency And Conservation Plan Page 203
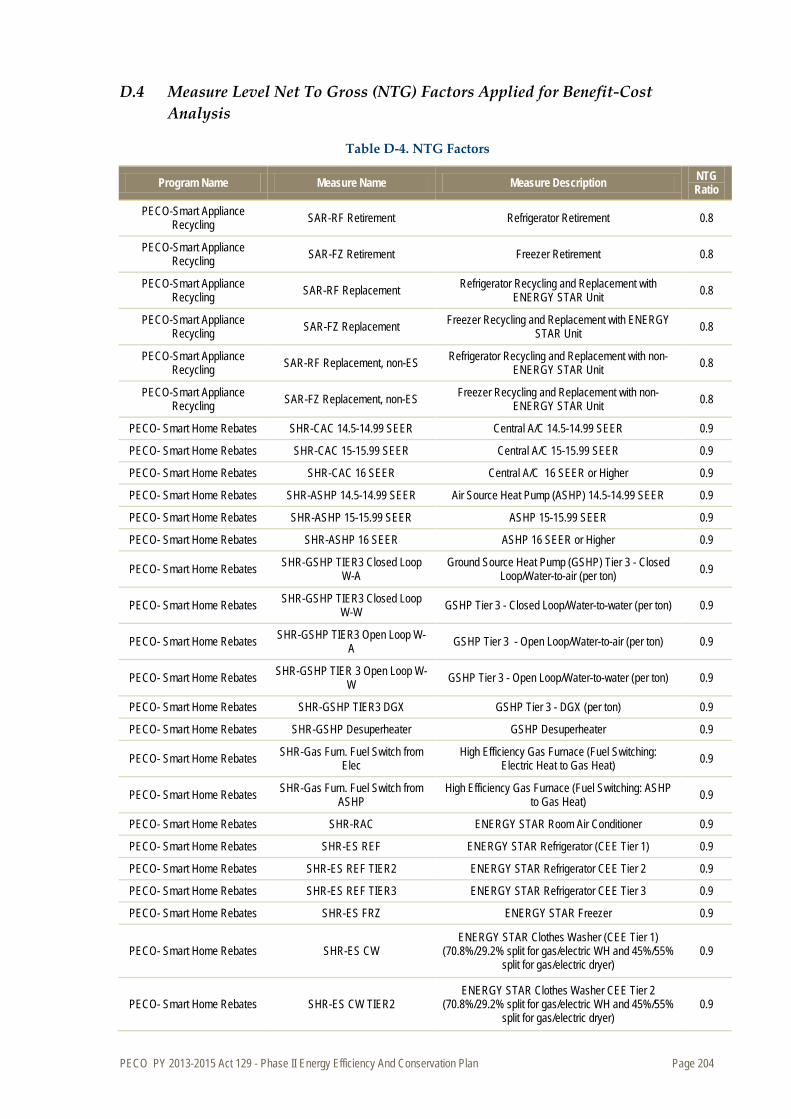
PECO PY 2013-2015 Act 129 - Phase II Energy Efficiency And Conservation Plan Page 204
D.4 Measure Level Net To Gross (NTG) Factors Applied for Benefit-Cost Analysis
Table D-4. NTG Factors
Program Name Measure Name Measure Description NTG Ratio
PECO-Smart Appliance Recycling SAR-RF Retirement Refrigerator Retirement 0.8
PECO-Smart Appliance Recycling SAR-FZ Retirement Freezer Retirement 0.8
PECO-Smart Appliance Recycling SAR-RF Replacement Refrigerator Recycling and Replacement with
ENERGY STAR Unit 0.8
PECO-Smart Appliance Recycling SAR-FZ Replacement Freezer Recycling and Replacement with ENERGY
STAR Unit 0.8
PECO-Smart Appliance Recycling SAR-RF Replacement, non-ES Refrigerator Recycling and Replacement with non-
ENERGY STAR Unit 0.8
PECO-Smart Appliance Recycling SAR-FZ Replacement, non-ES Freezer Recycling and Replacement with non-
ENERGY STAR Unit 0.8
PECO- Smart Home Rebates SHR-CAC 14.5-14.99 SEER Central A/C 14.5-14.99 SEER 0.9
PECO- Smart Home Rebates SHR-CAC 15-15.99 SEER Central A/C 15-15.99 SEER 0.9
PECO- Smart Home Rebates SHR-CAC 16 SEER Central A/C 16 SEER or Higher 0.9
PECO- Smart Home Rebates SHR-ASHP 14.5-14.99 SEER Air Source Heat Pump (ASHP) 14.5-14.99 SEER 0.9
PECO- Smart Home Rebates SHR-ASHP 15-15.99 SEER ASHP 15-15.99 SEER 0.9
PECO- Smart Home Rebates SHR-ASHP 16 SEER ASHP 16 SEER or Higher 0.9
PECO- Smart Home Rebates SHR-GSHP TIER3 Closed Loop W-A
Ground Source Heat Pump (GSHP) Tier 3 - Closed Loop/Water-to-air (per ton) 0.9
PECO- Smart Home Rebates SHR-GSHP TIER3 Closed Loop W-W GSHP Tier 3 - Closed Loop/Water-to-water (per ton) 0.9
PECO- Smart Home Rebates SHR-GSHP TIER3 Open Loop W-A GSHP Tier 3 - Open Loop/Water-to-air (per ton) 0.9
PECO- Smart Home Rebates SHR-GSHP TIER 3 Open Loop W-W GSHP Tier 3 - Open Loop/Water-to-water (per ton) 0.9
PECO- Smart Home Rebates SHR-GSHP TIER3 DGX GSHP Tier 3 - DGX (per ton) 0.9
PECO- Smart Home Rebates SHR-GSHP Desuperheater GSHP Desuperheater 0.9
PECO- Smart Home Rebates SHR-Gas Furn. Fuel Switch from Elec
High Efficiency Gas Furnace (Fuel Switching: Electric Heat to Gas Heat) 0.9
PECO- Smart Home Rebates SHR-Gas Furn. Fuel Switch from ASHP
High Efficiency Gas Furnace (Fuel Switching: ASHP to Gas Heat) 0.9
PECO- Smart Home Rebates SHR-RAC ENERGY STAR Room Air Conditioner 0.9
PECO- Smart Home Rebates SHR-ES REF ENERGY STAR Refrigerator (CEE Tier 1) 0.9
PECO- Smart Home Rebates SHR-ES REF TIER2 ENERGY STAR Refrigerator CEE Tier 2 0.9
PECO- Smart Home Rebates SHR-ES REF TIER3 ENERGY STAR Refrigerator CEE Tier 3 0.9
PECO- Smart Home Rebates SHR-ES FRZ ENERGY STAR Freezer 0.9
PECO- Smart Home Rebates SHR-ES CW ENERGY STAR Clothes Washer (CEE Tier 1)
(70.8%/29.2% split for gas/electric WH and 45%/55% split for gas/electric dryer)
0.9
PECO- Smart Home Rebates SHR-ES CW TIER2 ENERGY STAR Clothes Washer CEE Tier 2
(70.8%/29.2% split for gas/electric WH and 45%/55% split for gas/electric dryer)
0.9

PECO PY 2013-2015 Act 129 - Phase II Energy Efficiency And Conservation Plan Page 205
Program Name Measure Name Measure Description NTG Ratio
PECO- Smart Home Rebates SHR-ES CW TIER3 ENERGY STAR Clothes Washer CEE Tier 3
(70.8%/29.2% split for gas/electric WH and 45%/55% split for gas/electric dryer)
0.9
PECO- Smart Home Rebates SHR-HWH EF=0.93 Efficient Electric Hot Water Heater, EF = 0.93 0.9
PECO- Smart Home Rebates SHR-HWH EF=0.94 Efficient Electric Hot Water Heater, EF = 0.94 0.9
PECO- Smart Home Rebates SHR-HWH EF=0.95 Efficient Electric Hot Water Heater, EF = 0.95 0.9
PECO- Smart Home Rebates SHR-HPWH EF=2.0 Heat Pump Water Heaters, EF = 2.0 0.9
PECO- Smart Home Rebates SHR-HPWH EF=2.2 Heat Pump Water Heaters, EF = 2.2 0.9
PECO- Smart Home Rebates SHR-HPWH EF=2.3 Heat Pump Water Heaters, EF = 2.3 0.9
PECO- Smart Home Rebates SHR-Gas WH Fuel Switch from Elec
ENERGY STAR Gas Water Heater (Fuel Switching: Electric Water Heater to Gas Water Heater) 0.9
PECO- Smart Home Rebates SHR-ES TV ENERGY STAR TVs 0.9
PECO- Smart Home Rebates SHR-Power Strip Advanced Power Strips 0.9
PECO- Smart Home Rebates SHR-Power Strip_7-plug Advanced Power Strips 0.9
PECO- Smart Home Rebates SL-11W CFL ENERGY STAR CFL Bulbs (screw-in) 40 Watt Incan. To a 11 Watt CFL 0.4
PECO- Smart Home Rebates SL-13W CFL ENERGY STAR CFL Bulbs (screw-in) 60 Watt Incan. To a 13 Watt CFL 0.4
PECO- Smart Home Rebates SL-20W CFL ENERGY STAR CFL Bulbs (screw-in) 53 Watt Halogen To a 20 Watt CFL 0.4
PECO- Smart Home Rebates SL-23W CFL ENERGY STAR CFL Bulbs (screw-in) 72 Watt Halogen To a 23 Watt CFL 0.4
PECO- Smart Home Rebates SL- Candelabra LED 2W, 2.5W or 3W Candelabra LED 0.9
PECO- Smart Home Rebates SL- 2W G LED 2W G25 or 2W G16.5 LED 0.9
PECO- Smart Home Rebates SL- 2.5W A LED 2.5W A15 LED 0.9
PECO- Smart Home Rebates SL-7W R LED 7W R20 LED 0.9
PECO- Smart Home Rebates SL-11W PAR LED 11W PAR30 LED 0.9
PECO- Smart Home Rebates SL-16W PAR LED 16W PAR38 LED 0.9
PECO- Smart Home Rebates SL-4W MR LED 4W MR16 LED 0.9
PECO- Smart Home Rebates SL-ES IN FIX ENERGY STAR Indoor Fixture (hard wired, pin-based 0.9
PECO- Smart House Call WHP-ASHP DUCT SEAL ASHP (Duct Sealing) 0.9
PECO- Smart House Call WHP-ASHP MAINT ASHP (Maintenance) 0.9
PECO- Smart House Call WHP-CAC MAINT Central A/C (Maintenance) 0.9
PECO- Smart House Call WHP-AIR SEAL ELEC Air Sealing - Electric SH 0.9
PECO- Smart House Call WHP-CEIL INSUL R49 ELEC Ceiling Insulation R-49 from R19 - Electric SH 0.9
PECO- Smart House Call WHP-WALL INSUL R19 ELEC Addl. Wall Insulation, R-19, blown-in - Electric SH 0.9
PECO- Smart House Call WHP-LF Showerhead 1.5GPM Low Flow Showerheads - Elec WH 1.0
PECO- Smart House Call WHP-Kitchen Faucet Aerator 1GPM Kitchen Faucet Aerators - Elec WH 1.0
PECO- Smart House Call WHP-Bathroom Faucet Aerator 1GPM Bathroom Faucet Aerators - Elec WH 1.0
PECO- Smart House Call WHP-WH Wrap 1GPM Water Heater Wrap - Elec WH 1.0
PECO- Smart House Call WHP-WH Pipe Wrap Pipe Wrap - Elec WH 1.0
PECO- Smart House Call WHP-Power Strip_7-plug Advanced Power Strips 1.0
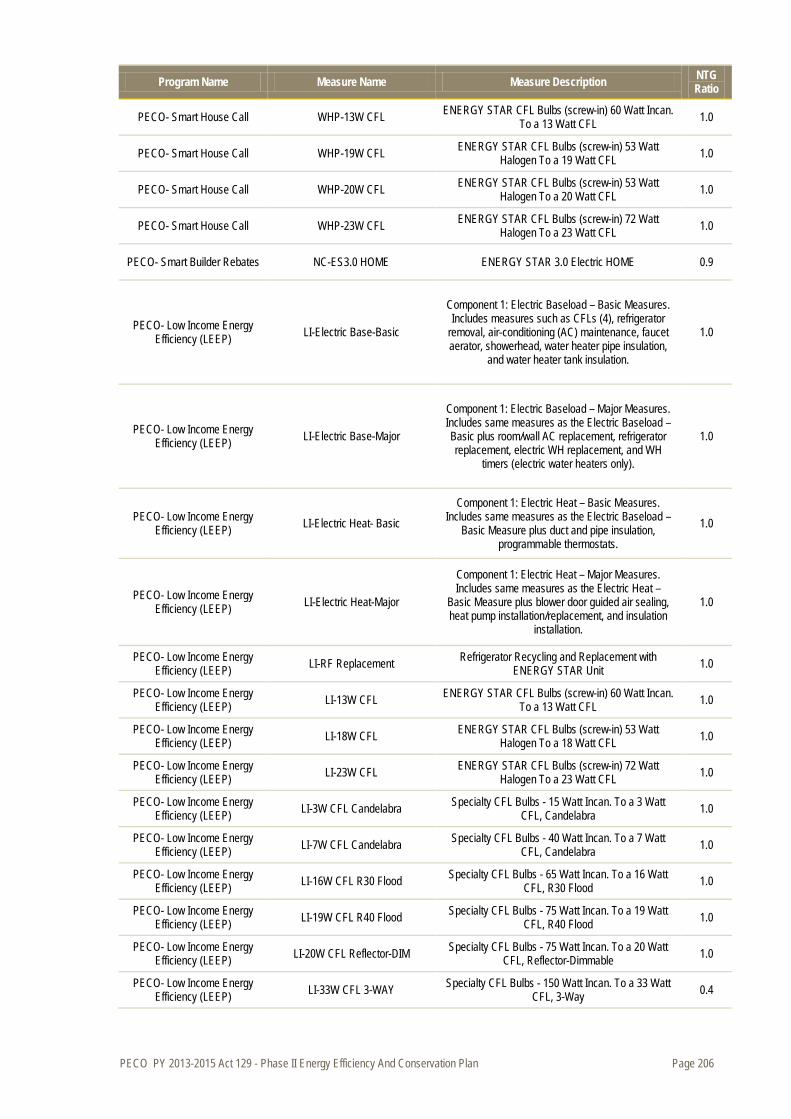
PECO PY 2013-2015 Act 129 - Phase II Energy Efficiency And Conservation Plan Page 206
Program Name Measure Name Measure Description NTG Ratio
PECO- Smart House Call WHP-13W CFL ENERGY STAR CFL Bulbs (screw-in) 60 Watt Incan. To a 13 Watt CFL 1.0
PECO- Smart House Call WHP-19W CFL ENERGY STAR CFL Bulbs (screw-in) 53 Watt Halogen To a 19 Watt CFL 1.0
PECO- Smart House Call WHP-20W CFL ENERGY STAR CFL Bulbs (screw-in) 53 Watt Halogen To a 20 Watt CFL 1.0
PECO- Smart House Call WHP-23W CFL ENERGY STAR CFL Bulbs (screw-in) 72 Watt Halogen To a 23 Watt CFL 1.0
PECO- Smart Builder Rebates NC-ES3.0 HOME ENERGY STAR 3.0 Electric HOME 0.9
PECO- Low Income Energy Efficiency (LEEP) LI-Electric Base-Basic
Component 1: Electric Baseload – Basic Measures. Includes measures such as CFLs (4), refrigerator
removal, air-conditioning (AC) maintenance, faucet aerator, showerhead, water heater pipe insulation,
and water heater tank insulation.
1.0
PECO- Low Income Energy Efficiency (LEEP) LI-Electric Base-Major
Component 1: Electric Baseload – Major Measures. Includes same measures as the Electric Baseload – Basic plus room/wall AC replacement, refrigerator replacement, electric WH replacement, and WH
timers (electric water heaters only).
1.0
PECO- Low Income Energy Efficiency (LEEP) LI-Electric Heat- Basic
Component 1: Electric Heat – Basic Measures. Includes same measures as the Electric Baseload –
Basic Measure plus duct and pipe insulation, programmable thermostats.
1.0
PECO- Low Income Energy Efficiency (LEEP) LI-Electric Heat-Major
Component 1: Electric Heat – Major Measures. Includes same measures as the Electric Heat –
Basic Measure plus blower door guided air sealing, heat pump installation/replacement, and insulation
installation.
1.0
PECO- Low Income Energy Efficiency (LEEP) LI-RF Replacement Refrigerator Recycling and Replacement with
ENERGY STAR Unit 1.0
PECO- Low Income Energy Efficiency (LEEP) LI-13W CFL ENERGY STAR CFL Bulbs (screw-in) 60 Watt Incan.
To a 13 Watt CFL 1.0
PECO- Low Income Energy Efficiency (LEEP) LI-18W CFL ENERGY STAR CFL Bulbs (screw-in) 53 Watt
Halogen To a 18 Watt CFL 1.0
PECO- Low Income Energy Efficiency (LEEP) LI-23W CFL ENERGY STAR CFL Bulbs (screw-in) 72 Watt
Halogen To a 23 Watt CFL 1.0
PECO- Low Income Energy Efficiency (LEEP) LI-3W CFL Candelabra Specialty CFL Bulbs - 15 Watt Incan. To a 3 Watt
CFL, Candelabra 1.0
PECO- Low Income Energy Efficiency (LEEP) LI-7W CFL Candelabra Specialty CFL Bulbs - 40 Watt Incan. To a 7 Watt
CFL, Candelabra 1.0
PECO- Low Income Energy Efficiency (LEEP) LI-16W CFL R30 Flood Specialty CFL Bulbs - 65 Watt Incan. To a 16 Watt
CFL, R30 Flood 1.0
PECO- Low Income Energy Efficiency (LEEP) LI-19W CFL R40 Flood Specialty CFL Bulbs - 75 Watt Incan. To a 19 Watt
CFL, R40 Flood 1.0
PECO- Low Income Energy Efficiency (LEEP) LI-20W CFL Reflector-DIM Specialty CFL Bulbs - 75 Watt Incan. To a 20 Watt
CFL, Reflector-Dimmable 1.0
PECO- Low Income Energy Efficiency (LEEP) LI-33W CFL 3-WAY Specialty CFL Bulbs - 150 Watt Incan. To a 33 Watt
CFL, 3-Way 0.4
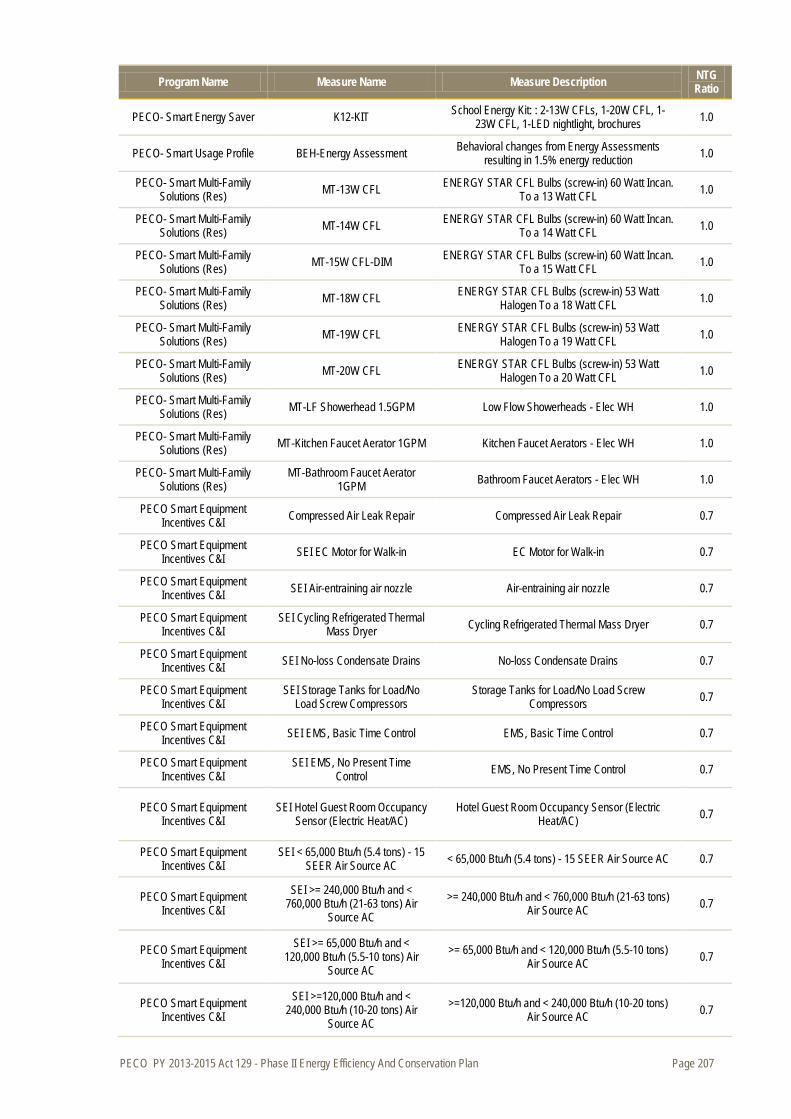
PECO PY 2013-2015 Act 129 - Phase II Energy Efficiency And Conservation Plan Page 207
Program Name Measure Name Measure Description NTG Ratio
PECO- Smart Energy Saver K12-KIT School Energy Kit: : 2-13W CFLs, 1-20W CFL, 1-23W CFL, 1-LED nightlight, brochures 1.0
PECO- Smart Usage Profile BEH-Energy Assessment Behavioral changes from Energy Assessments resulting in 1.5% energy reduction 1.0
PECO- Smart Multi-Family Solutions (Res) MT-13W CFL ENERGY STAR CFL Bulbs (screw-in) 60 Watt Incan.
To a 13 Watt CFL 1.0
PECO- Smart Multi-Family Solutions (Res) MT-14W CFL ENERGY STAR CFL Bulbs (screw-in) 60 Watt Incan.
To a 14 Watt CFL 1.0
PECO- Smart Multi-Family Solutions (Res) MT-15W CFL-DIM ENERGY STAR CFL Bulbs (screw-in) 60 Watt Incan.
To a 15 Watt CFL 1.0
PECO- Smart Multi-Family Solutions (Res) MT-18W CFL ENERGY STAR CFL Bulbs (screw-in) 53 Watt
Halogen To a 18 Watt CFL 1.0
PECO- Smart Multi-Family Solutions (Res) MT-19W CFL ENERGY STAR CFL Bulbs (screw-in) 53 Watt
Halogen To a 19 Watt CFL 1.0
PECO- Smart Multi-Family Solutions (Res) MT-20W CFL ENERGY STAR CFL Bulbs (screw-in) 53 Watt
Halogen To a 20 Watt CFL 1.0
PECO- Smart Multi-Family Solutions (Res) MT-LF Showerhead 1.5GPM Low Flow Showerheads - Elec WH 1.0
PECO- Smart Multi-Family Solutions (Res) MT-Kitchen Faucet Aerator 1GPM Kitchen Faucet Aerators - Elec WH 1.0
PECO- Smart Multi-Family Solutions (Res)
MT-Bathroom Faucet Aerator 1GPM Bathroom Faucet Aerators - Elec WH 1.0
PECO Smart Equipment Incentives C&I Compressed Air Leak Repair Compressed Air Leak Repair 0.7
PECO Smart Equipment Incentives C&I SEI EC Motor for Walk-in EC Motor for Walk-in 0.7
PECO Smart Equipment Incentives C&I SEI Air-entraining air nozzle Air-entraining air nozzle 0.7
PECO Smart Equipment Incentives C&I
SEI Cycling Refrigerated Thermal Mass Dryer Cycling Refrigerated Thermal Mass Dryer 0.7
PECO Smart Equipment Incentives C&I SEI No-loss Condensate Drains No-loss Condensate Drains 0.7
PECO Smart Equipment Incentives C&I
SEI Storage Tanks for Load/No Load Screw Compressors
Storage Tanks for Load/No Load Screw Compressors 0.7
PECO Smart Equipment Incentives C&I SEI EMS, Basic Time Control EMS, Basic Time Control 0.7
PECO Smart Equipment Incentives C&I
SEI EMS, No Present Time Control EMS, No Present Time Control 0.7
PECO Smart Equipment Incentives C&I
SEI Hotel Guest Room Occupancy Sensor (Electric Heat/AC)
Hotel Guest Room Occupancy Sensor (Electric Heat/AC) 0.7
PECO Smart Equipment Incentives C&I
SEI < 65,000 Btu/h (5.4 tons) - 15 SEER Air Source AC < 65,000 Btu/h (5.4 tons) - 15 SEER Air Source AC 0.7
PECO Smart Equipment Incentives C&I
SEI >= 240,000 Btu/h and < 760,000 Btu/h (21-63 tons) Air
Source AC >= 240,000 Btu/h and < 760,000 Btu/h (21-63 tons)
Air Source AC 0.7
PECO Smart Equipment Incentives C&I
SEI >= 65,000 Btu/h and < 120,000 Btu/h (5.5-10 tons) Air
Source AC >= 65,000 Btu/h and < 120,000 Btu/h (5.5-10 tons)
Air Source AC 0.7
PECO Smart Equipment Incentives C&I
SEI >=120,000 Btu/h and < 240,000 Btu/h (10-20 tons) Air
Source AC >=120,000 Btu/h and < 240,000 Btu/h (10-20 tons)
Air Source AC 0.7
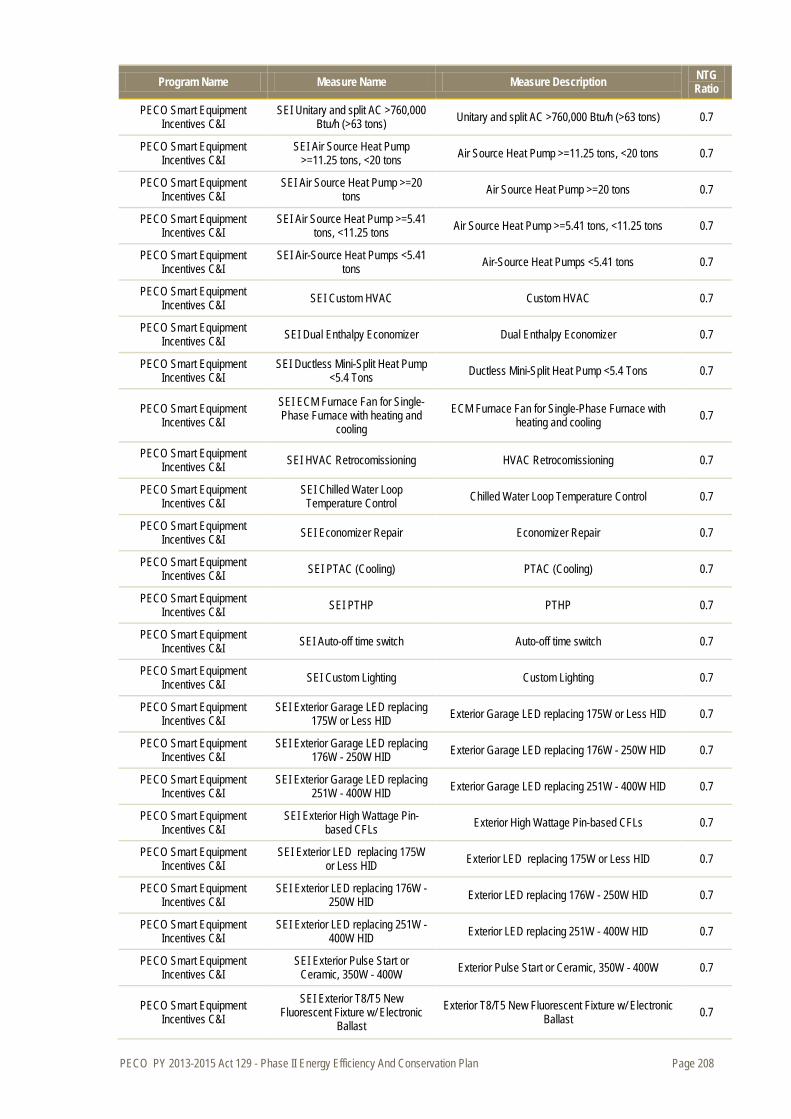
PECO PY 2013-2015 Act 129 - Phase II Energy Efficiency And Conservation Plan Page 208
Program Name Measure Name Measure Description NTG Ratio
PECO Smart Equipment Incentives C&I
SEI Unitary and split AC >760,000 Btu/h (>63 tons) Unitary and split AC >760,000 Btu/h (>63 tons) 0.7
PECO Smart Equipment Incentives C&I
SEI Air Source Heat Pump >=11.25 tons, <20 tons Air Source Heat Pump >=11.25 tons, <20 tons 0.7
PECO Smart Equipment Incentives C&I
SEI Air Source Heat Pump >=20 tons Air Source Heat Pump >=20 tons 0.7
PECO Smart Equipment Incentives C&I
SEI Air Source Heat Pump >=5.41 tons, <11.25 tons Air Source Heat Pump >=5.41 tons, <11.25 tons 0.7
PECO Smart Equipment Incentives C&I
SEI Air-Source Heat Pumps <5.41 tons Air-Source Heat Pumps <5.41 tons 0.7
PECO Smart Equipment Incentives C&I SEI Custom HVAC Custom HVAC 0.7
PECO Smart Equipment Incentives C&I SEI Dual Enthalpy Economizer Dual Enthalpy Economizer 0.7
PECO Smart Equipment Incentives C&I
SEI Ductless Mini-Split Heat Pump <5.4 Tons Ductless Mini-Split Heat Pump <5.4 Tons 0.7
PECO Smart Equipment Incentives C&I
SEI ECM Furnace Fan for Single-Phase Furnace with heating and
cooling ECM Furnace Fan for Single-Phase Furnace with
heating and cooling 0.7
PECO Smart Equipment Incentives C&I SEI HVAC Retrocomissioning HVAC Retrocomissioning 0.7
PECO Smart Equipment Incentives C&I
SEI Chilled Water Loop Temperature Control Chilled Water Loop Temperature Control 0.7
PECO Smart Equipment Incentives C&I SEI Economizer Repair Economizer Repair 0.7
PECO Smart Equipment Incentives C&I SEI PTAC (Cooling) PTAC (Cooling) 0.7
PECO Smart Equipment Incentives C&I SEI PTHP PTHP 0.7
PECO Smart Equipment Incentives C&I SEI Auto-off time switch Auto-off time switch 0.7
PECO Smart Equipment Incentives C&I SEI Custom Lighting Custom Lighting 0.7
PECO Smart Equipment Incentives C&I
SEI Exterior Garage LED replacing 175W or Less HID Exterior Garage LED replacing 175W or Less HID 0.7
PECO Smart Equipment Incentives C&I
SEI Exterior Garage LED replacing 176W - 250W HID Exterior Garage LED replacing 176W - 250W HID 0.7
PECO Smart Equipment Incentives C&I
SEI Exterior Garage LED replacing 251W - 400W HID Exterior Garage LED replacing 251W - 400W HID 0.7
PECO Smart Equipment Incentives C&I
SEI Exterior High Wattage Pin-based CFLs Exterior High Wattage Pin-based CFLs 0.7
PECO Smart Equipment Incentives C&I
SEI Exterior LED replacing 175W or Less HID Exterior LED replacing 175W or Less HID 0.7
PECO Smart Equipment Incentives C&I
SEI Exterior LED replacing 176W - 250W HID Exterior LED replacing 176W - 250W HID 0.7
PECO Smart Equipment Incentives C&I
SEI Exterior LED replacing 251W - 400W HID Exterior LED replacing 251W - 400W HID 0.7
PECO Smart Equipment Incentives C&I
SEI Exterior Pulse Start or Ceramic, 350W - 400W Exterior Pulse Start or Ceramic, 350W - 400W 0.7
PECO Smart Equipment Incentives C&I
SEI Exterior T8/T5 New Fluorescent Fixture w/ Electronic
Ballast Exterior T8/T5 New Fluorescent Fixture w/ Electronic
Ballast 0.7
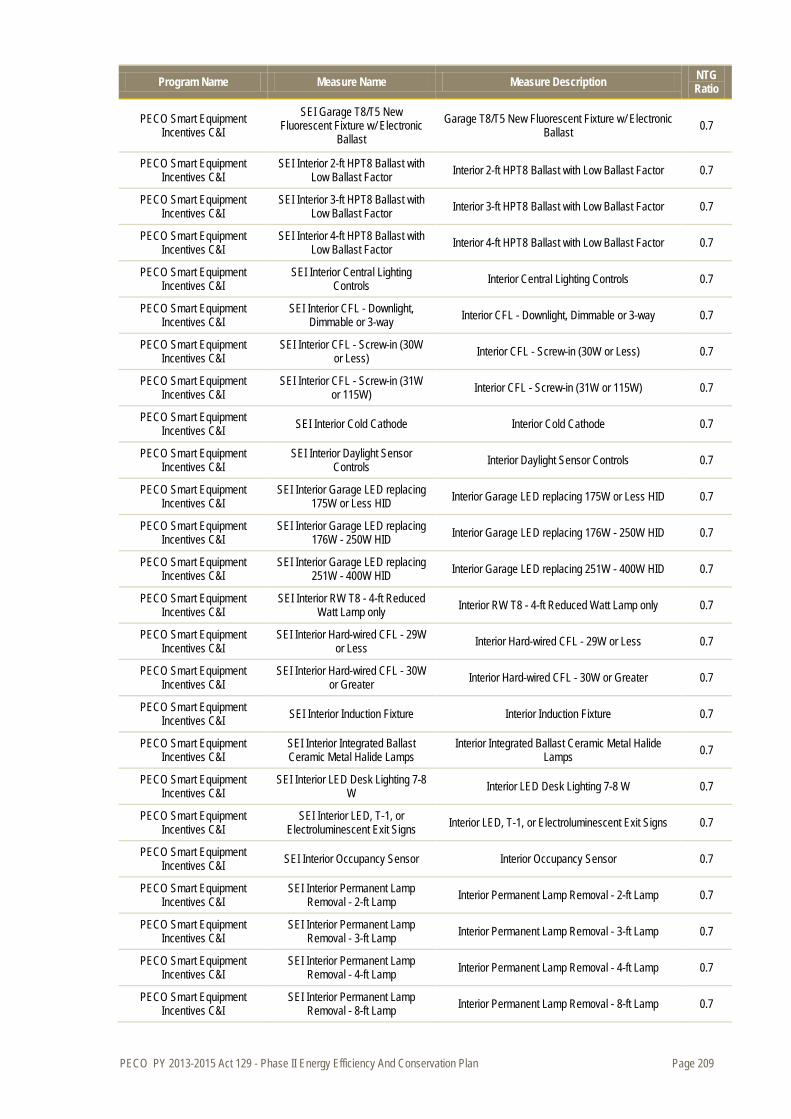
PECO PY 2013-2015 Act 129 - Phase II Energy Efficiency And Conservation Plan Page 209
Program Name Measure Name Measure Description NTG Ratio
PECO Smart Equipment Incentives C&I
SEI Garage T8/T5 New Fluorescent Fixture w/ Electronic
Ballast Garage T8/T5 New Fluorescent Fixture w/ Electronic
Ballast 0.7
PECO Smart Equipment Incentives C&I
SEI Interior 2-ft HPT8 Ballast with Low Ballast Factor Interior 2-ft HPT8 Ballast with Low Ballast Factor 0.7
PECO Smart Equipment Incentives C&I
SEI Interior 3-ft HPT8 Ballast with Low Ballast Factor Interior 3-ft HPT8 Ballast with Low Ballast Factor 0.7
PECO Smart Equipment Incentives C&I
SEI Interior 4-ft HPT8 Ballast with Low Ballast Factor Interior 4-ft HPT8 Ballast with Low Ballast Factor 0.7
PECO Smart Equipment Incentives C&I
SEI Interior Central Lighting Controls Interior Central Lighting Controls 0.7
PECO Smart Equipment Incentives C&I
SEI Interior CFL - Downlight, Dimmable or 3-way Interior CFL - Downlight, Dimmable or 3-way 0.7
PECO Smart Equipment Incentives C&I
SEI Interior CFL - Screw-in (30W or Less) Interior CFL - Screw-in (30W or Less) 0.7
PECO Smart Equipment Incentives C&I
SEI Interior CFL - Screw-in (31W or 115W) Interior CFL - Screw-in (31W or 115W) 0.7
PECO Smart Equipment Incentives C&I SEI Interior Cold Cathode Interior Cold Cathode 0.7
PECO Smart Equipment Incentives C&I
SEI Interior Daylight Sensor Controls Interior Daylight Sensor Controls 0.7
PECO Smart Equipment Incentives C&I
SEI Interior Garage LED replacing 175W or Less HID Interior Garage LED replacing 175W or Less HID 0.7
PECO Smart Equipment Incentives C&I
SEI Interior Garage LED replacing 176W - 250W HID Interior Garage LED replacing 176W - 250W HID 0.7
PECO Smart Equipment Incentives C&I
SEI Interior Garage LED replacing 251W - 400W HID Interior Garage LED replacing 251W - 400W HID 0.7
PECO Smart Equipment Incentives C&I
SEI Interior RW T8 - 4-ft Reduced Watt Lamp only Interior RW T8 - 4-ft Reduced Watt Lamp only 0.7
PECO Smart Equipment Incentives C&I
SEI Interior Hard-wired CFL - 29W or Less Interior Hard-wired CFL - 29W or Less 0.7
PECO Smart Equipment Incentives C&I
SEI Interior Hard-wired CFL - 30W or Greater Interior Hard-wired CFL - 30W or Greater 0.7
PECO Smart Equipment Incentives C&I SEI Interior Induction Fixture Interior Induction Fixture 0.7
PECO Smart Equipment Incentives C&I
SEI Interior Integrated Ballast Ceramic Metal Halide Lamps
Interior Integrated Ballast Ceramic Metal Halide Lamps 0.7
PECO Smart Equipment Incentives C&I
SEI Interior LED Desk Lighting 7-8 W Interior LED Desk Lighting 7-8 W 0.7
PECO Smart Equipment Incentives C&I
SEI Interior LED, T-1, or Electroluminescent Exit Signs Interior LED, T-1, or Electroluminescent Exit Signs 0.7
PECO Smart Equipment Incentives C&I SEI Interior Occupancy Sensor Interior Occupancy Sensor 0.7
PECO Smart Equipment Incentives C&I
SEI Interior Permanent Lamp Removal - 2-ft Lamp Interior Permanent Lamp Removal - 2-ft Lamp 0.7
PECO Smart Equipment Incentives C&I
SEI Interior Permanent Lamp Removal - 3-ft Lamp Interior Permanent Lamp Removal - 3-ft Lamp 0.7
PECO Smart Equipment Incentives C&I
SEI Interior Permanent Lamp Removal - 4-ft Lamp Interior Permanent Lamp Removal - 4-ft Lamp 0.7
PECO Smart Equipment Incentives C&I
SEI Interior Permanent Lamp Removal - 8-ft Lamp Interior Permanent Lamp Removal - 8-ft Lamp 0.7
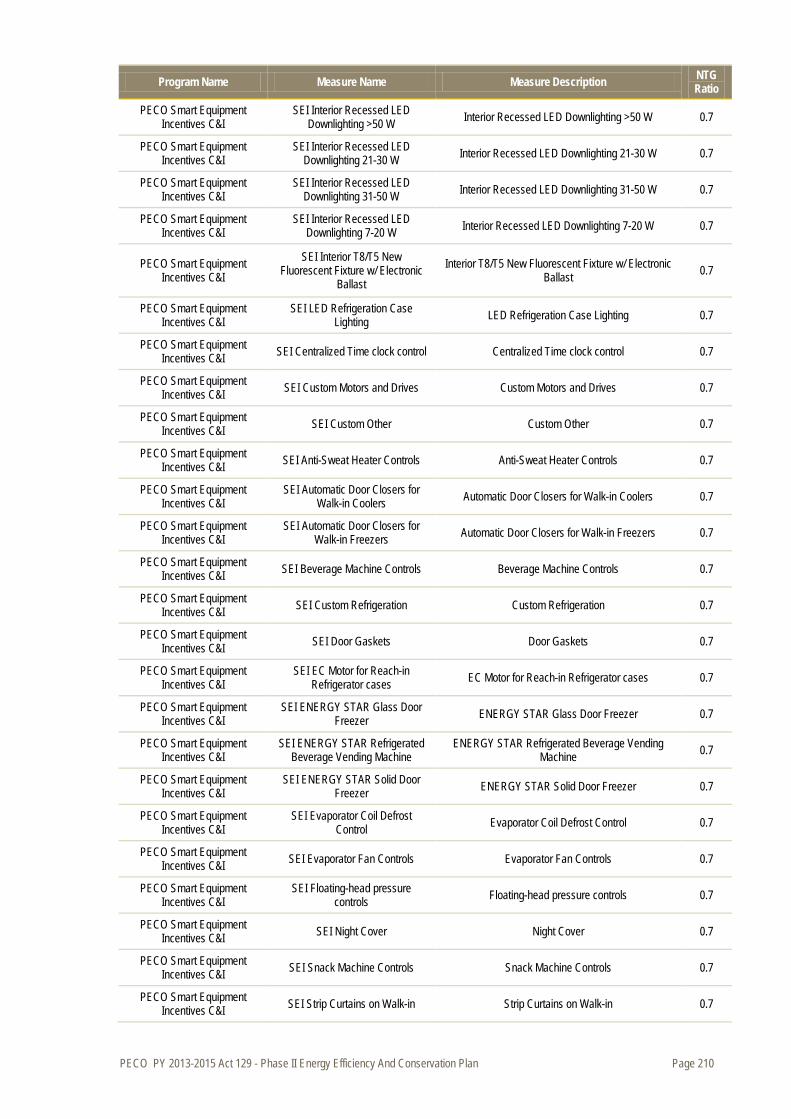
PECO PY 2013-2015 Act 129 - Phase II Energy Efficiency And Conservation Plan Page 210
Program Name Measure Name Measure Description NTG Ratio
PECO Smart Equipment Incentives C&I
SEI Interior Recessed LED Downlighting >50 W Interior Recessed LED Downlighting >50 W 0.7
PECO Smart Equipment Incentives C&I
SEI Interior Recessed LED Downlighting 21-30 W Interior Recessed LED Downlighting 21-30 W 0.7
PECO Smart Equipment Incentives C&I
SEI Interior Recessed LED Downlighting 31-50 W Interior Recessed LED Downlighting 31-50 W 0.7
PECO Smart Equipment Incentives C&I
SEI Interior Recessed LED Downlighting 7-20 W Interior Recessed LED Downlighting 7-20 W 0.7
PECO Smart Equipment Incentives C&I
SEI Interior T8/T5 New Fluorescent Fixture w/ Electronic
Ballast Interior T8/T5 New Fluorescent Fixture w/ Electronic
Ballast 0.7
PECO Smart Equipment Incentives C&I
SEI LED Refrigeration Case Lighting LED Refrigeration Case Lighting 0.7
PECO Smart Equipment Incentives C&I SEI Centralized Time clock control Centralized Time clock control 0.7
PECO Smart Equipment Incentives C&I SEI Custom Motors and Drives Custom Motors and Drives 0.7
PECO Smart Equipment Incentives C&I SEI Custom Other Custom Other 0.7
PECO Smart Equipment Incentives C&I SEI Anti-Sweat Heater Controls Anti-Sweat Heater Controls 0.7
PECO Smart Equipment Incentives C&I
SEI Automatic Door Closers for Walk-in Coolers Automatic Door Closers for Walk-in Coolers 0.7
PECO Smart Equipment Incentives C&I
SEI Automatic Door Closers for Walk-in Freezers Automatic Door Closers for Walk-in Freezers 0.7
PECO Smart Equipment Incentives C&I SEI Beverage Machine Controls Beverage Machine Controls 0.7
PECO Smart Equipment Incentives C&I SEI Custom Refrigeration Custom Refrigeration 0.7
PECO Smart Equipment Incentives C&I SEI Door Gaskets Door Gaskets 0.7
PECO Smart Equipment Incentives C&I
SEI EC Motor for Reach-in Refrigerator cases EC Motor for Reach-in Refrigerator cases 0.7
PECO Smart Equipment Incentives C&I
SEI ENERGY STAR Glass Door Freezer ENERGY STAR Glass Door Freezer 0.7
PECO Smart Equipment Incentives C&I
SEI ENERGY STAR Refrigerated Beverage Vending Machine
ENERGY STAR Refrigerated Beverage Vending Machine 0.7
PECO Smart Equipment Incentives C&I
SEI ENERGY STAR Solid Door Freezer ENERGY STAR Solid Door Freezer 0.7
PECO Smart Equipment Incentives C&I
SEI Evaporator Coil Defrost Control Evaporator Coil Defrost Control 0.7
PECO Smart Equipment Incentives C&I SEI Evaporator Fan Controls Evaporator Fan Controls 0.7
PECO Smart Equipment Incentives C&I
SEI Floating-head pressure controls Floating-head pressure controls 0.7
PECO Smart Equipment Incentives C&I SEI Night Cover Night Cover 0.7
PECO Smart Equipment Incentives C&I SEI Snack Machine Controls Snack Machine Controls 0.7
PECO Smart Equipment Incentives C&I SEI Strip Curtains on Walk-in Strip Curtains on Walk-in 0.7

PECO PY 2013-2015 Act 129 - Phase II Energy Efficiency And Conservation Plan Page 211
Program Name Measure Name Measure Description NTG Ratio
PECO Smart Equipment Incentives C&I SEI Suction Pipe Insulation Suction Pipe Insulation 0.7
PECO Smart Equipment Incentives C&I SEI VSD on HVAC Fans VSD on HVAC Fans 0.7
PECO Smart Equipment Incentives C&I SEI VSD on HVAC Pumps VSD on HVAC Pumps 0.7
PECO Smart Equipment Incentives C&I
SEI VSD on Kitchen Fan Hood Retrofit Hood) VSD on Kitchen Fan Hood Retrofit Hood) 0.7
PECO Smart Equipment Incentives C&I
SEI VSD on Process Motor < 50 HP VSD on Process Motor < 50 HP 0.7
PECO Smart Equipment Incentives C&I
SEI VSD on Screw Air Compressor < 50 HP VSD on Screw Air Compressor < 50 HP 0.7
PECO Smart Equipment Incentives C&I
SEI Faucet Aerators, electric water heating Faucet Aerators, electric water heating 0.7
PECO Smart Equipment Incentives C&I
SEI Low-Flow Showerheads, electric water heating Low-Flow Showerheads, electric water heating 0.7
PECO- Smart Business Solutions DI Auto-off time switch Auto-off time switch 0.7
PECO- Smart Business Solutions
DI Interior Central Lighting Controls Interior Central Lighting Controls 0.7
PECO- Smart Business Solutions
DI Interior CFL - Downlight, Dimmable or 3-way Interior CFL - Downlight, Dimmable or 3-way 0.7
PECO- Smart Business Solutions
DI Interior CFL - Screw-in (30W or Less) Interior CFL - Screw-in (30W or Less) 0.7
PECO- Smart Business Solutions
DI Interior CFL - Screw-in (31W or 115W) Interior CFL - Screw-in (31W or 115W) 0.7
PECO- Smart Business Solutions
DI Interior Daylight Sensor Controls Interior Daylight Sensor Controls 0.7
PECO- Smart Business Solutions
DI Interior HP/RW T8 4ft Red Watt Lamp Interior RW T8 - 4-ft Reduced Watt Lamp only 0.7
PECO- Smart Business Solutions DI Interior LED Exit sign Interior LED, T-1, or Electroluminescent Exit Signs 0.7
PECO- Smart Business Solutions DI Interior Occupancy Sensor Interior Occupancy Sensor 0.7
PECO- Smart Business Solutions
DI Interior Permanent Lamp Removal - 2-ft Lamp Interior Permanent Lamp Removal - 2-ft Lamp 0.7
PECO- Smart Business Solutions
DI Interior Permanent Lamp Removal - 3-ft Lamp Interior Permanent Lamp Removal - 3-ft Lamp 0.7
PECO- Smart Business Solutions
DI Interior Permanent Lamp Removal - 4-ft Lamp Interior Permanent Lamp Removal - 4-ft Lamp 0.7
PECO- Smart Business Solutions
DI Interior Permanent Lamp Removal - 8-ft Lamp Interior Permanent Lamp Removal - 8-ft Lamp 0.7
PECO- Smart Business Solutions
DI Interior Recessed LED Downlighting >50 W Interior Recessed LED Downlighting >50 W 0.7
PECO- Smart Business Solutions
DI Interior Recessed LED Downlighting 21-30 W Interior Recessed LED Downlighting 21-30 W 0.7
PECO- Smart Business Solutions
DI Interior Recessed LED Downlighting 31-50 W Interior Recessed LED Downlighting 31-50 W 0.7
PECO- Smart Business Solutions
DI LED Refrigeration Case Lighting LED Refrigeration Case Lighting 0.7
PECO- Smart Business Solutions DI Time clock control Time clock control 0.7
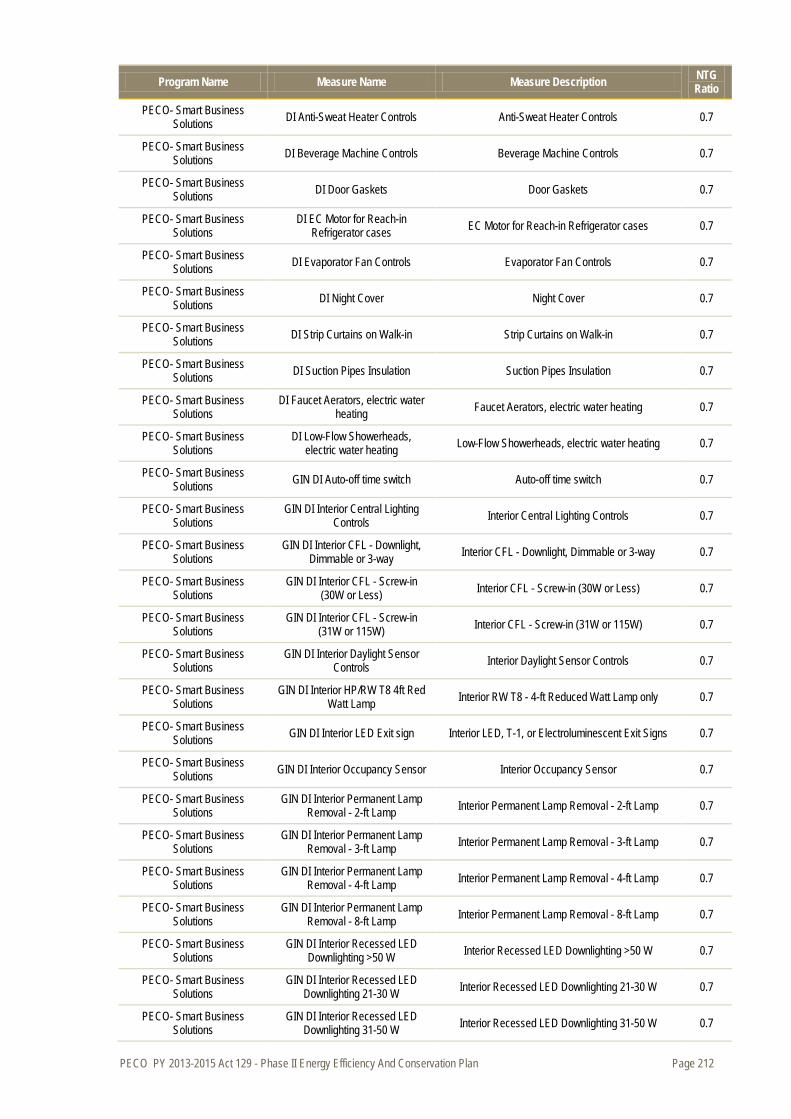
PECO PY 2013-2015 Act 129 - Phase II Energy Efficiency And Conservation Plan Page 212
Program Name Measure Name Measure Description NTG Ratio
PECO- Smart Business Solutions DI Anti-Sweat Heater Controls Anti-Sweat Heater Controls 0.7
PECO- Smart Business Solutions DI Beverage Machine Controls Beverage Machine Controls 0.7
PECO- Smart Business Solutions DI Door Gaskets Door Gaskets 0.7
PECO- Smart Business Solutions
DI EC Motor for Reach-in Refrigerator cases EC Motor for Reach-in Refrigerator cases 0.7
PECO- Smart Business Solutions DI Evaporator Fan Controls Evaporator Fan Controls 0.7
PECO- Smart Business Solutions DI Night Cover Night Cover 0.7
PECO- Smart Business Solutions DI Strip Curtains on Walk-in Strip Curtains on Walk-in 0.7
PECO- Smart Business Solutions DI Suction Pipes Insulation Suction Pipes Insulation 0.7
PECO- Smart Business Solutions
DI Faucet Aerators, electric water heating Faucet Aerators, electric water heating 0.7
PECO- Smart Business Solutions
DI Low-Flow Showerheads, electric water heating Low-Flow Showerheads, electric water heating 0.7
PECO- Smart Business Solutions GIN DI Auto-off time switch Auto-off time switch 0.7
PECO- Smart Business Solutions
GIN DI Interior Central Lighting Controls Interior Central Lighting Controls 0.7
PECO- Smart Business Solutions
GIN DI Interior CFL - Downlight, Dimmable or 3-way Interior CFL - Downlight, Dimmable or 3-way 0.7
PECO- Smart Business Solutions
GIN DI Interior CFL - Screw-in (30W or Less) Interior CFL - Screw-in (30W or Less) 0.7
PECO- Smart Business Solutions
GIN DI Interior CFL - Screw-in (31W or 115W) Interior CFL - Screw-in (31W or 115W) 0.7
PECO- Smart Business Solutions
GIN DI Interior Daylight Sensor Controls Interior Daylight Sensor Controls 0.7
PECO- Smart Business Solutions
GIN DI Interior HP/RW T8 4ft Red Watt Lamp Interior RW T8 - 4-ft Reduced Watt Lamp only 0.7
PECO- Smart Business Solutions GIN DI Interior LED Exit sign Interior LED, T-1, or Electroluminescent Exit Signs 0.7
PECO- Smart Business Solutions GIN DI Interior Occupancy Sensor Interior Occupancy Sensor 0.7
PECO- Smart Business Solutions
GIN DI Interior Permanent Lamp Removal - 2-ft Lamp Interior Permanent Lamp Removal - 2-ft Lamp 0.7
PECO- Smart Business Solutions
GIN DI Interior Permanent Lamp Removal - 3-ft Lamp Interior Permanent Lamp Removal - 3-ft Lamp 0.7
PECO- Smart Business Solutions
GIN DI Interior Permanent Lamp Removal - 4-ft Lamp Interior Permanent Lamp Removal - 4-ft Lamp 0.7
PECO- Smart Business Solutions
GIN DI Interior Permanent Lamp Removal - 8-ft Lamp Interior Permanent Lamp Removal - 8-ft Lamp 0.7
PECO- Smart Business Solutions
GIN DI Interior Recessed LED Downlighting >50 W Interior Recessed LED Downlighting >50 W 0.7
PECO- Smart Business Solutions
GIN DI Interior Recessed LED Downlighting 21-30 W Interior Recessed LED Downlighting 21-30 W 0.7
PECO- Smart Business Solutions
GIN DI Interior Recessed LED Downlighting 31-50 W Interior Recessed LED Downlighting 31-50 W 0.7
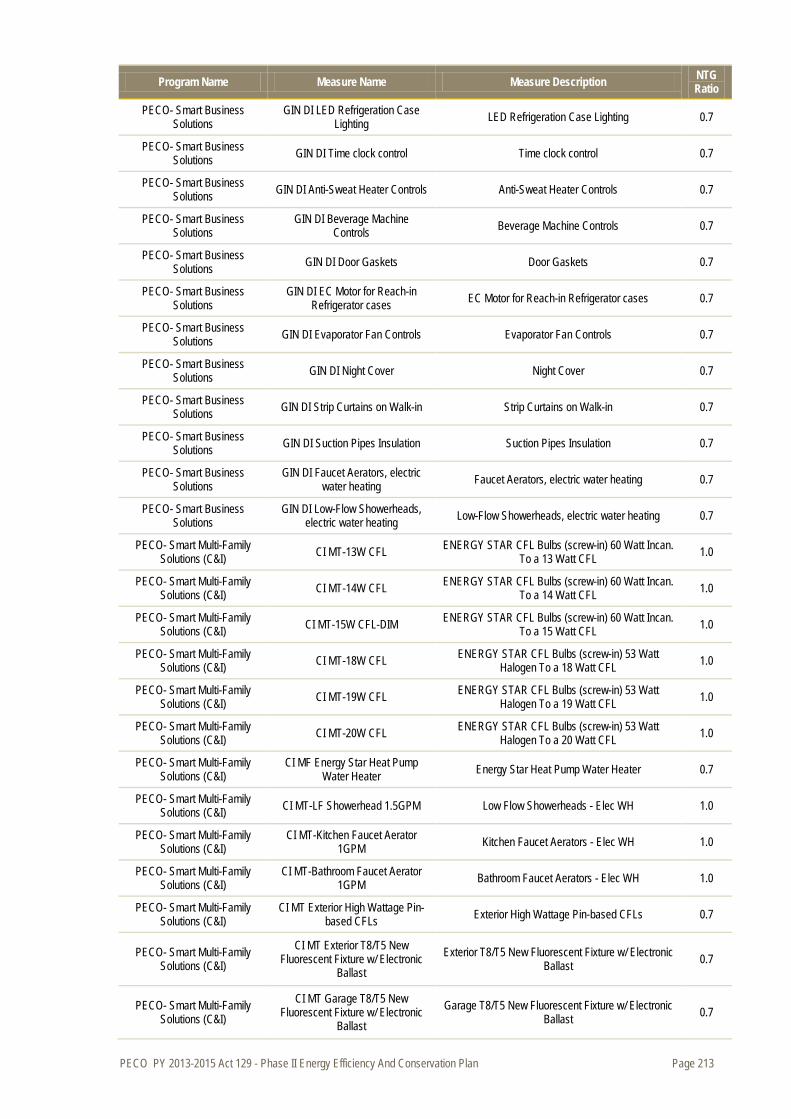
PECO PY 2013-2015 Act 129 - Phase II Energy Efficiency And Conservation Plan Page 213
Program Name Measure Name Measure Description NTG Ratio
PECO- Smart Business Solutions
GIN DI LED Refrigeration Case Lighting LED Refrigeration Case Lighting 0.7
PECO- Smart Business Solutions GIN DI Time clock control Time clock control 0.7
PECO- Smart Business Solutions GIN DI Anti-Sweat Heater Controls Anti-Sweat Heater Controls 0.7
PECO- Smart Business Solutions
GIN DI Beverage Machine Controls Beverage Machine Controls 0.7
PECO- Smart Business Solutions GIN DI Door Gaskets Door Gaskets 0.7
PECO- Smart Business Solutions
GIN DI EC Motor for Reach-in Refrigerator cases EC Motor for Reach-in Refrigerator cases 0.7
PECO- Smart Business Solutions GIN DI Evaporator Fan Controls Evaporator Fan Controls 0.7
PECO- Smart Business Solutions GIN DI Night Cover Night Cover 0.7
PECO- Smart Business Solutions GIN DI Strip Curtains on Walk-in Strip Curtains on Walk-in 0.7
PECO- Smart Business Solutions GIN DI Suction Pipes Insulation Suction Pipes Insulation 0.7
PECO- Smart Business Solutions
GIN DI Faucet Aerators, electric water heating Faucet Aerators, electric water heating 0.7
PECO- Smart Business Solutions
GIN DI Low-Flow Showerheads, electric water heating Low-Flow Showerheads, electric water heating 0.7
PECO- Smart Multi-Family Solutions (C&I) CI MT-13W CFL ENERGY STAR CFL Bulbs (screw-in) 60 Watt Incan.
To a 13 Watt CFL 1.0
PECO- Smart Multi-Family Solutions (C&I) CI MT-14W CFL ENERGY STAR CFL Bulbs (screw-in) 60 Watt Incan.
To a 14 Watt CFL 1.0
PECO- Smart Multi-Family Solutions (C&I) CI MT-15W CFL-DIM ENERGY STAR CFL Bulbs (screw-in) 60 Watt Incan.
To a 15 Watt CFL 1.0
PECO- Smart Multi-Family Solutions (C&I) CI MT-18W CFL ENERGY STAR CFL Bulbs (screw-in) 53 Watt
Halogen To a 18 Watt CFL 1.0
PECO- Smart Multi-Family Solutions (C&I) CI MT-19W CFL ENERGY STAR CFL Bulbs (screw-in) 53 Watt
Halogen To a 19 Watt CFL 1.0
PECO- Smart Multi-Family Solutions (C&I) CI MT-20W CFL ENERGY STAR CFL Bulbs (screw-in) 53 Watt
Halogen To a 20 Watt CFL 1.0
PECO- Smart Multi-Family Solutions (C&I)
CI MF Energy Star Heat Pump Water Heater Energy Star Heat Pump Water Heater 0.7
PECO- Smart Multi-Family Solutions (C&I) CI MT-LF Showerhead 1.5GPM Low Flow Showerheads - Elec WH 1.0
PECO- Smart Multi-Family Solutions (C&I)
CI MT-Kitchen Faucet Aerator 1GPM Kitchen Faucet Aerators - Elec WH 1.0
PECO- Smart Multi-Family Solutions (C&I)
CI MT-Bathroom Faucet Aerator 1GPM Bathroom Faucet Aerators - Elec WH 1.0
PECO- Smart Multi-Family Solutions (C&I)
CI MT Exterior High Wattage Pin-based CFLs Exterior High Wattage Pin-based CFLs 0.7
PECO- Smart Multi-Family Solutions (C&I)
CI MT Exterior T8/T5 New Fluorescent Fixture w/ Electronic
Ballast Exterior T8/T5 New Fluorescent Fixture w/ Electronic
Ballast 0.7
PECO- Smart Multi-Family Solutions (C&I)
CI MT Garage T8/T5 New Fluorescent Fixture w/ Electronic
Ballast Garage T8/T5 New Fluorescent Fixture w/ Electronic
Ballast 0.7
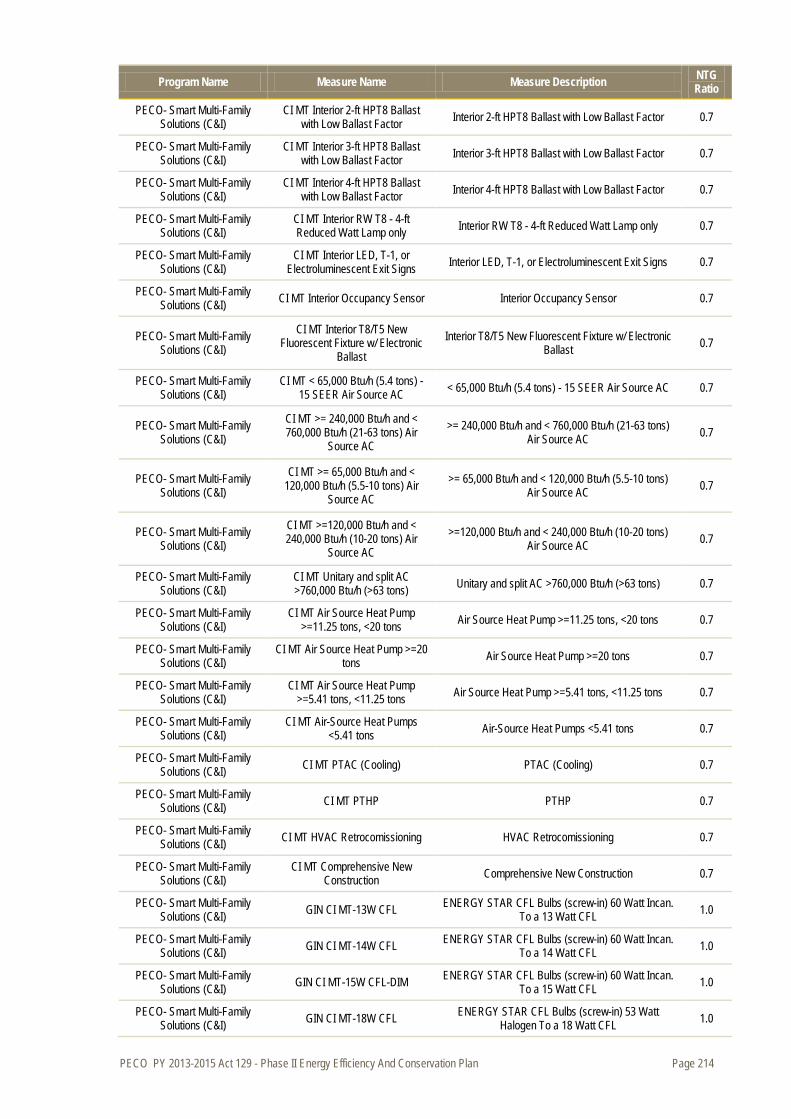
PECO PY 2013-2015 Act 129 - Phase II Energy Efficiency And Conservation Plan Page 214
Program Name Measure Name Measure Description NTG Ratio
PECO- Smart Multi-Family Solutions (C&I)
CI MT Interior 2-ft HPT8 Ballast with Low Ballast Factor Interior 2-ft HPT8 Ballast with Low Ballast Factor 0.7
PECO- Smart Multi-Family Solutions (C&I)
CI MT Interior 3-ft HPT8 Ballast with Low Ballast Factor Interior 3-ft HPT8 Ballast with Low Ballast Factor 0.7
PECO- Smart Multi-Family Solutions (C&I)
CI MT Interior 4-ft HPT8 Ballast with Low Ballast Factor Interior 4-ft HPT8 Ballast with Low Ballast Factor 0.7
PECO- Smart Multi-Family Solutions (C&I)
CI MT Interior RW T8 - 4-ft Reduced Watt Lamp only Interior RW T8 - 4-ft Reduced Watt Lamp only 0.7
PECO- Smart Multi-Family Solutions (C&I)
CI MT Interior LED, T-1, or Electroluminescent Exit Signs Interior LED, T-1, or Electroluminescent Exit Signs 0.7
PECO- Smart Multi-Family Solutions (C&I) CI MT Interior Occupancy Sensor Interior Occupancy Sensor 0.7
PECO- Smart Multi-Family Solutions (C&I)
CI MT Interior T8/T5 New Fluorescent Fixture w/ Electronic
Ballast Interior T8/T5 New Fluorescent Fixture w/ Electronic
Ballast 0.7
PECO- Smart Multi-Family Solutions (C&I)
CI MT < 65,000 Btu/h (5.4 tons) - 15 SEER Air Source AC < 65,000 Btu/h (5.4 tons) - 15 SEER Air Source AC 0.7
PECO- Smart Multi-Family Solutions (C&I)
CI MT >= 240,000 Btu/h and < 760,000 Btu/h (21-63 tons) Air
Source AC >= 240,000 Btu/h and < 760,000 Btu/h (21-63 tons)
Air Source AC 0.7
PECO- Smart Multi-Family Solutions (C&I)
CI MT >= 65,000 Btu/h and < 120,000 Btu/h (5.5-10 tons) Air
Source AC >= 65,000 Btu/h and < 120,000 Btu/h (5.5-10 tons)
Air Source AC 0.7
PECO- Smart Multi-Family Solutions (C&I)
CI MT >=120,000 Btu/h and < 240,000 Btu/h (10-20 tons) Air
Source AC >=120,000 Btu/h and < 240,000 Btu/h (10-20 tons)
Air Source AC 0.7
PECO- Smart Multi-Family Solutions (C&I)
CI MT Unitary and split AC >760,000 Btu/h (>63 tons) Unitary and split AC >760,000 Btu/h (>63 tons) 0.7
PECO- Smart Multi-Family Solutions (C&I)
CI MT Air Source Heat Pump >=11.25 tons, <20 tons Air Source Heat Pump >=11.25 tons, <20 tons 0.7
PECO- Smart Multi-Family Solutions (C&I)
CI MT Air Source Heat Pump >=20 tons Air Source Heat Pump >=20 tons 0.7
PECO- Smart Multi-Family Solutions (C&I)
CI MT Air Source Heat Pump >=5.41 tons, <11.25 tons Air Source Heat Pump >=5.41 tons, <11.25 tons 0.7
PECO- Smart Multi-Family Solutions (C&I)
CI MT Air-Source Heat Pumps <5.41 tons Air-Source Heat Pumps <5.41 tons 0.7
PECO- Smart Multi-Family Solutions (C&I) CI MT PTAC (Cooling) PTAC (Cooling) 0.7
PECO- Smart Multi-Family Solutions (C&I) CI MT PTHP PTHP 0.7
PECO- Smart Multi-Family Solutions (C&I) CI MT HVAC Retrocomissioning HVAC Retrocomissioning 0.7
PECO- Smart Multi-Family Solutions (C&I)
CI MT Comprehensive New Construction Comprehensive New Construction 0.7
PECO- Smart Multi-Family Solutions (C&I) GIN CI MT-13W CFL ENERGY STAR CFL Bulbs (screw-in) 60 Watt Incan.
To a 13 Watt CFL 1.0
PECO- Smart Multi-Family Solutions (C&I) GIN CI MT-14W CFL ENERGY STAR CFL Bulbs (screw-in) 60 Watt Incan.
To a 14 Watt CFL 1.0
PECO- Smart Multi-Family Solutions (C&I) GIN CI MT-15W CFL-DIM ENERGY STAR CFL Bulbs (screw-in) 60 Watt Incan.
To a 15 Watt CFL 1.0
PECO- Smart Multi-Family Solutions (C&I) GIN CI MT-18W CFL ENERGY STAR CFL Bulbs (screw-in) 53 Watt
Halogen To a 18 Watt CFL 1.0
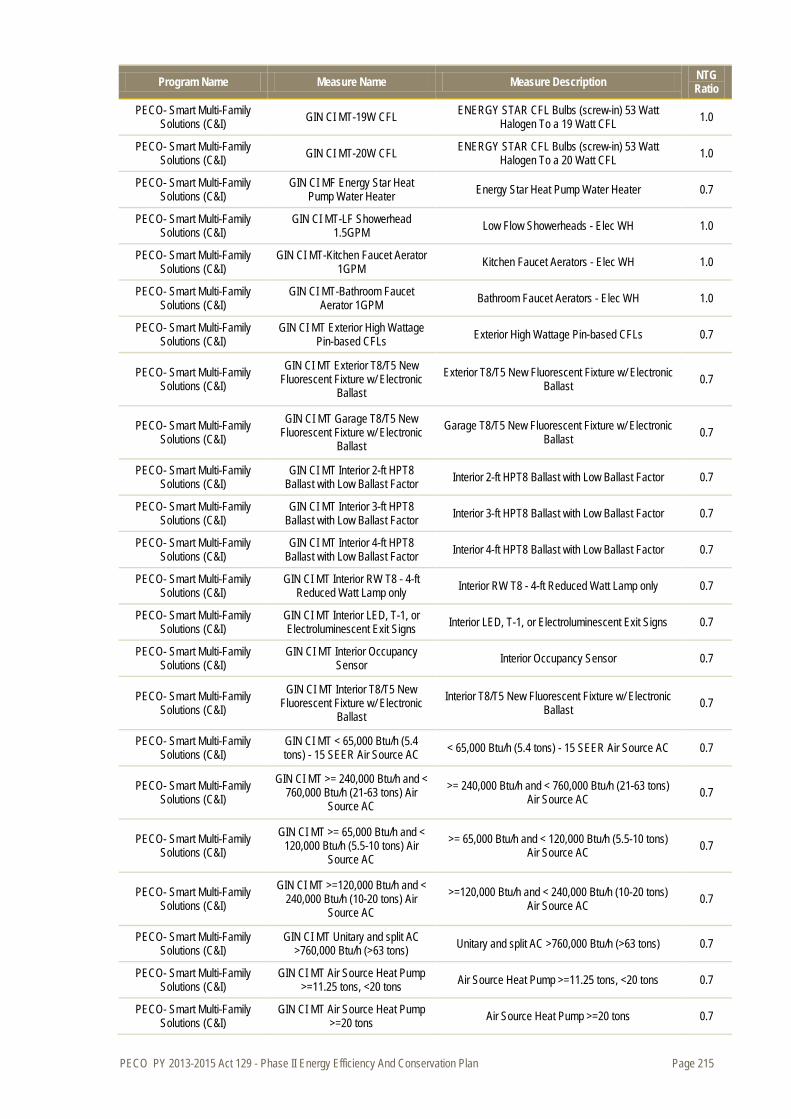
PECO PY 2013-2015 Act 129 - Phase II Energy Efficiency And Conservation Plan Page 215
Program Name Measure Name Measure Description NTG Ratio
PECO- Smart Multi-Family Solutions (C&I) GIN CI MT-19W CFL ENERGY STAR CFL Bulbs (screw-in) 53 Watt
Halogen To a 19 Watt CFL 1.0
PECO- Smart Multi-Family Solutions (C&I) GIN CI MT-20W CFL ENERGY STAR CFL Bulbs (screw-in) 53 Watt
Halogen To a 20 Watt CFL 1.0
PECO- Smart Multi-Family Solutions (C&I)
GIN CI MF Energy Star Heat Pump Water Heater Energy Star Heat Pump Water Heater 0.7
PECO- Smart Multi-Family Solutions (C&I)
GIN CI MT-LF Showerhead 1.5GPM Low Flow Showerheads - Elec WH 1.0
PECO- Smart Multi-Family Solutions (C&I)
GIN CI MT-Kitchen Faucet Aerator 1GPM Kitchen Faucet Aerators - Elec WH 1.0
PECO- Smart Multi-Family Solutions (C&I)
GIN CI MT-Bathroom Faucet Aerator 1GPM Bathroom Faucet Aerators - Elec WH 1.0
PECO- Smart Multi-Family Solutions (C&I)
GIN CI MT Exterior High Wattage Pin-based CFLs Exterior High Wattage Pin-based CFLs 0.7
PECO- Smart Multi-Family Solutions (C&I)
GIN CI MT Exterior T8/T5 New Fluorescent Fixture w/ Electronic
Ballast Exterior T8/T5 New Fluorescent Fixture w/ Electronic
Ballast 0.7
PECO- Smart Multi-Family Solutions (C&I)
GIN CI MT Garage T8/T5 New Fluorescent Fixture w/ Electronic
Ballast Garage T8/T5 New Fluorescent Fixture w/ Electronic
Ballast 0.7
PECO- Smart Multi-Family Solutions (C&I)
GIN CI MT Interior 2-ft HPT8 Ballast with Low Ballast Factor Interior 2-ft HPT8 Ballast with Low Ballast Factor 0.7
PECO- Smart Multi-Family Solutions (C&I)
GIN CI MT Interior 3-ft HPT8 Ballast with Low Ballast Factor Interior 3-ft HPT8 Ballast with Low Ballast Factor 0.7
PECO- Smart Multi-Family Solutions (C&I)
GIN CI MT Interior 4-ft HPT8 Ballast with Low Ballast Factor Interior 4-ft HPT8 Ballast with Low Ballast Factor 0.7
PECO- Smart Multi-Family Solutions (C&I)
GIN CI MT Interior RW T8 - 4-ft Reduced Watt Lamp only Interior RW T8 - 4-ft Reduced Watt Lamp only 0.7
PECO- Smart Multi-Family Solutions (C&I)
GIN CI MT Interior LED, T-1, or Electroluminescent Exit Signs Interior LED, T-1, or Electroluminescent Exit Signs 0.7
PECO- Smart Multi-Family Solutions (C&I)
GIN CI MT Interior Occupancy Sensor Interior Occupancy Sensor 0.7
PECO- Smart Multi-Family Solutions (C&I)
GIN CI MT Interior T8/T5 New Fluorescent Fixture w/ Electronic
Ballast Interior T8/T5 New Fluorescent Fixture w/ Electronic
Ballast 0.7
PECO- Smart Multi-Family Solutions (C&I)
GIN CI MT < 65,000 Btu/h (5.4 tons) - 15 SEER Air Source AC < 65,000 Btu/h (5.4 tons) - 15 SEER Air Source AC 0.7
PECO- Smart Multi-Family Solutions (C&I)
GIN CI MT >= 240,000 Btu/h and < 760,000 Btu/h (21-63 tons) Air
Source AC >= 240,000 Btu/h and < 760,000 Btu/h (21-63 tons)
Air Source AC 0.7
PECO- Smart Multi-Family Solutions (C&I)
GIN CI MT >= 65,000 Btu/h and < 120,000 Btu/h (5.5-10 tons) Air
Source AC >= 65,000 Btu/h and < 120,000 Btu/h (5.5-10 tons)
Air Source AC 0.7
PECO- Smart Multi-Family Solutions (C&I)
GIN CI MT >=120,000 Btu/h and < 240,000 Btu/h (10-20 tons) Air
Source AC >=120,000 Btu/h and < 240,000 Btu/h (10-20 tons)
Air Source AC 0.7
PECO- Smart Multi-Family Solutions (C&I)
GIN CI MT Unitary and split AC >760,000 Btu/h (>63 tons) Unitary and split AC >760,000 Btu/h (>63 tons) 0.7
PECO- Smart Multi-Family Solutions (C&I)
GIN CI MT Air Source Heat Pump >=11.25 tons, <20 tons Air Source Heat Pump >=11.25 tons, <20 tons 0.7
PECO- Smart Multi-Family Solutions (C&I)
GIN CI MT Air Source Heat Pump >=20 tons Air Source Heat Pump >=20 tons 0.7
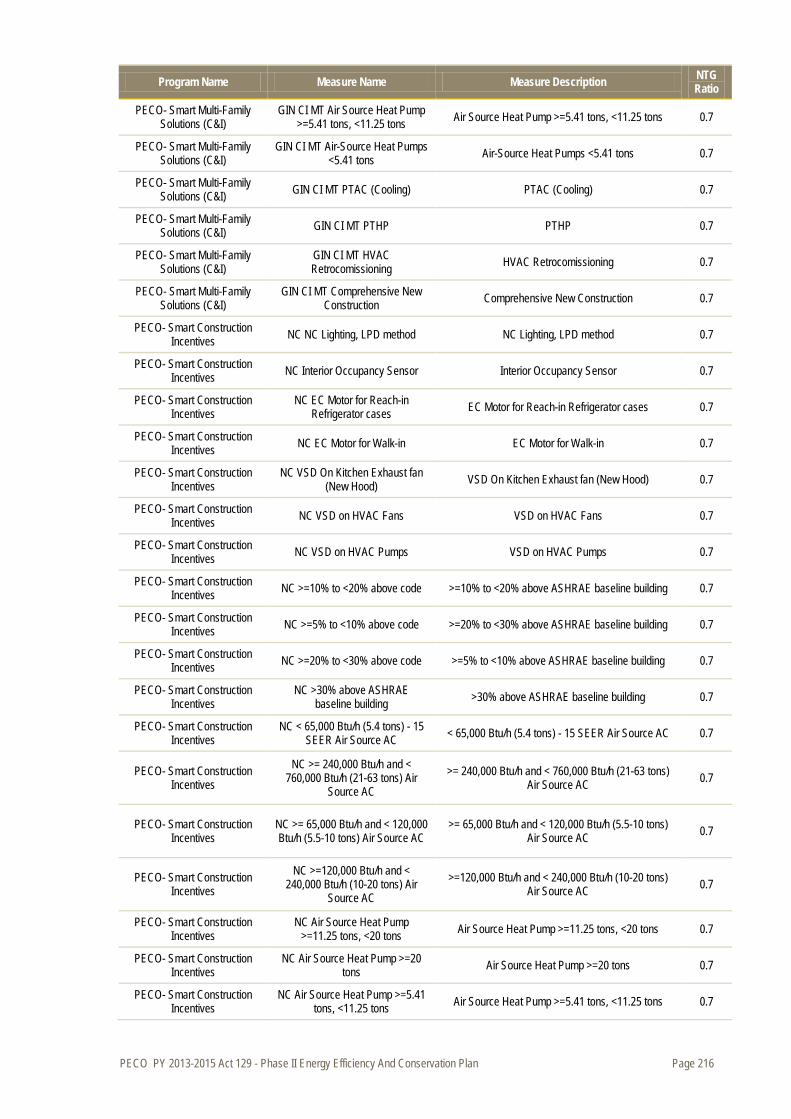
PECO PY 2013-2015 Act 129 - Phase II Energy Efficiency And Conservation Plan Page 216
Program Name Measure Name Measure Description NTG Ratio
PECO- Smart Multi-Family Solutions (C&I)
GIN CI MT Air Source Heat Pump >=5.41 tons, <11.25 tons Air Source Heat Pump >=5.41 tons, <11.25 tons 0.7
PECO- Smart Multi-Family Solutions (C&I)
GIN CI MT Air-Source Heat Pumps <5.41 tons Air-Source Heat Pumps <5.41 tons 0.7
PECO- Smart Multi-Family Solutions (C&I) GIN CI MT PTAC (Cooling) PTAC (Cooling) 0.7
PECO- Smart Multi-Family Solutions (C&I) GIN CI MT PTHP PTHP 0.7
PECO- Smart Multi-Family Solutions (C&I)
GIN CI MT HVAC Retrocomissioning HVAC Retrocomissioning 0.7
PECO- Smart Multi-Family Solutions (C&I)
GIN CI MT Comprehensive New Construction Comprehensive New Construction 0.7
PECO- Smart Construction Incentives NC NC Lighting, LPD method NC Lighting, LPD method 0.7
PECO- Smart Construction Incentives NC Interior Occupancy Sensor Interior Occupancy Sensor 0.7
PECO- Smart Construction Incentives
NC EC Motor for Reach-in Refrigerator cases EC Motor for Reach-in Refrigerator cases 0.7
PECO- Smart Construction Incentives NC EC Motor for Walk-in EC Motor for Walk-in 0.7
PECO- Smart Construction Incentives
NC VSD On Kitchen Exhaust fan (New Hood) VSD On Kitchen Exhaust fan (New Hood) 0.7
PECO- Smart Construction Incentives NC VSD on HVAC Fans VSD on HVAC Fans 0.7
PECO- Smart Construction Incentives NC VSD on HVAC Pumps VSD on HVAC Pumps 0.7
PECO- Smart Construction Incentives NC >=10% to <20% above code >=10% to <20% above ASHRAE baseline building 0.7
PECO- Smart Construction Incentives NC >=5% to <10% above code >=20% to <30% above ASHRAE baseline building 0.7
PECO- Smart Construction Incentives NC >=20% to <30% above code >=5% to <10% above ASHRAE baseline building 0.7
PECO- Smart Construction Incentives
NC >30% above ASHRAE baseline building >30% above ASHRAE baseline building 0.7
PECO- Smart Construction Incentives
NC < 65,000 Btu/h (5.4 tons) - 15 SEER Air Source AC < 65,000 Btu/h (5.4 tons) - 15 SEER Air Source AC 0.7
PECO- Smart Construction Incentives
NC >= 240,000 Btu/h and < 760,000 Btu/h (21-63 tons) Air
Source AC >= 240,000 Btu/h and < 760,000 Btu/h (21-63 tons)
Air Source AC 0.7
PECO- Smart Construction Incentives
NC >= 65,000 Btu/h and < 120,000 Btu/h (5.5-10 tons) Air Source AC
>= 65,000 Btu/h and < 120,000 Btu/h (5.5-10 tons) Air Source AC 0.7
PECO- Smart Construction Incentives
NC >=120,000 Btu/h and < 240,000 Btu/h (10-20 tons) Air
Source AC >=120,000 Btu/h and < 240,000 Btu/h (10-20 tons)
Air Source AC 0.7
PECO- Smart Construction Incentives
NC Air Source Heat Pump >=11.25 tons, <20 tons Air Source Heat Pump >=11.25 tons, <20 tons 0.7
PECO- Smart Construction Incentives
NC Air Source Heat Pump >=20 tons Air Source Heat Pump >=20 tons 0.7
PECO- Smart Construction Incentives
NC Air Source Heat Pump >=5.41 tons, <11.25 tons Air Source Heat Pump >=5.41 tons, <11.25 tons 0.7
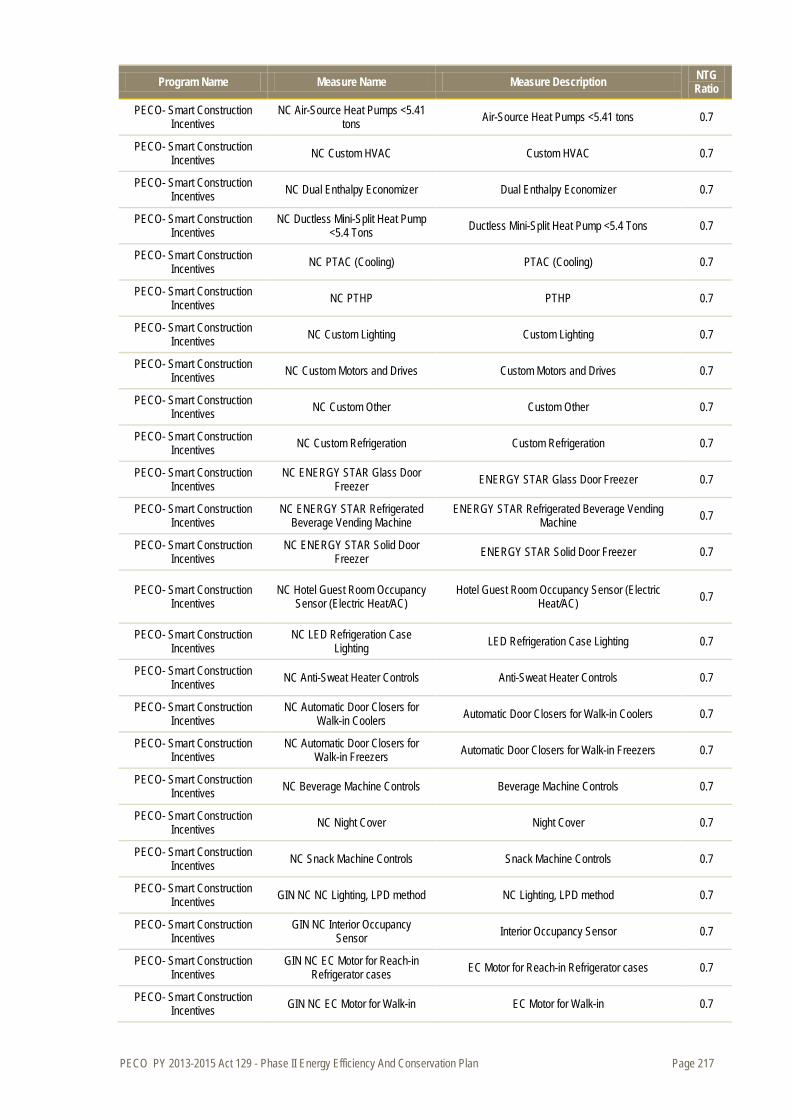
PECO PY 2013-2015 Act 129 - Phase II Energy Efficiency And Conservation Plan Page 217
Program Name Measure Name Measure Description NTG Ratio
PECO- Smart Construction Incentives
NC Air-Source Heat Pumps <5.41 tons Air-Source Heat Pumps <5.41 tons 0.7
PECO- Smart Construction Incentives NC Custom HVAC Custom HVAC 0.7
PECO- Smart Construction Incentives NC Dual Enthalpy Economizer Dual Enthalpy Economizer 0.7
PECO- Smart Construction Incentives
NC Ductless Mini-Split Heat Pump <5.4 Tons Ductless Mini-Split Heat Pump <5.4 Tons 0.7
PECO- Smart Construction Incentives NC PTAC (Cooling) PTAC (Cooling) 0.7
PECO- Smart Construction Incentives NC PTHP PTHP 0.7
PECO- Smart Construction Incentives NC Custom Lighting Custom Lighting 0.7
PECO- Smart Construction Incentives NC Custom Motors and Drives Custom Motors and Drives 0.7
PECO- Smart Construction Incentives NC Custom Other Custom Other 0.7
PECO- Smart Construction Incentives NC Custom Refrigeration Custom Refrigeration 0.7
PECO- Smart Construction Incentives
NC ENERGY STAR Glass Door Freezer ENERGY STAR Glass Door Freezer 0.7
PECO- Smart Construction Incentives
NC ENERGY STAR Refrigerated Beverage Vending Machine
ENERGY STAR Refrigerated Beverage Vending Machine 0.7
PECO- Smart Construction Incentives
NC ENERGY STAR Solid Door Freezer ENERGY STAR Solid Door Freezer 0.7
PECO- Smart Construction Incentives
NC Hotel Guest Room Occupancy Sensor (Electric Heat/AC)
Hotel Guest Room Occupancy Sensor (Electric Heat/AC) 0.7
PECO- Smart Construction Incentives
NC LED Refrigeration Case Lighting LED Refrigeration Case Lighting 0.7
PECO- Smart Construction Incentives NC Anti-Sweat Heater Controls Anti-Sweat Heater Controls 0.7
PECO- Smart Construction Incentives
NC Automatic Door Closers for Walk-in Coolers Automatic Door Closers for Walk-in Coolers 0.7
PECO- Smart Construction Incentives
NC Automatic Door Closers for Walk-in Freezers Automatic Door Closers for Walk-in Freezers 0.7
PECO- Smart Construction Incentives NC Beverage Machine Controls Beverage Machine Controls 0.7
PECO- Smart Construction Incentives NC Night Cover Night Cover 0.7
PECO- Smart Construction Incentives NC Snack Machine Controls Snack Machine Controls 0.7
PECO- Smart Construction Incentives GIN NC NC Lighting, LPD method NC Lighting, LPD method 0.7
PECO- Smart Construction Incentives
GIN NC Interior Occupancy Sensor Interior Occupancy Sensor 0.7
PECO- Smart Construction Incentives
GIN NC EC Motor for Reach-in Refrigerator cases EC Motor for Reach-in Refrigerator cases 0.7
PECO- Smart Construction Incentives GIN NC EC Motor for Walk-in EC Motor for Walk-in 0.7
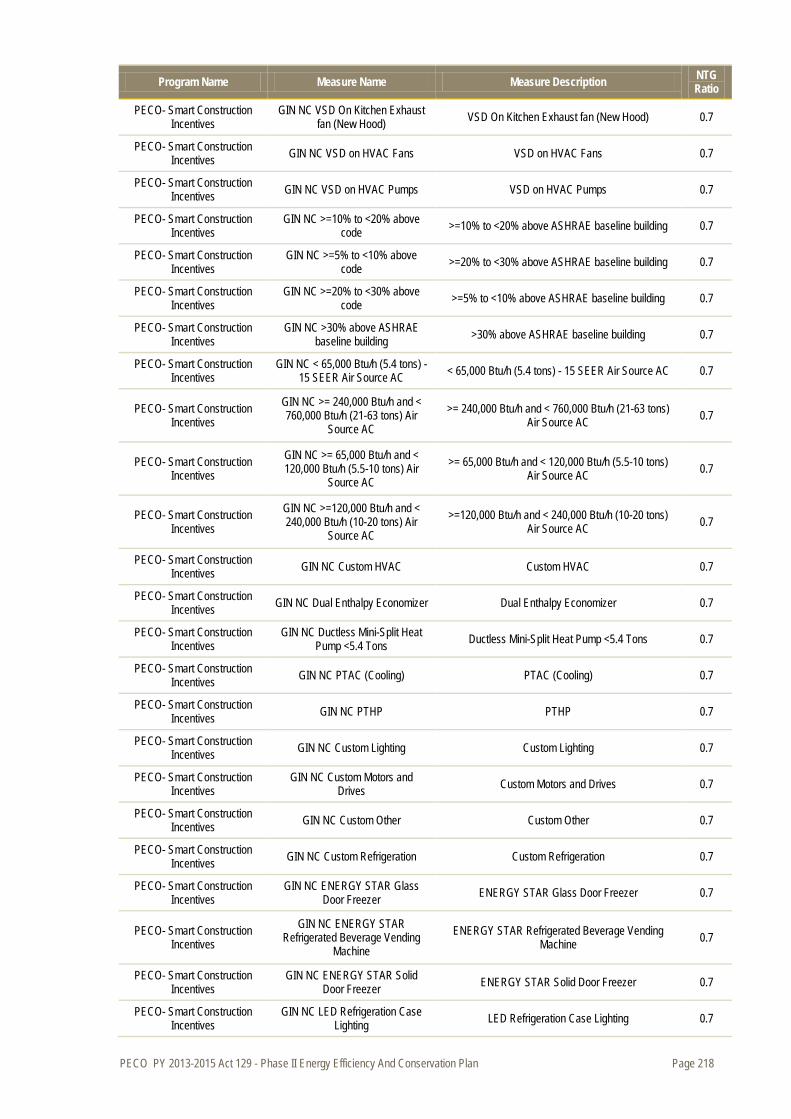
PECO PY 2013-2015 Act 129 - Phase II Energy Efficiency And Conservation Plan Page 218
Program Name Measure Name Measure Description NTG Ratio
PECO- Smart Construction Incentives
GIN NC VSD On Kitchen Exhaust fan (New Hood) VSD On Kitchen Exhaust fan (New Hood) 0.7
PECO- Smart Construction Incentives GIN NC VSD on HVAC Fans VSD on HVAC Fans 0.7
PECO- Smart Construction Incentives GIN NC VSD on HVAC Pumps VSD on HVAC Pumps 0.7
PECO- Smart Construction Incentives
GIN NC >=10% to <20% above code >=10% to <20% above ASHRAE baseline building 0.7
PECO- Smart Construction Incentives
GIN NC >=5% to <10% above code >=20% to <30% above ASHRAE baseline building 0.7
PECO- Smart Construction Incentives
GIN NC >=20% to <30% above code >=5% to <10% above ASHRAE baseline building 0.7
PECO- Smart Construction Incentives
GIN NC >30% above ASHRAE baseline building >30% above ASHRAE baseline building 0.7
PECO- Smart Construction Incentives
GIN NC < 65,000 Btu/h (5.4 tons) - 15 SEER Air Source AC < 65,000 Btu/h (5.4 tons) - 15 SEER Air Source AC 0.7
PECO- Smart Construction Incentives
GIN NC >= 240,000 Btu/h and < 760,000 Btu/h (21-63 tons) Air
Source AC >= 240,000 Btu/h and < 760,000 Btu/h (21-63 tons)
Air Source AC 0.7
PECO- Smart Construction Incentives
GIN NC >= 65,000 Btu/h and < 120,000 Btu/h (5.5-10 tons) Air
Source AC >= 65,000 Btu/h and < 120,000 Btu/h (5.5-10 tons)
Air Source AC 0.7
PECO- Smart Construction Incentives
GIN NC >=120,000 Btu/h and < 240,000 Btu/h (10-20 tons) Air
Source AC >=120,000 Btu/h and < 240,000 Btu/h (10-20 tons)
Air Source AC 0.7
PECO- Smart Construction Incentives GIN NC Custom HVAC Custom HVAC 0.7
PECO- Smart Construction Incentives GIN NC Dual Enthalpy Economizer Dual Enthalpy Economizer 0.7
PECO- Smart Construction Incentives
GIN NC Ductless Mini-Split Heat Pump <5.4 Tons Ductless Mini-Split Heat Pump <5.4 Tons 0.7
PECO- Smart Construction Incentives GIN NC PTAC (Cooling) PTAC (Cooling) 0.7
PECO- Smart Construction Incentives GIN NC PTHP PTHP 0.7
PECO- Smart Construction Incentives GIN NC Custom Lighting Custom Lighting 0.7
PECO- Smart Construction Incentives
GIN NC Custom Motors and Drives Custom Motors and Drives 0.7
PECO- Smart Construction Incentives GIN NC Custom Other Custom Other 0.7
PECO- Smart Construction Incentives GIN NC Custom Refrigeration Custom Refrigeration 0.7
PECO- Smart Construction Incentives
GIN NC ENERGY STAR Glass Door Freezer ENERGY STAR Glass Door Freezer 0.7
PECO- Smart Construction Incentives
GIN NC ENERGY STAR Refrigerated Beverage Vending
Machine ENERGY STAR Refrigerated Beverage Vending
Machine 0.7
PECO- Smart Construction Incentives
GIN NC ENERGY STAR Solid Door Freezer ENERGY STAR Solid Door Freezer 0.7
PECO- Smart Construction Incentives
GIN NC LED Refrigeration Case Lighting LED Refrigeration Case Lighting 0.7

PECO PY 2013-2015 Act 129 - Phase II Energy Efficiency And Conservation Plan Page 219
Program Name Measure Name Measure Description NTG Ratio
PECO- Smart Construction Incentives
GIN NC Anti-Sweat Heater Controls Anti-Sweat Heater Controls 0.7
PECO- Smart Construction Incentives
GIN NC Automatic Door Closers for Walk-in Coolers Automatic Door Closers for Walk-in Coolers 0.7
PECO- Smart Construction Incentives
GIN NC Automatic Door Closers for Walk-in Freezers Automatic Door Closers for Walk-in Freezers 0.7
PECO- Smart Construction Incentives
GIN NC Beverage Machine Controls Beverage Machine Controls 0.7
PECO- Smart Construction Incentives GIN NC Night Cover Night Cover 0.7
PECO- Smart Construction Incentives GIN NC Snack Machine Controls Snack Machine Controls 0.7
PECO- Smart Equipment Incentives (GINP)
GIN Exterior LED traffic lights - 12 inch ARROW Exterior LED traffic lights - 12 inch ARROW 0.7
PECO- Smart Equipment Incentives (GINP)
GIN Exterior LED traffic lights - 12 inch ROUND Exterior LED traffic lights - 12 inch ROUND 0.7
PECO- Smart Equipment Incentives (GINP)
GIN Exterior LED traffic lights - 8 inch ROUND Exterior LED traffic lights - 8 inch ROUND 0.7
PECO- Smart Equipment Incentives (GINP)
GIN Exterior LED traffic lights - Walk/Don't Walk - 12 inch Exterior LED traffic lights - Walk/Don't Walk - 12 inch 0.7
PECO- Smart Equipment Incentives (GINP) GIN SEI EC Motor for Walk-in EC Motor for Walk-in 0.7
PECO- Smart Equipment Incentives (GINP) GIN SEI EMS, Basic Time Control EMS, Basic Time Control 0.7
PECO- Smart Equipment Incentives (GINP)
GIN SEI EMS, No Present Time Control EMS, No Present Time Control 0.7
PECO- Smart Equipment Incentives (GINP)
GIN SEI Hotel Guest Room Occupancy Sensor (Electric
Heat/AC) Hotel Guest Room Occupancy Sensor (Electric
Heat/AC) 0.7
PECO- Smart Equipment Incentives (GINP)
GIN SEI >= 240,000 Btu/h and < 760,000 Btu/h (21-63 tons) Air
Source AC >= 240,000 Btu/h and < 760,000 Btu/h (21-63 tons)
Air Source AC 0.7
PECO- Smart Equipment Incentives (GINP)
GIN SEI >= 65,000 Btu/h and < 120,000 Btu/h (5.5-10 tons) Air
Source AC >= 65,000 Btu/h and < 120,000 Btu/h (5.5-10 tons)
Air Source AC 0.7
PECO- Smart Equipment Incentives (GINP)
GIN SEI >=120,000 Btu/h and < 240,000 Btu/h (10-20 tons) Air
Source AC >=120,000 Btu/h and < 240,000 Btu/h (10-20 tons)
Air Source AC 0.7
PECO- Smart Equipment Incentives (GINP)
GIN SEI Air Source Heat Pump >=11.25 tons, <20 tons Air Source Heat Pump >=11.25 tons, <20 tons 0.7
PECO- Smart Equipment Incentives (GINP)
GIN SEI Air Source Heat Pump >=20 tons Air Source Heat Pump >=20 tons 0.7
PECO- Smart Equipment Incentives (GINP)
GIN SEI Air Source Heat Pump >=5.41 tons, <11.25 tons Air Source Heat Pump >=5.41 tons, <11.25 tons 0.7
PECO- Smart Equipment Incentives (GINP)
GIN SEI Air-Source Heat Pumps <5.41 tons Air-Source Heat Pumps <5.41 tons 0.7
PECO- Smart Equipment Incentives (GINP) GIN SEI Custom HVAC Custom HVAC 0.7
PECO- Smart Equipment Incentives (GINP)
GIN SEI Dual Enthalpy Economizer Dual Enthalpy Economizer 0.7
PECO- Smart Equipment Incentives (GINP)
GIN SEI Ductless Mini-Split Heat Pump <5.4 Tons Ductless Mini-Split Heat Pump <5.4 Tons 0.7
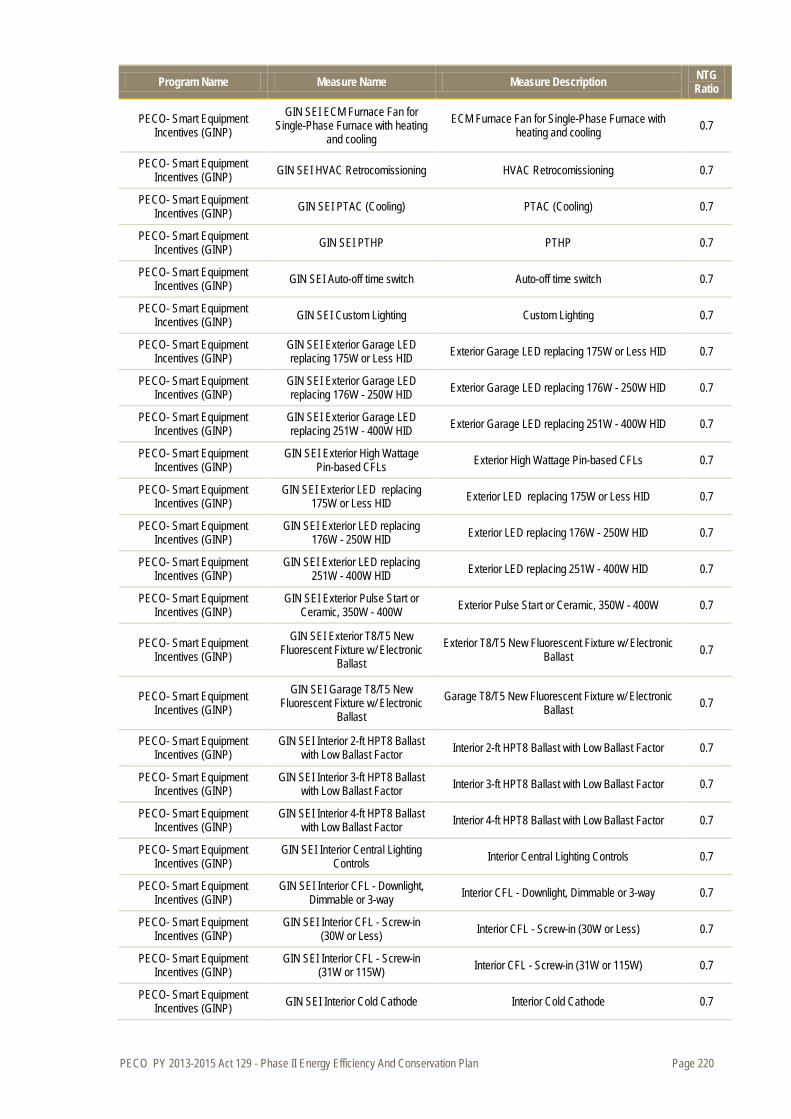
PECO PY 2013-2015 Act 129 - Phase II Energy Efficiency And Conservation Plan Page 220
Program Name Measure Name Measure Description NTG Ratio
PECO- Smart Equipment Incentives (GINP)
GIN SEI ECM Furnace Fan for Single-Phase Furnace with heating
and cooling ECM Furnace Fan for Single-Phase Furnace with
heating and cooling 0.7
PECO- Smart Equipment Incentives (GINP) GIN SEI HVAC Retrocomissioning HVAC Retrocomissioning 0.7
PECO- Smart Equipment Incentives (GINP) GIN SEI PTAC (Cooling) PTAC (Cooling) 0.7
PECO- Smart Equipment Incentives (GINP) GIN SEI PTHP PTHP 0.7
PECO- Smart Equipment Incentives (GINP) GIN SEI Auto-off time switch Auto-off time switch 0.7
PECO- Smart Equipment Incentives (GINP) GIN SEI Custom Lighting Custom Lighting 0.7
PECO- Smart Equipment Incentives (GINP)
GIN SEI Exterior Garage LED replacing 175W or Less HID Exterior Garage LED replacing 175W or Less HID 0.7
PECO- Smart Equipment Incentives (GINP)
GIN SEI Exterior Garage LED replacing 176W - 250W HID Exterior Garage LED replacing 176W - 250W HID 0.7
PECO- Smart Equipment Incentives (GINP)
GIN SEI Exterior Garage LED replacing 251W - 400W HID Exterior Garage LED replacing 251W - 400W HID 0.7
PECO- Smart Equipment Incentives (GINP)
GIN SEI Exterior High Wattage Pin-based CFLs Exterior High Wattage Pin-based CFLs 0.7
PECO- Smart Equipment Incentives (GINP)
GIN SEI Exterior LED replacing 175W or Less HID Exterior LED replacing 175W or Less HID 0.7
PECO- Smart Equipment Incentives (GINP)
GIN SEI Exterior LED replacing 176W - 250W HID Exterior LED replacing 176W - 250W HID 0.7
PECO- Smart Equipment Incentives (GINP)
GIN SEI Exterior LED replacing 251W - 400W HID Exterior LED replacing 251W - 400W HID 0.7
PECO- Smart Equipment Incentives (GINP)
GIN SEI Exterior Pulse Start or Ceramic, 350W - 400W Exterior Pulse Start or Ceramic, 350W - 400W 0.7
PECO- Smart Equipment Incentives (GINP)
GIN SEI Exterior T8/T5 New Fluorescent Fixture w/ Electronic
Ballast Exterior T8/T5 New Fluorescent Fixture w/ Electronic
Ballast 0.7
PECO- Smart Equipment Incentives (GINP)
GIN SEI Garage T8/T5 New Fluorescent Fixture w/ Electronic
Ballast Garage T8/T5 New Fluorescent Fixture w/ Electronic
Ballast 0.7
PECO- Smart Equipment Incentives (GINP)
GIN SEI Interior 2-ft HPT8 Ballast with Low Ballast Factor Interior 2-ft HPT8 Ballast with Low Ballast Factor 0.7
PECO- Smart Equipment Incentives (GINP)
GIN SEI Interior 3-ft HPT8 Ballast with Low Ballast Factor Interior 3-ft HPT8 Ballast with Low Ballast Factor 0.7
PECO- Smart Equipment Incentives (GINP)
GIN SEI Interior 4-ft HPT8 Ballast with Low Ballast Factor Interior 4-ft HPT8 Ballast with Low Ballast Factor 0.7
PECO- Smart Equipment Incentives (GINP)
GIN SEI Interior Central Lighting Controls Interior Central Lighting Controls 0.7
PECO- Smart Equipment Incentives (GINP)
GIN SEI Interior CFL - Downlight, Dimmable or 3-way Interior CFL - Downlight, Dimmable or 3-way 0.7
PECO- Smart Equipment Incentives (GINP)
GIN SEI Interior CFL - Screw-in (30W or Less) Interior CFL - Screw-in (30W or Less) 0.7
PECO- Smart Equipment Incentives (GINP)
GIN SEI Interior CFL - Screw-in (31W or 115W) Interior CFL - Screw-in (31W or 115W) 0.7
PECO- Smart Equipment Incentives (GINP) GIN SEI Interior Cold Cathode Interior Cold Cathode 0.7
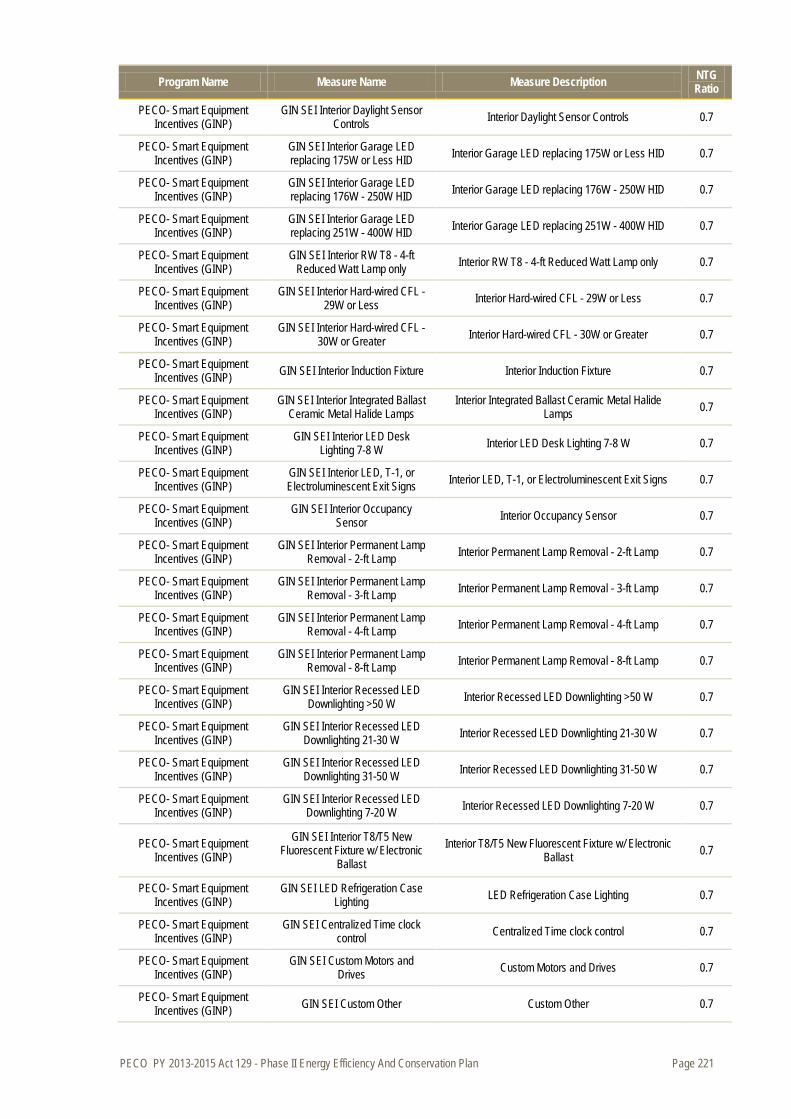
PECO PY 2013-2015 Act 129 - Phase II Energy Efficiency And Conservation Plan Page 221
Program Name Measure Name Measure Description NTG Ratio
PECO- Smart Equipment Incentives (GINP)
GIN SEI Interior Daylight Sensor Controls Interior Daylight Sensor Controls 0.7
PECO- Smart Equipment Incentives (GINP)
GIN SEI Interior Garage LED replacing 175W or Less HID Interior Garage LED replacing 175W or Less HID 0.7
PECO- Smart Equipment Incentives (GINP)
GIN SEI Interior Garage LED replacing 176W - 250W HID Interior Garage LED replacing 176W - 250W HID 0.7
PECO- Smart Equipment Incentives (GINP)
GIN SEI Interior Garage LED replacing 251W - 400W HID Interior Garage LED replacing 251W - 400W HID 0.7
PECO- Smart Equipment Incentives (GINP)
GIN SEI Interior RW T8 - 4-ft Reduced Watt Lamp only Interior RW T8 - 4-ft Reduced Watt Lamp only 0.7
PECO- Smart Equipment Incentives (GINP)
GIN SEI Interior Hard-wired CFL - 29W or Less Interior Hard-wired CFL - 29W or Less 0.7
PECO- Smart Equipment Incentives (GINP)
GIN SEI Interior Hard-wired CFL - 30W or Greater Interior Hard-wired CFL - 30W or Greater 0.7
PECO- Smart Equipment Incentives (GINP) GIN SEI Interior Induction Fixture Interior Induction Fixture 0.7
PECO- Smart Equipment Incentives (GINP)
GIN SEI Interior Integrated Ballast Ceramic Metal Halide Lamps
Interior Integrated Ballast Ceramic Metal Halide Lamps 0.7
PECO- Smart Equipment Incentives (GINP)
GIN SEI Interior LED Desk Lighting 7-8 W Interior LED Desk Lighting 7-8 W 0.7
PECO- Smart Equipment Incentives (GINP)
GIN SEI Interior LED, T-1, or Electroluminescent Exit Signs Interior LED, T-1, or Electroluminescent Exit Signs 0.7
PECO- Smart Equipment Incentives (GINP)
GIN SEI Interior Occupancy Sensor Interior Occupancy Sensor 0.7
PECO- Smart Equipment Incentives (GINP)
GIN SEI Interior Permanent Lamp Removal - 2-ft Lamp Interior Permanent Lamp Removal - 2-ft Lamp 0.7
PECO- Smart Equipment Incentives (GINP)
GIN SEI Interior Permanent Lamp Removal - 3-ft Lamp Interior Permanent Lamp Removal - 3-ft Lamp 0.7
PECO- Smart Equipment Incentives (GINP)
GIN SEI Interior Permanent Lamp Removal - 4-ft Lamp Interior Permanent Lamp Removal - 4-ft Lamp 0.7
PECO- Smart Equipment Incentives (GINP)
GIN SEI Interior Permanent Lamp Removal - 8-ft Lamp Interior Permanent Lamp Removal - 8-ft Lamp 0.7
PECO- Smart Equipment Incentives (GINP)
GIN SEI Interior Recessed LED Downlighting >50 W Interior Recessed LED Downlighting >50 W 0.7
PECO- Smart Equipment Incentives (GINP)
GIN SEI Interior Recessed LED Downlighting 21-30 W Interior Recessed LED Downlighting 21-30 W 0.7
PECO- Smart Equipment Incentives (GINP)
GIN SEI Interior Recessed LED Downlighting 31-50 W Interior Recessed LED Downlighting 31-50 W 0.7
PECO- Smart Equipment Incentives (GINP)
GIN SEI Interior Recessed LED Downlighting 7-20 W Interior Recessed LED Downlighting 7-20 W 0.7
PECO- Smart Equipment Incentives (GINP)
GIN SEI Interior T8/T5 New Fluorescent Fixture w/ Electronic
Ballast Interior T8/T5 New Fluorescent Fixture w/ Electronic
Ballast 0.7
PECO- Smart Equipment Incentives (GINP)
GIN SEI LED Refrigeration Case Lighting LED Refrigeration Case Lighting 0.7
PECO- Smart Equipment Incentives (GINP)
GIN SEI Centralized Time clock control Centralized Time clock control 0.7
PECO- Smart Equipment Incentives (GINP)
GIN SEI Custom Motors and Drives Custom Motors and Drives 0.7
PECO- Smart Equipment Incentives (GINP) GIN SEI Custom Other Custom Other 0.7
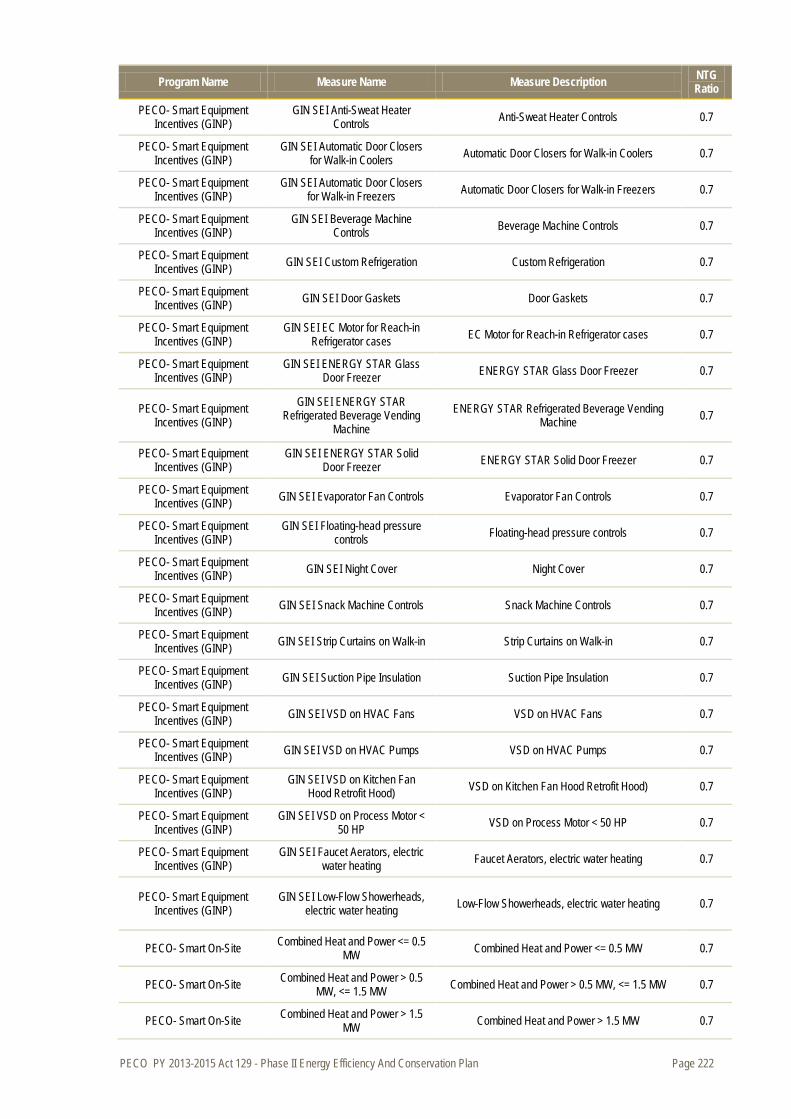
PECO PY 2013-2015 Act 129 - Phase II Energy Efficiency And Conservation Plan Page 222
Program Name Measure Name Measure Description NTG Ratio
PECO- Smart Equipment Incentives (GINP)
GIN SEI Anti-Sweat Heater Controls Anti-Sweat Heater Controls 0.7
PECO- Smart Equipment Incentives (GINP)
GIN SEI Automatic Door Closers for Walk-in Coolers Automatic Door Closers for Walk-in Coolers 0.7
PECO- Smart Equipment Incentives (GINP)
GIN SEI Automatic Door Closers for Walk-in Freezers Automatic Door Closers for Walk-in Freezers 0.7
PECO- Smart Equipment Incentives (GINP)
GIN SEI Beverage Machine Controls Beverage Machine Controls 0.7
PECO- Smart Equipment Incentives (GINP) GIN SEI Custom Refrigeration Custom Refrigeration 0.7
PECO- Smart Equipment Incentives (GINP) GIN SEI Door Gaskets Door Gaskets 0.7
PECO- Smart Equipment Incentives (GINP)
GIN SEI EC Motor for Reach-in Refrigerator cases EC Motor for Reach-in Refrigerator cases 0.7
PECO- Smart Equipment Incentives (GINP)
GIN SEI ENERGY STAR Glass Door Freezer ENERGY STAR Glass Door Freezer 0.7
PECO- Smart Equipment Incentives (GINP)
GIN SEI ENERGY STAR Refrigerated Beverage Vending
Machine ENERGY STAR Refrigerated Beverage Vending
Machine 0.7
PECO- Smart Equipment Incentives (GINP)
GIN SEI ENERGY STAR Solid Door Freezer ENERGY STAR Solid Door Freezer 0.7
PECO- Smart Equipment Incentives (GINP) GIN SEI Evaporator Fan Controls Evaporator Fan Controls 0.7
PECO- Smart Equipment Incentives (GINP)
GIN SEI Floating-head pressure controls Floating-head pressure controls 0.7
PECO- Smart Equipment Incentives (GINP) GIN SEI Night Cover Night Cover 0.7
PECO- Smart Equipment Incentives (GINP) GIN SEI Snack Machine Controls Snack Machine Controls 0.7
PECO- Smart Equipment Incentives (GINP) GIN SEI Strip Curtains on Walk-in Strip Curtains on Walk-in 0.7
PECO- Smart Equipment Incentives (GINP) GIN SEI Suction Pipe Insulation Suction Pipe Insulation 0.7
PECO- Smart Equipment Incentives (GINP) GIN SEI VSD on HVAC Fans VSD on HVAC Fans 0.7
PECO- Smart Equipment Incentives (GINP) GIN SEI VSD on HVAC Pumps VSD on HVAC Pumps 0.7
PECO- Smart Equipment Incentives (GINP)
GIN SEI VSD on Kitchen Fan Hood Retrofit Hood) VSD on Kitchen Fan Hood Retrofit Hood) 0.7
PECO- Smart Equipment Incentives (GINP)
GIN SEI VSD on Process Motor < 50 HP VSD on Process Motor < 50 HP 0.7
PECO- Smart Equipment Incentives (GINP)
GIN SEI Faucet Aerators, electric water heating Faucet Aerators, electric water heating 0.7
PECO- Smart Equipment Incentives (GINP)
GIN SEI Low-Flow Showerheads, electric water heating Low-Flow Showerheads, electric water heating 0.7
PECO- Smart On-Site Combined Heat and Power <= 0.5 MW Combined Heat and Power <= 0.5 MW 0.7
PECO- Smart On-Site Combined Heat and Power > 0.5 MW, <= 1.5 MW Combined Heat and Power > 0.5 MW, <= 1.5 MW 0.7
PECO- Smart On-Site Combined Heat and Power > 1.5 MW Combined Heat and Power > 1.5 MW 0.7
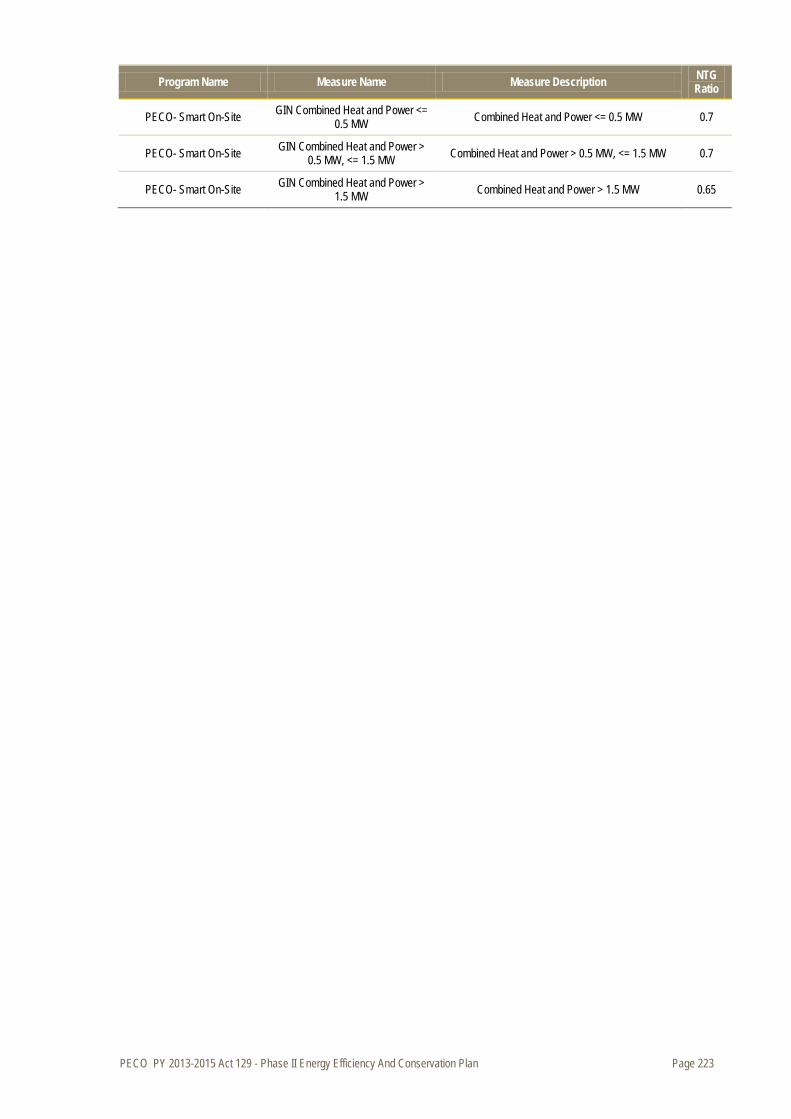
PECO PY 2013-2015 Act 129 - Phase II Energy Efficiency And Conservation Plan Page 223
Program Name Measure Name Measure Description NTG Ratio
PECO- Smart On-Site GIN Combined Heat and Power <= 0.5 MW Combined Heat and Power <= 0.5 MW 0.7
PECO- Smart On-Site GIN Combined Heat and Power > 0.5 MW, <= 1.5 MW Combined Heat and Power > 0.5 MW, <= 1.5 MW 0.7
PECO- Smart On-Site GIN Combined Heat and Power > 1.5 MW Combined Heat and Power > 1.5 MW 0.65
PECO PY 2013-2015 Act 129 - Phase II Energy Efficiency And Conservation Plan Page 224
Appendix E. Exhibits RAS
Exhibits RAS-1, RAS-2, RAS-3 and RAS-4 are attached to the Direct Testimony of Richard A. Schlesinger.