PEBBLE PROJECT ENVIRONMENTAL BASELINE DOCUMENT 2004 ... · PEBBLE PROJECT, ENVIRONMENTAL BASELINE...
74
PEBBLE PROJECT ENVIRONMENTAL BASELINE DOCUMENT 2004 through 2008 CHAPTER 40. FRESHWATER FISH AND AQUATIC INVERTEBRATES Cook Inlet Drainages PREPARED BY: R2 RESOURCE CONSULTANTS, INC. HDR ALASKA, INC.
Transcript of PEBBLE PROJECT ENVIRONMENTAL BASELINE DOCUMENT 2004 ... · PEBBLE PROJECT, ENVIRONMENTAL BASELINE...
PEBBLE PROJECT ENVIRONMENTAL BASELINE DOCUMENT
2004 through 2008
CHAPTER 40. FRESHWATER FISH AND
AQUATIC INVERTEBRATES Cook Inlet Drainages
PPRREEPPAARREEDD BBYY:: RR22 RREESSOOUURRCCEE CCOONNSSUULLTTAANNTTSS,, IINNCC..
HHDDRR AALLAASSKKAA,, IINNCC..
FRESHWATER FISH AND AQUATIC INVERTEBRATES—COOK INLET DRAINAGES
40-i 06/27/2011
TABLE OF CONTENTS
TABLE OF CONTENTS .......................................................................................................................... 40-i
LIST OF TABLES .................................................................................................................................. 40-iii
LIST OF FIGURES ................................................................................................................................ 40-iii
PHOTOGRAPHS ................................................................................................................................... 40-iv
LIST OF APPENDICES ......................................................................................................................... 40-iv
ACRONYMS AND ABBREVIATIONS ................................................................................................ 40-v
40. FRESHWATER FISH AND AQUATIC INVERTEBRATES ...................................................... 40.1-1
40.1 Transportation Corridor Studies ........................................................................................... 40.1-1
40.1.1 Introduction ............................................................................................................. 40.1-1
40.1.2 Study Objectives ...................................................................................................... 40.1-2
40.1.3 Study Area ............................................................................................................... 40.1-2
40.1.4 Scope of Work ......................................................................................................... 40.1-2
40.1.5 Methods ................................................................................................................... 40.1-3
40.1.5.1 Aquatic Habitat Assessments ................................................................ 40.1-3 40.1.5.2 Water Quality Measurements ................................................................ 40.1-4 40.1.5.3 Fish Distribution Studies ....................................................................... 40.1-4
40.1.6 Results and Discussion ............................................................................................ 40.1-4
40.1.6.1 Williams Creek Watershed .................................................................... 40.1-4 40.1.6.2 Y-Valley Watershed .............................................................................. 40.1-6 40.1.6.3 Iniskin Bay T1 Watershed ..................................................................... 40.1-7
40.1.7 Summary .................................................................................................................. 40.1-8
40.1.8 References ............................................................................................................. 40.1-10
40.1.9 Glossary ................................................................................................................. 40.1-10
40.2 Macroinvertebrates and Periphyton ...................................................................................... 40.2-1
40.2.1 Introduction ............................................................................................................. 40.2-1
40.2.2 Study Objectives ...................................................................................................... 40.2-1
40.2.3 Study Area ............................................................................................................... 40.2-1
40.2.4 Scope of Work ......................................................................................................... 40.2-2
40.2.5 Macroinvertebrate Methods ..................................................................................... 40.2-3
40.2.5.1 Field Sampling Protocol ........................................................................ 40.2-3 40.2.5.2 Laboratory Processing ........................................................................... 40.2-4 40.2.5.3 Data Analysis ......................................................................................... 40.2-5
40.2.6 Periphyton Methods ................................................................................................. 40.2-7
40.2.6.1 Field Sampling Protocol ........................................................................ 40.2-7 40.2.6.2 Laboratory Procedures ........................................................................... 40.2-9
PEBBLE PROJECT, ENVIRONMENTAL BASELINE DOCUMENT, 2004 THROUGH 2008
40-ii 06/27/2011
40.2.6.3 Data Analysis ....................................................................................... 40.2-10 40.2.7 Results and Discussion .......................................................................................... 40.2-11
40.2.7.1 Macroinvertebrates .............................................................................. 40.2-11 40.2.7.2 Periphyton ............................................................................................ 40.2-12
40.2.8 Summary ................................................................................................................ 40.2-12
40.2.9 References ............................................................................................................. 40.2-13
40.2.10 Glossary ................................................................................................................. 40.2-14
FRESHWATER FISH AND AQUATIC INVERTEBRATES—COOK INLET DRAINAGES
40-iii 06/27/2011
LIST OF TABLES
Table 40.1-1, Watershed Affiliation of Survey Sites along the Representative Road Alignment in the Transportation Corridor, Cook Inlet Drainages Study Area
Table 40.1-2, Alaska Department of Environmental Conservation Water Quality Standards for Growth and Propagation of Fish, Shellfish, Other Aquatic Life, and Wildlife in Freshwater
Table 40.1-3, Channel Morphology Data Collected at Representative Road Alignment Primary Survey Sites, Transportation Corridor, Cook Inlet Drainages Study Area
Table 40.1-4, Habitat Composition Data Collected at Representative Road Alignment Primary Survey Sites, Transportation Corridor, Cook Inlet Drainages Study Area
Table 40.1-5, Substrate Composition Data Collected at Representative Road Alignment Primary Survey Sites, Transportation Corridor, Cook Inlet Drainages Study Area
Table 40.1-6, Water Quality Data at Representative Road Alignment Primary Survey Sites, Transportation Corridor, Cook Inlet Drainages Study Area
Table 40.1-7, Fish Species Observed at Representative Road Alignment Primary and Support Survey Sites, Transportation Corridor, Cook Inlet Drainages Study Area
Table 40.1-8, Water Quality Measurements at Representative Road Alignment Primary Survey Sites that Do Not Meet Alaska Department of Environmental Conservation Water Quality Standards, Transportation Corridor, Cook Inlet Drainages Study Area
Table 40.2-1, Macroinvertebrate Taxa Identified in Samples Collected in the Cook Inlet Drainages, 2004 and 2005
Table 40.2-2, Chironomidae Taxa Identified in Samples Collected in the Cook Inlet Drainages, 2004 and 2005
Table 40.2-3, Macroinvertebrate Metrics, Cook Inlet Drainages, 2004 and 2005
Table 40.2-4, Scores for Aquatic Habitat Quality Parameters, Cook Inlet Drainages, 2004 and 2005
Table 40.2-5, Scores for Riparian Habitat Quality Parameters, Cook Inlet Drainages, 2004 and 2005
Table 40.2-6, Ambient Water-quality Measurements, Cook Inlet Drainages, August 2004 and June 2005
Table 40.2-7, Periphyton (Diatom) Taxa, Cook Inlet Drainages, 2004
Table 40.2-8, Periphyton Metrics for Data Collected Using RBP Method (Diatom Identification) in 2004 and Chlorophyll-a Sampling in 2005, Cook Inlet Drainages
LIST OF FIGURES
Figure 40.1-1, Primary Survey Sites for the Representative Road Alignment, 2004-2008
Figure 40.1-2, Primary and Support Survey Sites for the Representative Road Alignment by Cook Inlet Watershed
PEBBLE PROJECT, ENVIRONMENTAL BASELINE DOCUMENT, 2004 THROUGH 2008
40-iv 06/27/2011
Figure 40.1-3, Locations of Water Quality Data that Do Not Meet ADEC Water Quality Criteria for Aquatic Life, Cook Inlet Basin
Figure 40.1-4, Fish Presence at Primary and Support Survey Sites for the Representative Road Alignment, Cook Inlet Basin
Figure 40.1-5, Fish Species Composition at Representative Road Alignment Primary Survey Sites, Y-Valley Creek Watershed
Figure 40.2-1, Macroinvertebrates and Periphyton Sampling Sites, Cook Inlet Drainages, 2004 and 2005
PHOTOGRAPHS
LIST OF APPENDICES
Appendix 40.1A, Transportation Corridor, Cook Inlet Basin Survey Data Summaries: Primary Survey Sites - Data Collected on or near Possible Representative Road Alignment Stream Crossings
Appendix 40.1B, Transportation Corridor, Cook Inlet Basin Survey Data Summaries: Support Survey Sites - Data Collected Upstream or Downstream of Surveyed Primary Survey Sites
FRESHWATER FISH AND AQUATIC INVERTEBRATES—COOK INLET DRAINAGES
40-v 06/27/2011
ACRONYMS AND ABBREVIATIONS
ADEC Alaska Department of Environmental Conservation
ADF&G Alaska Department of Fish and Game
ASCI Alaska Stream Condition Index
AWC Anadromous Waters Catalog
cm Centimeter
ºC Degrees Celsius
CTI Community Tolerance Index
ºF Degrees Fahrenheit
DI deionized
DO Dissolved Oxygen
EBD Environmental Baseline Document
EPA U.S. Environmental Protection Agency
EPT Ephemeroptera, Plecoptera, and Trichoptera
ft3 cubic feet
GPS Global Positioning System
HDR HDR Alaska, Inc.
L Liter(s)
m2 square meter(s)
m3 cubic meter(s)
mg milligram(s)
MgCO3 magnesium carbonate
μm micrometer(s)
μS microSiemen(s)
µS/cm microSiemens per centimeter
mg Milligram(s)
mg/L Milligram per Liter
MP Milepost
NDM Northern Dynasty Mines Inc.
pH Hydrogen ion activity
PVC polyvinyl chloride
QA quality assurance
QC quality control
RBP Rapid Bioassessment Protocol
R2 R2 Resource Consultants, Inc.
TV Tolerance value
USFS U.S. Forest Service
FRESHWATER FISH AND AQUATIC INVERTEBRATES—COOK INLET DRAINAGES
40.1-1 06/27/2011
40. FRESHWATER FISH AND AQUATIC INVERTEBRATES
40.1 Transportation Corridor Studies
40.1.1 Introduction
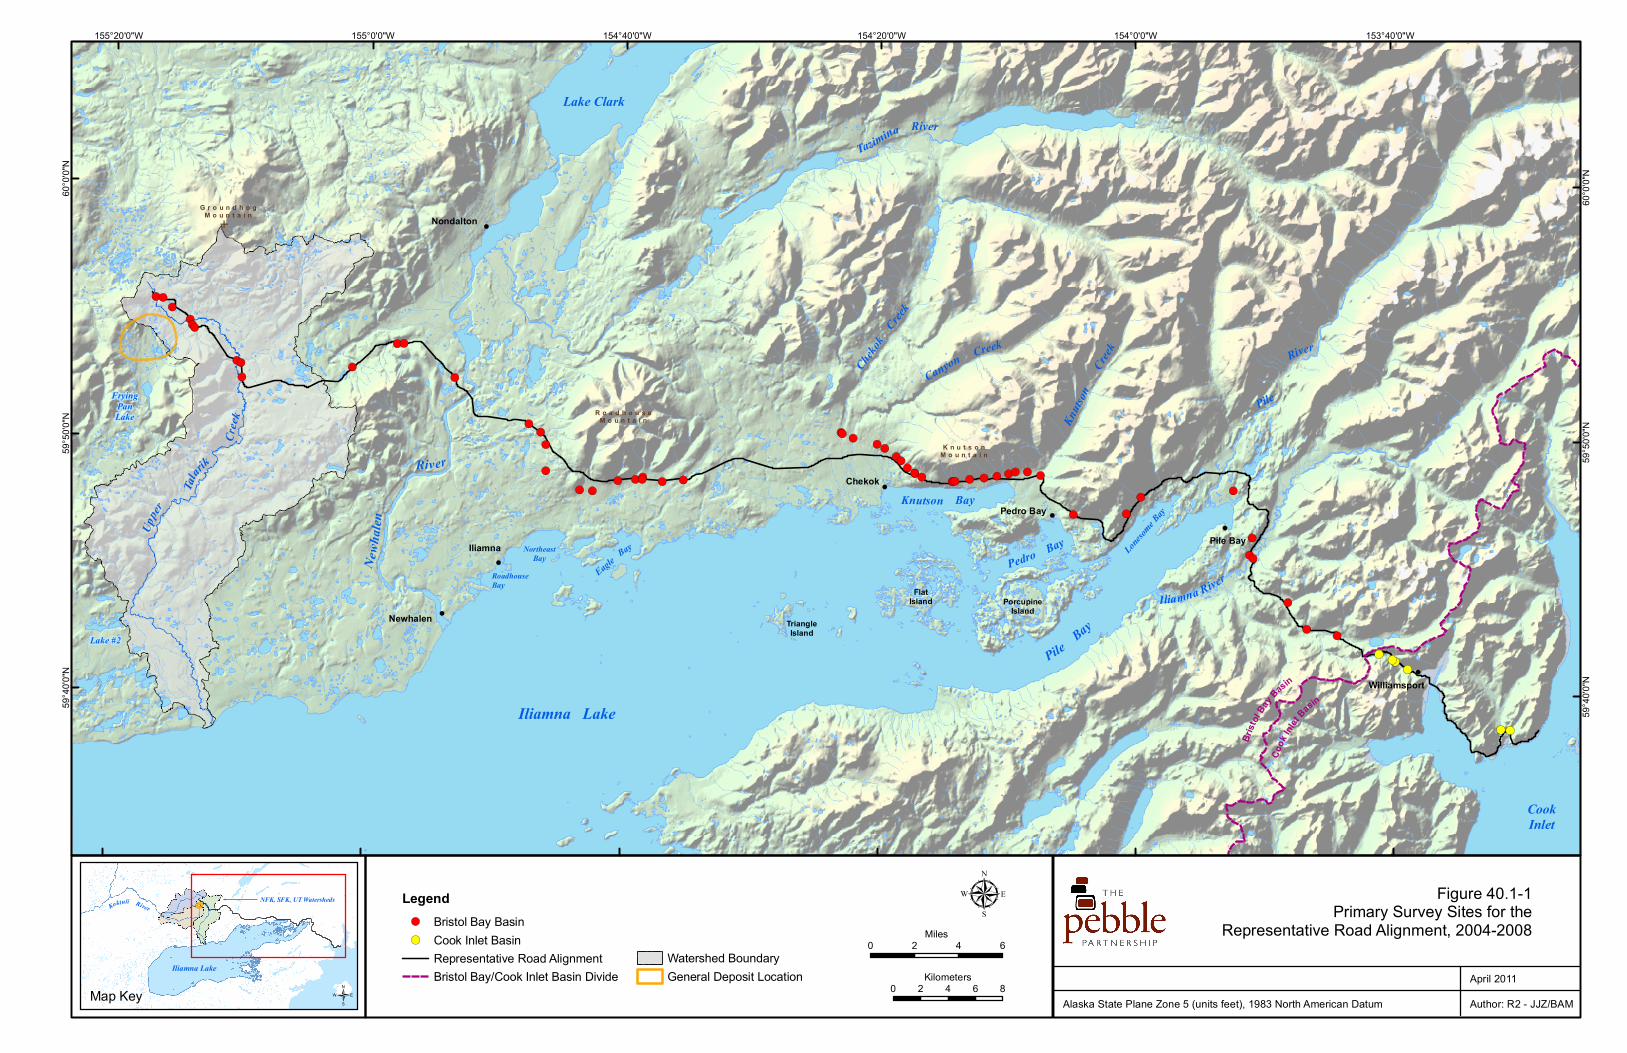
Development of the Pebble Deposit would likely require the construction of an approximately 90-mile (144-kilometer) access road linking the Pebble Deposit to Cook Inlet. To address this possibility, Northern Dynasty Mines, Inc. (NDM), Pebble Partnership, and the Alaska Department of Transportation and Public Facilities have considered several possible road alignments This study characterizes typical conditions within the transportation corridor, Cook Inlet Drainages study area by focusing on one representative road alignment. Along this route, there are numerous watersheds varying from large rivers (e.g., Newhalen River) to very small, seasonally flowing channels, each of which belongs to one of two major drainage basins: Bristol Bay or Cook Inlet. This chapter focuses on only those watersheds associated with the Cook Inlet Basin. Watersheds associated with the Bristol Bay Basin are addressed in Chapter 15.
The survey sites selected for this study include primary survey sites located directly on or near the representative road alignment. Each of the primary survey sites corresponds to a milepost along the representative road alignment. Mileposts represent the distance along the representative road alignment between the road alignment’s western terminus at the edge of the Pebble Deposit and the primary survey site locations. The naming convention for mileposts consists of “MP” (for “milepost”) followed by a number that specifies the distance in miles between the Pebble Deposit and the site location. Additionally, there are support survey sites that are located upstream and/or downstream of the primary survey sites, or on nearby tributaries. Primary sites are regarded as representative of possible stream crossing conditions throughout the study area, and support survey sites provide additional information regarding fish resources at nearby locations in the same watershed. Primary and support survey sites were identified and subsequently surveyed for fish and aquatic habitat conditions (Figure 40.1-1).
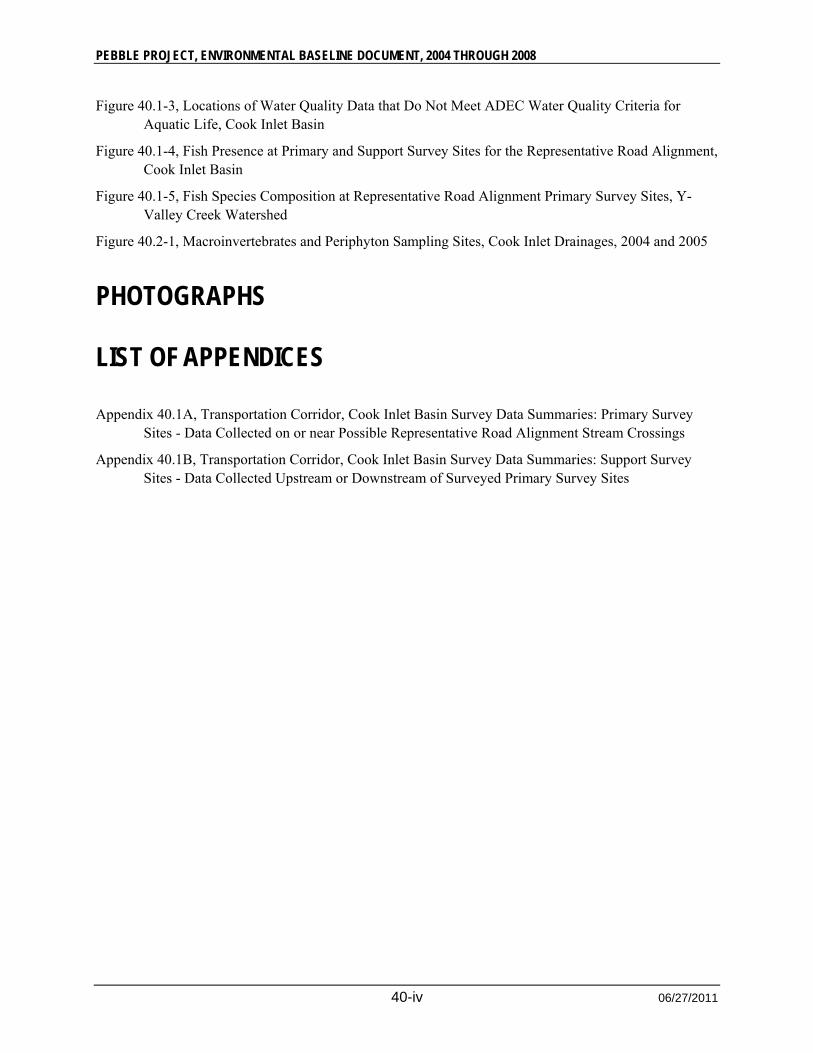
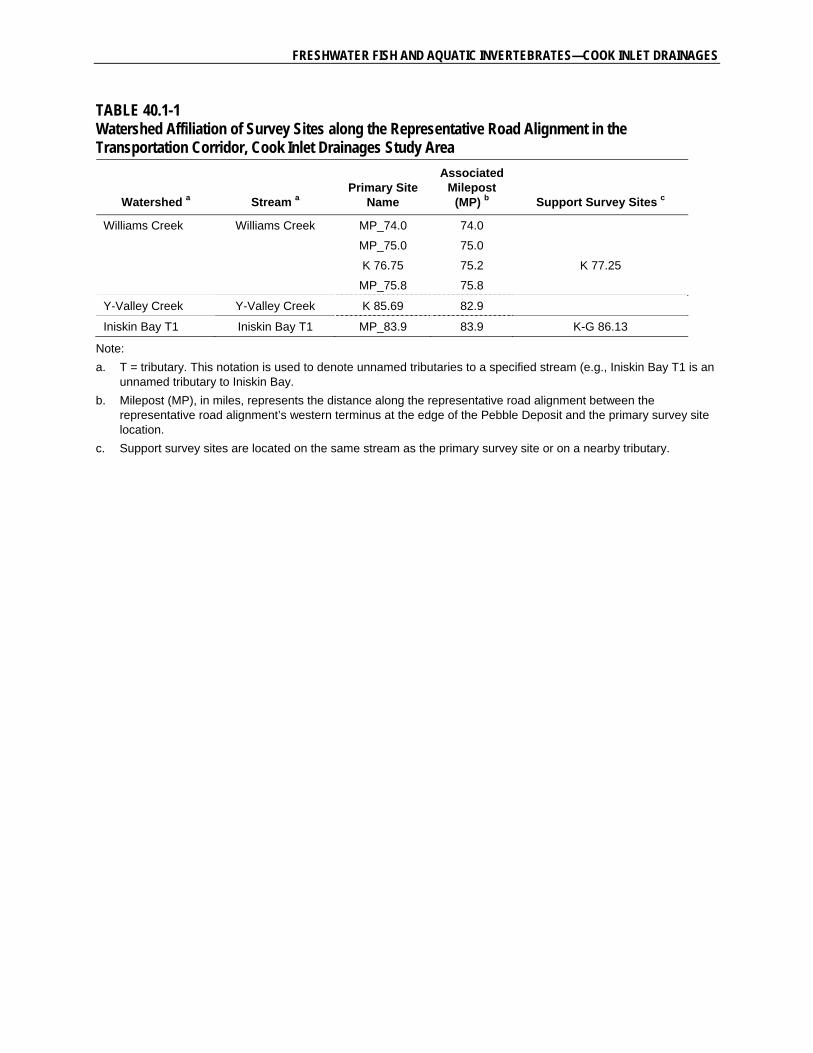
This chapter presents a summary of the study objectives, methods, and results of the transportation corridor fish and aquatic habitat surveys that were conducted in the Cook Inlet Basin from 2004 through 2008. The primary survey sites within the Cook Inlet Basin have been grouped into one of three watersheds: Williams Creek, Y-Valley Creek, and an unnamed tributary to Iniskin Bay (Figure 40.1-2; Table 40.1-1). When additional data from sampling elsewhere in these watersheds are available, these data are discussed in reference to the nearest primary survey site within the same watershed (Table 40.1-1). Results for nearshore fish in Cook Inlet are discussed in Chapter 43.
This section also includes two appendices that describe the results at each survey site sampled during the transportation corridor studies from 2004 through 2008:
Appendix 40.1A, Transportation Corridor, Cook Inlet Basin Survey Data Summaries: Primary Survey Sites - Data Collected on or near Possible Representative Road Alignment Stream Crossings
PEBBLE PROJECT, ENVIRONMENTAL BASELINE DOCUMENT, 2004 THROUGH 2008
40.1-2 06/27/2011
Appendix 40.1B, Transportation Corridor, Cook Inlet Basin Survey Data Summaries: Support Survey Sites – Data Collected Upstream or Downstream of Surveyed Primary Survey Sites
Appendices 40.1A and 40.1B are organized in ascending order of mileposts, from west to east, along the representative road alignment. Appendix 40.1A presents data from primary survey sites located on or near possible stream crossings of the representative road alignment. Appendix 40.1B presents data from support survey sites that are located upstream and/or downstream of primary survey sites that were actually surveyed.
40.1.2 Study Objectives
The overall goal of the transportation corridor fish and aquatic resource studies was to describe the baseline characteristics of fish assemblages and aquatic habitats representative of possible stream crossing locations along a representative road alignment. Baseline conditions refer to the habitats and associated fish populations as they currently exist in the watersheds in the absence of any road development. The studies, in combination with resource investigations described in other Environmental Baseline Document (EBD) chapters, were collectively designed to address the following technical questions:
What are the baseline channel conditions at each primary and support survey site?
What types of aquatic habitats are present at each primary and support survey site, and how can those habitats be described?
What are the water quality characteristics at each primary and support survey site?
What is the composition and distribution of fish species at each primary and support survey site?
40.1.3 Study Area
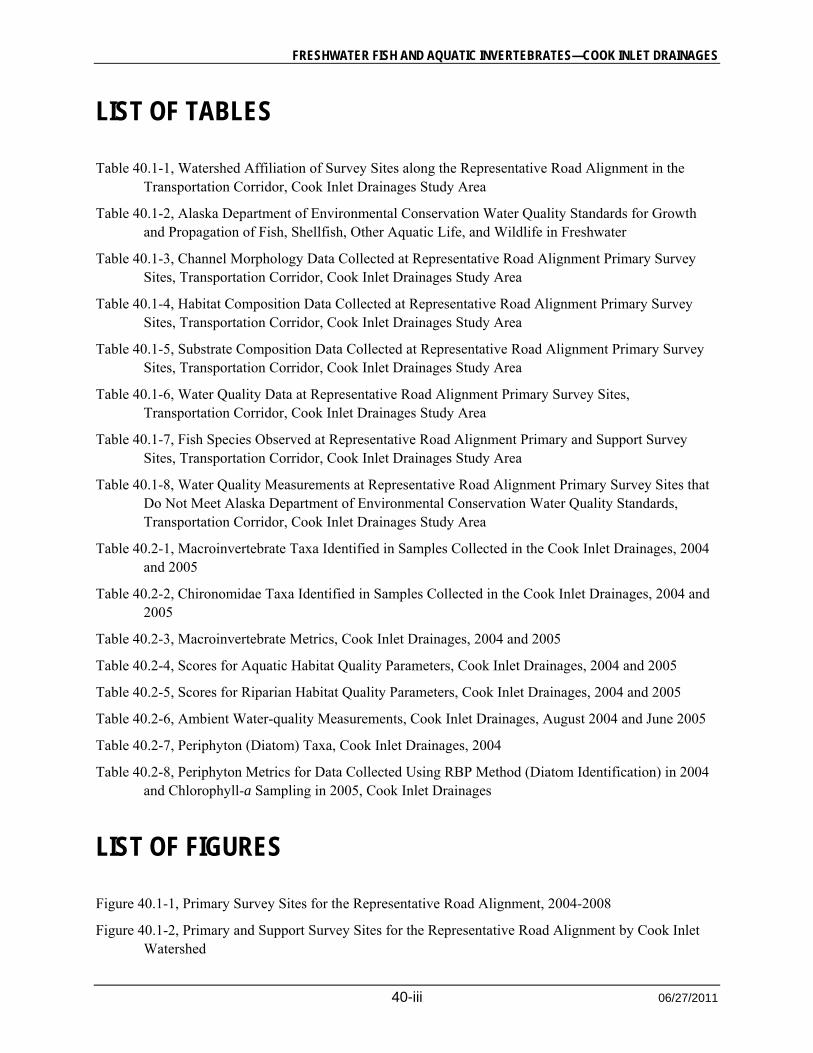
The Cook Inlet Drainages study area for the transportation corridor fish and aquatic surveys consisted of a 2,000-foot (600-meter) wide survey corridor encompassing the representative road alignment, beginning at the Chigmit Mountains and continuing east to Cook Inlet (Figure 40.1-1). From Williams Creek on the western edge of the study area, the representative road alignment crosses Iliamna Bay near the mouth of Williams Creek and then proceeds along the eastern coastline of Iliamna Bay to North Head, crossing Y-Valley Creek, and ending at outer Iniskin Bay on the east side of Knoll Head (Figure 40.1-2). Specifically, the representative road alignment crosses or lies adjacent to Williams Creek at four different locations, Y-Valley Creek at a single location, and a tributary to Iniskin Bay at a single location (Table 40.1-1). All of these watersheds eventually drain to Cook Inlet. Each of these six representative road alignment stream crossing locations was surveyed as a primary survey site in 2004 through 2008 (Table 40.1-1).
40.1.4 Scope of Work
Fish and aquatic resource surveys within the transportation corridor study area were initiated in 2004 by NDM and were continued by the Pebble Partnership through 2008. Field studies were carried out by HDR Alaska, Inc. (HDR) from 2004 through 2007 and by R2 Resource Consultants, Inc. (R2) in 2008. Consistent with the study objectives, there were four main study components: channel morphology, aquatic habitat characterization, water quality, and fish distribution.
FRESHWATER FISH AND AQUATIC INVERTEBRATES—COOK INLET DRAINAGES
40.1-3 06/27/2011
40.1.5 Methods
Fish abundance and habitat surveys in the Cook Inlet drainages study area were conducted in 2004, 2005, 2007, and 2008. Over the study period, fish presence and habitat surveys were conducted at six primary survey sites (Appendix 40.1A) and two related support survey sites (Appendix 40.1B) (Table 40.1-1). Detailed methods for the aquatic habitat and fish resource studies are described in Appendix E of this EBD. Included here is a brief summary of these methods as they relate to survey site selection, aquatic habitat assessments, water quality sampling, and fish distribution surveys.
Similar survey protocols and methods were used at the primary and support survey sites. Primary and support survey sites were identified remotely via a combination of topographic maps and aerial photography and were subsequently visited to determine if there was a wetted, ephemeral, or dry channel present at the site, or if there was no channel present. Photographs to document channel conditions were taken at the time of visit, and actual survey locations were documented in the field using global positioning system (GPS) units to record coordinate data. For wetted and ephemeral channels, the length of stream sampled at each survey site was 656 feet (200 meters) or 40 times the average bed width, whichever was the lesser of the two values. However, on occasion, survey lengths were greater than this in order to obtain a more comprehensive sample.
40.1.5.1 Aquatic Habitat Assessments
The overall objective of the aquatic habitat studies was to characterize the type (e.g., pools, riffles, and runs/glides), distribution, and amount of habitat available for fish at each primary and support survey site. To address this objective, aquatic habitat surveys were conducted, with each year’s effort focused on specific survey sites, habitat components, or various data gaps. The majority of habitat surveys used modified Tier 1 and Tier 3 habitat survey protocols adapted from Chapter 20 of the United States Forest Service (USFS) FSH 2009–Aquatic Habitat Management Handbook (R-10 Amendment 2090.21-2001-1), Fish and Aquatic Stream Habitat Survey (USFS, 2001). This method allows for habitat data collection at multiple tiers (i.e., Tiers 1, 2, and 3), with Tier 1 representing the broadest level of classification (e.g., reach-scale), and Tiers 2 and 3 finer levels of classification (e.g., meso- and microhabitat units).
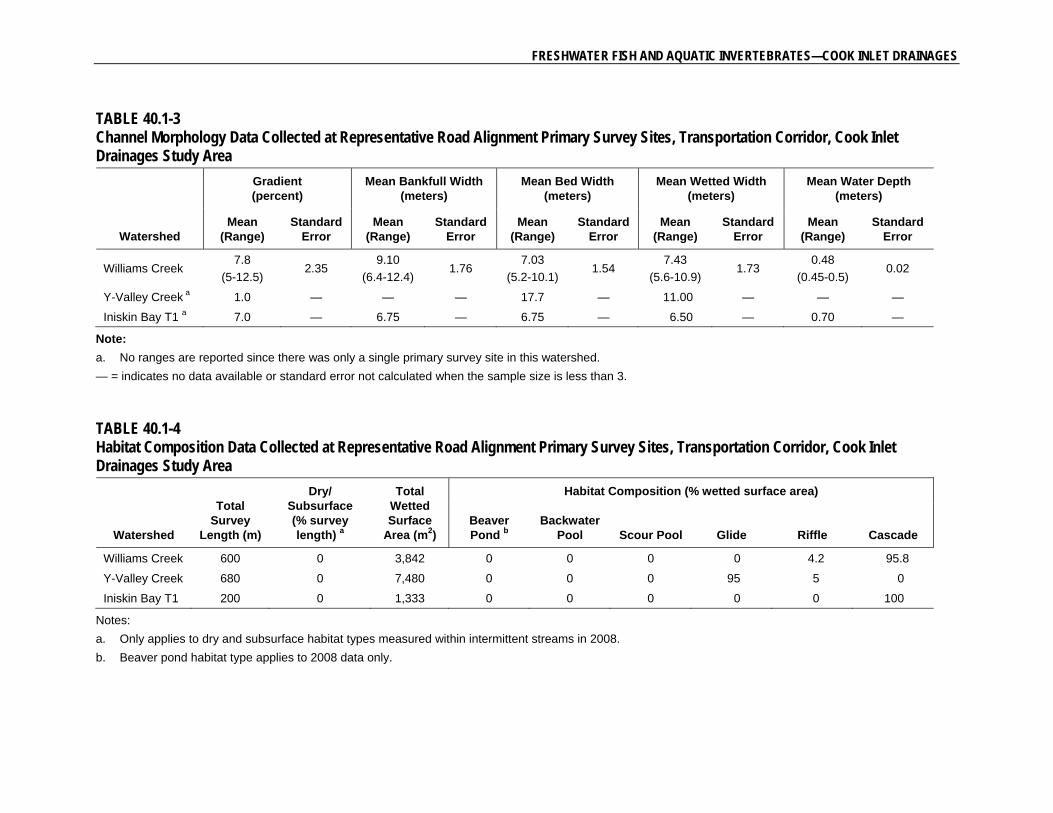
Modified Tier 1 protocols (USFS, 2001) were used to collect information on channel morphology and valley form at each primary and support survey site. Channel morphometry data, such as bankfull width, bankfull depth, bed width, wetted width, and gradient, were collected at transects located within each survey site. Data collected at these transects are summarized by watershed in the Channel Morphology sections of Section 40.1.6.
Modified Tier 3 habitat surveys (USFS, 2001) were conducted at each primary and support survey site where water was present to document and characterize individual habitat types available to fish (e.g., beaver pond complexes, backwaters/sloughs, pools, runs/glides, riffles, and cascades). Percent habitat composition of each site was determined by calculating the percent of the total wetted area of the site (wetted width multiplied by length) attributed to each habitat type encountered. Habitat composition was scaled up to the watershed level by summing total wetted areas across represented habitat types divided by the total wetted area surveyed within the watershed. In addition to habitat composition data, locations of special habitat features (e.g., tributaries, springs, seeps, possible barriers to fish migration) were also recorded in 2008. For tributaries, seeps, and springs, the percent flow contribution to the mainstem was
PEBBLE PROJECT, ENVIRONMENTAL BASELINE DOCUMENT, 2004 THROUGH 2008
40.1-4 06/27/2011
visually estimated, and water temperatures were measured. Habitat survey activities are shown in Photo 40.1-1. Aquatic habitat data are summarized by watershed in the Aquatic Habitat sections of Section 40.1.6.
40.1.5.2 Water Quality Measurements
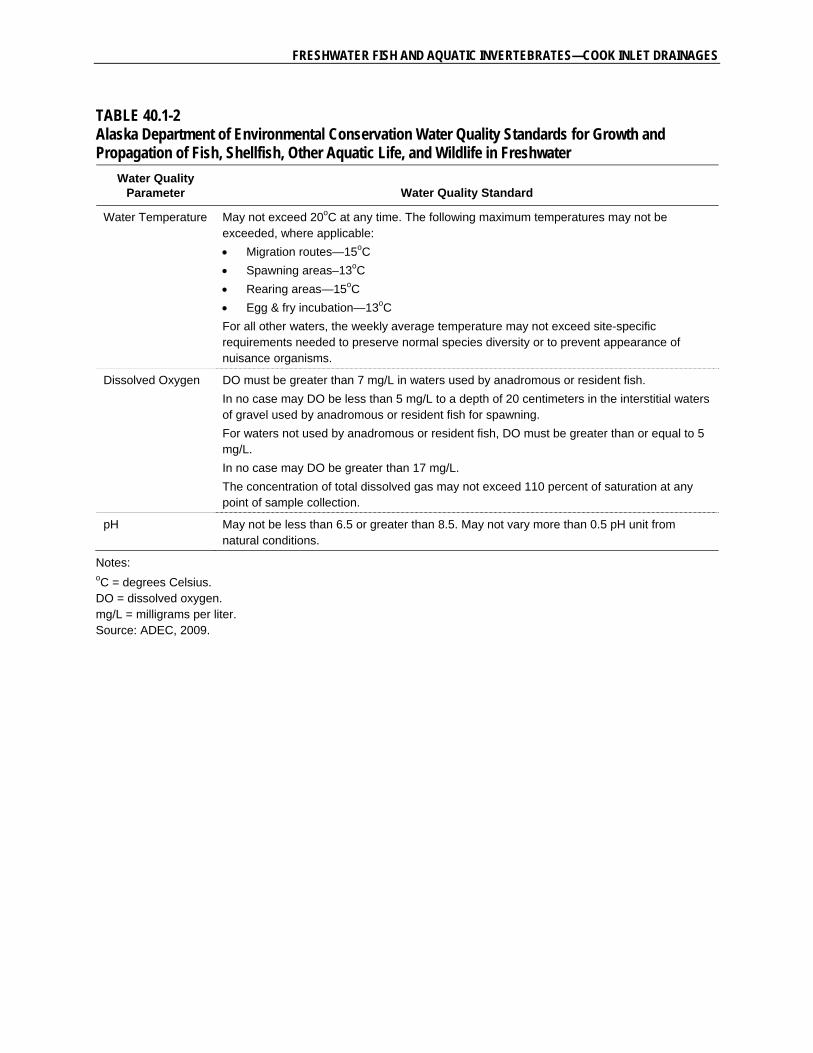
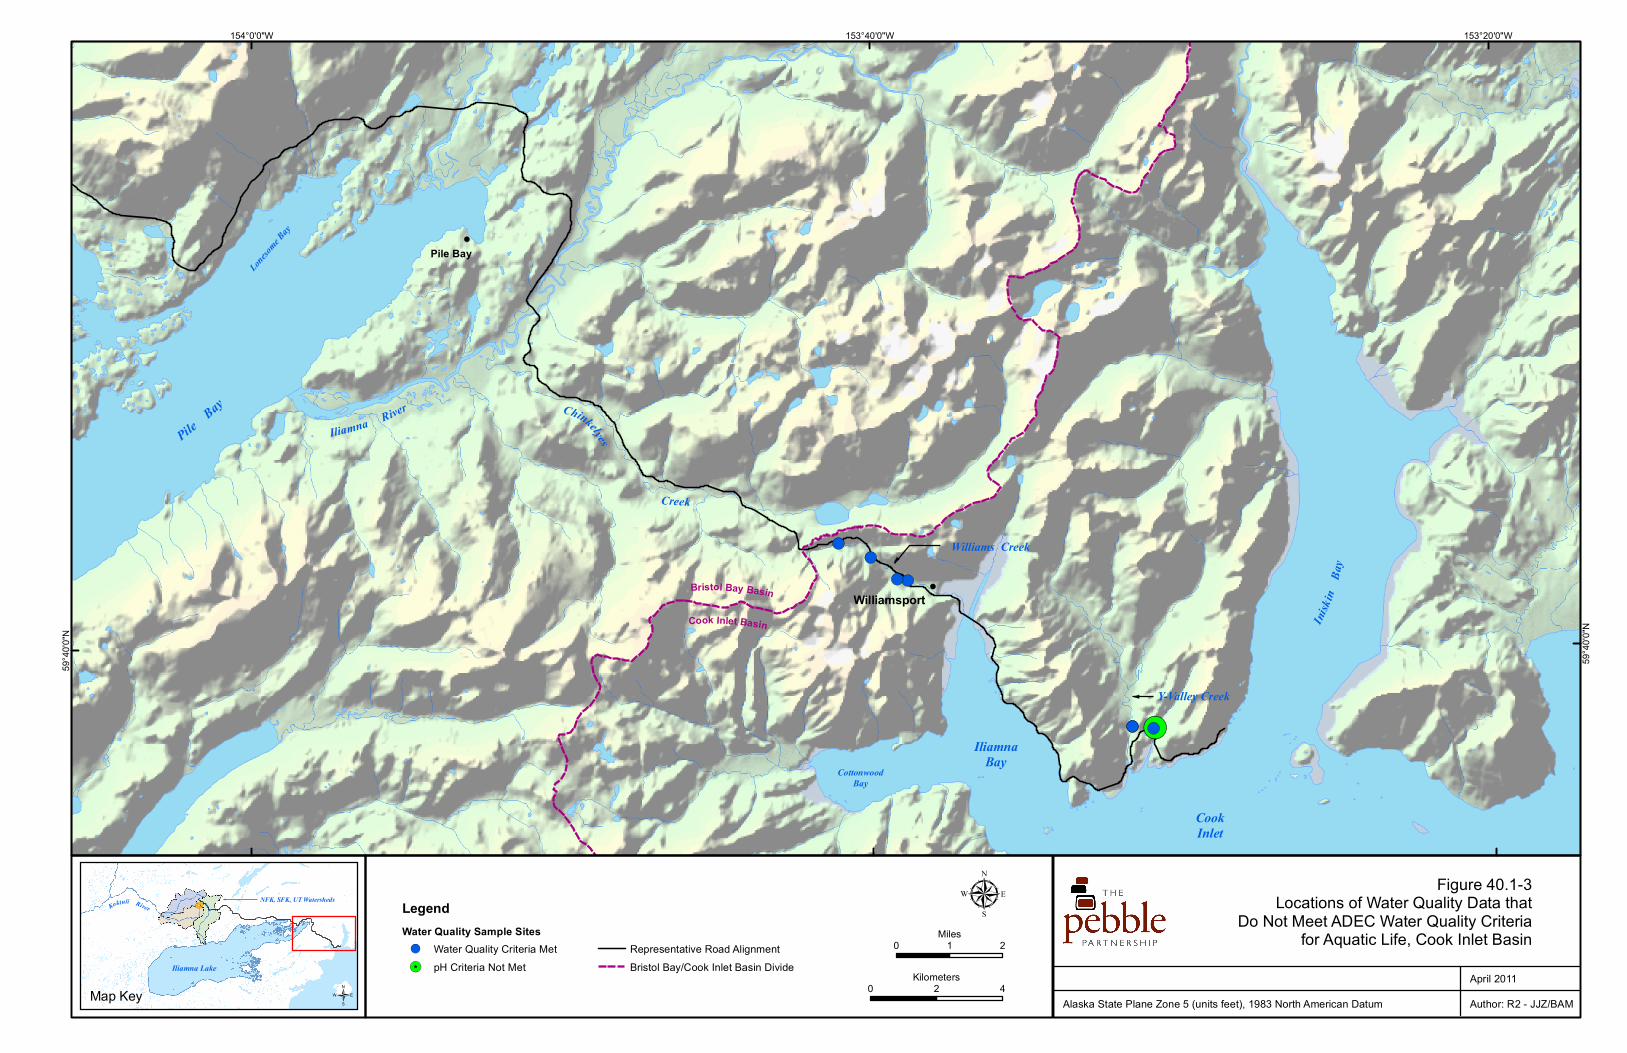
Several water quality parameters that impact aquatic life were measured during the aquatic habitat assessment, including field measurements of surface water temperature, pH, dissolved oxygen (DO), and specific conductivity. Alaska Department of Environmental Conservation (ADEC) standards for the growth and propagation of fish, shellfish, other aquatic life, and wildlife (ADEC water quality standards for aquatic life) were compared to parameters that were measured during the 2004 through 2008 studies as provided in Table 40.1-2 (ADEC, 2009).
40.1.5.3 Fish Distribution Studies
The main survey method for assessing the presence and relative abundance of stream-dwelling fish was via direct underwater observation using snorkeling. Other methods, such as electrofishing and minnow trapping, were used when sampling conditions were not conducive to snorkeling, e.g., in deep, fast, or turbid water. Various fish sampling techniques applied during the fish studies are shown in Photo 40.1-2. To the extent possible, all fish observed and/or captured were identified to species. Fork length was estimated or measured for observed and captured fish, respectively.
40.1.6 Results and Discussion
During the study period, six primary survey sites and two support survey sites were surveyed (Table 40.1-1). To facilitate the characterization of these survey sties, we have grouped survey sites into the following three watersheds: Williams Creek, Y-Valley Creek, and an unnamed tributary in Iniskin Bay, hereinafter referred to as Iniskin Bay T1 (Figure 40.1-2; Table 40.1-1). Watershed descriptions and results specific to each of these watersheds are provided in the sections that follow.
40.1.6.1 Williams Creek Watershed
The representative road alignment crosses the Williams Creek watershed. Four primary survey sites and one support survey site were identified and surveyed along the representative road alignment within the Williams Creek watershed from 2004 through 2008. All of these sites were located on the Williams Creek mainstem. One primary survey site (site K 76.75) was dry when visited in early September 2004. No additional data were collected at this location.
Williams Creek is one of the major watersheds in the Cook Inlet transportation corridor study area. From its headwaters, located in the Chigmit Mountains, the stream flows northward down a steep slope, then southeasterly through a confined valley for about 3.7 miles (6 kilometers) where it enters Iliamna Bay (Figure 40.1-2). The highest elevation in the Williams Creek watershed is an unnamed mountain to the south (elevation 3,464 feet [1,056 meters]); the lowest elevation is at the stream outlet to Iliamna Bay. The watershed is bounded by steep, unnamed mountains to the north and south. The main channel of Williams Creek is confined to the north by an existing gravel road. A few structures and shipping containers have been stored along the road near the mouth of the creek.
FRESHWATER FISH AND AQUATIC INVERTEBRATES—COOK INLET DRAINAGES
40.1-5 06/27/2011
Channel Morphology
Channel morphology data collected at the Williams Creek primary survey sites indicated that the stream channels in this watershed were very steep, with stream gradients ranging from 5 to 12.5 percent (Table 40.1-3). The stream channel was relatively wide and shallow, as indicated by mean bankfull widths that ranged from approximately 21 to 40.7 feet (6.4 to 12.4 meters), and water depths that ranged of approximately 1.6 feet (0.5 meters). Channel morphology at the one support survey site (K 77.25) was largely similar to the channel morphology of the primary survey sites (Appendix 40.1B).
Aquatic Habitat
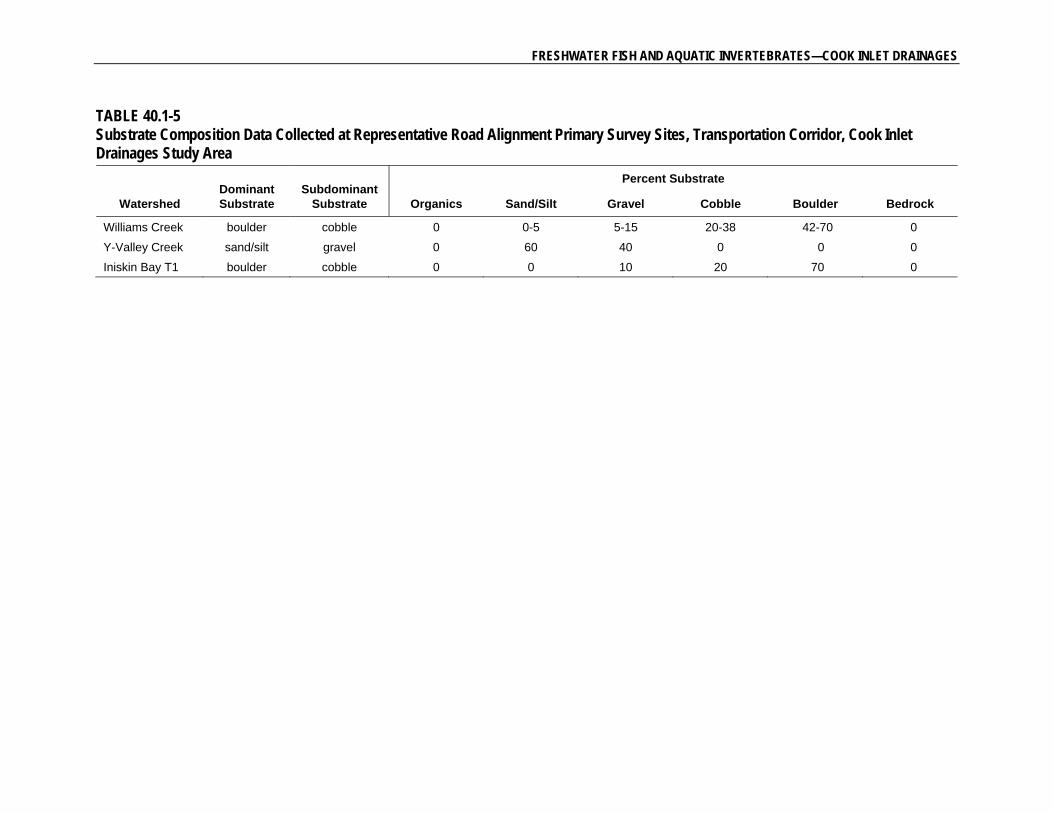
Consistent with the high-gradient channel of Williams Creek, the primary survey sites in this watershed were dominated by cascade habitat (95.8 percent of the total wetted area surveyed; Table 40.1-4). There was a small amount of riffle habitat at the Williams Creek primary survey site MP_75.0. Bed materials were consistent with high energy channels, with 42 to 70 percent boulders and 20 to 38 percent cobbles documented at the primary survey sites (Table 40.1-5). Overhanging vegetation and large woody debris were absent from the primary survey sites. No beaver activity seeps, or springs were observed at the primary survey sites within these watersheds. Aquatic habitat at support survey site K 77.25 was different in that it was composed of scour pools and riffles (50 percent each; Appendix 40.1B).
As mentioned above, primary survey site K 76.75 was completely dry when visited in September 2004. In addition, data collected at support survey site K 77.25 (located downstream of site K 76.75 and upstream of site MP_75.8) in August 2004 indicated that surface flow also was absent approximately 492 feet (150 meters) downstream of the sampling location. In 2008, flow was high and fast in Williams Creek. Flow data from surface hydrology studies (Chapter 7) in the Pebble Deposit study area indicate that 2004 was a low-flow year, whereas flows in 2008 were high. When taken together with the habitat data, pictures emerge of Williams Creek as a hydrologically flashy, high-energy system driven primarily by surface runoff at the representative road alignment stream crossing locations.
Water Quality
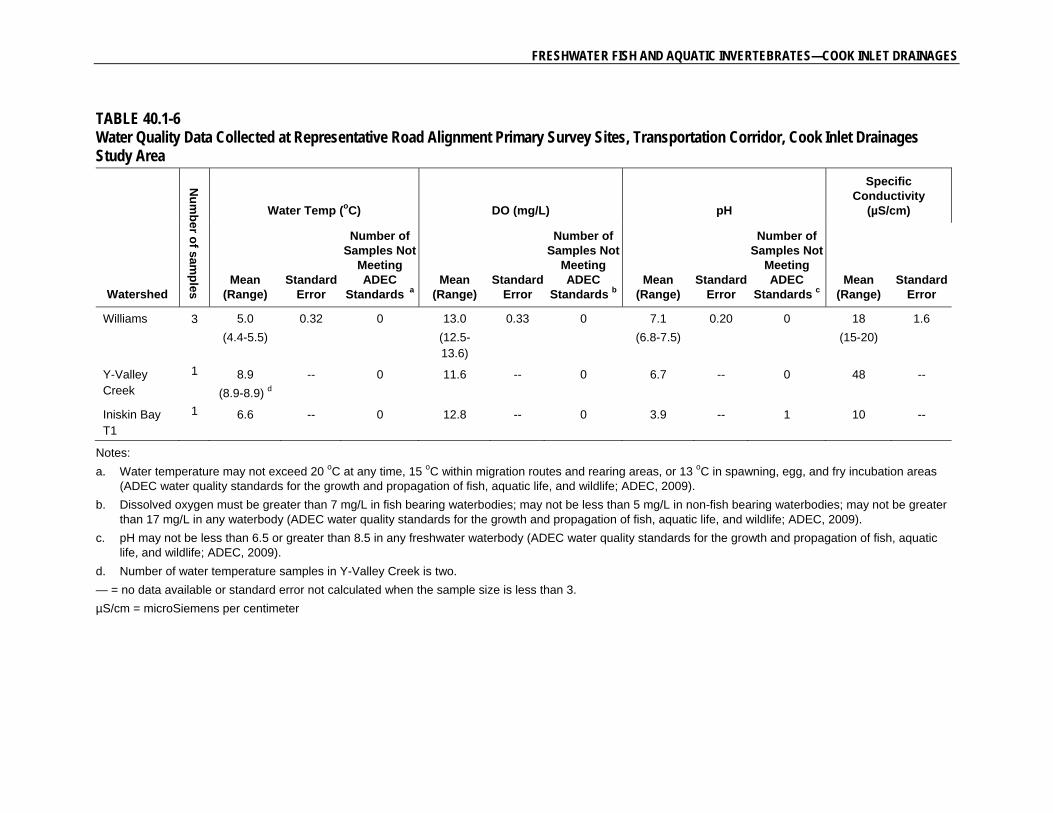
Water quality was measured at three wetted primary survey sites and the one support survey site within the Williams Creek watershed. Data collected at the primary survey sites are summarized in Table 40.1-6. Water temperatures were seasonably cool, with a mean water temperature of 41 to 48 degrees Fahrenheit (°F; 5.0 degrees Celsius [°C]). Saturated DO levels were observed at all sites, with measurements ranging from 12.5 to 13.6 milligrams per liter (mg/L). The pH was neutral at all sites (6.8 to 7.5), and specific conductivity was low (15 to 20 microSiemens per centimeter [µS/cm]). Water quality conditions at support survey site K 77.25 were similar to primary survey site conditions, with the exception of a slightly warmer water temperature (51.1 °F [10.6 °C]; Appendix 40.1B). All water quality measurements recorded at the Williams Creek primary and support survey sites were within the ADEC water quality standards for aquatic life (Figure 40.1-3).
Fish Resources
Among the primary and support survey sites in the Williams Creek watershed, the only site where fish were observed was at support survey site K 77.25 (Table 40.1-7). Nine Dolly Varden (Salvelinus malma) juveniles and adults were documented at this survey site (Appendix 40.1B). Three of the four primary
PEBBLE PROJECT, ENVIRONMENTAL BASELINE DOCUMENT, 2004 THROUGH 2008
40.1-6 06/27/2011
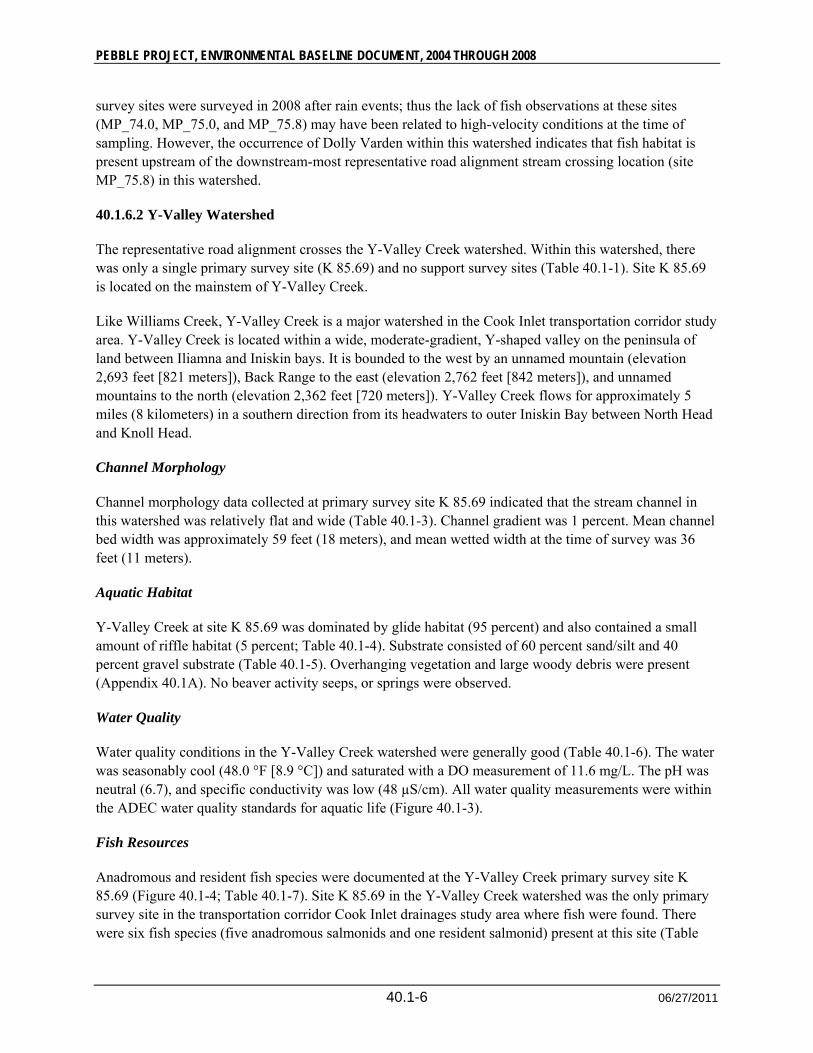
survey sites were surveyed in 2008 after rain events; thus the lack of fish observations at these sites (MP_74.0, MP_75.0, and MP_75.8) may have been related to high-velocity conditions at the time of sampling. However, the occurrence of Dolly Varden within this watershed indicates that fish habitat is present upstream of the downstream-most representative road alignment stream crossing location (site MP_75.8) in this watershed.
40.1.6.2 Y-Valley Watershed
The representative road alignment crosses the Y-Valley Creek watershed. Within this watershed, there was only a single primary survey site (K 85.69) and no support survey sites (Table 40.1-1). Site K 85.69 is located on the mainstem of Y-Valley Creek.
Like Williams Creek, Y-Valley Creek is a major watershed in the Cook Inlet transportation corridor study area. Y-Valley Creek is located within a wide, moderate-gradient, Y-shaped valley on the peninsula of land between Iliamna and Iniskin bays. It is bounded to the west by an unnamed mountain (elevation 2,693 feet [821 meters]), Back Range to the east (elevation 2,762 feet [842 meters]), and unnamed mountains to the north (elevation 2,362 feet [720 meters]). Y-Valley Creek flows for approximately 5 miles (8 kilometers) in a southern direction from its headwaters to outer Iniskin Bay between North Head and Knoll Head.
Channel Morphology
Channel morphology data collected at primary survey site K 85.69 indicated that the stream channel in this watershed was relatively flat and wide (Table 40.1-3). Channel gradient was 1 percent. Mean channel bed width was approximately 59 feet (18 meters), and mean wetted width at the time of survey was 36 feet (11 meters).
Aquatic Habitat
Y-Valley Creek at site K 85.69 was dominated by glide habitat (95 percent) and also contained a small amount of riffle habitat (5 percent; Table 40.1-4). Substrate consisted of 60 percent sand/silt and 40 percent gravel substrate (Table 40.1-5). Overhanging vegetation and large woody debris were present (Appendix 40.1A). No beaver activity seeps, or springs were observed.
Water Quality
Water quality conditions in the Y-Valley Creek watershed were generally good (Table 40.1-6). The water was seasonably cool (48.0 °F [8.9 °C]) and saturated with a DO measurement of 11.6 mg/L. The pH was neutral (6.7), and specific conductivity was low (48 µS/cm). All water quality measurements were within the ADEC water quality standards for aquatic life (Figure 40.1-3).
Fish Resources
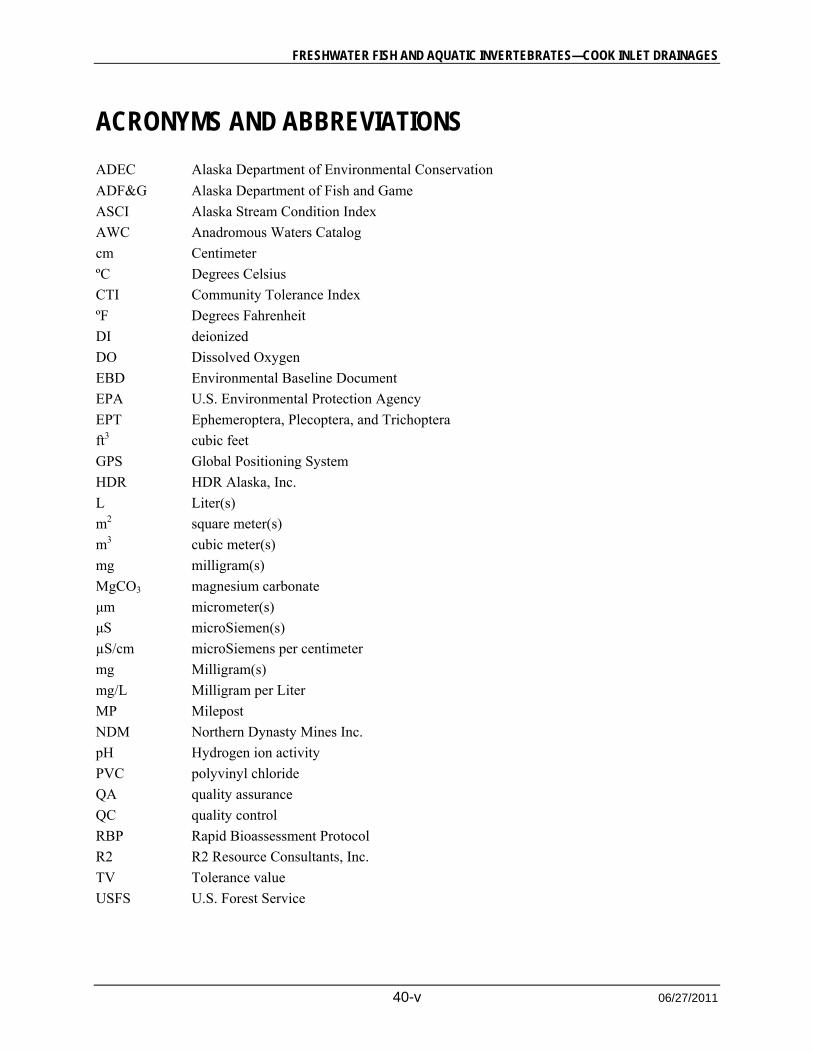
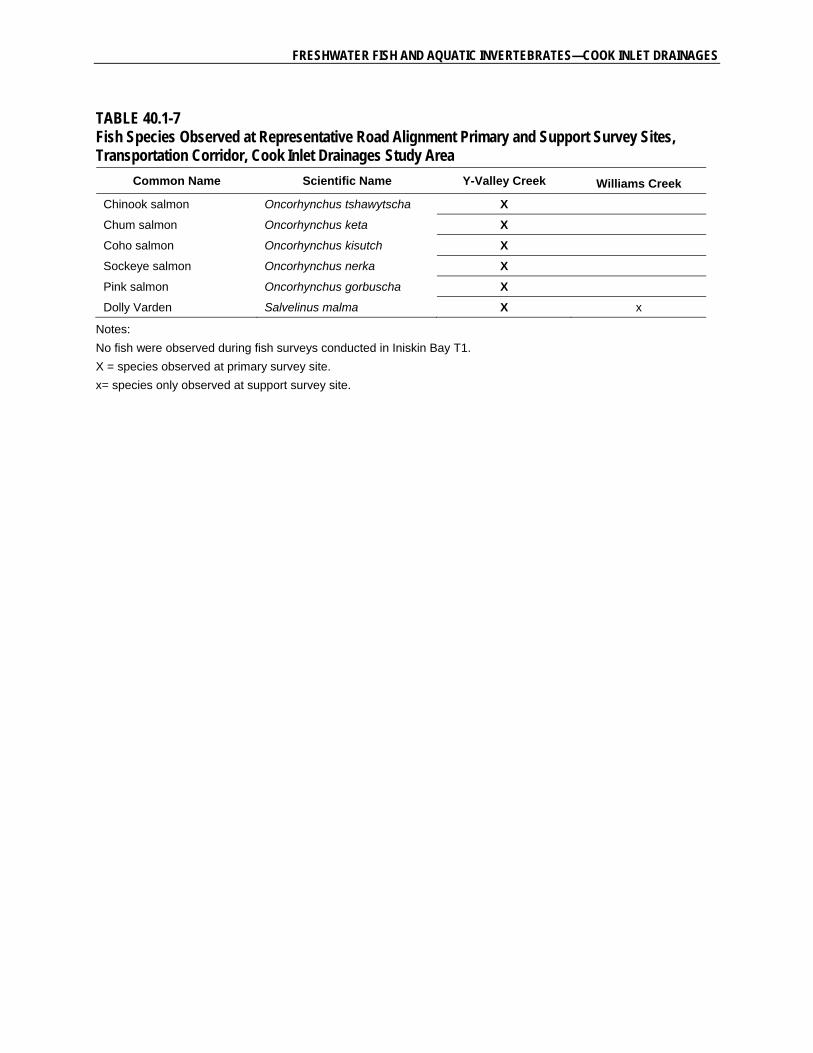
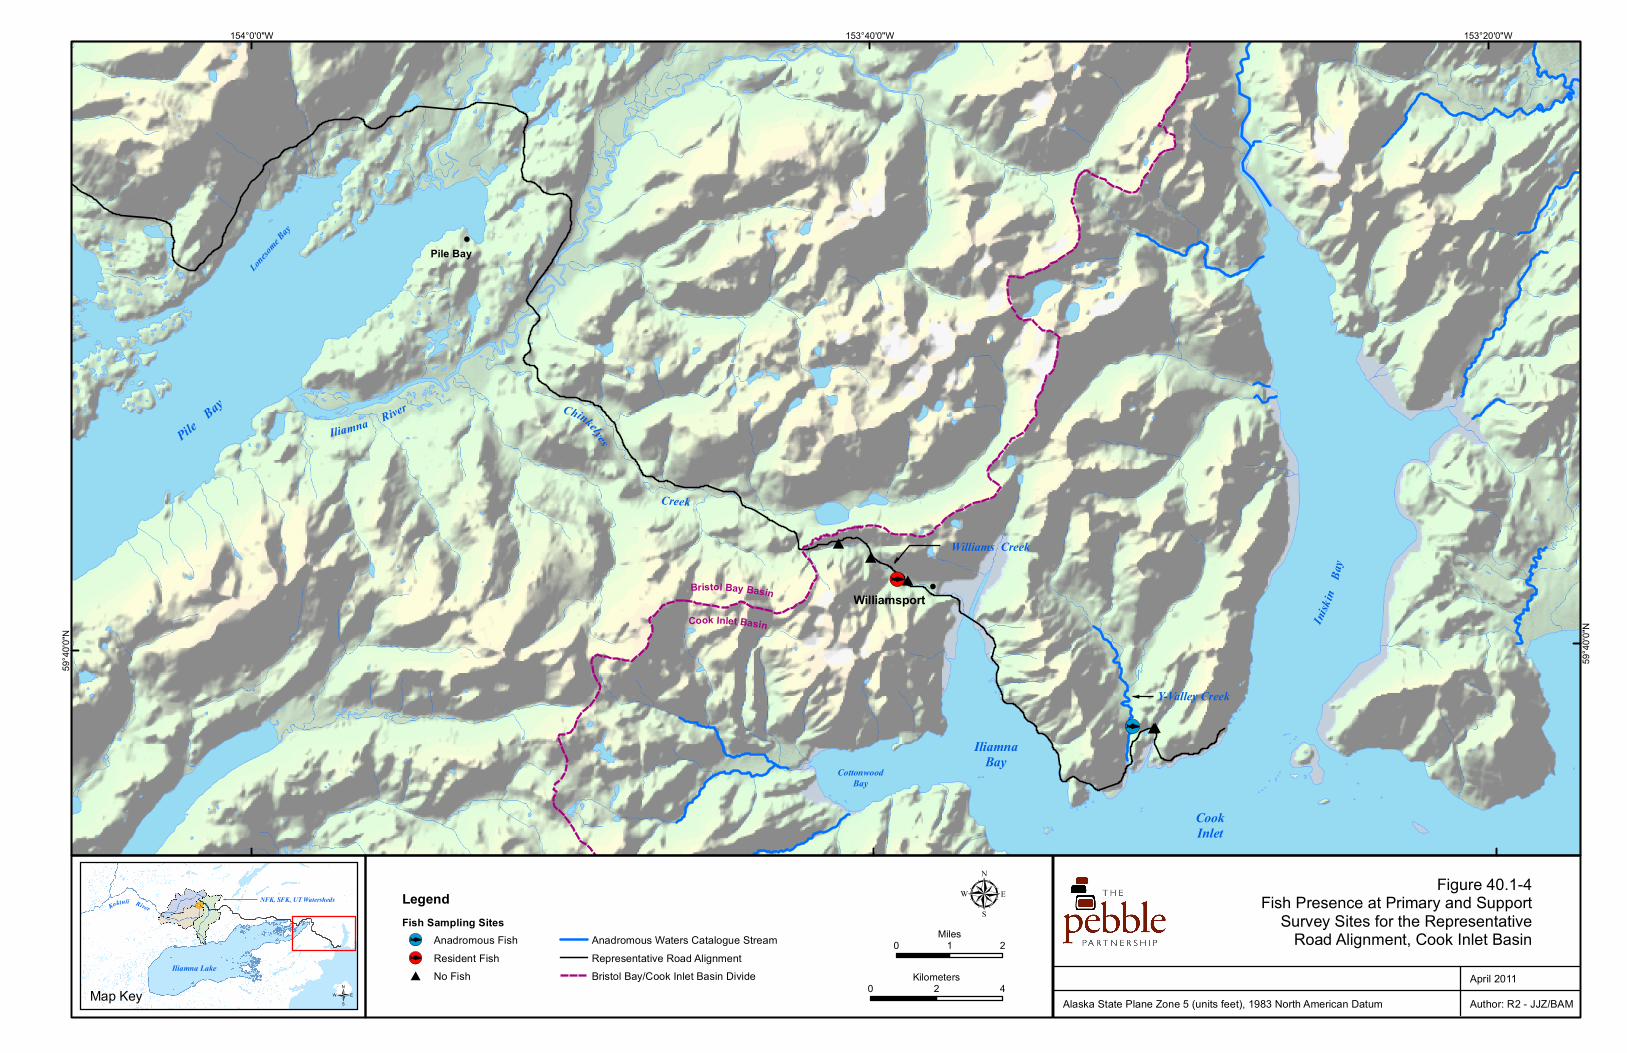
Anadromous and resident fish species were documented at the Y-Valley Creek primary survey site K 85.69 (Figure 40.1-4; Table 40.1-7). Site K 85.69 in the Y-Valley Creek watershed was the only primary survey site in the transportation corridor Cook Inlet drainages study area where fish were found. There were six fish species (five anadromous salmonids and one resident salmonid) present at this site (Table

FRESHWATER FISH AND AQUATIC INVERTEBRATES—COOK INLET DRAINAGES
40.1-7 06/27/2011
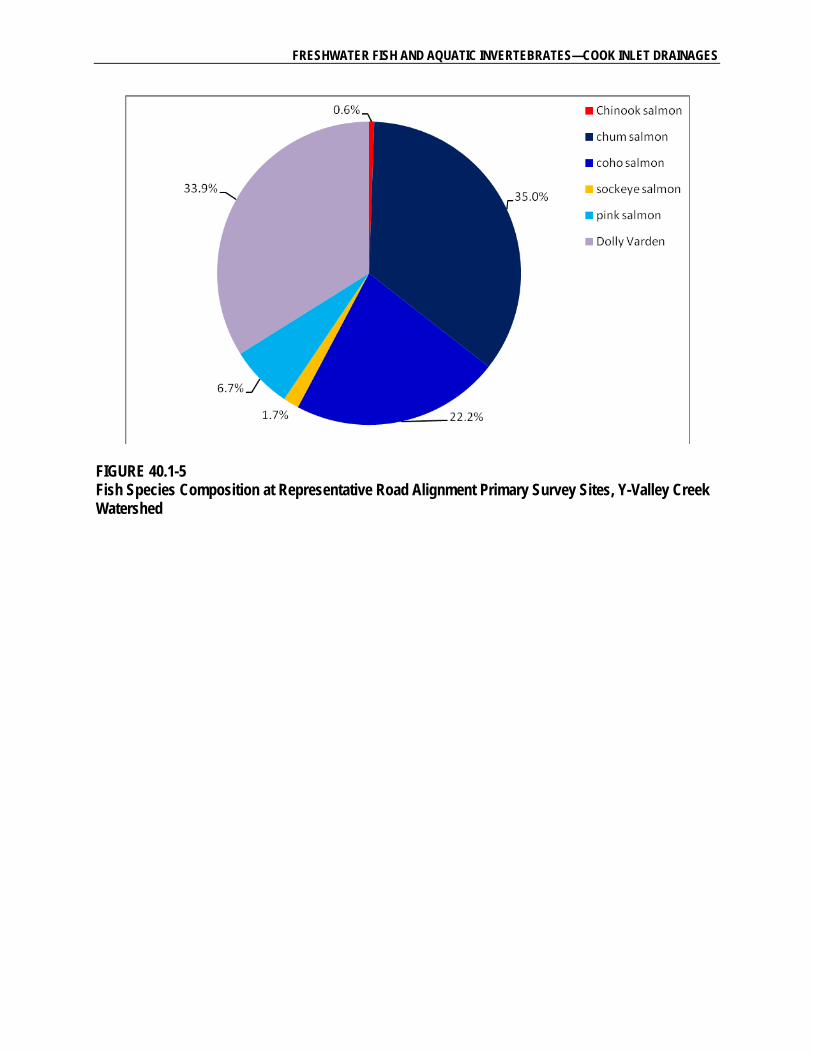
40.1-7). Chum salmon (Oncorhynchus keta) and Dolly Varden were the predominant species observed in Y-Valley Creek, accounting for 35 and 34 percent of all fish documented, respectively (Figure 40.1-5). Coho salmon (O. kisutch) were the next most abundant at 22 percent, with the other three species (Chinook, sockeye, and pink salmon [O. tshawytscha, O. nerka, and O. gorbuscha, respectively]) comprising the other 9 percent of observations.
Dolly Varden was the only species with both juvenile and adult life stages present. Adult chum, pink, and sockeye salmon were present, indicating spawning habitat is available in Y-Valley Creek. Given that sampling occurred in late summer, juveniles of these anadromous species would not be expected to be present in freshwater. Juvenile coho and Chinook salmon were present, but no adults were seen, as would be expected since sampling was outside the spawning window for these two species. Although not evident from this sampling, the Anadromous Waters Catalogue (AWC) indicates that Arctic char (S. alpines) are present in Y-Valley Creek (ADF&G, 2010).
40.1.6.3 Iniskin Bay T1 Watershed
The representative road alignment crosses the Iniskin Bay T1 watershed. Within this watershed, one primary survey site (MP_83.9) and one support survey site (K-G 86.13) were identified and surveyed along the representative road alignment from 2004 through 2008 (Table 40.1-1). Both of these sites were located on the mainstem of Iniskin Bay T1.
Iniskin Bay T1 is a small watershed that drains the southwest end of Back Range (elevation 2,693 feet [821 meters]). This tributary flows for less than 1.2 miles (2 kilometers) in a south-southwesterly direction through a forested area and discharges into outer Iniskin Bay just east of Y-Valley Creek and west of Knoll Head. In 2008, flow was high and fast in Iniskin Bay T1.
Channel Morphology
Similar to Williams Creek, Iniskin Bay T1 is characterized by a steep, wide, and shallow channel (Table 40.1-3). At the one Iniskin Bay T1 primary survey site (MP_83.9) the stream gradient was 7.0 percent. The mean bankfull and bed widths were 22.1 feet (6.75 meters), and the wetted width at the time of survey (September 2008) was 21.3 feet (6.5 meters). Water depth was 2.3 feet (0.7 meters). Channel morphology at support survey site K-G 86.13 was largely similar to the channel morphology of primary survey site MP_83.9 (Appendix 40.1B).
Aquatic Habitat
Aquatic habitat at Iniskin Bay T1 site MP_83.9 was dominated by cascade habitat (95.8 percent) and also contained a small amount of riffle habitat (4.2 percent; Table 40.1-4). Bed materials were consistent with high energy channels, with 70 percent boulder, 20 percent cobble, and 10 percent gravel (Table 40.1-5). Overhanging vegetation and large woody debris were absent, and no beaver activity seeps, or springs were observed at the primary survey site. Aquatic habitat at support survey site K-G 86.13 was somewhat different in that it was composed of scour pools and riffles (50 percent each) and had a more even distribution of gravel, cobble, and boulder substrates (30 to 40 percent each; Appendix 40.1B).
In 2008, flow was high and fast in Iniskin Bay T1. Flow data from surface hydrology studies (Chapter 7) in the Pebble Deposit study area indicate that flows in 2008 were high. When taken together with the
PEBBLE PROJECT, ENVIRONMENTAL BASELINE DOCUMENT, 2004 THROUGH 2008
40.1-8 06/27/2011
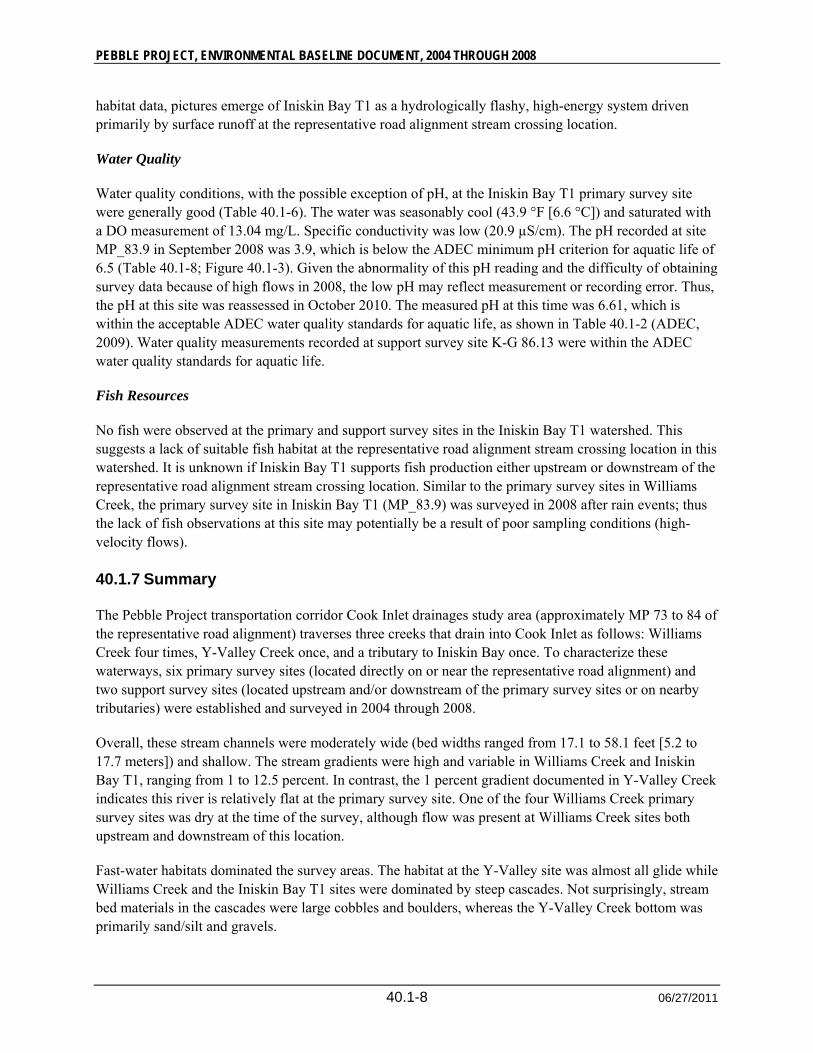
habitat data, pictures emerge of Iniskin Bay T1 as a hydrologically flashy, high-energy system driven primarily by surface runoff at the representative road alignment stream crossing location.
Water Quality
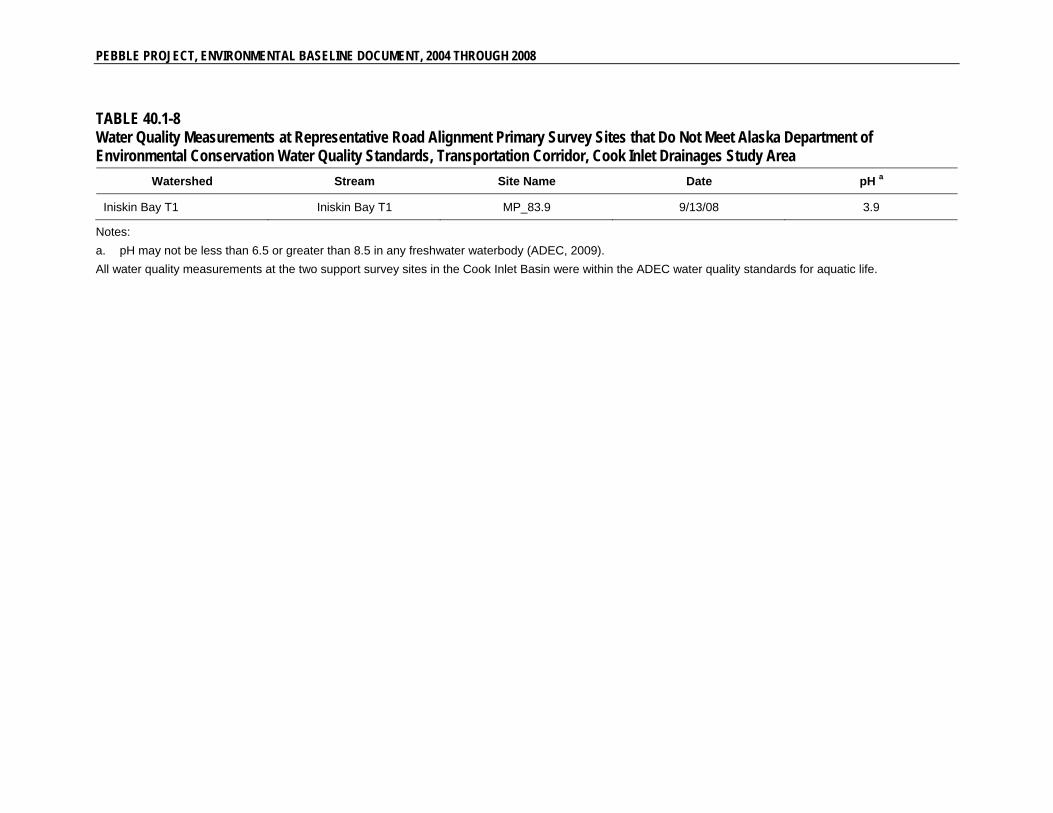
Water quality conditions, with the possible exception of pH, at the Iniskin Bay T1 primary survey site were generally good (Table 40.1-6). The water was seasonably cool (43.9 °F [6.6 °C]) and saturated with a DO measurement of 13.04 mg/L. Specific conductivity was low (20.9 µS/cm). The pH recorded at site MP_83.9 in September 2008 was 3.9, which is below the ADEC minimum pH criterion for aquatic life of 6.5 (Table 40.1-8; Figure 40.1-3). Given the abnormality of this pH reading and the difficulty of obtaining survey data because of high flows in 2008, the low pH may reflect measurement or recording error. Thus, the pH at this site was reassessed in October 2010. The measured pH at this time was 6.61, which is within the acceptable ADEC water quality standards for aquatic life, as shown in Table 40.1-2 (ADEC, 2009). Water quality measurements recorded at support survey site K-G 86.13 were within the ADEC water quality standards for aquatic life.
Fish Resources
No fish were observed at the primary and support survey sites in the Iniskin Bay T1 watershed. This suggests a lack of suitable fish habitat at the representative road alignment stream crossing location in this watershed. It is unknown if Iniskin Bay T1 supports fish production either upstream or downstream of the representative road alignment stream crossing location. Similar to the primary survey sites in Williams Creek, the primary survey site in Iniskin Bay T1 (MP_83.9) was surveyed in 2008 after rain events; thus the lack of fish observations at this site may potentially be a result of poor sampling conditions (high-velocity flows).
40.1.7 Summary
The Pebble Project transportation corridor Cook Inlet drainages study area (approximately MP 73 to 84 of the representative road alignment) traverses three creeks that drain into Cook Inlet as follows: Williams Creek four times, Y-Valley Creek once, and a tributary to Iniskin Bay once. To characterize these waterways, six primary survey sites (located directly on or near the representative road alignment) and two support survey sites (located upstream and/or downstream of the primary survey sites or on nearby tributaries) were established and surveyed in 2004 through 2008.
Overall, these stream channels were moderately wide (bed widths ranged from 17.1 to 58.1 feet [5.2 to 17.7 meters]) and shallow. The stream gradients were high and variable in Williams Creek and Iniskin Bay T1, ranging from 1 to 12.5 percent. In contrast, the 1 percent gradient documented in Y-Valley Creek indicates this river is relatively flat at the primary survey site. One of the four Williams Creek primary survey sites was dry at the time of the survey, although flow was present at Williams Creek sites both upstream and downstream of this location.
Fast-water habitats dominated the survey areas. The habitat at the Y-Valley site was almost all glide while Williams Creek and the Iniskin Bay T1 sites were dominated by steep cascades. Not surprisingly, stream bed materials in the cascades were large cobbles and boulders, whereas the Y-Valley Creek bottom was primarily sand/silt and gravels.
FRESHWATER FISH AND AQUATIC INVERTEBRATES—COOK INLET DRAINAGES
40.1-9 06/27/2011
Water quality was generally good with seasonable stream temperatures, saturated levels of DO, and generally neutral pH documented. Conductivity of the water was low and similar to other transportation corridor survey sites in the Bristol Bay Basin.
Fish presence was documented only in Y-Valley Creek and in one supporting site in the Williams Creek watershed. In Y-Valley Creek, fish observations included: adult chum, pink, and sockeye salmon, juvenile coho and Chinook salmon, and both adult and juvenile Dolly Varden. Although not observed during sampling, the AWC indicates that Arctic char are also present in Y-Valley Creek (ADF&G, 2010). In Williams Creek, juvenile and adult Dolly Varden were observed. No fish were found at the Williams Creek primary survey sites or at the Iniskin Bay T1 primary and support survey sites, although this may potentially be the result of high-flow conditions.
Y-Valley Creek, as well as several tributaries to Iliamna and Iniskin bays, are known to support spawning pink salmon with adults entering the streams in July and August (Chapter 43). During nearshore sampling of outer Iniskin Bay, the area between North Head and Knoll Head had the highest catch rates of Dolly Varden and juvenile pink salmon, as well as the highest proportion of adult Dolly Varden observed. This suggests that Y-Valley Creek provides valuable spawning habitat for pink salmon and natal and overwintering habitat for Dolly Varden.
Nearshore studies indicated that intertidal lagoons and the nearshore areas of Iliamna and Iniskin bays were used extensively by juvenile pink, chum, and sockeye salmon during the spring and summer outmigration period. This period generally began in April, peaked from May through June, and dropped off sharply in August (Chapter 43). Few juvenile salmonids were found in September, and none were found in October. The chum salmon outmigration period is relatively short, beginning in April, peaking in May, and dropping off in June and July; catch rates indicated that chum salmon had a preference for Iliamna Bay over Iniskin Bay. The pink salmon outmigration period began in April, peaked between May and July, and dropped off through August; pink salmon were significantly more abundant in Iniskin Bay. The difference between pink and chum salmon preference for Iliamna Bay versus Iniskin Bay may be related to the location of major spawning streams for each species.
Other salmonids were also present in nearshore areas. Sockeye salmon juveniles were captured during nearshore studies in smaller numbers than pink and chum salmon. A few sockeye salmon were captured in May, moderate numbers in June and July, and less than 1 fish per set in August. Higher catch rates were observed in Iniskin Bay (Chapter 43, Figure 43-10). Very few juvenile coho or Chinook salmon were observed in Iliamna or Iniskin bay during nearshore studies. More than 80 percent of the coho salmon observations were located near the mouth of Y-Valley Creek. Anadromous Dolly Varden were present in tributaries to the Iliamna and Iniskin bays. Most of these fish migrate from their natal streams annually, inhabit the nearshore environment during the spring and summer months, and migrate back to the streams in late summer. Numerous large adult Dolly Varden were observed near the mouth of Y-Valley Creek during nearshore surveys conducted in 2008. During data collection for other studies, adult chum and pink salmon were observed in lower Williams Creek.
Several fish species that move between freshwater and saltwater habitats, such as Pacific staghorn sculpin (Leptocottus armatus), starry flounder (Platichthys stellatus), and longfin smelt (Spirinchus thaleichthys), were captured in inner Iliamna Bay during nearshore studies (Chapter 43). Threespine stickleback (Gasterosteus aculeatus) were captured in an intertidal lagoon located in Iliamna Bay near AC Point. In November 2008, ninespine stickleback (Pungitius pungitius), primarily a freshwater species, was one of
PEBBLE PROJECT, ENVIRONMENTAL BASELINE DOCUMENT, 2004 THROUGH 2008
40.1-10 06/27/2011
the most abundant species taken in marine waters near Williamsport. These fish probably spend the majority of the year in flowing water and side channels of lower Williams Creek.
40.1.8 References
Alaska Department of Environmental Conservation (ADEC). 2009. Water Quality Standards. Alaska Administrative Code. Title 18, Chapter 70. June 26.
Alaska Department of Fish and Game (ADF&G). 2010. Anadromous Waters Catalogue.
U.S. Forest Service (USFS). 2001. FSH 2090-Aquatic Habitat Management Handbook, R-10 Amendment 2090.21-2001-1. Chapter 20, Fish and Aquatic Stream Habitat Survey. U.S. Department of Agriculture, U.S. Forest Service.
40.1.9 Glossary
Anadromous—Fish species that reside in marine waters but migrate into freshwater for spawning and rearing of early life history stages.
Bankfull width—A measure of the width of the wetted channel at the height of bankfull discharge. It is measured as the horizontal distance, perpendicular to the deepest part of the channel, between corresponding bankfull height locations on opposite channel banks.
Bed width—Channel bed width is independent of the current water level, and equates to the distance between the bottom of the left bank and bottom of the right bank.
Baseline—For this report; baseline represents the pre-development watershed situation, including physical, chemical and biological conditions, between 2004 and 2008.
Channel morphology—The form or shape of a stream channel, including the contours of its bed.
Ephemeral Stream—Stream with temporary surface water flow.
Flashy—A flashy stream is one that exhibits significantly increased flows immediately following the onset of a precipitation event and a rapid return to pre-rain conditions shortly after the end of the precipitation. That is to say, water that precipitates within a flashy stream's watershed will make its way quickly from the land into the stream and be flushed through the system rapidly.
Gradient—Channel gradient is the change in water surface elevation between end points of a channel segment.
Intermittent stream—Stream with periodic surface water flows.
Mean—The average value.
Resident fishes—Fish that reside its entire life cycle in the local freshwater stream network.
Salmonid—Fishes belonging to the Family Salmonidae.
FRESHWATER FISH AND AQUATIC INVERTEBRATES—COOK INLET DRAINAGES
40.1-11 06/27/2011
Seep—A wet place where a liquid, usually groundwater, oozes from the ground to the surface. Seeps are usually not flowing.
Spring—Any natural occurrence where water flows to the surface of the earth from below the surface. Thus, a spring is where the aquifer surface meets the ground surface. Springs usually have a flow rate associated with their surface water discharge.
Substrate—Materials that make up the stream bed, categories include organic material, silt, sand, gravels, cobbles, boulders, and bedrock.

FRESHWATER FISH AND AQUATIC INVERTEBRATES—COOK INLET DRAINAGES
TABLES
FRESHWATER FISH AND AQUATIC INVERTEBRATES—COOK INLET DRAINAGES
TABLE 40.1-1 Watershed Affiliation of Survey Sites along the Representative Road Alignment in the Transportation Corridor, Cook Inlet Drainages Study Area
Watershed a Stream a Primary Site
Name
Associated Milepost
(MP) b Support Survey Sites c
Williams Creek Williams Creek MP_74.0 74.0
MP_75.0 75.0
K 76.75 75.2 K 77.25
MP_75.8 75.8
Y-Valley Creek Y-Valley Creek K 85.69 82.9
Iniskin Bay T1 Iniskin Bay T1 MP_83.9 83.9 K-G 86.13
Note:
a. T = tributary. This notation is used to denote unnamed tributaries to a specified stream (e.g., Iniskin Bay T1 is an unnamed tributary to Iniskin Bay.
b. Milepost (MP), in miles, represents the distance along the representative road alignment between the representative road alignment’s western terminus at the edge of the Pebble Deposit and the primary survey site location.
c. Support survey sites are located on the same stream as the primary survey site or on a nearby tributary.
FRESHWATER FISH AND AQUATIC INVERTEBRATES—COOK INLET DRAINAGES
TABLE 40.1-2 Alaska Department of Environmental Conservation Water Quality Standards for Growth and Propagation of Fish, Shellfish, Other Aquatic Life, and Wildlife in Freshwater
Water Quality Parameter Water Quality Standard
Water Temperature May not exceed 20oC at any time. The following maximum temperatures may not be exceeded, where applicable:
Migration routes—15oC
Spawning areas–13oC
Rearing areas—15oC
Egg & fry incubation—13oC
For all other waters, the weekly average temperature may not exceed site-specific requirements needed to preserve normal species diversity or to prevent appearance of nuisance organisms.
Dissolved Oxygen DO must be greater than 7 mg/L in waters used by anadromous or resident fish.
In no case may DO be less than 5 mg/L to a depth of 20 centimeters in the interstitial waters of gravel used by anadromous or resident fish for spawning.
For waters not used by anadromous or resident fish, DO must be greater than or equal to 5 mg/L.
In no case may DO be greater than 17 mg/L.
The concentration of total dissolved gas may not exceed 110 percent of saturation at any point of sample collection.
pH May not be less than 6.5 or greater than 8.5. May not vary more than 0.5 pH unit from natural conditions.
Notes: oC = degrees Celsius. DO = dissolved oxygen. mg/L = milligrams per liter. Source: ADEC, 2009.
FRESHWATER FISH AND AQUATIC INVERTEBRATES—COOK INLET DRAINAGES
TABLE 40.1-3 Channel Morphology Data Collected at Representative Road Alignment Primary Survey Sites, Transportation Corridor, Cook Inlet Drainages Study Area
Watershed
Gradient (percent)
Mean Bankfull Width (meters)
Mean Bed Width (meters)
Mean Wetted Width (meters)
Mean Water Depth (meters)
Mean (Range)
Standard Error
Mean (Range)
Standard Error
Mean (Range)
Standard Error
Mean (Range)
Standard Error
Mean (Range)
Standard Error
Williams Creek 7.8
(5-12.5) 2.35
9.10
(6.4-12.4) 1.76
7.03
(5.2-10.1) 1.54
7.43
(5.6-10.9) 1.73
0.48
(0.45-0.5) 0.02
Y-Valley Creek a 1.0 — — — 17.7 — 11.00 — — —
Iniskin Bay T1 a 7.0 — 6.75 — 6.75 — 6.50 — 0.70 —
Note:
a. No ranges are reported since there was only a single primary survey site in this watershed.
— = indicates no data available or standard error not calculated when the sample size is less than 3.
TABLE 40.1-4 Habitat Composition Data Collected at Representative Road Alignment Primary Survey Sites, Transportation Corridor, Cook Inlet Drainages Study Area
Watershed
Total Survey
Length (m)
Dry/ Subsurface
(% survey length) a
Total Wetted Surface
Area (m2)
Habitat Composition (% wetted surface area)
Beaver Pond b
Backwater Pool Scour Pool Glide Riffle Cascade
Williams Creek 600 0 3,842 0 0 0 0 4.2 95.8
Y-Valley Creek 680 0 7,480 0 0 0 95 5 0
Iniskin Bay T1 200 0 1,333 0 0 0 0 0 100
Notes:
a. Only applies to dry and subsurface habitat types measured within intermittent streams in 2008.
b. Beaver pond habitat type applies to 2008 data only.
FRESHWATER FISH AND AQUATIC INVERTEBRATES—COOK INLET DRAINAGES
TABLE 40.1-5 Substrate Composition Data Collected at Representative Road Alignment Primary Survey Sites, Transportation Corridor, Cook Inlet Drainages Study Area
Watershed Dominant Substrate
Subdominant Substrate
Percent Substrate
Organics Sand/Silt Gravel Cobble Boulder Bedrock
Williams Creek boulder cobble 0 0-5 5-15 20-38 42-70 0
Y-Valley Creek sand/silt gravel 0 60 40 0 0 0
Iniskin Bay T1 boulder cobble 0 0 10 20 70 0
FRESHWATER FISH AND AQUATIC INVERTEBRATES—COOK INLET DRAINAGES
TABLE 40.1-6 Water Quality Data Collected at Representative Road Alignment Primary Survey Sites, Transportation Corridor, Cook Inlet Drainages Study Area
Watershed
Nu
mb
er of sam
ples
Water Temp (oC) DO (mg/L) pH
Specific Conductivity
(µS/cm)
Mean (Range)
Standard Error
Number of Samples Not
Meeting ADEC
Standards a Mean
(Range) Standard
Error
Number of Samples Not
Meeting ADEC
Standards b Mean
(Range) Standard
Error
Number of Samples Not
Meeting ADEC
Standards cMean
(Range) Standard
Error
Williams 3 5.0
(4.4-5.5)
0.32 0 13.0
(12.5-13.6)
0.33 0 7.1
(6.8-7.5)
0.20 0 18
(15-20)
1.6
Y-Valley Creek
1 8.9
(8.9-8.9) d
-- 0 11.6 -- 0 6.7 -- 0 48 --
Iniskin Bay T1
1 6.6 -- 0 12.8 -- 0 3.9 -- 1 10 --
Notes:
a. Water temperature may not exceed 20 oC at any time, 15 oC within migration routes and rearing areas, or 13 oC in spawning, egg, and fry incubation areas (ADEC water quality standards for the growth and propagation of fish, aquatic life, and wildlife; ADEC, 2009).
b. Dissolved oxygen must be greater than 7 mg/L in fish bearing waterbodies; may not be less than 5 mg/L in non-fish bearing waterbodies; may not be greater than 17 mg/L in any waterbody (ADEC water quality standards for the growth and propagation of fish, aquatic life, and wildlife; ADEC, 2009).
c. pH may not be less than 6.5 or greater than 8.5 in any freshwater waterbody (ADEC water quality standards for the growth and propagation of fish, aquatic life, and wildlife; ADEC, 2009).
d. Number of water temperature samples in Y-Valley Creek is two.
— = no data available or standard error not calculated when the sample size is less than 3.
µS/cm = microSiemens per centimeter
FRESHWATER FISH AND AQUATIC INVERTEBRATES—COOK INLET DRAINAGES
TABLE 40.1-7 Fish Species Observed at Representative Road Alignment Primary and Support Survey Sites, Transportation Corridor, Cook Inlet Drainages Study Area
Common Name Scientific Name Y-Valley Creek Williams Creek
Chinook salmon Oncorhynchus tshawytscha X
Chum salmon Oncorhynchus keta X
Coho salmon Oncorhynchus kisutch X
Sockeye salmon Oncorhynchus nerka X
Pink salmon Oncorhynchus gorbuscha X
Dolly Varden Salvelinus malma X x
Notes:
No fish were observed during fish surveys conducted in Iniskin Bay T1.
X = species observed at primary survey site.
x= species only observed at support survey site.
PEBBLE PROJECT, ENVIRONMENTAL BASELINE DOCUMENT, 2004 THROUGH 2008
TABLE 40.1-8 Water Quality Measurements at Representative Road Alignment Primary Survey Sites that Do Not Meet Alaska Department of Environmental Conservation Water Quality Standards, Transportation Corridor, Cook Inlet Drainages Study Area
Watershed Stream Site Name Date pH a
Iniskin Bay T1 Iniskin Bay T1 MP_83.9 9/13/08 3.9
Notes:
a. pH may not be less than 6.5 or greater than 8.5 in any freshwater waterbody (ADEC, 2009).
All water quality measurements at the two support survey sites in the Cook Inlet Basin were within the ADEC water quality standards for aquatic life.

FRESHWATER FISH AND AQUATIC INVERTEBRATES—COOK INLET DRAINAGES
FIGURES
!(
!(
!(
!(
!(
!(
!(
!(
!(
!(!(
!(
!(
!(
!(
!( !(!(
!(!(!(!(!(
!(!(!(!(!(!( !(!(!( !( !( !( !(!( !( !(
!( !(
!(!(
!(
!(!(
!(
!(!(!(
!(!(!(
!(!(
!(!(
!(!(
!(
!(!(
!( !(!( !( !(
!(!(
E
G r o u n d h o gM o u n t a i n
FryingPanLake
Iliamna
Newhalen
Iliamna Lake
R o a d h o u s eM o u n t a i n
Nondalton
Newh
alen
River
Lake #2
Upper
Talari
k
Pile Bay
K n u t s o nM o u n t a i n
Pile Bay
Iliamna River
Chekok
Pedro Bay
Williamsport
PorcupineIsland
FlatIsland
TriangleIsland
Pile
River
Knuts
on
Cree
k
Creek
CookInlet
Chekok
Cree
k
Lake Clark
Tazimina River
Brist
ol Bay
Basin
Cook
Inlet
Basin
Knutson Bay
Pedro Bay Lonesom
e Bay
Canyon Creek
Eagle BayNortheast
BayRoadhouseBay
153°40'0"W154°0'0"W154°20'0"W154°40'0"W155°0'0"W155°20'0"W
60°0
'0"N
60°0
'0"N
59°5
0'0"N
59°5
0'0"N
59°4
0'0"N
59°4
0'0"N
µ
Alaska State Plane Zone 5 (units feet), 1983 North American Datum
Figure 40.1-1Primary Survey Sites for the
Representative Road Alignment, 2004-2008
April 2011/
0 2 4 6Miles
0 2 4 6 8Kilometers
Author: R2 - JJZ/BAM/Map KeyIliamna Lake
Koktuli RiverNFK, SFK, UT Watersheds
Watershed BoundaryGeneral Deposit Location
!( Bristol Bay Basin!( Cook Inlet Basin
Representative Road AlignmentBristol Bay/Cook Inlet Basin Divide
Legend

!(
!(
!(
!(
!(
!(!(
!(
!(
XW
XW
Pile Bay
Pile Bay
Iliamna River
Williamsport
PorcupineIsland
Pile
Knuts
on
Cree
k
CookInlet
Pedro Bay
Lonesome B
ay
IliamnaBay
CottonwoodBay
Inisk i
n B
ay
Bristol Bay Basin
Cook Inlet Basin
Williams Creek
Y-Valley Creek
Chinkelyes
Creek
153°20'0"W153°40'0"W154°0'0"W
59°4
0'0"N
59°4
0'0"N
µ
Alaska State Plane Zone 5 (units feet), 1983 North American Datum
Figure 40.1-2Primary and Support Survey Sites for
the Representative Road Alignmentby Cook Inlet Watershed
April 2011/
0 21Miles
0 2 4Kilometers
Author: R2 - JJZ/BAM/Map KeyIliamna Lake
Koktuli RiverNFK, SFK, UT Watersheds
Representative Road AlignmentBristol Bay/Cook Inlet Basin Divide
Legend
!( Williams Creek!( Y-Valley Creek!( Iniskin Bay T1
Supporting Data SitesStream Crossing Sites
XW
XW
!(
!(
!(
!(
!(
!([¡
#[¡
##
#
#
Pile Bay
Pile Bay
Iliamna River
Pedro Bay
Williamsport
PorcupineIsland
Pile
Knuts
on
Cree
k
CookInlet
Pedro Bay
Lonesome B
ay
IliamnaBay
CottonwoodBay
Inisk i
n B
ay
Bristol Bay Basin
Cook Inlet Basin
Williams Creek
Y-Valley Creek
Chinkelyes
Creek
153°20'0"W153°40'0"W154°0'0"W
59°4
0'0"N
59°4
0'0"N
µ
Alaska State Plane Zone 5 (units feet), 1983 North American Datum
Figure 40.1-4Fish Presence at Primary and Support
Survey Sites for the RepresentativeRoad Alignment, Cook Inlet Basin
April 2011/
0 21Miles
0 2 4Kilometers
Author: R2 - JJZ/BAM/Map KeyIliamna Lake
Koktuli RiverNFK, SFK, UT Watersheds
Anadromous Waters Catalogue StreamRepresentative Road AlignmentBristol Bay/Cook Inlet Basin Divide
LegendFish Sampling Sites[¡ Anadromous Fish[¡ Resident Fish# No Fish
FRESHWATER FISH AND AQUATIC INVERTEBRATES—COOK INLET DRAINAGES
FIGURE 40.1-5 Fish Species Composition at Representative Road Alignment Primary Survey Sites, Y-Valley Creek Watershed

FRESHWATER FISH AND AQUATIC INVERTEBRATES—COOK INLET DRAINAGES
PHOTOGRAPHS
FRESHWATER FISH AND AQUATIC INVERTEBRATES—COOK INLET DRAINAGES
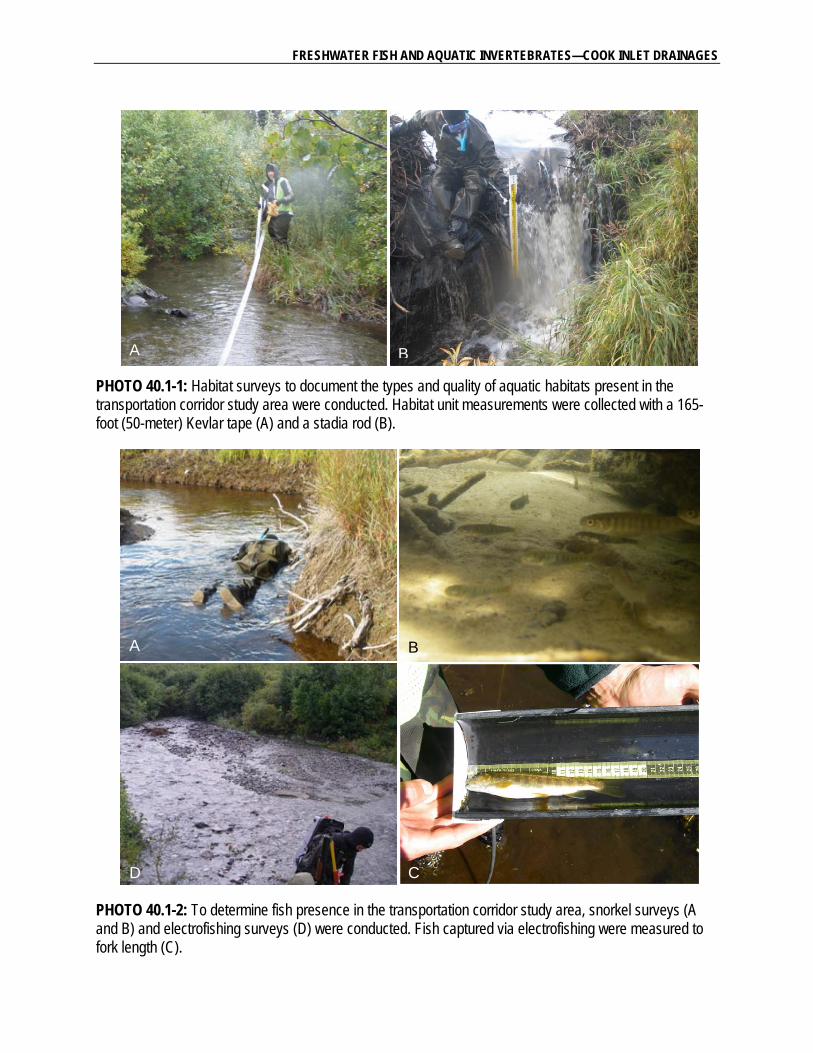
PHOTO 40.1-1: Habitat surveys to document the types and quality of aquatic habitats present in the transportation corridor study area were conducted. Habitat unit measurements were collected with a 165-foot (50-meter) Kevlar tape (A) and a stadia rod (B).
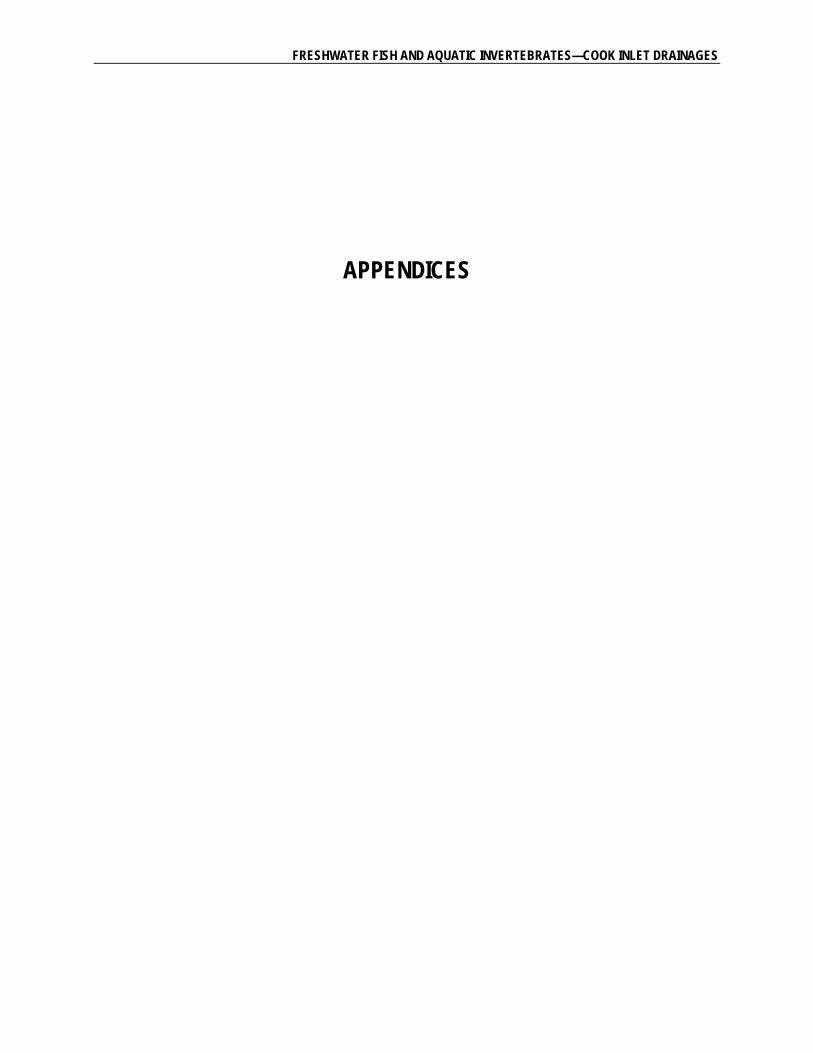
PHOTO 40.1-2: To determine fish presence in the transportation corridor study area, snorkel surveys (A and B) and electrofishing surveys (D) were conducted. Fish captured via electrofishing were measured to fork length (C).
A B
A B
CD
FRESHWATER FISH AND AQUATIC INVERTEBRATES—COOK INLET DRAINAGES
APPENDICES
FRESHWATER FISH AND AQUATIC INVERTEBRATES—COOK INLET DRAINAGES
APPENDIX 40.1A
Transportation Corridor, Cook Inlet Basin Survey Data Summaries: Primary Survey Sites - Data Collected on or near Possible Representative Road Alignment Stream Crossings
FRESHWATER FISH AND AQUATIC INVERTABRATES—APPENDIX 40.1A
Transportation Corridor Site Survey Data Location
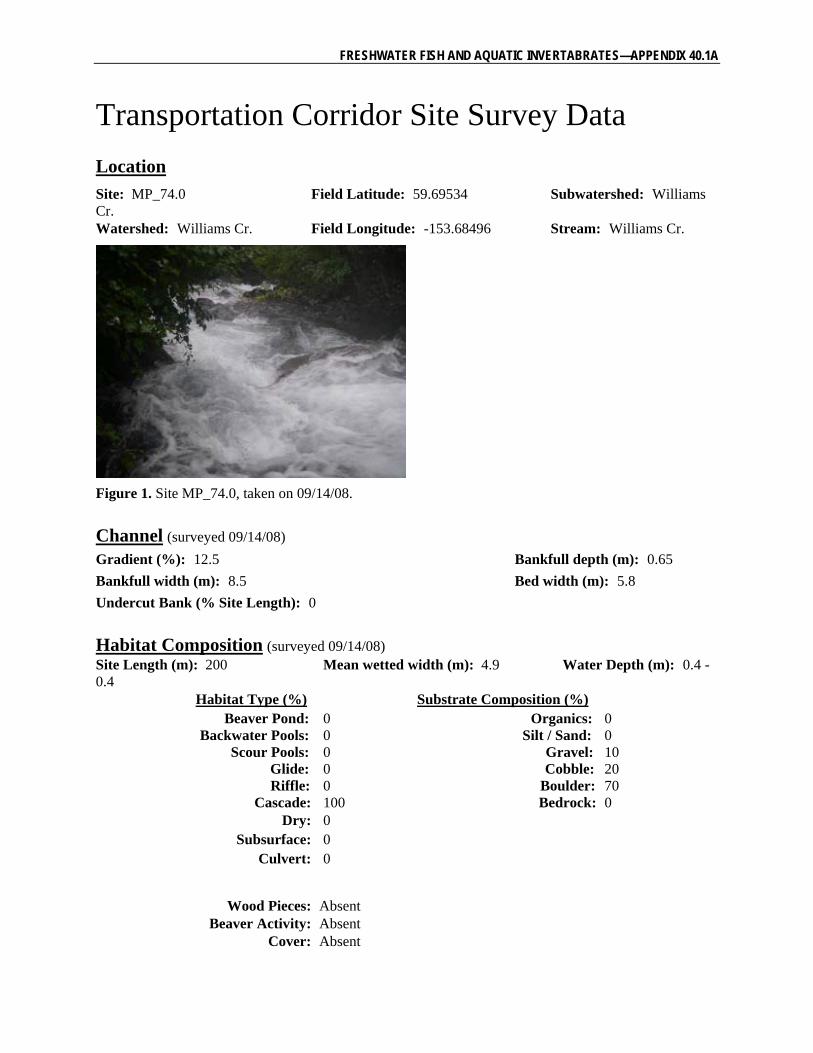
Site: MP_74.0 Field Latitude: 59.69534 Subwatershed: Williams Cr. Watershed: Williams Cr. Field Longitude: -153.68496 Stream: Williams Cr.
Figure 1. Site MP_74.0, taken on 09/14/08.
Channel (surveyed 09/14/08)
Gradient (%): 12.5 Bankfull depth (m): 0.65
Bankfull width (m): 8.5 Bed width (m): 5.8
Undercut Bank (% Site Length): 0
Habitat Composition (surveyed 09/14/08) Site Length (m): 200 Mean wetted width (m): 4.9 Water Depth (m): 0.4 - 0.4 Habitat Type (%) Substrate Composition (%) Beaver Pond: 0 Organics: 0 Backwater Pools: 0 Silt / Sand: 0 Scour Pools: 0 Gravel: 10 Glide: 0 Cobble: 20 Riffle: 0 Boulder: 70 Cascade: 100 Bedrock: 0 Dry: 0 Subsurface: 0 Culvert: 0
Wood Pieces: Absent Beaver Activity: Absent Cover: Absent
FRESHWATER FISH AND AQUATIC INVERTABRATES—APPENDIX 40.1A
Water Quality
Date Surveyed Water Temp (C) pH DO (mg/L) Specific Conductivity (µS/cm)
09/14/08 4.39 6.81 13.6 14.79
Fish Species Composition
Date Surveyed Species Life Stage Method Total Count Estimated 09/14/08 no fish NA snorkel 0 NA
FRESHWATER FISH AND AQUATIC INVERTABRATES—APPENDIX 40.1A
Transportation Corridor Site Survey Data Location
Site: MP_75.0 Field Latitude: 59.69148 Subwatershed: Williams Cr. Watershed: Williams Cr. Field Longitude: -153.66772 Stream: Williams Cr.
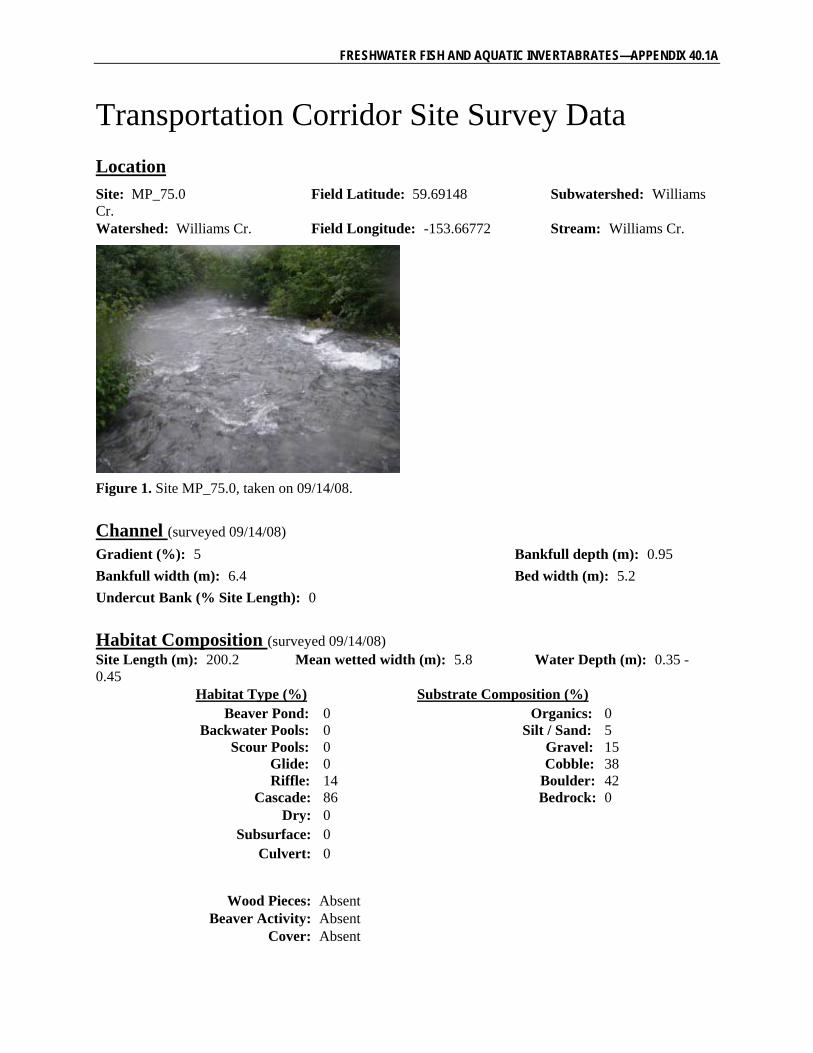
Figure 1. Site MP_75.0, taken on 09/14/08.
Channel (surveyed 09/14/08)
Gradient (%): 5 Bankfull depth (m): 0.95
Bankfull width (m): 6.4 Bed width (m): 5.2
Undercut Bank (% Site Length): 0
Habitat Composition (surveyed 09/14/08) Site Length (m): 200.2 Mean wetted width (m): 5.8 Water Depth (m): 0.35 - 0.45 Habitat Type (%) Substrate Composition (%) Beaver Pond: 0 Organics: 0 Backwater Pools: 0 Silt / Sand: 5 Scour Pools: 0 Gravel: 15 Glide: 0 Cobble: 38 Riffle: 14 Boulder: 42 Cascade: 86 Bedrock: 0 Dry: 0 Subsurface: 0 Culvert: 0
Wood Pieces: Absent Beaver Activity: Absent Cover: Absent

FRESHWATER FISH AND AQUATIC INVERTABRATES—APPENDIX 40.1A
Water Quality
Date Surveyed Water Temp (C) pH DO (mg/L) Specific Conductivity (µS/cm)
09/14/08 5.51 7.45 12.5 19.4
Fish Species Composition
Date Surveyed Species Life Stage Method Total Count Estimated 09/14/08 no fish NA snorkel 0 NA

FRESHWATER FISH AND AQUATIC INVERTABRATES—APPENDIX 40.1A
Transportation Corridor Site Survey Data Location
Site: K 76.75 Field Latitude: 59.69021 Subwatershed: Williams Creek Watershed: Williams Creek Field Longitude: -153.66392 Stream: Williams Creek Site K 76.75 was dry when visited on 09/04/04; no data was collected and no photo is available.
FRESHWATER FISH AND AQUATIC INVERTABRATES—APPENDIX 40.1A
Transportation Corridor Site Survey Data Location
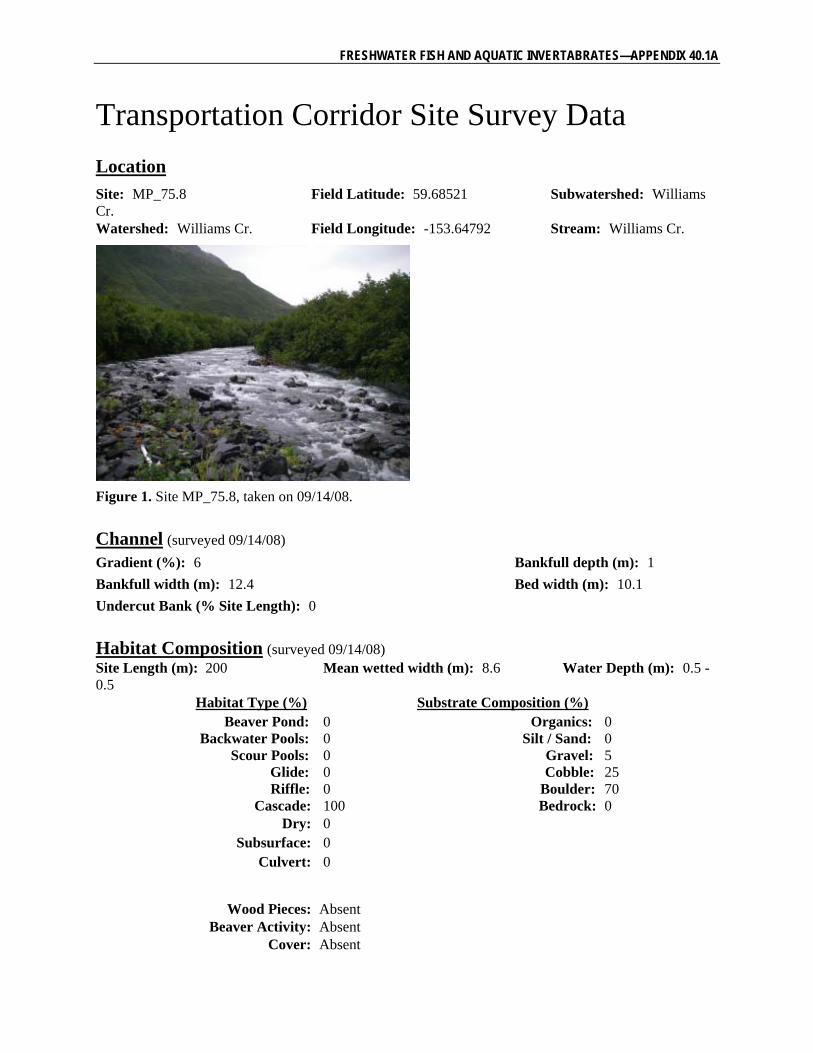
Site: MP_75.8 Field Latitude: 59.68521 Subwatershed: Williams Cr. Watershed: Williams Cr. Field Longitude: -153.64792 Stream: Williams Cr.
Figure 1. Site MP_75.8, taken on 09/14/08.
Channel (surveyed 09/14/08)
Gradient (%): 6 Bankfull depth (m): 1
Bankfull width (m): 12.4 Bed width (m): 10.1
Undercut Bank (% Site Length): 0
Habitat Composition (surveyed 09/14/08) Site Length (m): 200 Mean wetted width (m): 8.6 Water Depth (m): 0.5 - 0.5 Habitat Type (%) Substrate Composition (%) Beaver Pond: 0 Organics: 0 Backwater Pools: 0 Silt / Sand: 0 Scour Pools: 0 Gravel: 5 Glide: 0 Cobble: 25 Riffle: 0 Boulder: 70 Cascade: 100 Bedrock: 0 Dry: 0 Subsurface: 0 Culvert: 0
Wood Pieces: Absent Beaver Activity: Absent Cover: Absent
FRESHWATER FISH AND AQUATIC INVERTABRATES—APPENDIX 40.1A
Water Quality
Date Surveyed Water Temp (C) pH DO (mg/L) Specific Conductivity (µS/cm)
09/14/08 5 6.92 12.8 19.92
Fish Species Composition
Date Surveyed Species Life Stage Method Total Count Estimated 09/14/08 no fish NA snorkel 0 NA
FRESHWATER FISH AND AQUATIC INVERTABRATES—APPENDIX 40.1A
Transportation Corridor Site Survey Data Location
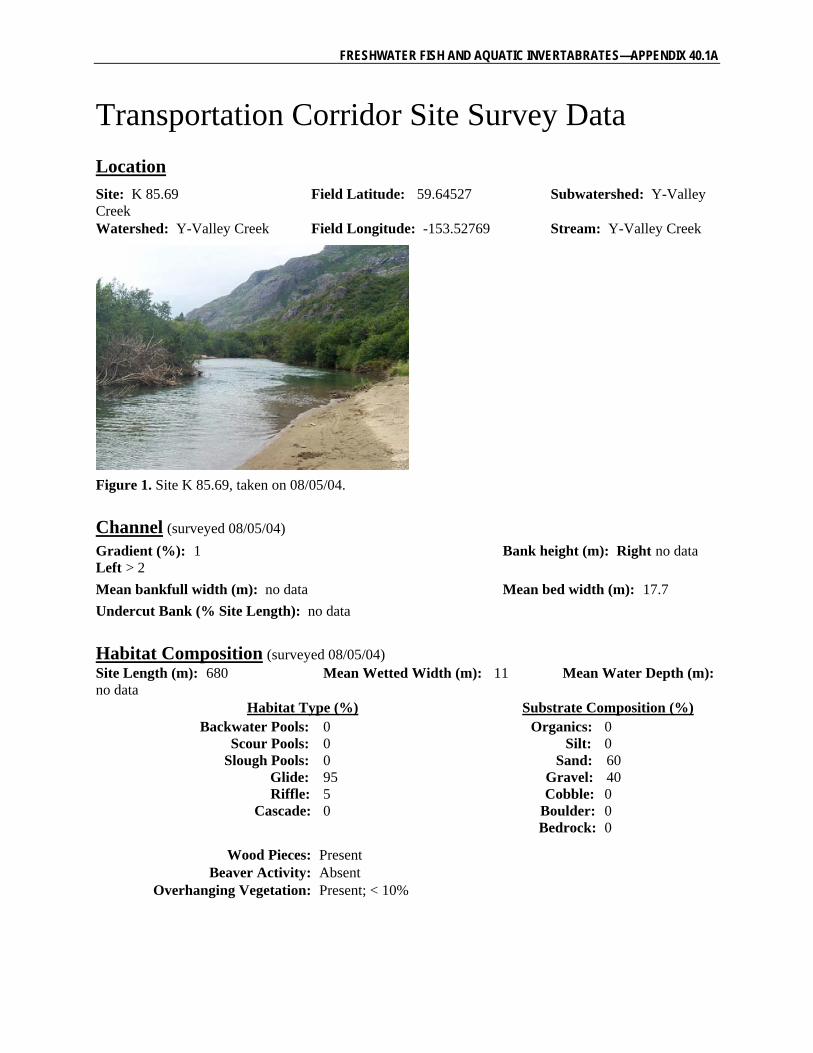
Site: K 85.69 Field Latitude: 59.64527 Subwatershed: Y-Valley Creek Watershed: Y-Valley Creek Field Longitude: -153.52769 Stream: Y-Valley Creek
Figure 1. Site K 85.69, taken on 08/05/04.
Channel (surveyed 08/05/04) Gradient (%): 1 Bank height (m): Right no data Left > 2
Mean bankfull width (m): no data Mean bed width (m): 17.7
Undercut Bank (% Site Length): no data
Habitat Composition (surveyed 08/05/04) Site Length (m): 680 Mean Wetted Width (m): 11 Mean Water Depth (m): no data Habitat Type (%) Substrate Composition (%) Backwater Pools: 0 Organics: 0 Scour Pools: 0 Silt: 0 Slough Pools: 0 Sand: 60 Glide: 95 Gravel: 40 Riffle: 5 Cobble: 0 Cascade: 0 Boulder: 0 Bedrock: 0
Wood Pieces: Present Beaver Activity: Absent Overhanging Vegetation: Present; < 10%
FRESHWATER FISH AND AQUATIC INVERTABRATES—APPENDIX 40.1A
Estimated Discharge
Date Surveyed Cubic meters/second (cms) Cubic feet/second (cfs)
08/05/04 1.6 55.8
Water Quality
Date Surveyed Water Temp (C) pH DO (mg/L) Specific Conductivity (µS/cm)
08/05/04 8.9 6.7 11.61 47.9
08/23/05 8.9 no data no data no data
Fish Species Composition
Date Surveyed Species Life Stage Method Total Count Estimated 08/05/04 Chinook salmon juvenile electrofish 1 NA 08/05/04 chum salmon adult visual observation 63 NA 08/05/04 coho salmon juvenile electrofish 9 NA 08/23/05 coho salmon juvenile electrofish 14 NA 09/03/04 coho salmon juvenile minnow trap 17 NA 08/05/04 sockeye salmon adult visual observation 3 NA 08/05/04 pink salmon adult visual observation 12 NA 08/05/04 Dolly Varden adult visual observation 10 NA 08/05/04 Dolly Varden juvenile electrofish 9 NA 08/23/05 Dolly Varden juvenile electrofish 38 NA 09/03/04 Dolly Varden juvenile minnow trap 4 NA
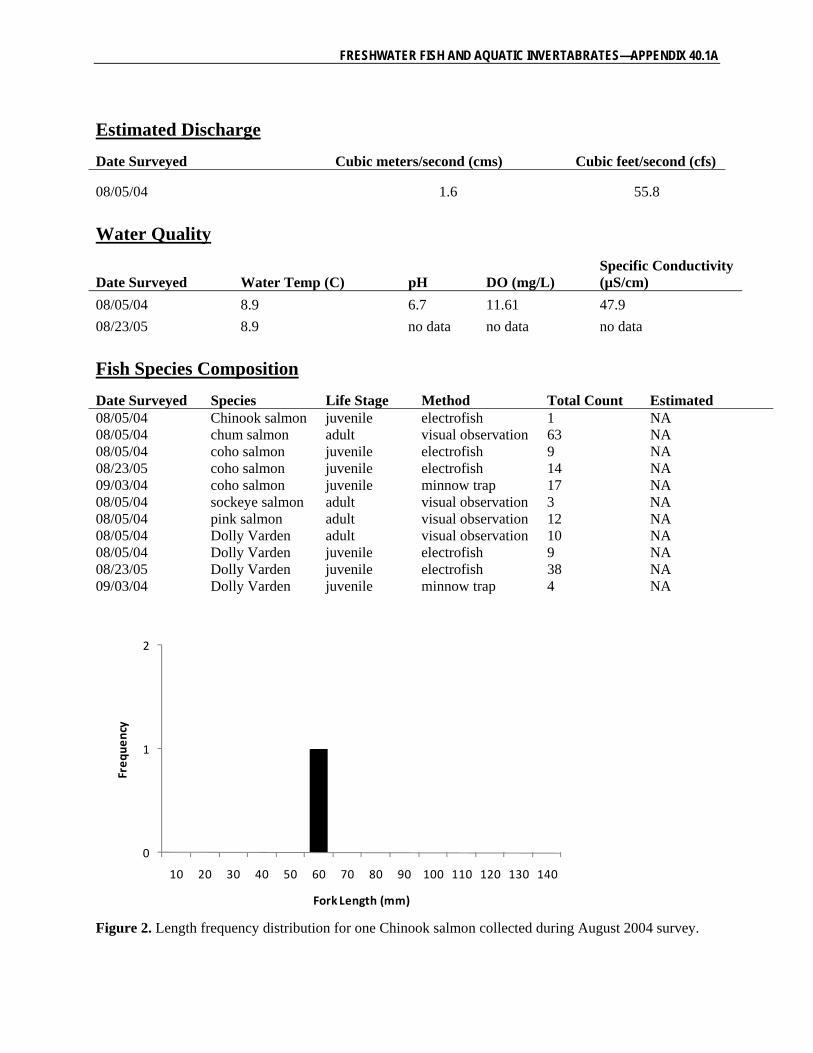
0
1
2
10 20 30 40 50 60 70 80 90 100 110 120 130 140
Frequency
Fork Length (mm)
Figure 2. Length frequency distribution for one Chinook salmon collected during August 2004 survey.
FRESHWATER FISH AND AQUATIC INVERTABRATES—APPENDIX 40.1A
0
2
4
6
8
10
12
14
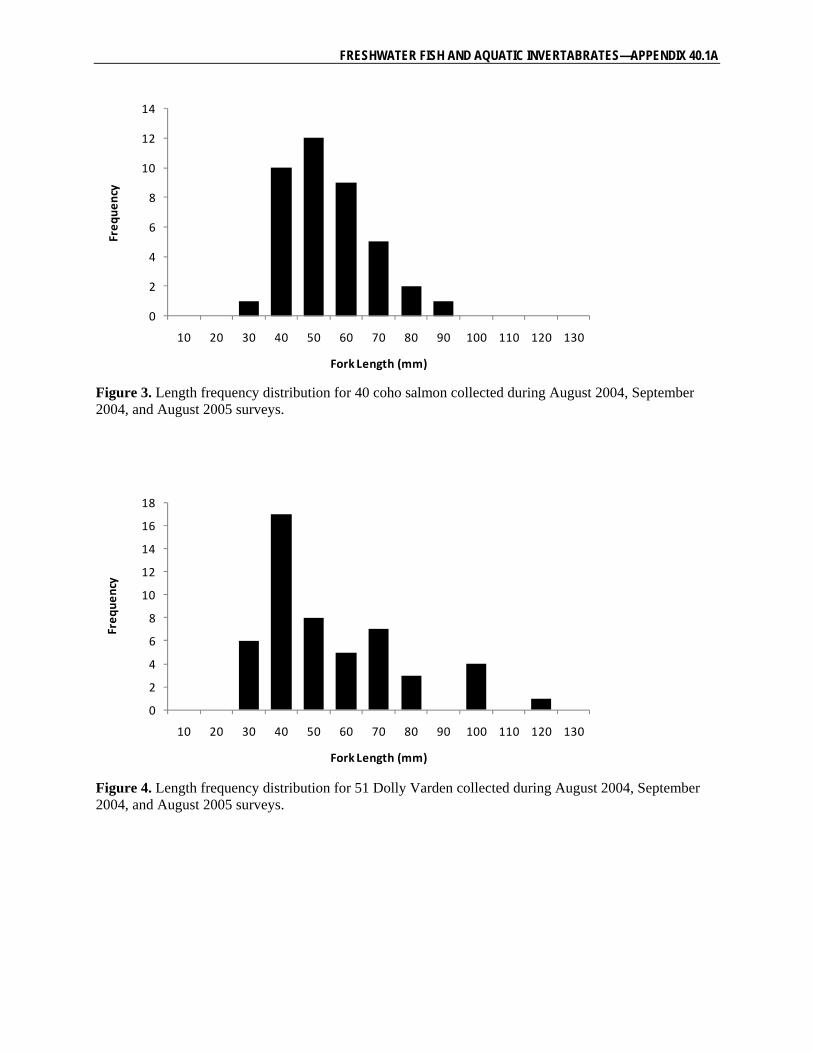
10 20 30 40 50 60 70 80 90 100 110 120 130
Frequency
Fork Length (mm)
Figure 3. Length frequency distribution for 40 coho salmon collected during August 2004, September 2004, and August 2005 surveys.
0
2
4
6
8
10
12
14
16
18
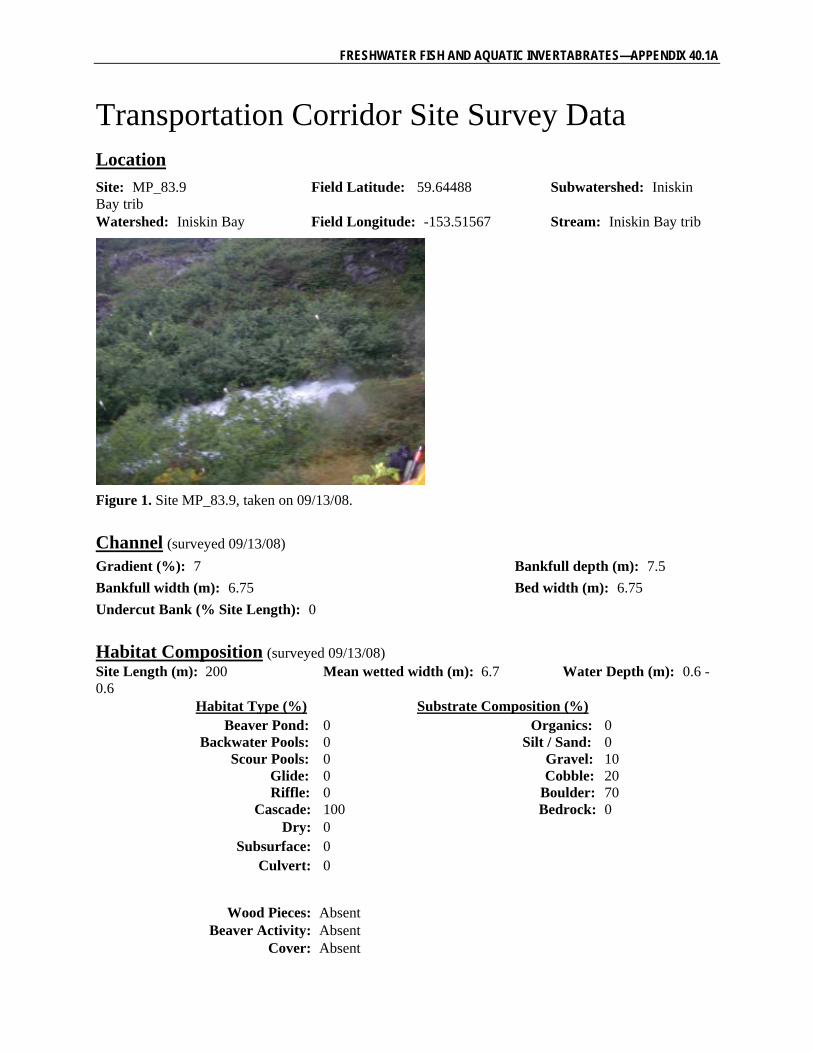
10 20 30 40 50 60 70 80 90 100 110 120 130
Frequency
Fork Length (mm)
Figure 4. Length frequency distribution for 51 Dolly Varden collected during August 2004, September 2004, and August 2005 surveys.
FRESHWATER FISH AND AQUATIC INVERTABRATES—APPENDIX 40.1A
Transportation Corridor Site Survey Data Location
Site: MP_83.9 Field Latitude: 59.64488 Subwatershed: Iniskin Bay trib Watershed: Iniskin Bay Field Longitude: -153.51567 Stream: Iniskin Bay trib
Figure 1. Site MP_83.9, taken on 09/13/08.
Channel (surveyed 09/13/08)
Gradient (%): 7 Bankfull depth (m): 7.5
Bankfull width (m): 6.75 Bed width (m): 6.75
Undercut Bank (% Site Length): 0
Habitat Composition (surveyed 09/13/08) Site Length (m): 200 Mean wetted width (m): 6.7 Water Depth (m): 0.6 - 0.6 Habitat Type (%) Substrate Composition (%) Beaver Pond: 0 Organics: 0 Backwater Pools: 0 Silt / Sand: 0 Scour Pools: 0 Gravel: 10 Glide: 0 Cobble: 20 Riffle: 0 Boulder: 70 Cascade: 100 Bedrock: 0 Dry: 0 Subsurface: 0 Culvert: 0
Wood Pieces: Absent Beaver Activity: Absent Cover: Absent

FRESHWATER FISH AND AQUATIC INVERTABRATES—APPENDIX 40.1A
Water Quality
Date Surveyed Water Temp (C) pH DO (mg/L) Specific Conductivity (µS/cm)
09/13/08 6.6 3.9 12.8 9.7
Fish Species Composition
Date Surveyed Species Life Stage Method Total Count Estimated 09/13/08 no fish NA electrofish 0 NA
FRESHWATER FISH AND AQUATIC INVERTEBRATES—COOK INLET DRAINAGES
APPENDIX 40.1B
Transportation Corridor, Cook Inlet Basin Survey Data Summaries: Support Survey Sites - Data Collected Upstream or
Downstream of Surveyed Primary Survey Sites
FRESHWATER FISH AND AQUATIC INVERTABRATES—APPENDIX 40.1B
Transportation Corridor Site Survey Data
Location
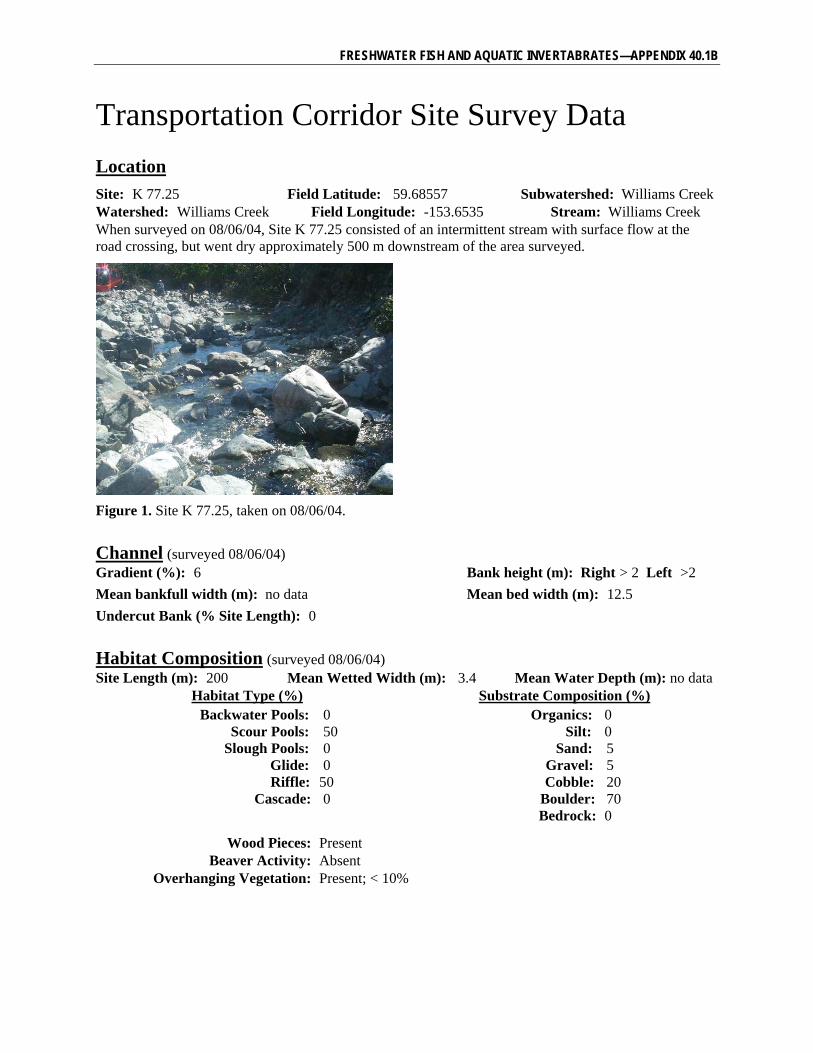
Site: K 77.25 Field Latitude: 59.68557 Subwatershed: Williams Creek Watershed: Williams Creek Field Longitude: -153.6535 Stream: Williams Creek When surveyed on 08/06/04, Site K 77.25 consisted of an intermittent stream with surface flow at the road crossing, but went dry approximately 500 m downstream of the area surveyed.
Figure 1. Site K 77.25, taken on 08/06/04.
Channel (surveyed 08/06/04) Gradient (%): 6 Bank height (m): Right > 2 Left >2
Mean bankfull width (m): no data Mean bed width (m): 12.5
Undercut Bank (% Site Length): 0
Habitat Composition (surveyed 08/06/04) Site Length (m): 200 Mean Wetted Width (m): 3.4 Mean Water Depth (m): no data Habitat Type (%) Substrate Composition (%) Backwater Pools: 0 Organics: 0 Scour Pools: 50 Silt: 0 Slough Pools: 0 Sand: 5 Glide: 0 Gravel: 5 Riffle: 50 Cobble: 20 Cascade: 0 Boulder: 70 Bedrock: 0
Wood Pieces: Present Beaver Activity: Absent Overhanging Vegetation: Present; < 10%
FRESHWATER FISH AND AQUATIC INVERTABRATES—APPENDIX 40.1B
Estimated Discharge
Date Surveyed Cubic meters/second (cms) Cubic feet/second (cfs)
08/06/04 < 0.1 1.3
Water Quality:
Date Surveyed Water Temp (C) pH DO (mg/L) Specific Conductivity (µS/cm)
08/06/04 10.6 6.83 12.35 24.9
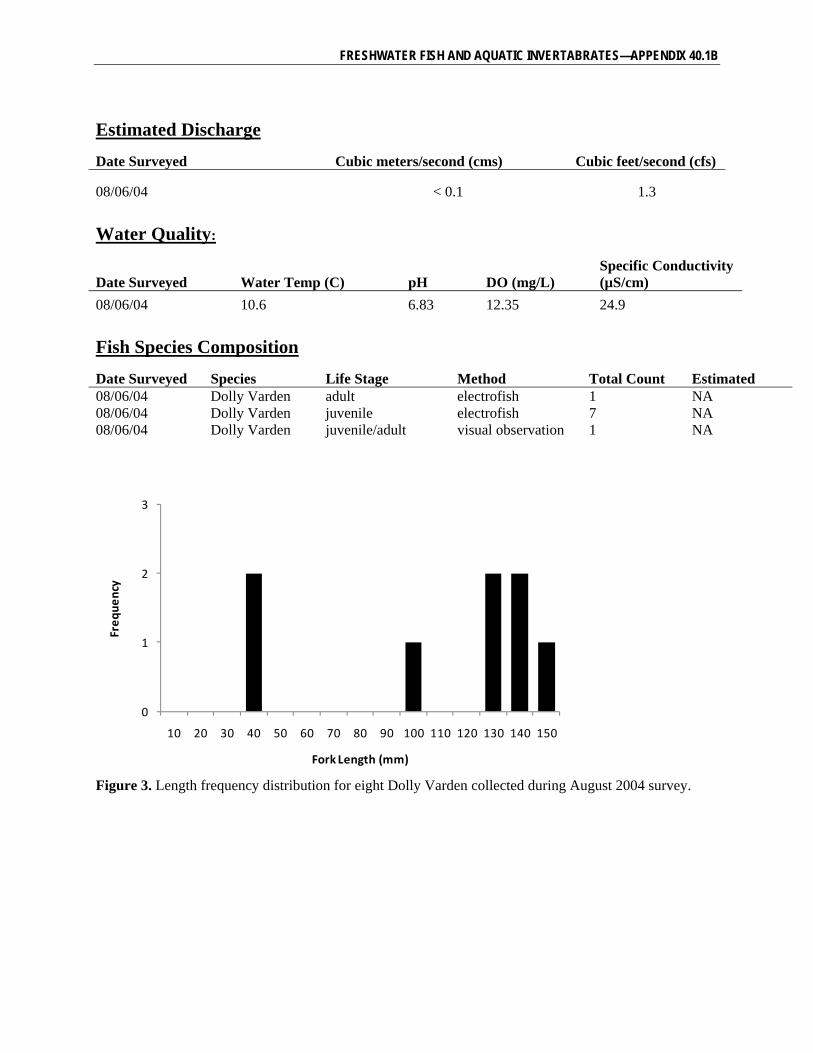
Fish Species Composition
Date Surveyed Species Life Stage Method Total Count Estimated 08/06/04 Dolly Varden adult electrofish 1 NA 08/06/04 Dolly Varden juvenile electrofish 7 NA 08/06/04 Dolly Varden juvenile/adult visual observation 1 NA
0
1
2
3
10 20 30 40 50 60 70 80 90 100 110 120 130 140 150
Frequency
Fork Length (mm) Figure 3. Length frequency distribution for eight Dolly Varden collected during August 2004 survey.
FRESHWATER FISH AND AQUATIC INVERTABRATES—APPENDIX 40.1B
Transportation Corridor Site Survey Data Location
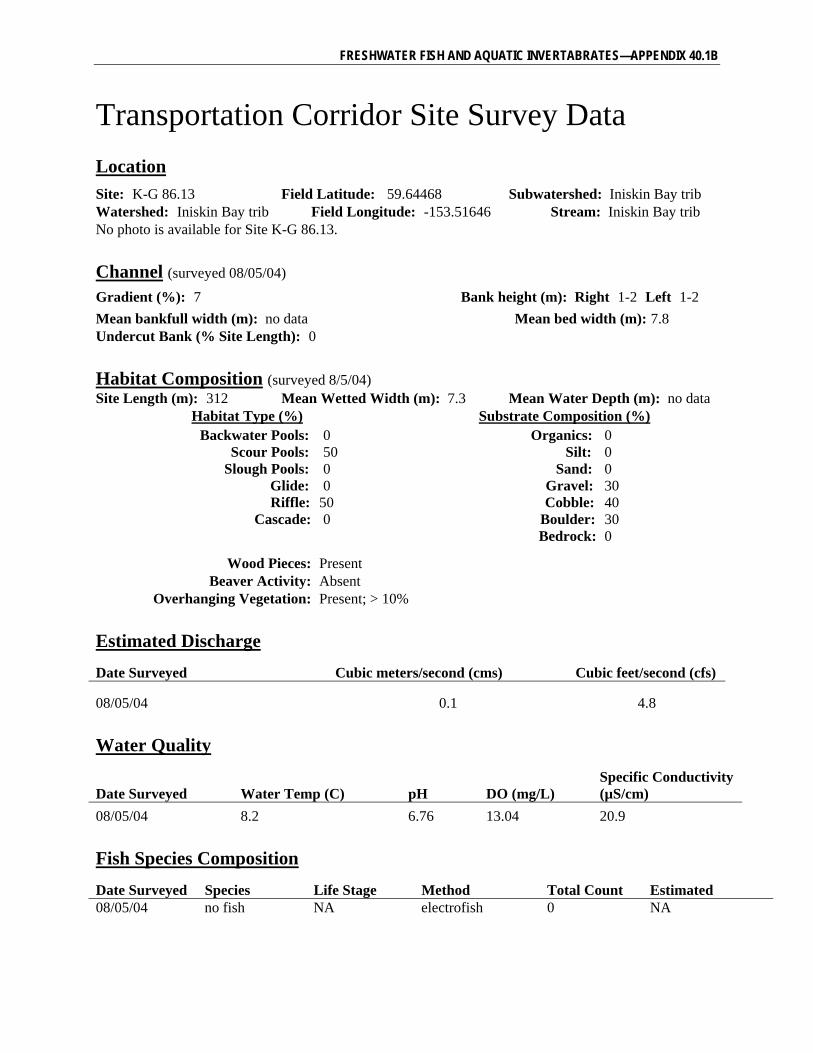
Site: K-G 86.13 Field Latitude: 59.64468 Subwatershed: Iniskin Bay trib Watershed: Iniskin Bay trib Field Longitude: -153.51646 Stream: Iniskin Bay trib No photo is available for Site K-G 86.13.
Channel (surveyed 08/05/04) Gradient (%): 7 Bank height (m): Right 1-2 Left 1-2
Mean bankfull width (m): no data Mean bed width (m): 7.8 Undercut Bank (% Site Length): 0
Habitat Composition (surveyed 8/5/04) Site Length (m): 312 Mean Wetted Width (m): 7.3 Mean Water Depth (m): no data Habitat Type (%) Substrate Composition (%) Backwater Pools: 0 Organics: 0 Scour Pools: 50 Silt: 0 Slough Pools: 0 Sand: 0 Glide: 0 Gravel: 30 Riffle: 50 Cobble: 40 Cascade: 0 Boulder: 30 Bedrock: 0
Wood Pieces: Present Beaver Activity: Absent Overhanging Vegetation: Present; > 10%
Estimated Discharge
Date Surveyed Cubic meters/second (cms) Cubic feet/second (cfs)
08/05/04 0.1 4.8
Water Quality
Date Surveyed Water Temp (C) pH DO (mg/L) Specific Conductivity (µS/cm)
08/05/04 8.2 6.76 13.04 20.9
Fish Species Composition
Date Surveyed Species Life Stage Method Total Count Estimated 08/05/04 no fish NA electrofish 0 NA
FRESHWATER FISH AND AQUATIC INVERTEBRATES—COOK INLET DRAINAGES
40.2-1 06/27/2011
40.2 Macroinvertebrates and Periphyton
40.2.1 Introduction
The macroinvertebrate and periphyton studies in the Cook Inlet drainages are part of the overall program of baseline investigations to describe the current aquatic conditions in the study area. Baseline information on macroinvertebrate and periphyton community assemblages is valued because they are essential components of the aquatic food web and their community structure, particularly with respect to the more sensitive taxa, is an indicator of habitat and water quality (Barbour et al., 1999; Merritt and Cummins, 1996).
Macroinvertebrates are organisms without a backbone that are large enough to be seen without the aid of a microscope. Sampling of macroinvertebrates typically targets those organisms that live in or on the substrate of streams and lakes (usually in larval and pupal life stages). Periphyton, defined as micro-algae attached to rocks or other solid surfaces, has been sampled in order to describe the primary producers within freshwater habitats in the study area. As with macroinvertebrates, periphyton is also sensitive to changes in the aquatic environment and can be used as a monitoring tool for in situ primary productivity (ADF&G, 1998).
The following sections present the methodology for and findings of the macroinvertebrate and periphyton field studies conducted during the summers of 2004 and 2005. At the time of this writing, two years of data have been collected; however, for some data sets (e.g., Alaska Department of Fish and Game [ADF&G] periphyton methods, chlorophyll-a), only one year of baseline data exists because of a change in the sampling methods leading into the 2005 field season.
40.2.2 Study Objectives
The objective of the 2004 macroinvertebrate and periphyton study was to characterize populations of macroinvertebrates and periphyton, and their habitat conditions in the Cook Inlet drainages study area. The 2005 study further characterizes the diversity and abundance in the study area and also provides data that are more quantitative for critical areas of aquatic habitat.
40.2.3 Study Area
Sites for the macroinvertebrate and periphyton study in the Cook Inlet drainages were selected to characterize conditions in the Cook Inlet drainages study area. Sampling in the Cook Inlet drainages study area began in August 2004. The study area for macroinvertebrates and periphyton in the Cook Inlet drainages consisted of two stream sampling sites in 2004: Y Valley Creek and an unnamed creek (Figure 40.2-1). Y Valley Creek was sampled again in 2005. Sampling locations were subject to change, and the unnamed creek site was dropped from the program in 2005. The macroinvertebrate and periphyton study sites coincided with sampling sites for water quality, hydrology, and fish resources; however, macroinvertebrate and periphyton studies were not required at all sites designated for the other studies.
PEBBLE PROJECT, ENVIRONMENTAL BASELINE DOCUMENT, 2004 THROUGH 2008
40.2-2 06/27/2011
40.2.4 Scope of Work
Information review for these studies began in spring 2004 and field work was completed during the 2004 and 2005 field seasons. The macroinvertebrate and periphyton studies were conducted in accordance with Chapter 11 of the consolidated study program for Pebble Project (see Appendix E of this environmental baseline document). Overall quality assurance (QA) and quality control (QC) for the baseline studies can be found in the Draft Environmental Baseline Studies, Proposed 2004 Quality Assurance Project Plan (see Appendix G of this environmental baseline document). Andra Love, Isaac Watkins, Lynn Spencer, Josh Hedberg, Brian Cook, Jessica Manifold, and Erin Cunningham of HDR Alaska, Inc., and Sally Morsell of Northern Ecological Services conducted the studies.
Following initial analysis of 2004 data and discussions about conditions in the study area and proposed data use, researchers developed a modified sampling program for 2005. Two macroinvertebrate sampling methods were used in each year. The Alaska Stream Condition Index (ASCI) method (Major and Barbour, 2001) was used in both years to allow a comparison of 2004 and 2005 data. The second method for macroinvertebrate sampling in 2004 was drift-net sampling, which was replaced by Surber sampling in 2005. Surber sampling provides a more quantitative measure of diversity and density in a specific habitat type, usually riffles.
Different periphyton sampling methods were used in 2004 and 2005. The 2004 sampling program for periphyton focused on collecting samples for identification of diatoms to characterize diversity and habitat conditions. The method used in the 2005 sampling program was tailored to collecting periphyton for analysis of standing crop by measuring chlorophyll-a content. This method provided a more quantitative measurement of periphyton productivity.
The 2004 sampling program consisted of the following tasks (detailed in Section 40.2.5):
Macroinvertebrate sampling, ASCI method. One composite sample was collected at each site.
Macroinvertebrate sampling, drift-net method. One composite sample was collected at each site.
Periphyton sampling, modified Rapid Bioassessment Protocol (RBP) method (diatom community). One composite sample was collected at each site.
Ambient water-quality measurements. One measurement of each parameter was recorded at each site.
The 2005 sampling program consisted of the following tasks (detailed in Section 40.2.6):
Macroinvertebrate sampling, ASCI method. One composite sample was collected at each site.
Macroinvertebrate sampling, Surber sampler semi-quantitative method. Five Surber samples were collected at each site.
Periphyton sampling, ADF&G method (chlorophyll-a). Ten samples were collected at each site.
Ambient water-quality measurements. One measurement of each parameter was recorded at each site.
FRESHWATER FISH AND AQUATIC INVERTEBRATES—COOK INLET DRAINAGES
40.2-3 06/27/2011
40.2.5 Macroinvertebrate Methods
Detailed descriptions of field protocols can be found in the Draft Environmental Baseline Studies, 2005 Field Sampling Plan, Fish and Aquatic Habitat (Appendix F of this environmental baseline document). One sampling site in the Cook Inlet drainages was dropped from the program after 2004.
40.2.5.1 Field Sampling Protocol
Sampling occurred from August 14 through August 18 in 2004, and June 10 through June 13 in 2005. The field team documented the location of each 100-meter-long stream reach using a global positioning system (GPS) and flagged the locations to ensure that subsequent sampling would occur in the same areas. At each site, macroinvertebrate sampling and periphyton sampling were conducted concurrently. Generally, three team members began the collection process at the downstream end of the stream reach and continued upstream for 100 meters. Two team members collected macroinvertebrate samples, and the third member collected periphyton samples. The concurrent sampling of macroinvertebrates and periphyton was intended to avoid site disturbance upstream of sample collection.
For QA and QC, duplicate samples were collected at a minimum of 10 percent of the sample sites on streams during the 2004 and 2005 sampling events. After sampling, the following conditions were verified:
Labeling on all sample bottles was complete and readable.
All sample bottles were accounted for.
All samples had sufficient preservative.
ASCI Sampling, 2004 and 2005
According to ASCI protocols (Major and Barbour, 2001), 20 subsamples were collected in the 100-meter reach at each sampling site and then were combined into a single composite sample for each site. The subsamples were collected from the habitat types within the reach based on proportionate habitat representation; for example, if 50 percent of the stream bottom was estimated to be cobble/riffle habitat, 10 of the 20 subsamples were collected from cobble/riffle habitat. Common in-stream habitats include undercut banks, snags, cobbles/riffles, emergent vegetation, and sand or soft sediment. The calculations of habitat representation were recorded on data sheets similar to those found in the ASCI protocols. Other parameters noted on the habitat-assessment data sheets include air and water temperature, riparian vegetation, signs of erosion, latitude and longitude, and canopy cover. Pictures were taken at each site to document local conditions.
Samples were collected using a D-frame kick net with 363-micrometer (m) mesh. The field team collected the samples starting at the downstream end of the 100-meter reach and working upstream to avoid disturbing the substrate before sampling. The team members collected macroinvertebrates by disturbing the substrate immediately in front (upstream) of the D-frame net and scrubbing the substrate with gloved hands. When the water was too deep to dislodge the invertebrates by hand, the substrate was sampled by kicking it with felt-soled wading boots. The contents of the net were emptied into 1-liter Nalgene bottles and preserved with ethanol.
PEBBLE PROJECT, ENVIRONMENTAL BASELINE DOCUMENT, 2004 THROUGH 2008
40.2-4 06/27/2011
A suite of ambient water-quality measurements was recorded at each site, as required by the ASCI protocols. Parameters measured were temperature in degrees Celsius (°C), dissolved oxygen (DO) measured in both milligrams per liter (mg/L) and percent saturation, specific conductivity in milliSiemens per centimeter (mS/cm), and pH. All parameters were measured using a YSI Model 556 multi-probe system. The multi-probe was serviced before the field season and was calibrated or checked with confidence solution once daily according to manufacturer’s specifications.
Drift-net Sampling, 2004
Drift samples were collected at each stream site in 2004. Field staff set five nets with 363-m mesh and 12x18-inch openings across the stream to collect drifting organisms. The nets were positioned at the upstream end of the 100-meter-long reach to avoid disturbance from concurrent ASCI sampling.
The depth of the submerged portion of each net was recorded, and the stream’s velocity was measured at its mouth for use in calculating the total volume of water that flowed through the net during the sampling interval. The sampling interval was a minimum of 1 hour. The actual length of time was recorded on the field data sheets. Material was removed from all nets at a sampling site and placed in a 1-liter Nalgene bottle to obtain a single composite sample for each site.
Surber Sampling, 2005
The use of Surber samplers was added to the study program in 2005 to determine the density and composition of macroinvertebrate populations. Surber samples were collected only in riffle/cobble habitats to ensure more valid comparison between samples (Parsons and Norris, 1996). The sampler was constructed of 363-m-mesh netting with a 1-square-foot mouth. A 1-square-foot metal frame attached to the net was folded down over the substrate in front (upstream) of the net to delineate the sampling area. The net was placed with the opening facing upstream and the substrate within the frame was disturbed.
Five Surber samples were collected from a selected riffle/cobble area at each sampling site. From habitat characterization completed in 2004, it was determined that riffle/cobble habitat was available at all previously established sampling reaches scheduled for sampling in 2005. Each Surber sample was placed in a separate Nalgene bottle, preserved with ethanol, and labeled with site code, date, and number in the series (e.g., 1 of 5).
40.2.5.2 Laboratory Processing
All samples were shipped to Anchorage for processing by scientists at HDR Alaska. Inc. Samples were logged on tracking sheets with site information, date sorted, date identified, processor’s initials, and quality-control information according to QA/QC procedures as described in the 2005 field sampling plan for fish and aquatic habitat (see Appendix F of this environmental baseline document).
Sorting and Subsampling
ASCI Samples, 2004 and 2005. Sample material was placed in a numbered 30-square-grid Caton subsampling tray. A computer-generated table of random numbers was used to select the numbered squares for sorting. Organisms were sorted from the sample material until at least 300 specimens were counted, and the last square selected for sorting was completely processed, even if the total for the sample
FRESHWATER FISH AND AQUATIC INVERTEBRATES—COOK INLET DRAINAGES
40.2-5 06/27/2011
exceeded 300 organisms. If macroinvertebrate densities exceeded 300 organisms per square (as determined early in the sorting process), four randomly selected squares were removed from the original volume of sample material and sorted in a second tray using the same random-selection method (Major and Barbour, 2001). This approach was used to ensure complete taxa representation and accurate density calculations. All organisms were picked from the subsample and placed in a vial filled with histological-grade ethanol for later identification.
Drift Samples, 2004. All organisms were separated from the drift-sample debris. If it became evident that a high density of organisms (more than 1,000) was in the sample, subsampling was used as described above for ASCI samples. The laboratory team placed the organisms in a vial filled with histological-grade ethanol for later identification.
Surber Samples, 2005. All organisms were separated from the Surber-sample debris and were placed in a vial filled with histological-grade ethanol for later identification.
Identification
A 40x-power dissecting microscope was used to identify the sorted and preserved organisms to genus. To identify Chironomidae larvae to genus, 10 percent of the total number of Chironomidae larvae per subsample or a minimum of 20 individuals (strictly 10 percent in 2004) were identified. In 2005, all Chironomidae in samples that contained 20 specimens or less were identified. Organisms were mounted on slides with CMC-10 mounting media and identified using either an Olympus Model CX41 or a Bausch and Lomb 400x compound microscope. If it was not possible to identify an organism to genus (or the identification was uncertain) because of missing identifiers or small size, this limitation was noted on the data sheets along with the lowest taxon to which the organism could be identified with certainty. Although most taxa were identified to genus, some were left at a higher taxonomic classification because of the difficulty associated with taking them to higher resolution—a common practice in many macroinvertebrate assessment projects (Ourso, 2001; Bennett, 2001; ENRI, 2002). For example, oligochaetes are often not identified to genus in macroinvertebrate assessments because there are few taxonomic specialists available to perform the identifications and because the information gained from the additional resolution is of relative inconsequence to fish or water-quality assessments. Several macroinvertebrate taxonomic keys were used in the identification process (i.e., McCafferty, 1998; Merritt and Cummins, 1996; Wiederholm, 1983; Needham and Needham, 1962). Each year, independent taxonomic verification was performed by third-party taxonomists on 10 percent of the samples and a reference collection.
40.2.5.3 Data Analysis
Several metrics described in the ASCI protocol (Major and Barbour, 2001) were calculated from the macroinvertebrate data for each site. These metrics include: taxa richness; percent Ephemeroptera, Plecoptera, and Trichoptera (EPT); percent Chironomidae; percent other Diptera taxa; percent dominant taxon; and Community Tolerance Index (CTI). These metrics have been documented as indicators of habitat change in previous studies (Major and Barbour, 2001). For the analysis of Surber-sample data, results were averaged from the five samples collected at each sample site, the standard deviation of the mean was calculated for each result, and the standard error was calculated. Data should be interpreted with caution, as sample sizes were small.
PEBBLE PROJECT, ENVIRONMENTAL BASELINE DOCUMENT, 2004 THROUGH 2008
40.2-6 06/27/2011
Taxa richness was calculated as the total number of taxa found in a sample. Taxa richness scores were generated from the lowest taxonomic classification obtained for each organism. As described above, taxa richness scores are often based on genera identifications, however a few taxa (e.g. Oligochaetes) are left at lower resolution. Post-project sampling metrics should be calculated in the same manner to provide consistency in data comparisons.
Percent EPT is the proportion of a sample that is made up of organisms in the orders Ephemeroptera, Plecoptera, and Trichoptera. Because EPT taxa typically are sensitive to changes in water quality, the percent of EPT abundance relative to total abundance is often used to assess changes in water quality and habitat (Lenat, 1988; Plafkin et al., 1989). Percent EPT was calculated by dividing the number of EPT organisms in a sample by the total number of organisms in that sample. Similarly, percent Chironomidae and percent other Diptera are the proportions of the sample represented by the family Chironomidae and by other taxa in the order Diptera, respectively. These metrics were calculated in the same manner as was described for percent EPT.
Percent dominant taxon is the proportion of the sample represented by the most abundant taxon. Percent dominant taxon was calculated for each sample by determining which taxon represented the largest number of organisms in the sample and dividing that number by the total number of organisms in the sample (Plafkin et al., 1989).
The Community Tolerance Index for each site was derived by weighting the established tolerance value (TV) of each taxon identified for the subsample. Regional TVs for some, but not all, taxa of aquatic macroinvertebrates have been established in the published literature and are available in Appendix B of the Environmental Protection Agency’s (EPA’s) RBP (Barbour et al., 1999). Therefore, the CTI is calculated on the number of taxa with assigned TVs and not solely on the total number of taxa in the sample.
The CTI value at each station was calculated using the following formula:
s
tttntl
N
TVNCTI
...
Where:
CTI = Community Tolerance Index
Nt = total number of organisms in each taxon with assigned TVs in the subsample
TVt = tolerance value of each taxon
Ns = total number of macroinvertebrates in the subsample
Weighted TVs were derived by multiplying the total number of organisms in each taxon by the taxon’s TV. All weighted TVs for the station were then summed and that value was divided by the total number in the sample of macroinvertebrates with assigned TVs, resulting in the CTI for that station.
FRESHWATER FISH AND AQUATIC INVERTEBRATES—COOK INLET DRAINAGES
40.2-7 06/27/2011
40.2.6 Periphyton Methods
Detailed descriptions of field protocols for the periphyton sampling can be found in the Draft Environmental Baseline Studies, 2005 Field Sampling Plan, Fish and Aquatic Habitat (see Appendix F of this environmental baseline document). As described previously, the number of sampling sites in the Cook Inlet drainages was decreased from two in 2004 to one in 2005. In 2004, Y Valley Creek and an unnamed creek were sampled; in 2005, only Y Valley Creek was sampled.
40.2.6.1 Field Sampling Protocol
Periphyton sampling occurred from August 14 through August 18 in 2004 and June 10 through June 13 in 2005. Field sampling protocols used in 2004 were geared toward collecting diatoms for identification (Barbour et al., 1999) and, in 2005, toward collecting samples to determine chlorophyll-a concentrations (ADF&G, 1998). As described in Section 40.2.5.1, macroinvertebrates and periphyton were sampled concurrently with two team members collecting macroinvertebrate samples, and a third member collecting periphyton samples. Sample collection began at the downstream end of the stream reach and continued upstream for 100 meters. The concurrent sampling was intended to avoid disturbance of the streambed upstream of sampling.
Sampling by Modified EPA Rapid Bioassessment Protocol, 2004
Periphyton sampling methods used in 2004 were modified from the periphyton section of EPA’s RBP (Barbour et al., 1999). Modifications to the protocols consisted of sampling five transects instead of four and sampling various periphyton habitats based on proportionate representation (similar to ASCI protocols for macroinvertebrates) instead of sampling four riffle/run areas. These modifications improved the ability to standardize stream sampling areas for the macroinvertebrate and periphyton studies. Four periphyton habitat types were documented while performing the habitat-assessment survey: hard removable substrates (woody debris, cobble, gravel), soft removable substrates (mosses and macrophytes), large substrates (boulders, bedrock, logs), and loose substrates (sand, silt, clay).
The field team collected 20 periphyton subsamples from the stream reach at each site and combined them to form one composite sample per site. The proportion of the 20 subsamples collected from each of the four habitat types was based on the percentage of each habitat that existed in the stream reach (as described for macroinvertebrates). Sampling procedures varied depending on the habitat being sampled, as described below. For QA/QC purposes, duplicate samples were collected at 10 percent or more of the sites during each sampling event.
To sample hard removable substrates, cobbles and/or gravel and/or pieces of wood were removed from the stream and placed in a bucket. Each piece removed constituted one of the 20 subsamples. On the stream bank, a rubber sampling band was wrapped around the cobble or gravel with the hole in the band located on the upper surface of the cobble or gravel. The sampling bands were created prior to the first sampling event by cutting a 4.5-centimeter-diameter hole in a bicycle tube and reinforcing the opening with a rubber washer to prevent stretching or tearing. The exposed area of the rock was scrubbed with a small toothbrush, and the loosened material was rinsed into a pan. The pan was then drained into a 1-liter Nalgene bottle containing the composite sample.
PEBBLE PROJECT, ENVIRONMENTAL BASELINE DOCUMENT, 2004 THROUGH 2008
40.2-8 06/27/2011
When mosses and macrophytes were sampled, approximately 16 square centimeters of material were collected from the stream and placed in an empty 1-liter Nalgene bottle. The material was rinsed with a small amount of water, and the bottle was shaken vigorously to dislodge periphyton from the plant material. The rinse water containing periphyton was transferred to the 1-liter Nalgene sample bottle containing the composite sample.
Large substrates were sampled in situ with a 4.5-centimeter-diameter sampling tube of polyvinyl chloride (PVC) and a toothbrush with a head that was modified to fit inside the PVC tube. Foam lining was attached to the PVC tube to create a “seal” when pressed against the large substrate. This assembly isolated a 4.5-centimeter sample area on the boulder or other large substrate from the stream flow. The modified toothbrush was used to scrub the surface of the substrate inside the PVC tube to dislodge the periphyton. The sample area inside the tube was washed with a small amount of water, and a turkey baster was used to draw out the rinse water containing the periphyton for transfer to the composite sample bottle.
Loose sediments (sand and soft sediments) were sampled with 4.5-centimeter-diameter plastic Petri dishes. The open side of the Petri dish was pushed into the substrate and a flat metal spatula was slid under the Petri dish and used to lift the dish and sample out of the water. The substrate was then removed from the Petri dish and placed in an empty 1-liter bottle. A field team member placed a small amount of water in the bottle, capped the bottle, and shook the material vigorously to dislodge the periphyton. Only a few seconds were allowed for the sediment to settle before the rinse water containing the periphyton was transferred into the composite sample bottle.
At the end of the collection process at each site, a 1-liter Nalgene bottle marked with 100-milliliter increments contained the composite sample, which consisted of water-and-periphyton rinsate from all 20 subsamples. Enough ambient stream water was added to bring the volume to the next calibrated marker on the bottle, and this volume was recorded on the data sheet. The composite sample was shaken vigorously for one minute. Immediately after the composite bottle was shaken, enough water was drawn out to fill a 100-milliliter Nalgene bottle, to which two to three drops of Lugol’s solution were added as a preservative. The remaining sample volume was discarded. The 100-milliliter bottles were stored in coolers and were transported to Anchorage by the field team.
Sampling by ADF&G Chlorophyll-a Method, 2005
Periphyton samples were collected from the same riffle/cobble area in the stream reach from which the macroinvertebrate samples were collected by Surber sampler. Care was taken to avoid substrate disturbance in the area being sampled by the other team members. Periphyton was removed from 10 cobbles selected from a riffle/cobble area that had not been disturbed by macroinvertebrate sampling.
Sample collection followed ADF&G methods (ADF&G, 1998). A piece of 5-square-centimeter high-density foam was placed on a cobble. After using a toothbrush to scrub the portions of the cobble not covered by foam, all material was washed from around the foam. A clean toothbrush was used to clean the area under the foam square and the loosened material was rinsed onto a 45-micrometer glass-fiber filter attached to a hand vacuum pump. To the extent possible, water was extracted and one milliliter of saturated magnesium carbonate (MgCO3) solution was added to the filter as a preservative. The dry filter was wrapped in a larger filter to absorb additional water, and the sample was placed it in a zipper-seal bag with silica gel desiccant. Filters were frozen in a lightproof container with desiccant for shipment to Anchorage in care of the HDR field team.
FRESHWATER FISH AND AQUATIC INVERTEBRATES—COOK INLET DRAINAGES
40.2-9 06/27/2011
40.2.6.2 Laboratory Procedures
Diatom Sample Processing, 2004
Periphyton samples collected in 2004 using the EPA RBP method (Barbour et al., 1999) were processed by HDR scientists at Alaska Pacific University facilities. All samples were logged on a tracking sheet and a data-processing sheet.
Acid Digestion. Two 400-milliliter graduated beakers were labeled for each sample. Each sample was then transferred to a beaker. After recording the sample volume, the sample was homogenized with a hand-held blender to thoroughly mix the material and break down large periphyton colonies. The blender and the walls of the beaker were rinsed with deionized (DI) water, with the rinsate becoming part of the sample. The new sample volume was recorded as the “working volume.”
The beaker was then placed on a stirring plate. While the sample was being stirred, 20 milliliters of the sample were withdrawn and placed in a second, labeled 400-milliliter beaker for acid digestion. The remaining material was returned to the original sample bottle for storage.
Samples were digested using 30 milliliters of nitric acid. The beaker was allowed to heat on a hot plate set at 200ºC for two hours. After digestion was complete, a small amount of potassium dichromate was added to the sample to catalyze the reaction. The beaker was allowed to cool.
After completion of the acid digestion, several contributions of DI water were added to slightly increase the pH. The samples were left undisturbed for 12 hours while the diatoms settled in the bottom of the beaker. After the diatoms had settled, the sample was diluted using DI water until the sample pH increased to at least 6.0. Approximately 25 to 50 milliliters of sample were transferred to a 100-milliliter storage vial. This volume was recorded as the diatom volume “after digestion” (Barbour et al., 1999).
Slide Preparation. After all samples were acid-digested, the diatoms were mounted on slides for identification. An initial cover slip was prepared with 10 milliliters of sample water. After the cover slip was dry, the slide was examined with an Olympus CX41 compound microscope under 400 magnification to determine whether the prepared sample had the proper distribution and density of diatoms. If the density of diatoms was too great, a new cover slip was created with less sample material, and the new volume was recorded. If the density was too thin, more sample was added. The volume of material added to the cover slip was recorded as “drip additional.” Some of the slips were remade because of large amounts of sand and silt in the samples.
Naphrax was used for mounting diatom samples to slides. A cover slip with the sample was placed sample-side down on the Naphrax and heated to affix the cover slip to the slide. Slides were labeled with the sample identification code (Barbour et al., 1999).
Identification. Samples mounted on slides by HDR scientists were sent to Scott Rollins of the Michigan State University Algal Ecology Laboratory for identification. Diatom counting and identification began in one corner of each slide and continued along a transect until 600 diatoms were identified on that slide.
PEBBLE PROJECT, ENVIRONMENTAL BASELINE DOCUMENT, 2004 THROUGH 2008
40.2-10 06/27/2011
Chlorophyll-a Sample Processing, 2005
Frozen periphyton samples were shipped from Anchorage to Bill Morris of the Alaska Department of Natural Resources, Office of Habitat Management and Permitting, in Fairbanks for chlorophyll-a analysis. Samples were analyzed with a Shimadzu UVI 601 spectrophotometer. Each sample was inspected, and the general condition was recorded before sample preparation. The sample filter was cut into small pieces and placed in a 15-milliliter centrifuge tube. Chlorophyll was extracted by adding 10 milliliters of a 90-percent solution of spectrophotometric-grade acetone and soaking overnight inside a dark refrigerator. Vials were wrapped in aluminum foil to ensure they remained completely dark during the extraction. On the day following initial preparation, samples were placed in a centrifuge and spun at 1,600 revolutions per minute for 20 minutes. The samples were decanted individually into cuvettes, and absorption values at 750 nanometers, 664 nanometers, 647 nanometers, and 630 nanometers were
recorded. Approximately 0.08 milliliter of 0.1 N hydrochloric acid (HCl) was added to each cuvette, and the samples were allowed to sit in the dark for 90 seconds. Absorption values at 750 and 665 nanometers were recorded (McLean, pers. comm., 2005).
40.2.6.3 Data Analysis
Periphyton results from 2004 and 2005 were analyzed in separate data sets because of differences in sampling and processing methods. The RBP methods used in 2004 were designed to gather information on diatom diversity. The ADF&G chlorophyll-a method used during the 2005 sampling event was designed to determine concentration of chlorophyll-a.
Diatoms
Taxa richness and percent dominant taxon were calculated from the 2004 diatom data. Because only one year of data (2004) was collected, analysis of the data was limited to an examination of spatial variability among sample sites.
Taxa richness was calculated as the total number of taxa, usually genera, identified in a sample. Six-hundred diatoms from each slide-mounted sample were identified to the lowest taxon practicable, and from this list, the sum of all taxa for that station was calculated.
Percent dominant taxon is the portion of the sample represented by the most populous taxon. Percent dominant taxon was calculated for each station by determining which taxon represented the largest number of organisms in the sample and dividing the number of organisms of that taxon by the total number of organisms in the sample.
Chlorophyll-a
The ADF&G-preferred method for analyzing periphyton abundance is to determine chlorophyll-a concentrations (ADF&G, 1998). Chlorophyll-a was reported as milligrams per square meter (mg/m2). A correction factor was sometimes necessary to account for conversion from chlorophyll-a to phaeophyton. This correction factor was applied to the data set as necessary. Because only one year of data (2005) was collected, analysis of the data was limited to an examination of spatial variability among sample sites.
FRESHWATER FISH AND AQUATIC INVERTEBRATES—COOK INLET DRAINAGES
40.2-11 06/27/2011
40.2.7 Results and Discussion
40.2.7.1 Macroinvertebrates
One ASCI sample and 1 drift sample was collected from Y Valley Creek and unnamed creek in 2004. In 2005, 1 ASCI sample and 5 surber samples were collected from Y Valley Creek. As a result of this effort, 36 macroinvertebrate taxa, including 11 Chironomidae taxa, have been identified in the Cook Inlet drainages study area (Tables 40.2-1 and 40.2-2). Of these 36 taxa, 14 were identified only in samples from 2004, 11 were identified only in samples from 2005, and 11 occurred in both years. Samples were collected in different months in 2004 and in 2005, which may account for the differences in taxa collected. Seasonal and annual variability has been documented in other studies in Alaska (HDR, 1999; Major et al., 2000, Merritt and Cummins, 1996).
The results for a series of metrics that describe the macroinvertebrate population at each sample site are provided in Table 40.2-3. The data suggest spatial, temporal, and methodological variability, although sites were almost always dominated by the Chironomidae taxa in the Diptera group. Macroinvertebrate taxa richness was higher in the ASCI samples than in the Surber and the drift samples, possibly due to the ability of the ASCI sampling method to target more variable habitat types along the stream margin. Macroinvertebrate community assemblages were largely driven by Diptera taxa, and in most cases, Chironomidae. Chironomidae Orthocladiinae tended to make up a large percentage of the samples, and of the sensitive EPT category taxa, the Baetidae, Heptageniidae, Chloroperlidae and Brachycentridae families were well represented in the benthic samples. In particular, Baetis and Neaviperla were often found in the surber samples. The presence of such sensitive species is indicative of the relatively optimal conditions at the site for macroinvertebrate colonization (Merritt and Cummins 1996).
Differences in taxa collected may be partially explained by differences in sampling methods between 2004 and 2005. In the 2004 samples at Y Valley Creek, the ASCI method collected 16 taxa while the drift method sampling collected 7 taxa (Table 40.2-3). ASCI sampling collected 7 taxa at the unnamed creek, while drift sampling collected 4 taxa. In the 2005 ASCI samples, 15 taxa were documented at Y Valley Creek; however, for 2005 Surber samples, an average of only 5.4 taxa per sample was documented. (The unnamed creek site was not sampled in 2005.)
A range of habitats was sampled using the ASCI method, while only riffle/cobble habitat was sampled using Surber samplers. The greater taxa richness in ASCI samples (15 to16 taxa), compared to Surber and drift samples (5.4 and 7 taxa, respectively), suggests that most of the macroinvertebrate taxa diversity is to be found in habitats other than riffles (Table 40.2-3). Although macroinvertebrate studies in other regions have documented similar variability (DePauw et al., 2006), there are not enough data from this study area to statistically describe possible trends or relationships with respect to particular variables (e.g., sampling method or timing).
An assessment of parameters related to habitat quality was included in the study. Based on the scores for those parameters, habitat quality was optimal at the unnamed creek and Y Valley Creek sites during all sampling events (Tables 40.2-4 and 40.2-5). Standard water-quality parameters also were measured, and the results were within the optimum range for aquatic life (Hem, 1985; Table 40.2-6). Dissolved oxygen levels at the unnamed creek were slightly supersaturated (100.1%), indicative of the cool temperatures
PEBBLE PROJECT, ENVIRONMENTAL BASELINE DOCUMENT, 2004 THROUGH 2008
40.2-12 06/27/2011
and fast-flowing waters at this site. The sites sampled in this study were located in a pristine area with few to no human-caused effects.
40.2.7.2 Periphyton
One periphyton sample was collected at both Y Valley Creek and the unnamed creek in 2004 and was analyzed for diatom taxa composition. Ten periphyton samples were collected from Y Valley Creek in 2005 and were analyzed for chlorophyll-a content. Results of the diatom identifications indicate that 19 diatom genera were present in samples collected in 2004 in the Cook Inlet drainages study area (Table 40.2-7). In 2005, periphyton samples from Y Valley Creek were analyzed for chlorophyll-a concentrations as a quantifiable measure of productivity. A few samples were potentially compromised by insufficient freezing time for sample preservation. Data could still be extracted from these samples and are reported in this environmental baseline document although the usability of these data is in question. Dedicated freezers for preservation were made available for subsequent sampling.
A set of metrics that describe periphyton was calculated with the methods described in Section 40.2.6.3. Metrics for the 2004 data were based on the taxa identifications. Taxa richness was greater for Y Valley Creek than for the unnamed creek (17 and 8 taxa, respectively). Conversely, the percent dominant taxon was much higher for the unnamed creek than for Y Valley Creek (79 percent and 35 percent, respectively); most of the taxa were representative of the genus Achnanthidium at both sites. The percent dominant taxon in periphyton samples in some instances equaled more than 50 percent, which result is generally considered a negative indicator for stream health (Wehr and Sheath, 2003). However, the stream reaches sampled are considered representative of unimpaired conditions because they are pristine and in a region of minimal human effect; indeed, measurements of water-quality parameters consistently fell within ranges considered good to optimal for aquatic habitat health. These results exhibit the natural variability in these environments.
Concentration of chlorophyll-a (corrected for phaeophyton) was calculated from analysis of samples collected in 2005. The average chlorophyll-a concentration for Y Valley Creek in 2005 was 2.4 mg/m2 (Table 40.2-8). Results are within a normal range, and are comparable to those found recently during the Red Dog Mine monitoring studies (ADF&G 2007).
40.2.8 Summary
Because a relatively small portion of the transportation corridor is located in the Cook Inlet drainages, only two sites, Y Valley Creek and an unnamed creek, were established there for macroinvertebrate and periphyton sampling. One of the sites, the unnamed creek, was dropped from the study after 2004. The stream reaches sampled were pristine and in a region of low or negligible human effect, which is typical of the study area.
Sampling methods also were modified after the 2004 field sampling. Drift-net sampling for macroinvertebrates resulted in low taxa richness and was replaced in 2005 with Surber sampling, with the objective of gathering more quantitative information. For similar reasons, diatom identification of periphyton samples in 2004 was replaced in 2005 with analysis of chlorophyll-a concentrations. Chlorophyll-a concentrations from multiple samples per site provide a more quantitative measure of periphyton productivity.
FRESHWATER FISH AND AQUATIC INVERTEBRATES—COOK INLET DRAINAGES
40.2-13 06/27/2011
Macroinvertebrate taxa richness was higher in the ASCI samples than in the Surber and the drift samples, possibly due to the ability of the ASCI sampling method to target more variable habitat types along the stream margin. Macroinvertebrate community assemblages were largely driven by Diptera taxa, and in most cases, Chironomidae. Of the Diptera taxa, Chironomidae Orthocladiinae tended to make up a large percentage of the samples. Of the sensitive EPT category taxa, the Heptageniidae, Baetidae, Chloroperlidae and Brachycentridae families were well represented in the surber samples. The presence of such sensitive species is indicative of the relatively optimal conditions at the site for macroinvertebrate colonization.
Diatom analysis indicated a diverse set of taxa was present at both sites sampled in 2004, and samples tended to be dominated by the genus Achnanthidium. Average chlorophyll-a concentrations for Y Valley Creek site sampled in 2005 was 2.4, which is within the norm based on other studies in Alaska.
40.2.9 References
Alaska Department of Fish and Game (ADF&G). 1998. Methods for Aquatic Life Monitoring to Satisfy Requirements under 1998 NPDES Permit: NPDES AK-003865-2, Red Dog Mine Site. ADF&G Division of Habitat and Restoration, Fairbanks, Alaska.
Alaska Department of Fish and Game (ADF&G). 2007. Aquatic Biomonitoring at Red Dog Mine, 2007. NPDES Permit AK-003865-2, Red Dog Mine Site. ADF&G Division of Habitat and Restoration, Fairbanks, Alaska.
Barbour, M.T., J. Gerritsen, B.D. Snyder, and J.B. Stribling. 1999. Rapid Bioassessment Protocols for Use in Streams and Wadeable Rivers: Periphyton, Benthic Macroinvertebrates, and Fish. 2nd edition. EPA-841-B-99-002.
Bennett, Shauna. 2001. A Benthic Invertebrate Index of Biological Integrity for Streams in the Bulkley TSA. Prepared by Bio Logic Consulting for Pacific Inland Resources, Bulkley Forest District, BC Environment, and Smithers, BC.
De Pauw, N., W. Gabriels, and P.L.M. Goethals. 2006. “River Monitoring and Assessment Methods Based on Macroinvertebrates.” In: G. Ziglio, M. Siligardi, and G. Flaim, eds., Biological Monitoring of Rivers. West Sussex, England: Wiley Press.
ENRI. 2002. Kodiak Launch Complex, Alaska; 2002 Environmental Monitoring Studies. April QRLV-2 Launch. Prepared for Alaska Aerospace Development Corporation.
HDR Alaska, Inc. 1999. Pogo Gold Project: 1999 Results of Baseline Studies to Support Future Bioassessment of Stream Habitat Quality Using Macroinvertebrate Indicators. Teck-Pogo, Inc., Fairbanks, AK.
Hem, J.D. 1985. Study and Interpretation of the Chemical Characteristics of Natural Water. U.S. Geological Survey Water-supply Paper 2254.
PEBBLE PROJECT, ENVIRONMENTAL BASELINE DOCUMENT, 2004 THROUGH 2008
40.2-14 06/27/2011
Lenat, D.R. 1988. “Water Quality Assessment of Streams Using a Qualitative Collection Method of Benthic Invertebrates.” Journal of the North American Benthological Society. Vol. 7. Pp. 222–233.
Major, E.B., and M.T. Barbour. 2001. The Alaska Stream Condition Index (ASCI): A Modification of the USEPA Rapid Bioassessment Protocols. Prepared for Alaska Department of Environmental Conservation, Anchorage, Alaska.
Major, E., A. Prussian, and D. Rinella. 2000. 1999 Alaska Biological Monitoring and Water Quality Assessment Program Report, Final Report. Prepared by Environment and Natural Resources Institute, University of Alaska Anchorage, for the Alaska Department of Environmental Conservation, Division of Air and Water Quality, Anchorage, Alaska.
McCafferty, W.P. 1998. Aquatic Entomology. Boston, MA: Jones and Bartlett.
McLean, R.F. 2005. Alaska Department of Natural Resources. Letter to Andra Love, HDR. Pebble Copper Periphyton 2005 Analysis.
Merritt, R.W., and K.W. Cummins. 1996. Introduction to Aquatic Insects of North America. Dubuque, IA: Kendall Hunt Publishing Co.
Needham, J.G., and P.R. Needham. 1962. A Guide to the Study of Freshwater Biology. San Francisco, CA: Holden-Day.
Ourso, R.T. 2001. Effects of Urbanization on Benthic Macroinvertebrate Communities in Streams, Anchorage, Alaska. Water-Resources Investigations Report 01-4278.
Parsons, M., and R.H. Norris. 1996. “The Effect of Habitat-Specific Sampling on Biological Assessment of Water Quality Using a Predictive Model.” Freshwater Biology. Vol. 36. Pp. 419–434.
Plafkin, J.L., M.T. Barbour, K.D. Porter, S.K. Gross, and R.M. Hughes. 1989. Rapid Bioassessment Protocols for Use in Streams and Rivers: Benthic Macroinvertebrates and Fish. U.S. Environmental Protection Agency, Office of Water. Washington, D.C.
Wiederholm, T., ed. 1983. “Chironomidae of the Holoarctic Region: Keys and Diagnoses.” Part 1, Larvae in: Entomologica Scandinavica. Supplement 19.
40.2.10 Glossary
Acid digestion—process by which organic material is separated from inorganic material under low pH conditions.
Diatom—microscopic algae with cells that have two separate halves and walls made of silicon.
Epifaunal substrate—material on the streambed used by organisms that live on the bottom of the stream.
Macroinvertebrates—organisms with no backbone and that are large enough to be seen without the aid of a microscope.
FRESHWATER FISH AND AQUATIC INVERTEBRATES—COOK INLET DRAINAGES
40.2-15 06/27/2011
Macrophytes—plants living in lakes, streams, or wetlands and that are large enough to be visible with the naked eye.
Metrics—standards of measurement.
Phaeophyton—a product of chlorophyll degradation that absorbs light at the same wavelength, thereby interfering with measurement of chlorophyll.
Periphyton— micro-algae that attaches to rocks or other solid surfaces.
Taxon (plural: taxa)—a taxonomic category or group, such as a phylum, order, family, genus, or species.

FRESHWATER FISH AND AQUATIC INVERTEBRATES—COOK INLET DRAINAGES
TABLES
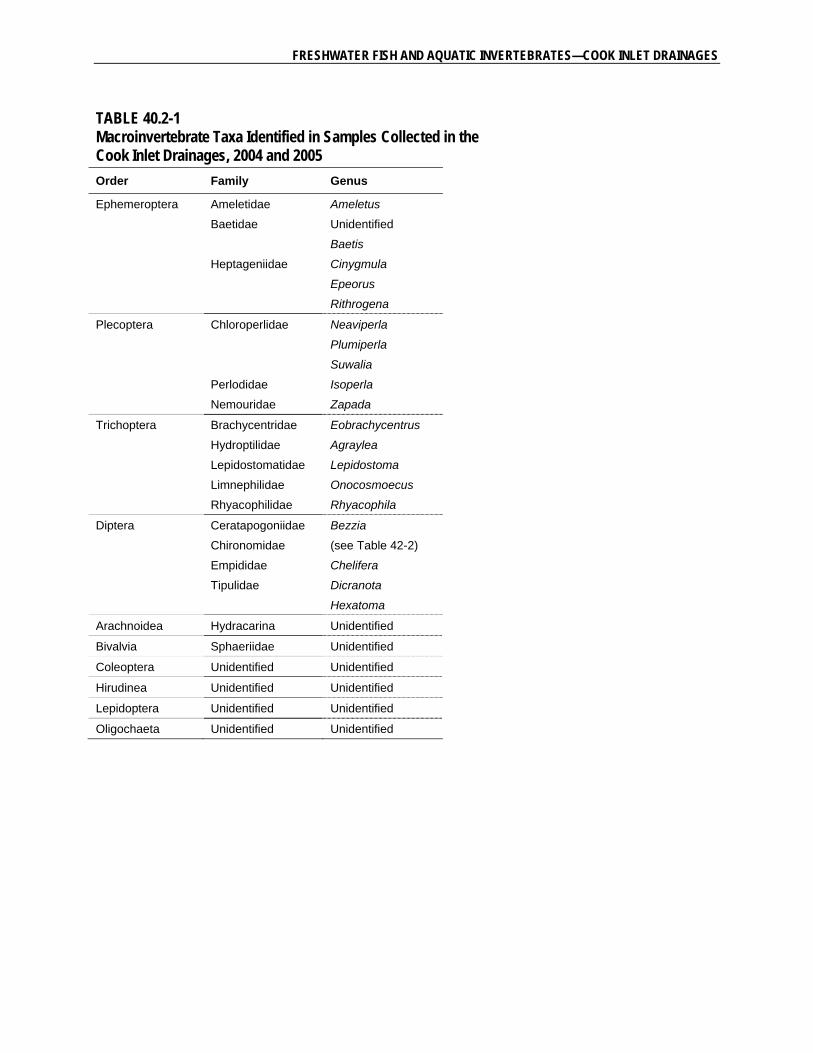
FRESHWATER FISH AND AQUATIC INVERTEBRATES—COOK INLET DRAINAGES
TABLE 40.2-1 Macroinvertebrate Taxa Identified in Samples Collected in the Cook Inlet Drainages, 2004 and 2005
Order Family Genus
Ephemeroptera Ameletidae Ameletus
Baetidae Unidentified
Baetis
Heptageniidae Cinygmula
Epeorus
Rithrogena
Plecoptera Chloroperlidae Neaviperla
Plumiperla
Suwalia
Perlodidae Isoperla
Nemouridae Zapada
Trichoptera Brachycentridae Eobrachycentrus
Hydroptilidae Agraylea
Lepidostomatidae Lepidostoma
Limnephilidae Onocosmoecus
Rhyacophilidae Rhyacophila
Diptera Ceratapogoniidae Bezzia
Chironomidae (see Table 42-2)
Empididae Chelifera
Tipulidae Dicranota
Hexatoma
Arachnoidea Hydracarina Unidentified
Bivalvia Sphaeriidae Unidentified
Coleoptera Unidentified Unidentified
Hirudinea Unidentified Unidentified
Lepidoptera Unidentified Unidentified
Oligochaeta Unidentified Unidentified
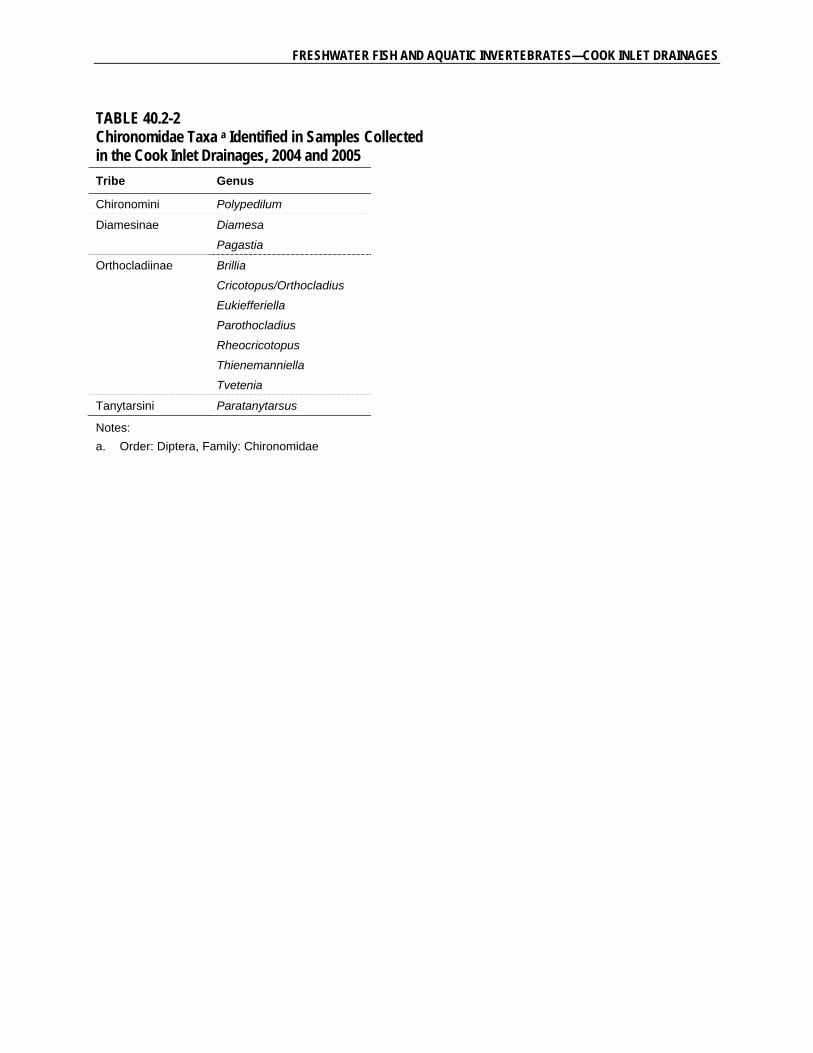
FRESHWATER FISH AND AQUATIC INVERTEBRATES—COOK INLET DRAINAGES
TABLE 40.2-2 Chironomidae Taxa a Identified in Samples Collected in the Cook Inlet Drainages, 2004 and 2005
Tribe Genus
Chironomini Polypedilum
Diamesinae Diamesa
Pagastia
Orthocladiinae Brillia
Cricotopus/Orthocladius
Eukiefferiella
Parothocladius
Rheocricotopus
Thienemanniella
Tvetenia
Tanytarsini Paratanytarsus
Notes:
a. Order: Diptera, Family: Chironomidae
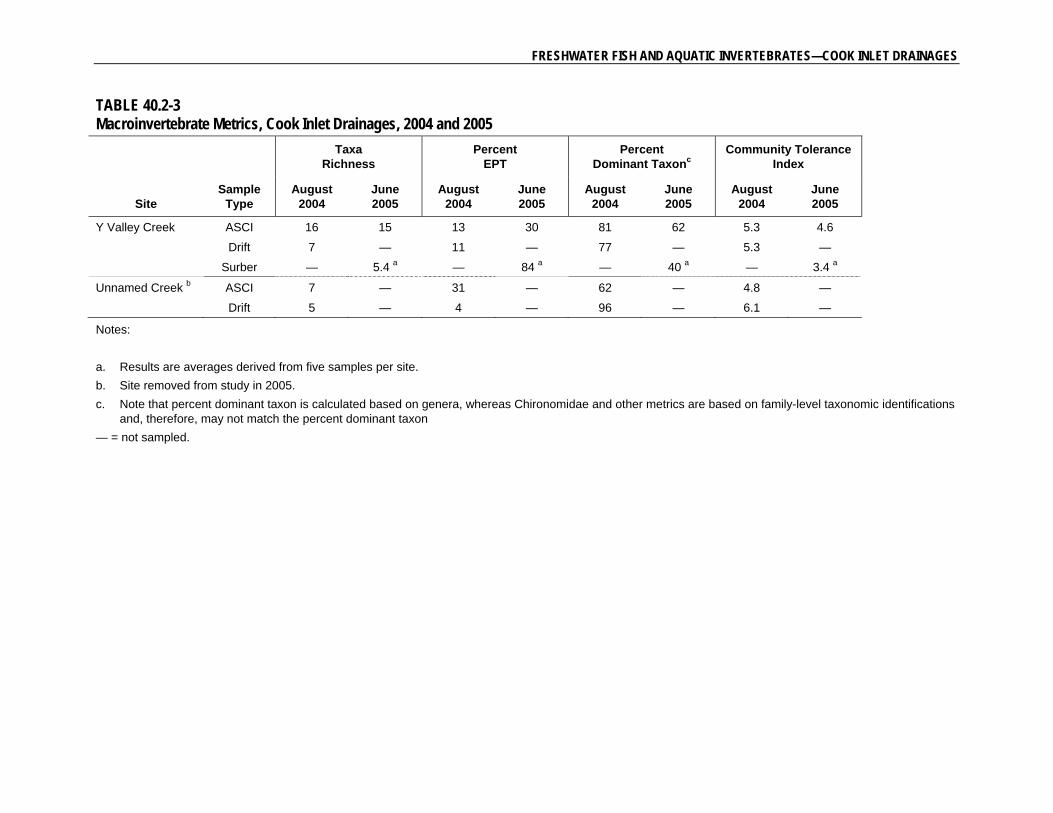
FRESHWATER FISH AND AQUATIC INVERTEBRATES—COOK INLET DRAINAGES
TABLE 40.2-3 Macroinvertebrate Metrics, Cook Inlet Drainages, 2004 and 2005
Taxa
Richness Percent
EPT Percent
Dominant Taxonc Community Tolerance
Index
Site Sample
Type August
2004 June 2005
August 2004
June 2005
August 2004
June 2005
August 2004
June 2005
Y Valley Creek ASCI 16 15 13 30 81 62 5.3 4.6
Drift 7 — 11 — 77 — 5.3 —
Surber — 5.4 a — 84 a — 40 a — 3.4 a
Unnamed Creek b ASCI 7 — 31 — 62 — 4.8 —
Drift 5 — 4 — 96 — 6.1 —
Notes:
a. Results are averages derived from five samples per site.
b. Site removed from study in 2005.
c. Note that percent dominant taxon is calculated based on genera, whereas Chironomidae and other metrics are based on family-level taxonomic identifications and, therefore, may not match the percent dominant taxon
— = not sampled.
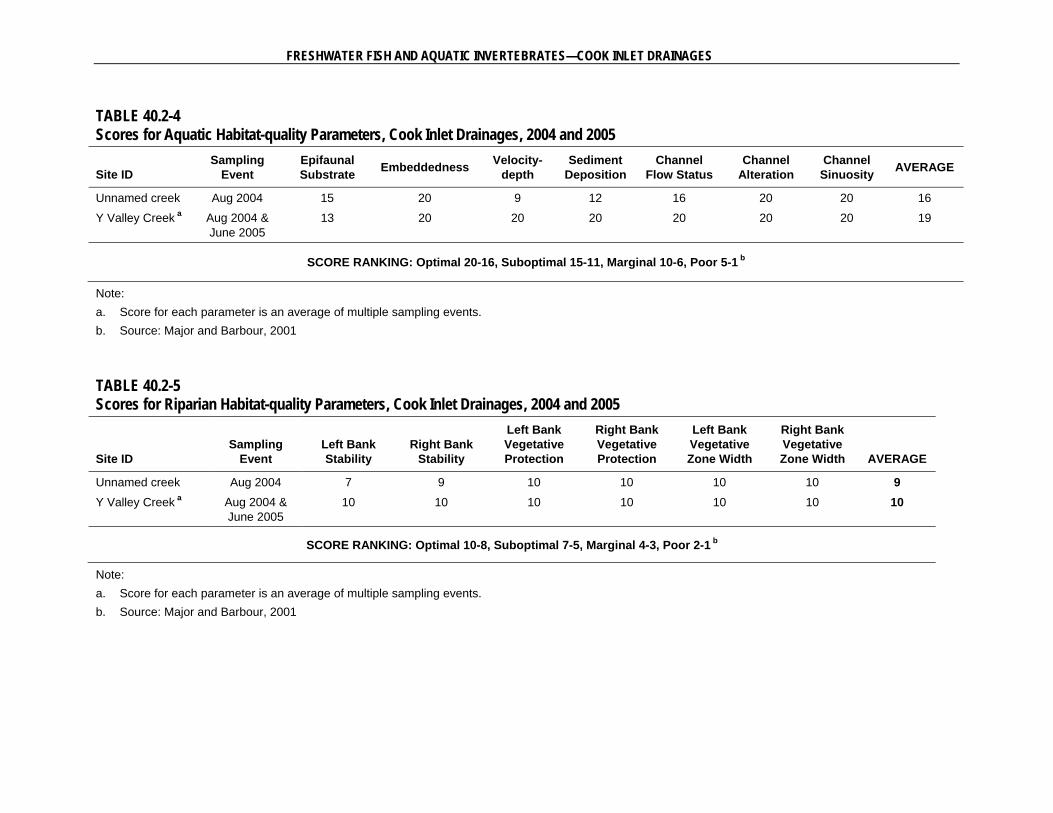
FRESHWATER FISH AND AQUATIC INVERTEBRATES—COOK INLET DRAINAGES
TABLE 40.2-4 Scores for Aquatic Habitat-quality Parameters, Cook Inlet Drainages, 2004 and 2005
Site ID Sampling
Event Epifaunal Substrate
Embeddedness Velocity-
depth Sediment
Deposition Channel
Flow Status Channel
Alteration Channel Sinuosity
AVERAGE
Unnamed creek Aug 2004 15 20 9 12 16 20 20 16
Y Valley Creek a Aug 2004 & June 2005
13 20 20 20 20 20 20 19
SCORE RANKING: Optimal 20-16, Suboptimal 15-11, Marginal 10-6, Poor 5-1 b
Note:
a. Score for each parameter is an average of multiple sampling events.
b. Source: Major and Barbour, 2001
TABLE 40.2-5 Scores for Riparian Habitat-quality Parameters, Cook Inlet Drainages, 2004 and 2005
Site ID Sampling
Event Left Bank Stability
Right Bank Stability
Left Bank Vegetative Protection
Right Bank Vegetative Protection
Left Bank Vegetative Zone Width
Right Bank Vegetative Zone Width AVERAGE
Unnamed creek Aug 2004 7 9 10 10 10 10 9
Y Valley Creek a Aug 2004 & June 2005
10 10 10 10 10 10 10
SCORE RANKING: Optimal 10-8, Suboptimal 7-5, Marginal 4-3, Poor 2-1 b
Note:
a. Score for each parameter is an average of multiple sampling events.
b. Source: Major and Barbour, 2001
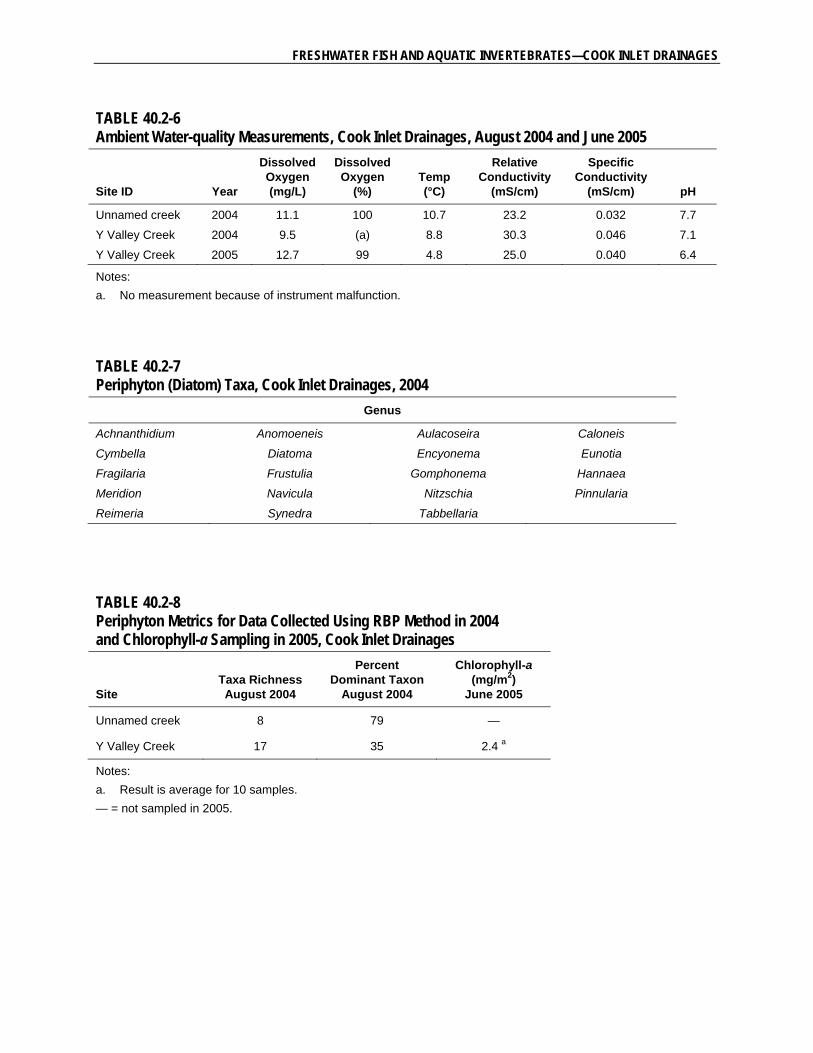
FRESHWATER FISH AND AQUATIC INVERTEBRATES—COOK INLET DRAINAGES
TABLE 40.2-6 Ambient Water-quality Measurements, Cook Inlet Drainages, August 2004 and June 2005
Site ID Year
Dissolved Oxygen (mg/L)
Dissolved Oxygen
(%) Temp (°C)
Relative Conductivity
(mS/cm)
Specific Conductivity
(mS/cm) pH
Unnamed creek 2004 11.1 100 10.7 23.2 0.032 7.7
Y Valley Creek 2004 9.5 (a) 8.8 30.3 0.046 7.1
Y Valley Creek 2005 12.7 99 4.8 25.0 0.040 6.4
Notes:
a. No measurement because of instrument malfunction.
TABLE 40.2-7 Periphyton (Diatom) Taxa, Cook Inlet Drainages, 2004
Genus
Achnanthidium Anomoeneis Aulacoseira Caloneis
Cymbella Diatoma Encyonema Eunotia
Fragilaria Frustulia Gomphonema Hannaea
Meridion Navicula Nitzschia Pinnularia
Reimeria Synedra Tabbellaria
TABLE 40.2-8 Periphyton Metrics for Data Collected Using RBP Method in 2004 and Chlorophyll-a Sampling in 2005, Cook Inlet Drainages
Site Taxa Richness August 2004
Percent Dominant Taxon
August 2004
Chlorophyll-a (mg/m2)
June 2005
Unnamed creek 8 79 —
Y Valley Creek 17 35 2.4 a
Notes:
a. Result is average for 10 samples.
— = not sampled in 2005.
FRESHWATER FISH AND AQUATIC INVERTEBRATES—COOK INLET DRAINAGES
FIGURE
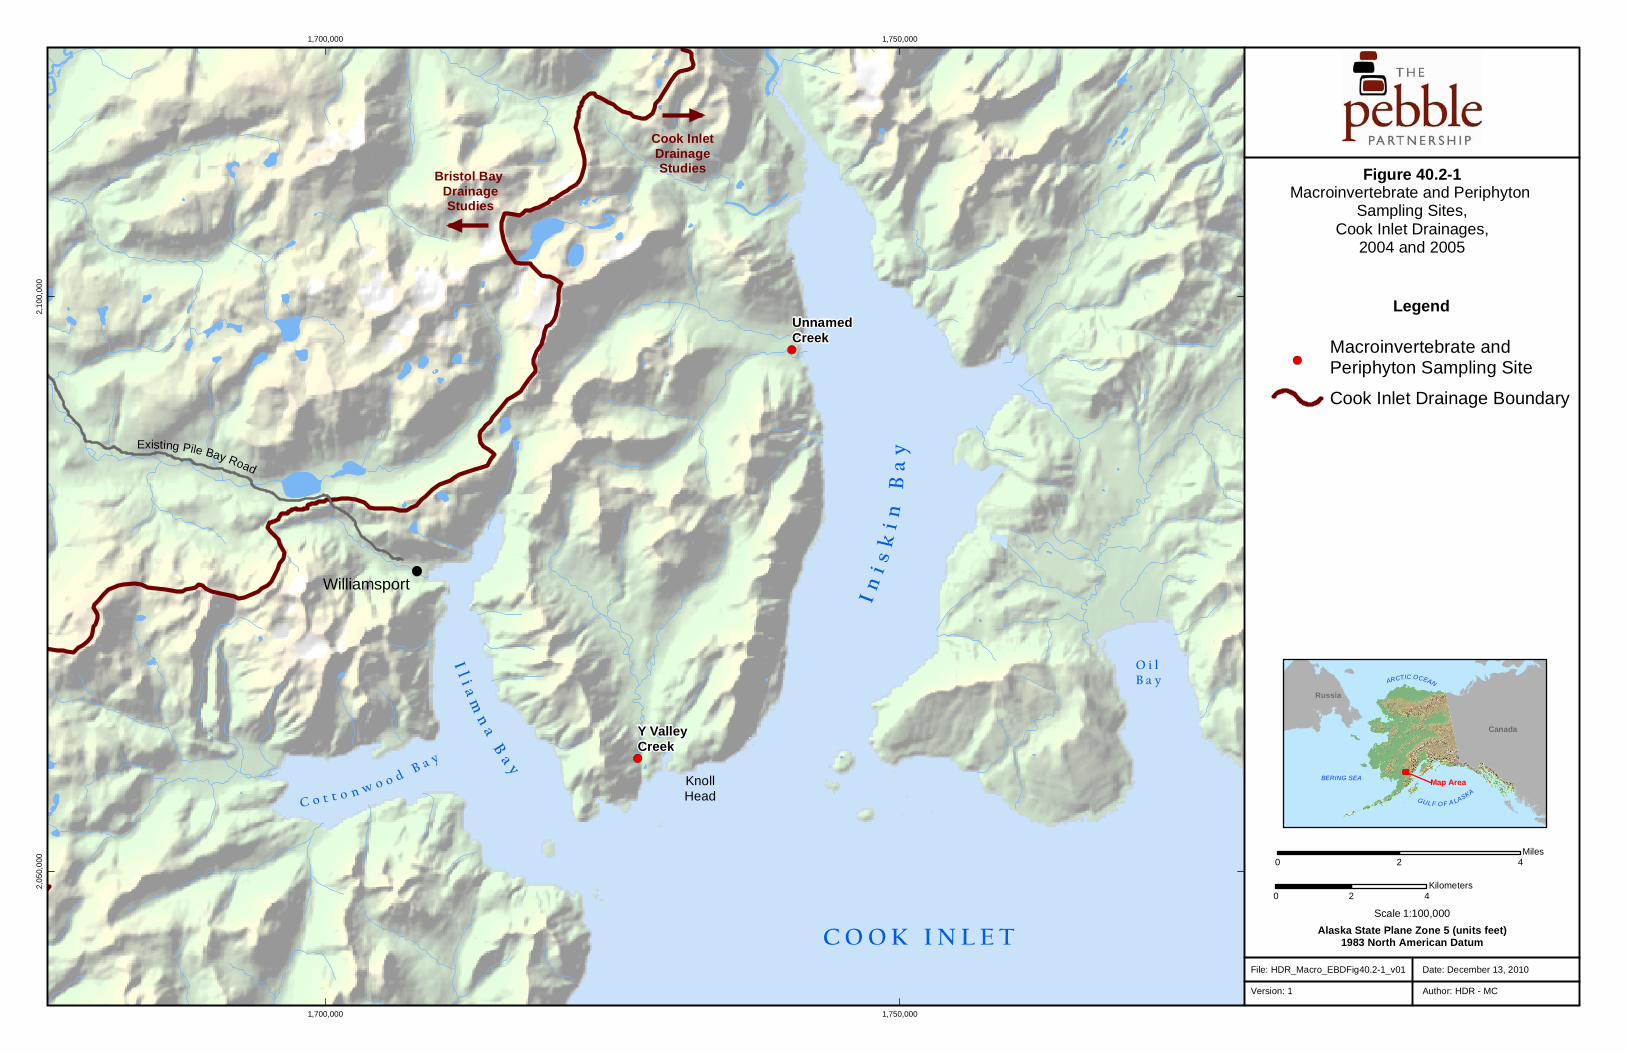
!(
!(
KnollHead
Y ValleyCreek
UnnamedCreek
1,700,000
1,700,000
1,750,000
1,750,000
2,0
50
,00
02,
10
0,0
00
Alaska State Plane Zone 5 (units feet)1983 North American Datum
Date: December 13, 2010
Author: HDR - MC
File: HDR_Macro_EBDFig40.2-1_v01
Version: 1
Figure 40.2-1Macroinvertebrate and Periphyton
Sampling Sites,Cook Inlet Drainages,
2004 and 2005
Legend
0 2 4Miles
1:100,000Scale
0 2 4Kilometers �
!(Macroinvertebrate and Periphyton Sampling Site
Cook Inlet Drainage Boundary
C O O K I N L E T
Canada
ARCTIC OCEAN
Map Area
GUL F O F A LASKA
Russia
BERING SEA
In
i sk
in
Ba
y
Il i a
mn
a B
ay
C o t t o n w o o d B a y
Existing Pile Bay Road
O i lB a y
Williamsport
Bristol Bay DrainageStudies
Cook InletDrainageStudies