
PEBB Survey 2012
32
Overview of results from the 2012 PEBB BRFSS Survey of State Employees Results presented on December 18, 2012 to the Public Employees’ Benefit Board (PEBB) Board Meeting Stacey Schubert, MPH [email protected], phone: 971/673-1099 Health Promotion and Chronic Disease Prevention, Oregon Public Health Division Bdatt.6_PEBB2012BRFSS20121218
-
Upload
statesman-journal -
Category
Documents
-
view
216 -
download
0
Transcript of PEBB Survey 2012
7/30/2019 PEBB Survey 2012
http://slidepdf.com/reader/full/pebb-survey-2012 1/32
Overview of results from the
2012 PEBB BRFSSSurvey of State Employees
Results presented on December 18, 2012 to the
Public Employees’ Benefit Board (PEBB) Board Meeting
Stacey Schubert, MPH
[email protected], phone: 971/673-1099Health Promotion and Chronic Disease Prevention,
Oregon Public Health Division
Bdatt.6_PEBB2012BRFSS20121218

7/30/2019 PEBB Survey 2012
http://slidepdf.com/reader/full/pebb-survey-2012 2/32
What is the “BRFSS?”
• Stands for “Behavioral Risk Factor Surveillance System”(pronounced \ 'bur fus\)
• Cross-sectional telephonic survey of Oregon adults
• Conducted continuously since 1988• Questions about health behaviors, risk factors and chronic
diseases
• Mainstay of chronic disease surveillance
Bdatt.6_PEBB2012BRFSS20121218

7/30/2019 PEBB Survey 2012
http://slidepdf.com/reader/full/pebb-survey-2012 3/32
What is the “BRFSS Surveyof State Employees?”
• Designed and supported by OEBB, PEBB and PublicHealth Division
• Contains questions on:
– Demographics – Chronic diseases
– Risk behaviors
– Worksite policies and environments that can influencehealthful choices
Bdatt.6_PEBB2012BRFSS20121218

7/30/2019 PEBB Survey 2012
http://slidepdf.com/reader/full/pebb-survey-2012 4/32
What is the “BRFSS Survey
of State Employees?”• Initial surveying was started in 2005.
• Have now added 2007, 2009 and 2012.
• OEBB members added as an analysis group in 2009
• PEBB members include employees of: – State agencies
– Oregon University System
Bdatt.6_PEBB2012BRFSS20121218

7/30/2019 PEBB Survey 2012
http://slidepdf.com/reader/full/pebb-survey-2012 5/32
Who was surveyed?
• Inclusion Criteria:
– Employees as of March 2, 2012
• Exclusion Criteria:
– Excludes retirees and people receiving insurance post-employment (COBRA)
– Missing or incomplete residential telephone number
Bdatt.6_PEBB2012BRFSS20121218

7/30/2019 PEBB Survey 2012
http://slidepdf.com/reader/full/pebb-survey-2012 6/32
What were survey
respondents like?
Bdatt.6_PEBB2012BRFSS20121218

7/30/2019 PEBB Survey 2012
http://slidepdf.com/reader/full/pebb-survey-2012 7/32
Respondent Demographics
Worksite Type Proportion ofRespondents
State agencies 70%
Oregon University System 30%
Total 100%
Bdatt.6_PEBB2012BRFSS20121218

7/30/2019 PEBB Survey 2012
http://slidepdf.com/reader/full/pebb-survey-2012 8/32
Respondent Demographics
Demographic Factor 2012 PEBB
Mean age 48 yrs old
Women 56%
Now pregnant 5%
Latino/a 4%
Income > $50K
74%College Grad 66%
Data on this slide are unweighted and not age-adjusted
Bdatt.6_PEBB2012BRFSS20121218

7/30/2019 PEBB Survey 2012
http://slidepdf.com/reader/full/pebb-survey-2012 9/32
Respondent Demographics by
EmployerOUS Agencies
Mean age 47 yrs 49 yrs
Women 52% 58%
Now pregnant 5% 5%
Latino/a 4% 4%
Income > $50K
74% 74%College Grad 83% 55%
Data on this slide are unweighted and not age-adjusted
Bdatt.6_PEBB2012BRFSS20121218

7/30/2019 PEBB Survey 2012
http://slidepdf.com/reader/full/pebb-survey-2012 10/32
What are
the results?
Bdatt.6_PEBB2012BRFSS20121218

7/30/2019 PEBB Survey 2012
http://slidepdf.com/reader/full/pebb-survey-2012 11/32
How the Results are Organized
• 2007, 2009 and 2012 PEBB• 2012 PEBB versus 2011 employed and insured
Oregon adults
• Among 2012 PEBB: – Oregon University System versus State agencies
– male versus female
11
Bdatt.6_PEBB2012BRFSS20121218

7/30/2019 PEBB Survey 2012
http://slidepdf.com/reader/full/pebb-survey-2012 12/32
Protective Factors: Overall
Screening Type 2007PEBB
2009PEBB
2012PEBB 2011
Oregon
Mammogram <2 yr ago (50-74year old women)
88% 85% 86% 86%
Pap test <3 yr ago (21-65 yearold women)
92% 93% 94% 85%
Appropriate colorectal cancerscreening (50-75)
N/A 69% 75% 58%
Eat 5+ servings of fruits andvegetables per day
25% 26% 31% 25%
Bdatt.6_PEBB2012BRFSS20121218

7/30/2019 PEBB Survey 2012
http://slidepdf.com/reader/full/pebb-survey-2012 13/32
Protective Factors by Employer
Screening Type OUS Agencies
Mammogram <2 yr ago (50-74 year old women) 85% 86%
Pap test <3 yr ago (21-65 year old women) 95% 94%
Appropriate colorectal cancer screening (50-75) 77% 74%
Eat 5+ servings of fruits and vegetables per day 35% 28%
Bdatt.6_PEBB2012BRFSS20121218

7/30/2019 PEBB Survey 2012
http://slidepdf.com/reader/full/pebb-survey-2012 14/32
Protective Factors by Sex
Screening Type PEBBMen
PEBBWomen
Mammogram <2 yr ago (50-74 year old women) N/A 86%
Pap test <3 yr ago (21-65 year old women) N/A 94%
Appropriate colorectal cancer screening (50-75) 75% 75%
Eat 5+ servings of fruits and vegetables per day 27% 34%
Routine checkup in past year 54% 65%
Bdatt.6_PEBB2012BRFSS20121218

7/30/2019 PEBB Survey 2012
http://slidepdf.com/reader/full/pebb-survey-2012 15/32
Risk Factors: Overall
Risk Factor 2007
PEBB
2009PEBB
2012PEBB
2011Oregon
Heavy Drinker N/A 5% 4% 7%
Binge Drinker N/A 16% 15% 19%
Current Smoker 10% 9% 4% 16%
No leisure time physical activity N/A N/A 5% 15%
Mostly sitting at work N/A N/A 81% 52%
* Estimate is unreliable and should be interpreted with caution
Bdatt.6_PEBB2012BRFSS20121218

7/30/2019 PEBB Survey 2012
http://slidepdf.com/reader/full/pebb-survey-2012 16/32
Risk Factors by Employer
Risk Factor OUS Agencies
Heavy Drinker 5% 3%
Binge Drinker 15% 14%
Current Smoker 3% 4%
No leisure time physical activity 4% 6%
Mostly sitting at work 77% 84%
* Estimate is unreliable and should be interpreted with caution
Bdatt.6_PEBB2012BRFSS20121218

7/30/2019 PEBB Survey 2012
http://slidepdf.com/reader/full/pebb-survey-2012 17/32
Risk Factors by Sex
Risk Factor PEBBMen
PEBB
Women
Heavy Drinker 2% 5%
Binge Drinker 17% 12%
Current Smoker 4% 4%
No leisure time physical activity 5% 6%
Mostly sitting at work 74% 88%
Bdatt.6_PEBB2012BRFSS20121218

7/30/2019 PEBB Survey 2012
http://slidepdf.com/reader/full/pebb-survey-2012 18/32
Precursors of Chronic Disease:Overall
Risk Factor 2007
PEBB 2009PEBB
2012PEBB 2011
Oregon
High blood pressure 22% 24% 20% 24%
High cholesterol 30% 31%
27% 31%
Overweight 35% 35% 33% 40%
Obese 30% 28% 24% 24%
Overweight or obese 65% 63% 57% 64%
Bdatt.6_PEBB2012BRFSS20121218

7/30/2019 PEBB Survey 2012
http://slidepdf.com/reader/full/pebb-survey-2012 19/32
Precursors of Chronic Disease
by EmployerRisk Factor OUS Agencies
High blood pressure 16% 23%
High cholesterol 26% 28%
Overweight 30% 36%
Obese 18% 28%
Overweight or obese 48% 64%
Bdatt.6_PEBB2012BRFSS20121218

7/30/2019 PEBB Survey 2012
http://slidepdf.com/reader/full/pebb-survey-2012 20/32
Precursors of Chronic Disease
by SexRisk Factor
PEBBMen
PEBBWomen
High blood pressure 24% 16%
High cholesterol 30% 25%
Overweight 40% 27%
Obese 24% 24%
Overweight or obese 64% 51%
Bdatt.6_PEBB2012BRFSS20121218
7/30/2019 PEBB Survey 2012
http://slidepdf.com/reader/full/pebb-survey-2012 21/32
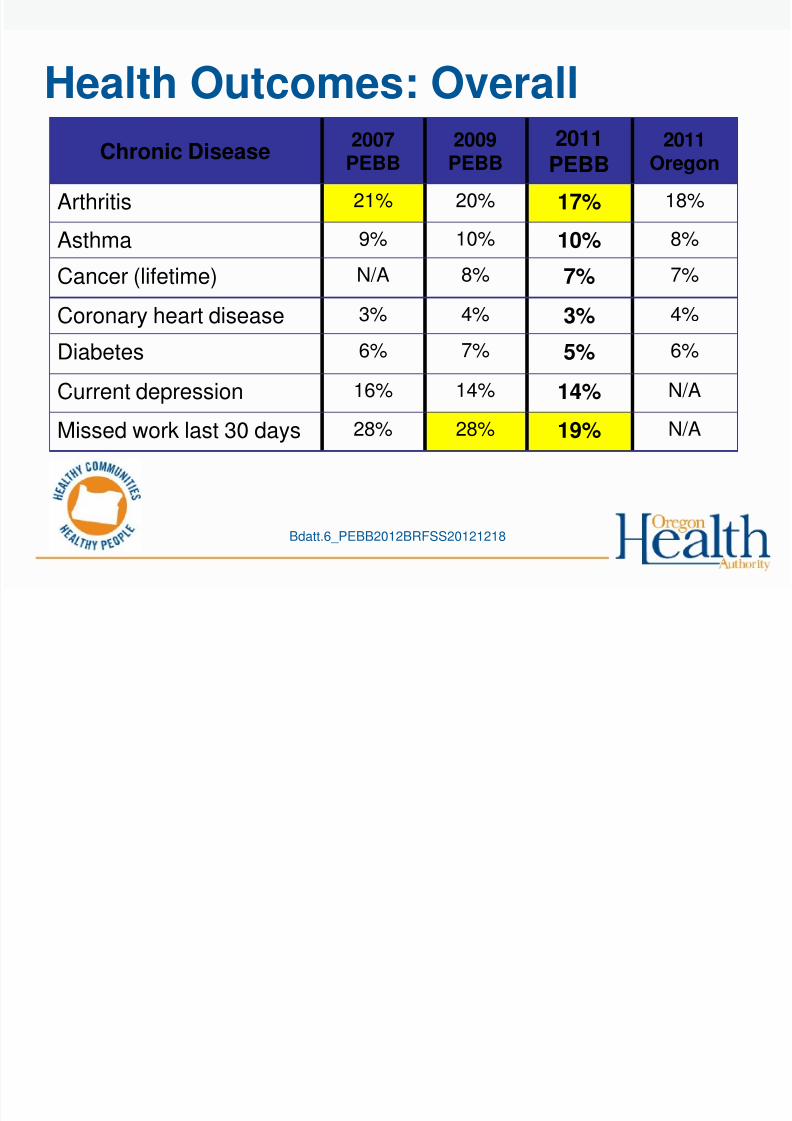
Health Outcomes: Overall
Chronic Disease 2007PEBB
2009PEBB
2011PEBB 2011
Oregon
Arthritis 21% 20% 17% 18%
Asthma 9% 10% 10% 8%
Cancer (lifetime) N/A 8% 7% 7%
Coronary heart disease 3% 4% 3% 4%
Diabetes 6% 7% 5% 6%
Current depression 16% 14% 14% N/A
Missed work last 30 days 28% 28% 19% N/A
Bdatt.6_PEBB2012BRFSS20121218

7/30/2019 PEBB Survey 2012
http://slidepdf.com/reader/full/pebb-survey-2012 22/32
Health Outcomes by Employer
Chronic Disease OUS Agencies
Arthritis 14% 20%
Asthma 10% 11%
Cancer (lifetime) 7% 7%
Coronary heart disease 3% 3%
Diabetes 4% 6%
Current depression 13% 15%
Missed work last 30 days 14% 22%
Bdatt.6_PEBB2012BRFSS20121218

7/30/2019 PEBB Survey 2012
http://slidepdf.com/reader/full/pebb-survey-2012 23/32
Health Outcomes by Sex
Chronic Disease PEBBMen
PEBBWomen
Arthritis 14% 20%
Asthma 8% 13%
Cancer (lifetime) 6% 7%
Coronary heart disease 6% 1%*
Diabetes 5% 6%
Current depression 7% 20%
Missed work last 30 days 12% 24%
* Estimate is unreliable and should be interpreted with caution
Bdatt.6_PEBB2012BRFSS20121218

7/30/2019 PEBB Survey 2012
http://slidepdf.com/reader/full/pebb-survey-2012 24/32
Weight Management and Loss
Weight-related behaviors 2007PEBB
2009PEBB
2012PEBB
Trying to lose or maintain weight 89% 91% 90%
Exercise for weight 79% 81% 90%
Reduce calories or fat for weight 79% 81% 76%
Been advised to lose N/A 18% 13%
Bdatt.6_PEBB2012BRFSS20121218

7/30/2019 PEBB Survey 2012
http://slidepdf.com/reader/full/pebb-survey-2012 25/32
Weight Management and Loss
Weight-related behaviors 2012PEBB
Overall participation in weight-managementbenefit through PEBB in past year
19%
Participation among obese*
30%Participation among overweight* 17%
Participation among healthy weight* 10%
Participation among men 10%
Participation among women 26%
Data on this slide are weighted but not age-adjusted
* BMI as determined from weight one year earlier
Bdatt.6_PEBB2012BRFSS20121218

7/30/2019 PEBB Survey 2012
http://slidepdf.com/reader/full/pebb-survey-2012 26/32
Worksite Environment: Activity
Worksite Conditions Related to Physical Activity
2012
PEBB
Mostly sitting at work 81%
Free parking at worksite 41%
Stairs that can be easily used 83%
Bike racks at worksite 83%Gym or workout equipment at worksite 48%
Discounted public transit 55%
Have flextime for PA 54%
Among those who have it, use flextime for PA 55%Think it is easy to get physical activity on work days 57%
7/30/2019 PEBB Survey 2012
http://slidepdf.com/reader/full/pebb-survey-2012 27/32
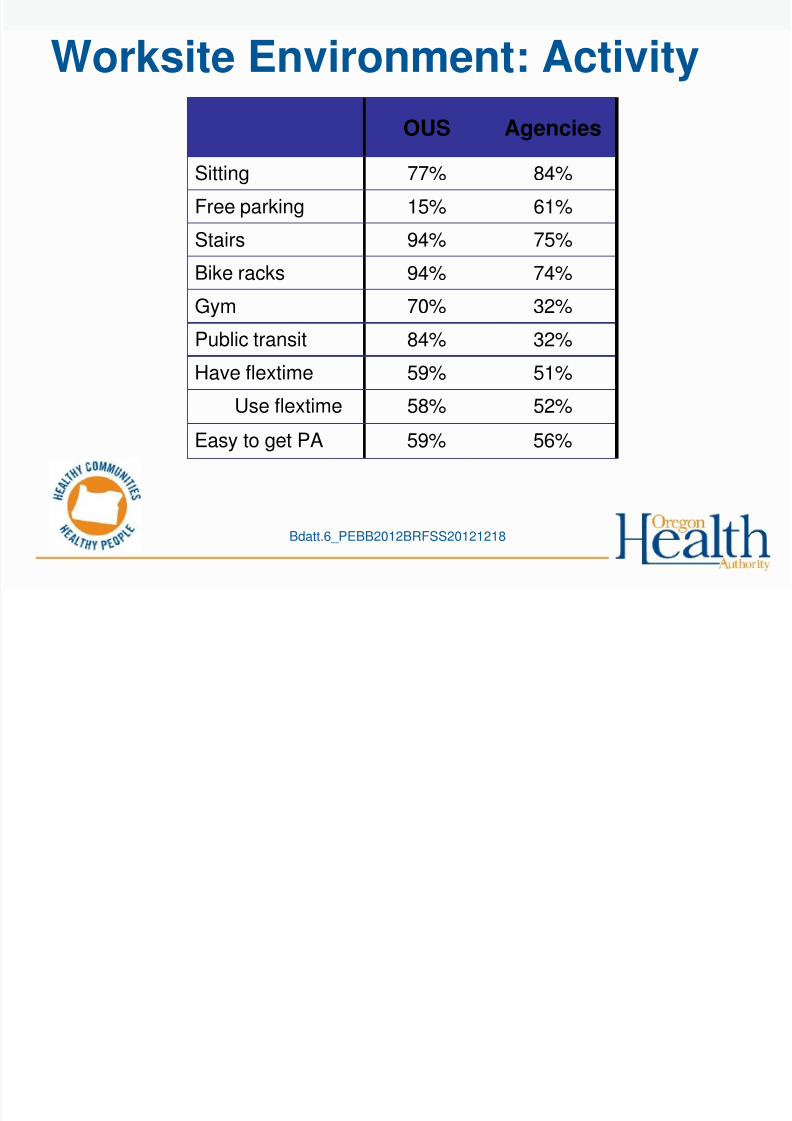
Worksite Environment: Activity
OUS Agencies
Sitting 77% 84%
Free parking 15% 61%
Stairs 94% 75%
Bike racks 94% 74%Gym 70% 32%
Public transit 84% 32%
Have flextime 59% 51%
Use flextime 58% 52%
Easy to get PA 59% 56%
Bdatt.6_PEBB2012BRFSS20121218

7/30/2019 PEBB Survey 2012
http://slidepdf.com/reader/full/pebb-survey-2012 28/32
Worksite Environment: Food
Worksite Conditions Related to Food 2012
PEBB
Vending machines at worksite 75%
Vending machines offer healthy options 27%
Cafeteria at worksite 47%
Choose a healthy option when eating at cafeteria 72%Food is labeled to ID calorie, fat or sodium 53%
Candy dishes in public places 52%
Think it is easy to eat healthy foods on work days 84%
Bdatt.6_PEBB2012BRFSS20121218

7/30/2019 PEBB Survey 2012
http://slidepdf.com/reader/full/pebb-survey-2012 29/32
Worksite Environment: Food
OUS Agencies
Vending machines 70% 79%
Vending healthyoptions
24% 30%
Cafeteria 62% 36%
Choose healthyoption
76% 70%
Food is labeled 60% 48%
Candy dishes 48% 54%
Easy to eat healthy 87% 82%
Bdatt.6_PEBB2012BRFSS20121218

7/30/2019 PEBB Survey 2012
http://slidepdf.com/reader/full/pebb-survey-2012 30/32
Worksite Environment: Smoking
Worksite Conditions Related to Tobacco Use 2012
PEBB
Think employees are following smoking rules atworksite
89%
Have seen smoking on grounds of worksite 80%
Perceive secondhand smoke as harmful 97%
Bdatt.6_PEBB2012BRFSS20121218
7/30/2019 PEBB Survey 2012
http://slidepdf.com/reader/full/pebb-survey-2012 31/32
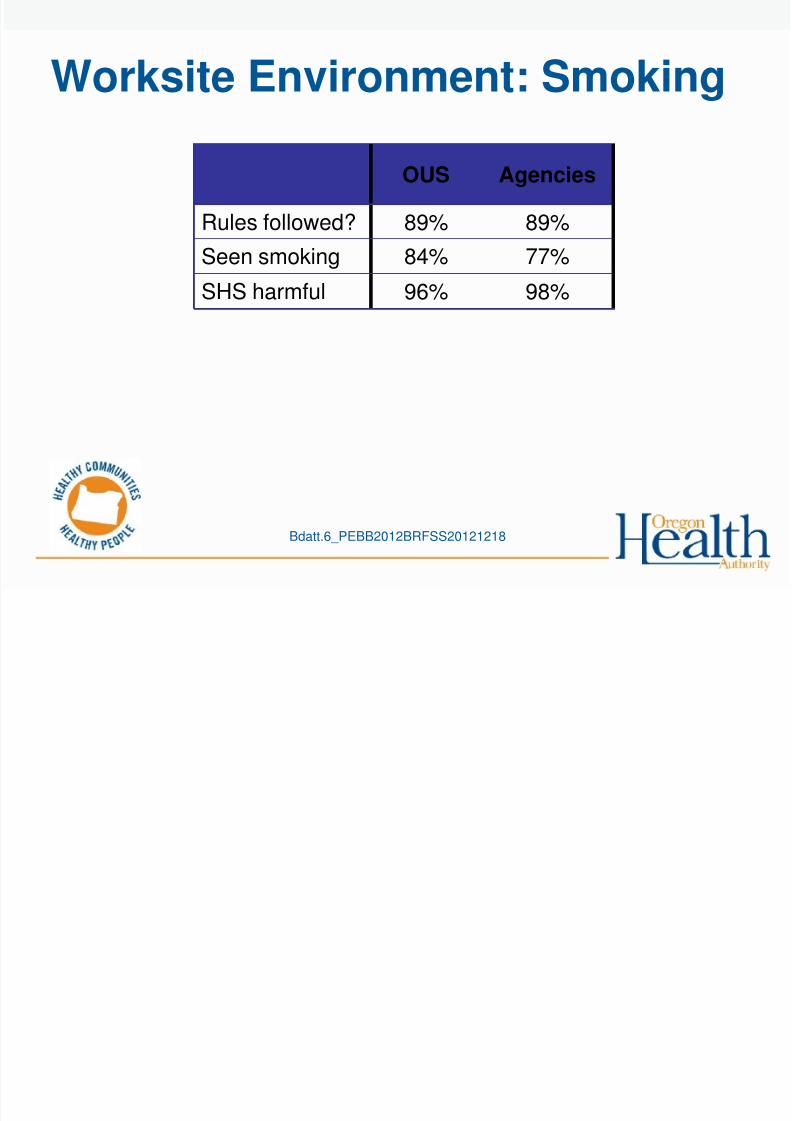
Worksite Environment: Smoking
OUS Agencies
Rules followed? 89% 89%
Seen smoking 84% 77%
SHS harmful 96% 98%
Bdatt.6_PEBB2012BRFSS20121218

7/30/2019 PEBB Survey 2012
http://slidepdf.com/reader/full/pebb-survey-2012 32/32
Thank youStacey Schubert, MPH
[email protected], phone: 971/673-1099
Health Promotion and Chronic Disease Prevention,
Oregon Public Health Division
Bdatt.6_PEBB2012BRFSS20121218


