Peace Project Water Use Plan - BC Hydro - Power smart 2015 Peace Project Water Use Plan Williston...
138
February 2015 Peace Project Water Use Plan Williston Trial Tributaries Implementation Year 4 Reference: GMSMON-17 Study Period: April 2014 to March 2015 DWB Consulting Services Ltd. 1579 9 th Avenue Prince George, BC and Cooper Beauchesne and Associates Ltd. Northern Interior Office Suite 1, 1257 4 th Avenue Prince George, BC
Transcript of Peace Project Water Use Plan - BC Hydro - Power smart 2015 Peace Project Water Use Plan Williston...

February 2015
Peace Project Water Use Plan Williston Trial Tributaries Implementation Year 4 Reference: GMSMON-17
Study Period: April 2014 to March 2015 DWB Consulting Services Ltd.
1579 9th Avenue Prince George, BC and
Cooper Beauchesne and Associates Ltd. Northern Interior Office Suite 1, 1257 4th Avenue Prince George, BC
GMSMON‐17: Williston Trial TributariesYear 4 – Final Report
Report submitted to:
BC Hydro, Water License Requirements Attn: Toby Jones, Natural Resource Specialist
Submitted by:
Prince George Office Northern Interior Office 1579 9th Avenue Suite 1, 1257 4th Avenue Prince George, BC Prince George, BC
BC Hydro 2015 GMSMON 17 Williston Tributaries – Year 4 Report
DWB Consulting Services Ltd. Cooper Beauchesne and Associates Ltd.
ii
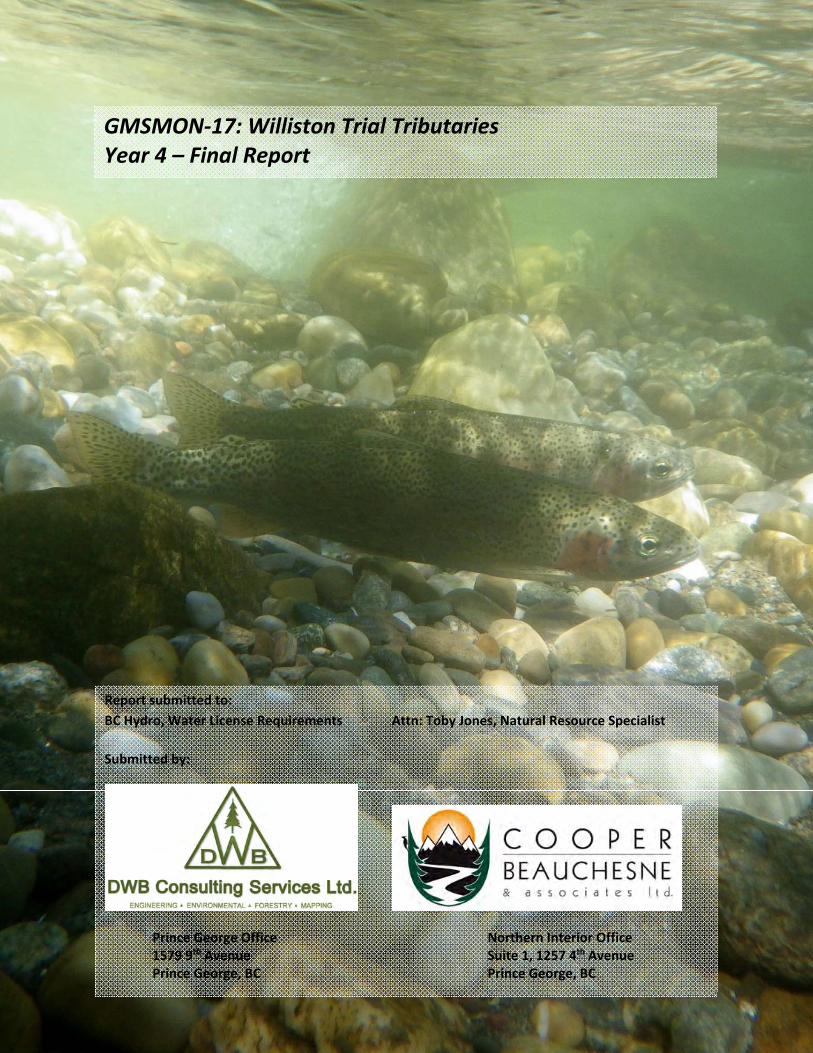
Suggested Citation: MacInnis, A.J., M.D. Thompson, J. Laframboise, A. Carson, and C. Craig. 2015. GMSMON-17: Williston Trial Tributaries, Year 4 – Draft Report. Unpublished report by DWB Consulting Services Ltd. and Cooper Beauchesne and Associates Ltd., Prince George, BC, for BC Hydro Generation, Water Licence Requirements, Burnaby, BC. x + 71pp. + Appendices. Keywords: Peace Water Use Plan, Tributary Access Management Plan, Williston Reservoir, fish, fish habitat, riparian vegetation, amphibians, songbirds, waterfowl, shorebirds, tributary demonstration sites Cover photo: Spawning Rainbow Trout in Lamonti Creek, Williston Reservoir tributary; June 26, 2014. Photo © N. Shaw, DWB Consulting Services Ltd. © 2015 BC Hydro No part of this publication may be reproduced, stored in a retrieval system, or transmitted, in any form or by means, electronic, mechanical, photocopying, recording, or otherwise, without prior permission from BC Hydro, Burnaby, BC.
BC Hydro 2015 GMSMON 17 Williston Tributaries – Year 4 Report
DWB Consulting Services Ltd. Cooper Beauchesne and Associates Ltd.
iii
EXECUTIVE SUMMARY Reservoir operations have created large unproductive areas within the drawdown zone of Williston Reservoir. The low productivity of this habitat limits the area’s capacity to support fish and fish access to tributaries may be restricted at low reservoir levels. Fish access to tributaries is considered to be potentially restricted by debris accumulations at tributary mouths or by the exposure of barriers to fish passage at low water levels. To address these impacts, the Williston Tributary Access Management Plan was developed within the Peace Water Use Plan to improve tributary access through management of debris and alterations to stream morphology in the drawdown zone (Anon. 2003). An inventory of potential enhancement sites was completed under GMSWORKS-19 Williston Reservoir Trial Tributaries. The final site selection identified one site in the Finlay Arm (Ole Creek) with debris impacts and one site in the Parsnip Reach (Six Mile Creek) with drawdown impacts. The GMSMON-17 project is a 10-year monitoring program to assess the effectiveness of the demonstration tributary enhancement projects at improving fish access to the selected tributaries. The focus of the effectiveness monitoring program is to determine the response of fish and selected indicator groups to the tributary enhancements. Fish, vegetation, amphibians, and birds were identified as the indicator groups for effectiveness monitoring with the focus on changes in fish diversity and abundance. This report presents the results from the fourth year of monitoring under GMSMON-17. The results provide a combination of additional baseline information and initial post-construction observations following completion of both enhancement project during the Year 4 (2014) monitoring period. Remote collection of water level, water temperature, and air temperature data continued from the stream gauging stations on Six Mile and Ole Creeks. Manual discharge measurements were completed for both creeks on three separate occasions to allow for development of the stage-discharge curve for each stream. Environmental conditions in Year 4 were generally similar to Year 3 except for the lower water levels in July and August as a result of well below average precipitation. Fish monitoring completed in Year 4 included habitat mapping of the drawdown zone reaches, fish sampling in the drawdown zone reaches, Rainbow Trout spawner surveys, juvenile fish population estimation by mark-resight, and fry surveys. Habitat mapping was completed on all streams prior to completion of the enhancement works and was supplemented by high resolution orthophotos. Fish species identified in the drawdown reaches included Bull Trout, Rainbow Trout, Slimy Sculpin, and Prickly Sculpin. Rainbow Trout were observed spawning in Lamonti Creek representing the first spawning observations in the study. The only other observation in the spawner survey was a pair of adult Rainbow Trout in Six Mile Creek. More fish were captured or observed in Year 4 during the mark-resight component than in previous years. The increase in sample size improved the population estimates. Density estimates were similar to those from previous years. Rainbow trout fry were only observed in Six Mile Creek despite the spawning observations in Lamonti Creek. Cooler water temperatures in Lamonti Creek may have resulted in later emergence of fry. Vegetation mapping in Year 4 identified nine habitat classes and one non-vegetated (open water) habitat class at the four sites. The vegetation communities were similar at all sites and had similar distributions in the drawdown zone. Vegetation mapping also identified seven enhancement classes at the Six Mile and Ole Creek sites. No vegetation was observed on the enhancement structures except for planted live willow cuttings and some annual ryegrass on

BC Hydro 2015 GMSMON 17 Williston Tributaries – Year 4 Report
DWB Consulting Services Ltd. Cooper Beauchesne and Associates Ltd.
iv
seeded areas. The baseline data collected in Year 4 provides a better characterization of the vegetation types at the four study sites in comparison to vegetation data collected in previous years More amphibian species were observed in Year 4 compared to previous years. All species known to occur in the region were detected. The CPUE values were comparable to previous years. However, the refined plot and transect survey methods showed that amphibians were not randomly distributed and cluster into identifiable habitats. The enhancement works at Six Mile and Ole Creeks may have had a direct impact on amphibian habitat. The impact was potentially negative at Ole Creek through removal of debris and potentially positive at Six Mile Creek through water level stabilization at an important wetland site. The refinements to the amphibian survey methods in Year 4 will assist in monitoring changes in the relative abundance and diversity in terms of habitat use, age classes, body condition, and spatial ecology. The numbers of songbirds and waterbirds detected during the surveys in 2014 was relatively low with the highest number of species and detections at Six Mile Creek. Waterfowl and shorebird species detected included Common Merganser, a Goldeneye species, Common Loon and Spotted Sandpiper. The low numbers of species detected within the survey circles was likely due to the lack of habitat (vegetation) for songbirds at the survey points, which were located along the streams near the enhancement works within the drawdown zone. As the enhancement works, including planted vegetation, were recently completed, avian use of these areas may increase in future years. Additionally, the information collected in these surveys will increase the knowledge base for songbird and waterbird use of the drawdown zone and adjacent areas in Williston Reservoir. The additional baseline data and initial post-construction observations collected in Year 4 of the GMSMON-17 project was generally consistent with previous years. At the two control sites (Lamonti and Factor Ross Creeks) the data contributes to the existing baseline data at these two sites. Construction of the two the tributary access enhancement projects (Six Mile and Lamonti Creeks) was completed during field data collection in Year 4. The data collected from these two sites is a combination of both baseline and initial post-construction observations. Construction activities may have had some influence on the data collected for all indicator groups (fish, vegetation, amphibians, and birds) and this will need to be considered in future analyses to assess the effectiveness of the projects.

BC Hydro 2015 GMSMON 17 Williston Tributaries – Year 4 Report
DWB Consulting Services Ltd. Cooper Beauchesne and Associates Ltd.
v
MANAGEMENT SUMMARY: STATUS OF GMSMON-17 MANAGEMENT QUESTIONS AND HYPOTHESES – YEAR 4
Management Question Management Hypothesis (Null) Year 4 (2014) Status
Does fish abundance and diversity in tributaries increase as a result of enhancement?
H01
: Fish abundance and diversity in
tributaries does not increase as a result of tributary enhancement;
Testing of this hypothesis is not yet possible as both tributary enhancement projects were just completed in spring 2014. Year 5 will be the first year of post-construction monitoring.
Is the area and quality of fish habitat created by the tributary enhancement maintained over time?
H02
: Total rearing area for fish does
not increase following enhancement to tributaries
Testing of this hypothesis is not yet possible as both tributary enhancement projects were just completed in spring 2014. Year 5 will be the first year of post-construction monitoring.
Does riparian vegetation along tributaries increase in abundance and diversity as a result of enhancement?
H03
: Riparian vegetation abundance
and diversity along the tributaries does not increase following enhancement to tributaries;
Testing of this hypothesis is not yet possible as both tributary enhancement projects were just completed in spring 2014. Year 5 will be the first year of post-construction monitoring.
Does abundance and diversity of song birds (passerines) around tributaries change as a result of enhancement?
H06
: Song bird abundance and
diversity near tributaries does not increase following tributary enhancement.
Testing of this hypothesis is not yet possible as both tributary enhancement projects were just completed in spring 2014. Year 5 will be the first year of post-construction monitoring.
Does abundance and diversity of waterfowl and shorebirds around tributaries change as a result of enhancement?
H07: Waterfowl and shorebird
abundance and diversity near tributaries does not change following tributary enhancement.
Testing of this hypothesis is not yet possible as both tributary enhancement projects were just completed in spring 2014. Year 5 will be the first year of post-construction monitoring.
Does amphibian abundance and diversity in tributaries change as a result of enhancement?
H04
: Amphibian abundance and
diversity in and near tributaries does not change following tributary enhancement
Testing of this hypothesis is not yet possible as both tributary enhancement projects were just completed in spring 2014. Year 5 will be the first year of post-construction monitoring.
Does tributary enhancement change the area and quality of amphibian breeding habitat over time? If so, is the area and quality maintained over time?
H05
: Total amphibian breeding area
does not change following enhancement
Testing of this hypothesis is not yet possible as both tributary enhancement projects were just completed in spring 2014. Year 5 will be the first year of post-construction monitoring.

BC Hydro 2015 GMSMON 17 Williston Tributaries – Year 4 Report
DWB Consulting Services Ltd. Cooper Beauchesne and Associates Ltd.
vi
ACKNOWLEDGEMENTS A number of people have contributed to completion of Year 4 of the GMSMON-17 project. BC Hydro WLR sponsored the project. Ongoing guidance and support was provided by Mike McArthur and Toby Jones. Field work was completed by DWB and CBA staff. Fish sampling was completed by Jesse Laframboise (DWB), Nathan Shaw (DWB), Clayton Smith (DWB), and Vicki Prigmore (CBA). Vegetation sampling and mapping was completed by Allan Carson (CBA). Amphibian surveys were led by Mark Thompson (DWB). Songbird, waterfowl, and shorebird surveys were completed by Catherine Craig (CBA) with assistance from Allan Carson (CBA). The hydrological analyses (rating curves) were completed by Emily Cheung P.Eng. (DWB). Andrew MacInnis (CBA Senior Fisheries Biologist) was Project Manager with assistance from Mark Thompson (DWB Senior Ecologist) the Assistant Project Manager. Additional field work support was provided by Chu Cho Environmental Services, a company owned by the Tsay Keh Dene Nation. Chu Cho Environmental staff that provided assistance in Year 4 were Mike Tilson, Nathan French, and Stephen Friesen. High resolution orthophotos and digital elevation models for Six Mile and Ole Creeks were provided by JR Canadian Mapping Ltd using data obtained using their UAV (unmanned aerial vehicle). The report was written by Andrew MacInnis, Mark Thompson, Jesse Laframboise, Allan Carson, and Catherine Craig.

BC Hydro 2015 GMSMON 17 Williston Tributaries – Year 4 Report
DWB Consulting Services Ltd. Cooper Beauchesne and Associates Ltd.
vii
TABLE OF CONTENTS Executive Summary ...................................................................................................................... iii Management Summary: Status of GMSMON-17 Management Questions and Hypotheses – Year 4 ............................................................................................................................................ v Acknowledgements ....................................................................................................................... vi 1 Introduction ............................................................................................................................ 1
1.1 Background ..................................................................................................................... 1 1.2 Monitoring Plan Overview ............................................................................................... 1
2 Management Questions and Hypotheses .............................................................................. 2 3 Study Area ............................................................................................................................. 3 4 Methods ................................................................................................................................. 6
4.1 Environmental Conditions ............................................................................................... 6 4.2 Fish Surveys ................................................................................................................... 7
4.2.1 Tributary Access Assessment and Fish Habitat ...................................................... 7 4.2.2 Drawdown Zone Fish Sampling ............................................................................... 7 4.2.3 Spawner Surveys ..................................................................................................... 8 4.2.4 Juvenile Fish Surveys .............................................................................................. 9 4.2.5 Fry Surveys ............................................................................................................ 11 4.2.6 Data Analysis ......................................................................................................... 11
4.3 Vegetation Surveys ....................................................................................................... 12 4.4 Amphibian Surveys ....................................................................................................... 14
4.4.1 Terrestrial Surveys ................................................................................................. 15 4.4.2 Wetland Surveys .................................................................................................... 16 4.4.3 Amphibian Data Analysis ....................................................................................... 17
4.5 Songbird and Waterfowl Surveys .................................................................................. 17 4.6 Data Entry and Analysis ................................................................................................ 18
5 Results ................................................................................................................................. 18 5.1 Environmental Conditions ............................................................................................. 18 5.2 Fish Surveys ................................................................................................................. 25
5.2.1 Tributary Access Assessment and Fish Habitat .................................................... 25 5.2.2 Drawdown Zone Fish Sampling ............................................................................. 28 5.2.3 Spawner Surveys ................................................................................................... 29 5.2.4 Juvenile Fish Surveys ............................................................................................ 31 5.2.5 Fry Surveys ............................................................................................................ 38
5.3 Vegetation Surveys ....................................................................................................... 39 5.4 Amphibian Surveys ....................................................................................................... 49 5.5 Songbird and Waterbird Surveys .................................................................................. 53
6 Discussion ............................................................................................................................ 55 6.1 Environmental Conditions ............................................................................................. 56 6.2 Fish ............................................................................................................................... 56
6.2.1 Tributary Access and Fish Habitat ......................................................................... 56 6.2.2 Drawdown Zone Fish Sampling ............................................................................. 58 6.2.3 Spawner Surveys ................................................................................................... 58 6.2.4 Juvenile and Small-Bodied Fish Survey ................................................................ 59 6.2.5 Fry Surveys ............................................................................................................ 60 6.2.6 Fish Communities .................................................................................................. 61
6.3 Vegetation ..................................................................................................................... 62 6.4 Amphibians ................................................................................................................... 63 6.5 Songbirds and Waterbirds ............................................................................................ 66
BC Hydro 2015 GMSMON 17 Williston Tributaries – Year 4 Report
DWB Consulting Services Ltd. Cooper Beauchesne and Associates Ltd.
viii
7 Conclusions .......................................................................................................................... 66 8 Literature Cited ..................................................................................................................... 68 LIST OF TABLES Table 1. Location and installation details for satellite-enabled stream gauging stations. .......... 6 Table 2. Location of stream mouth photo reference sites and reference photo direction. ........ 7 Table 3. Dates and drawdown zone stream length sampled at the four sites in 2014. ............. 8 Table 4. Spawning survey details. ............................................................................................. 9 Table 5. Surveyed elevations for stream-gauging stations. .................................................... 25 Table 6. Catch per unit effort (CPUE) during drawdown zone electrofishing in Six Mile,
Lamonti, Ole, and Factor Ross Creeks in 2014. .................................................................. 30 Table 7. Conditions during spring 2014 Rainbow Trout spawner surveys in Williston Reservoir
study tributaries. ................................................................................................................... 30 Table 8. Summary of results from the 2014 Rainbow Trout spawning surveys. ..................... 31 Table 9. Catch-per-unit-effort (CPUE) during electrofishing in the Parsnip reach sites (Six Mile
and Lamonti Creeks) in 2012, 2013, and 2014. ................................................................... 33 Table 10. Catch-per-unit-effort (CPUE) during electrofishing in the Finlay Reach sites (Ole
and Factor Ross Creeks) in 2012, 2013, and 2014. ............................................................ 34 Table 11. Catch-per-unit-effort (CPUE = number of fish/100m2) during snorkel surveys in the
Parsnip Reach sites (Six Mile and Lamont Creeks) in 2012, 2013, and 2014. .................... 35 Table 12. Catch-per-unit-effort (CPUE = number of fish/100m2) during snorkel surveys in the
Finlay Reach sites (Ole and Factor Ross Creeks) in 2012, 2013, and 2014. ...................... 36 Table 13. Mark-resight data used for fish abundance estimates for four Williston Reservoir
Tributaries in 2014. Data only includes tagged fish (first sample) and observations of those species while snorkeling (second sample). .......................................................................... 37
Table 14. Bayesian population estimates compared to night snorkeling observations and Petersen mark-recapture estimates from mark-resight data in 2014. .................................. 37
Table 15. Comparison of Bayesian populations estimates based on mark-resight data for four Williston Reservoir tributaries in 2012, 2013, and 2014. ...................................................... 38
Table 16. Comparison of estimated capture probabilities from Bayesian mark-resight model for four Williston Reservoir tributaries in 2012, 2013, and 2014. ......................................... 38
Table 17. Summary of the fry surveys on Six Mile, Lamonti, Ole and Factor Ross Creeks in 2014. 39
Table 18. Habitat classification summary for enhancement and reference sites in Year 4. .. 40 Table 19. Number of polygons and area for habitat classes identified during photo
interpretation for enhancement and reference sites in Year 4. Refer to Appendix for detailed descriptions of the habitat classes. ...................................................................................... 41
Table 20. Enhancement classification summary for Six Mile and Ole Creek sites in Year 4. 46 Table 21. Number of polygons and area for enhancement classes identified during photo
interpretation for Six Mile and Ole Creeks in Year 4. Refer to Appendix for detailed descriptions of the enhancement classes. ........................................................................... 47
Table 22. Site characteristics for vegetation transects sampled at enhancement and reference sites in Year 4. ..................................................................................................... 48
Table 23. Vegetation cover for vegetation transects sampled at the tributary enhancement and control sites in Year 4. ................................................................................................... 49
Table 24. Comparison of amphibian species detections among sites and years (1 = detected, - = not detected). .................................................................................................................. 50
Table 25. Summary of the amphibian search effort and CPUE at four Williston Reservoir tributaries in 2011, 2012, 2013, and 2014. ........................................................................... 51

BC Hydro 2015 GMSMON 17 Williston Tributaries – Year 4 Report
DWB Consulting Services Ltd. Cooper Beauchesne and Associates Ltd.
ix
Table 27. Summary of all songbird, waterfowl, and shorebird detections at Six Mile, Lamonti, Ole, and Factor Ross Creeks in the 2014 surveys. .............................................................. 54
Table 28. The status of the GMSMON-17 management questions and hypotheses following completion of Year 4 of the monitoring program. ................................................................. 55
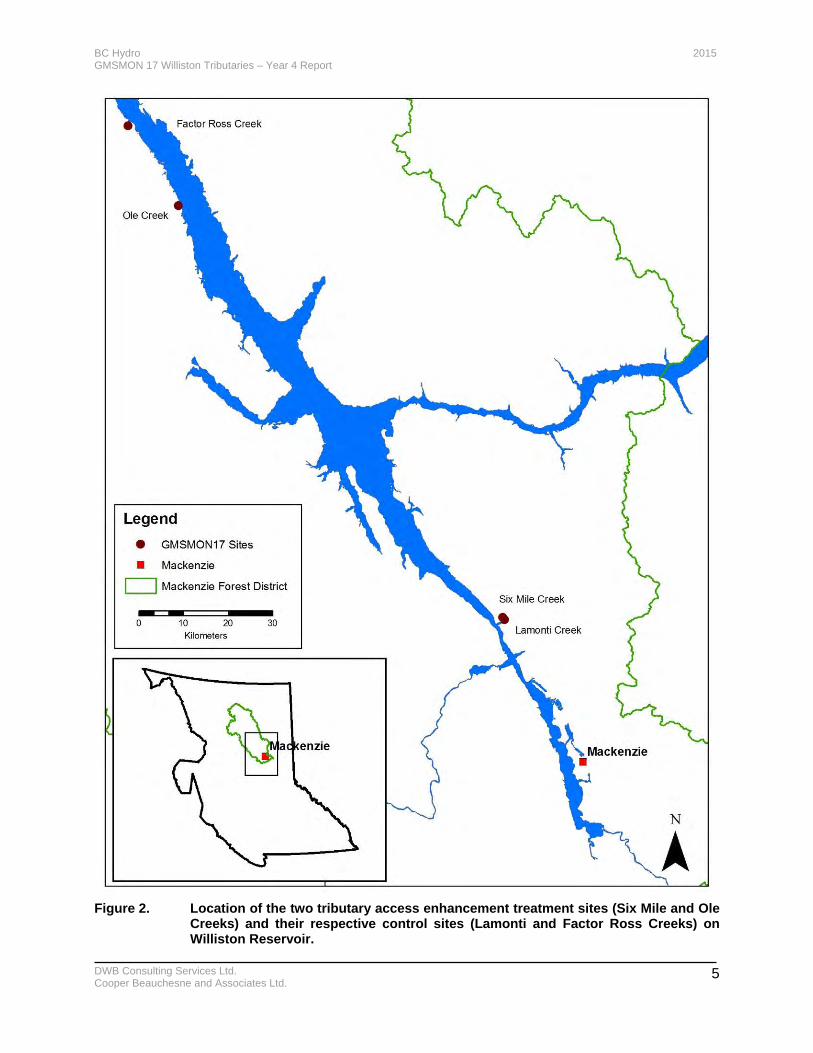
LIST OF FIGURES Figure 1. Annual Williston Reservoir levels for 2011 -2014. ....................................................... 4 Figure 2. Location of the two tributary access enhancement treatment sites (Six Mile and Ole
Creeks) and their respective control sites (Lamonti and Factor Ross Creeks) on Williston Reservoir. ............................................................................................................................... 5
Figure 3. Belt-line quadrat transect for a sample site laid out adjacent to the riparian area. .... 14 Figure 4. Snow water equivalent for the first four years of the project from the Pine Pass
(Station 4A02P) automated snow pillow monitoring station (data obtained from the BC River Forecast Centre). ................................................................................................................. 19
Figure 5. Snow water equivalent for the first four years of the project from the Aiken Lake (Station 4A30P) automated snow pillow monitoring station (data obtained from the BC River Forecast Centre). ................................................................................................................. 19
Figure 6. Daily mean water level at the Six Mile Creek gauging station in 2013 and 2014. ..... 20 Figure 7. Daily mean water level at the Ole Creek gauging station in 2013 and 2014. ............ 21 Figure 8. Total monthly precipitation during the first four years of the project and the long
term averages in the study region. Data from Environment Canada and observed at the Mackenzie Airport weather station (Station names: Mackenzie A and Mackenzie Airport Auto). 21
Figure 9. Daily mean air temperature at Six Mile Creek in 2013 and 2014. Average temperature at the Mackenzie Airport included for reference (Environment Canada). ........ 22
Figure 10. Daily mean air temperature at Ole Creek in 2013 and 2014. Average temperature at the Mackenzie Airport included for reference (Environment Canada). ............................ 23
Figure 11. Daily mean water temperature in Six Mile Creek in 2013 and 2014. ..................... 23 Figure 12. Daily mean water temperature in Ole Creek in 2013 and 2014. ............................ 24 Figure 13. Habitat classes and transect locations at Six Mile Creek. ..................................... 42 Figure 14. Habitat classes and transect locations at Lamonti Creek. ..................................... 43 Figure 15. Habitat classes and transect locations at Ole Creek. ............................................ 44 Figure 16. Habitat classes and transect locations at Factor Ross Creek. .............................. 45 Figure 17. Comparative histograms showing snout-to-vent length classes relative to the
number of individuals captured at each site. Data for 2014 is further classified into time of survey. Species codes: AMMA = long-toed salamander, LISY = wood frog, RALU = Columbia spotted frog, ANBO = western toad. .................................................................... 52

BC Hydro 2015 GMSMON 17 Williston Tributaries – Year 4 Report
DWB Consulting Services Ltd. Cooper Beauchesne and Associates Ltd.
x
LIST OF APPENDICES Appendix 1. Photos of the Six Mile and Ole Creek stream gauging stations in May 2014. ... 72 Appendix 2. Rating curves and stage-discharge tables for Six Mile and Ole Creeks. ........... 73 Appendix 3. 2014 photos from the photo monitoring points on Six Mile, Lamonti, Ole, and
Factor Ross Creeks. ............................................................................................................ 76 Appendix 4. Drawdown zone stream habitat maps for Six Mile, Lamonti, Ole, and Factor
Ross Creeks. ........................................................................................................................ 81 Appendix 5. Spawning survey results from June 23-26, 2014 from the four Williston Reservoir
tributaries. 86 Appendix 6. Locations of sample sites for electrofishing and night snorkel surveys for juvenile
fish abundance in Six Mile, Lamonti, Ole, and Factor Ross Creeks in 2014. ...................... 89 Appendix 7. Summary of the night-time fry surveys at four tributaries of Williston Reservoir in
2014. Site refers to the number of the adjacent snorkeling site. .......................................... 98 Appendix 8. Locations of vegetation belt-transects. ............................................................. 100 Appendix 9. Habitat class descriptions in the draw-down zone at enhancement and control
sites. 101 Appendix 10. Enhancement class descriptions in the draw-down zone at enhancement and
reference sites. ................................................................................................................... 111 Appendix 11. Photographs illustrating vegetation transects at enhancement sites. .............. 118 Appendix 12. Photographs illustrating vegetation transects at reference sites. ..................... 119 Appendix 13. Summary of percent cover by plant species averaged across 10 quadrats in a 20
m belt-transect for vegetation transects sampled in Year 4 at enhancement and reference sites. 121
Appendix 14. Amphibian survey plots and transects with locations of amphibian detections in 2014. 123
LIST OF MAPS Map 1. Drawdown zone stream habitat map for Six Mile Creek in May 2014. ...................... 82 Map 2. Drawdown zone stream habitat map for Lamonti Creek in May 2014. ...................... 83 Map 3. Drawdown zone stream habitat map for Ole Creek in May 2014. ............................. 84 Map 4. Drawdown zone stream habitat map for Factor Ross Creek in May 2014. ............... 85 Map 5. Rainbow Trout spawning survey and juvenile fish survey location maps for Six Mile
Creek in 2014. ...................................................................................................................... 90 Map 6. Rainbow Trout spawning survey and juvenile fish survey location maps for Lamonti
Creek in 2014. ...................................................................................................................... 91 Map 7. Rainbow Trout spawning survey and juvenile fish survey location maps for Ole Creek
in 2014. ................................................................................................................................ 92 Map 8. Rainbow Trout spawning survey and juvenile fish survey location maps for Factor
Ross Creek in 2014. ............................................................................................................. 93 Map 9. Six Mile Creek amphibian survey locations and detections. ................................... 124 Map 10. Lamonti Creek amphibian survey locations and detections. ................................... 125 Map 11. Ole Creek amphibian survey locations and detections. .......................................... 126 Map 12. Factor Ross Creek amphibian survey locations and detections. ............................. 127
BC Hydro 2015 GMSMON 17 Williston Tributaries – Year 4 Report
DWB Consulting Services Ltd. Cooper Beauchesne and Associates Ltd.
1
1 INTRODUCTION
1.1 Background
During consultations under the Peace Water Use Plan (WUP), the Consultative Committee recognized that reservoir operations created large unproductive areas within the drawdown zone of Williston Reservoir (Anon. 2003). The resulting limited aquatic habitats were hypothesized to have two primary impacts on fish: the low productivity limits the area’s capacity to support fish and fish access to tributaries may be restricted at low reservoir levels. The large area (~450 km2) of the drawdown zone between the low and high water levels, provides no fish habitat when exposed and little habitat for fish when inundated (Anon. 2003). The fluctuating water levels are also a major restriction on littoral zone productivity around the reservoir. It was observed that when water levels recede during drawdown, significant accumulations of debris were stranded at the mouths of some tributaries (Anon. 2003). Low water levels during drawdown were also observed to expose barriers to fish passage in the tributaries. Debris accumulation and associated scour was also considered to be a limiting factor in vegetation development on portions of the tributaries (BC Hydro 2008). The effect these two factors on fish access to reservoir tributaries is unknown and variable, depending on the location. The Williston Tributary Access Management Plan was developed within the WUP to improve tributary access through management of debris and alterations to stream morphology in the drawdown zone (Anon. 2003). The components of the plan were an inventory of tributaries with either debris or other physical barriers to fish passage that were potentially suitable for enhancement, selection of two tributaries for implementation of demonstration access enhancement projects, and a monitoring program to test their effectiveness in improving fish access and habitat for fish and wildlife over the life of the project. If the projects were considered to be successful, then the potential for additional tributary access projects would be assessed (Anon. 2003). The inventory of potential enhancement sites was completed under GMSWORKS-19 Williston Reservoir Trial Tributaries. A total of 64 Williston Reservoir tributaries were reviewed to determine if they had access limitations due to debris or morphology by Cubberly and Hengeveld (2010). Of the 64 sites reviewed, nine candidate sites were identified for further investigation of the extent of fish access limitations and feasibility of access improvement demonstration projects. Conceptual designs were proposed for the two highest ranking sites representing two sites in the Parsnip Arm with drawdown impacts (Cubberly and Hengeveld 2010). The final site selection identified one site in the Finlay Arm (Ole Creek) with debris impacts and one of the originally selected sites in the Parsnip Reach (Six Mile Creek) with drawdown impacts. Monitoring of the effectiveness of the tributary access enhancement projects in improving fish access to reservoir tributaries will be completed under GMSMON-17 Tributary Habitat Review.
1.2 Monitoring Plan Overview
The GMSMON-17 project is a 10-year monitoring program to assess the effectiveness of the demonstration tributary enhancement projects at improving fish and wildlife habitat (BC Hydro 2008). This effectiveness monitoring program is designed to determine the response of fish and selected indicator groups to the tributary enhancements and to increase knowledge of wildlife use of the drawdown zone, particularly for birds and amphibians. The emphasis of the monitoring program is on determining the effectiveness of the tributary access enhancements in improving fish access and habitat. The access enhancements were also predicted to allow for

BC Hydro 2015 GMSMON 17 Williston Tributaries – Year 4 Report
DWB Consulting Services Ltd. Cooper Beauchesne and Associates Ltd.
2
establishment of riparian vegetation and potentially result in benefits for songbirds. Amphibians were also identified as an indicator group for the effectiveness monitoring program. This report presents the results from the fourth year of the GMSMON-17 monitoring program. The results provide a combination of additional baseline information and the initial post-construction observations. Construction of both tributary access enhancement demonstration projects (Six Mile and Ole Creeks) was completed during the Year 4 (2014) monitoring period resulting in the collection of additional baseline data and some initial post-construction data on this project.
2 MANAGEMENT QUESTIONS AND HYPOTHESES The monitoring objectives and hypotheses for GMSMON-17 were stated in the Terms of Reference for the project (BC Hydro 2008). These are restated below along with a brief summary of how the testing of each hypothesis is approached in the study design. Six key management questions regarding the effectiveness of the wetland enhancements were identified for the Tributary Habitat Review monitoring program:
1. Does fish abundance and diversity in tributaries increase as a result of enhancement?
2. Is the area and quality of fish habitat created by the tributary enhancement maintained over time?
3. Does riparian vegetation along tributaries increase in abundance and diversity as a result of enhancement?
4. Does abundance and diversity of song birds (passerines) around tributaries change as a result of enhancement?
5. Does amphibian abundance and diversity in tributaries change as a result of enhancement?
6. Does tributary enhancement change the area and quality of amphibian breeding habitat over time? If so, is the area and quality maintained over time?
Based on these management questions, the study was designed to test the following null hypotheses:
H01
: Fish abundance and diversity in tributaries does not increase as a result of tributary
enhancement.
H02
: Total rearing area for fish does not increase following enhancement to tributaries.
H03
: Riparian vegetation abundance and diversity along the tributaries does not increase
following enhancement to tributaries.
H04
: Amphibian abundance and diversity in and near tributaries does not change
following tributary enhancement.
H05
: Total amphibian breeding area does not change following enhancement.
BC Hydro 2015 GMSMON 17 Williston Tributaries – Year 4 Report
DWB Consulting Services Ltd. Cooper Beauchesne and Associates Ltd.
3
H06
: Song bird abundance and diversity near tributaries does not increase following
tributary enhancement.
DWB and CBA also proposed an additional management question and hypothesis that could be incorporated into the existing study design:
7. Does abundance and diversity of waterfowl and shorebirds around tributaries change as a result of enhancement?
H
07: Waterfowl and shorebird abundance and diversity near tributaries does not change
following tributary enhancement.
The monitoring program collects annual data on fish abundance, diversity, and habitat; riparian vegetation abundance and diversity; amphibian abundance, diversity, and breeding habitat; songbird abundance and diversity; and waterfowl abundance and diversity. The focus of the trial is on enhancing fish access to the tributaries but it is expected that there may be some benefits to wildlife and wildlife habitat from channel stabilisation and debris reduction allowing for increased growth of riparian vegetation. The effectiveness monitoring approach is annual sampling of the indicator groups at locations within each stream and in adjacent riparian areas at both the treatment and control sites. The fish population monitoring includes drawdown zone reach habitat mapping, rainbow trout visual spawning surveys, fish diversity and abundance in the drawdown zone reach of each stream by electrofishing, juvenile fish abundance using mark-resight, and visual fry surveys. Riparian vegetation is monitored using annual quadrat sampling and aerial photo analysis. Amphibians are inventoried using systematic surveys to determine relative abundance. Songbirds, waterfowl, and shorebirds are surveyed using breeding bird point counts, land-based observations, and nest searches.
3 STUDY AREA Williston Reservoir is located in northeastern British Columbia and was created by construction of the W.A.C. Bennett Dam at the head of the Peace River Canyon, about 20 km west of Hudson’s Hope, B.C (BC Hydro 2007). The reservoir extends for about 260 km along the Rocky Mountain Trench from the Finlay River in the north to the Parsnip River in the south. The reservoir is generally divided into three geographic regions (from north to south): Finlay Reach, Peace Reach and Parsnip Reach (BC Hydro 2007). The reservoir is located within the Sub-Boreal Spruce and Boreal White and Black Spruce biogeoclimatic zones (Meidinger and Pojar 1991). The Sub-Boreal Spruce zone is the dominant zone and occurs as two subzones and variants at lower elevations along most of the reservoir (Meidinger and Pojar 1991). The Boreal White and Black Spruce zone occurs only at the northern end of the reservoir in the Finlay Arm (Meidinger and Pojar 1991). The drawdown zone consists of large areas of mud, sand, and gravel flats with stranded large woody debris. Limited amounts of vegetation occur even following extended periods of drawdown. The water level in the reservoir varies annually with reservoir filling and drafting. The annual reservoir levels for the first four years of this study (Year 1: 2011, Year 2: 2012, Year 3: 2013,
BC Hydro 2015 GMSMON 17 Williston Tributaries – Year 4 Report
DWB Consulting Services Ltd. Cooper Beauchesne and Associates Ltd.
4
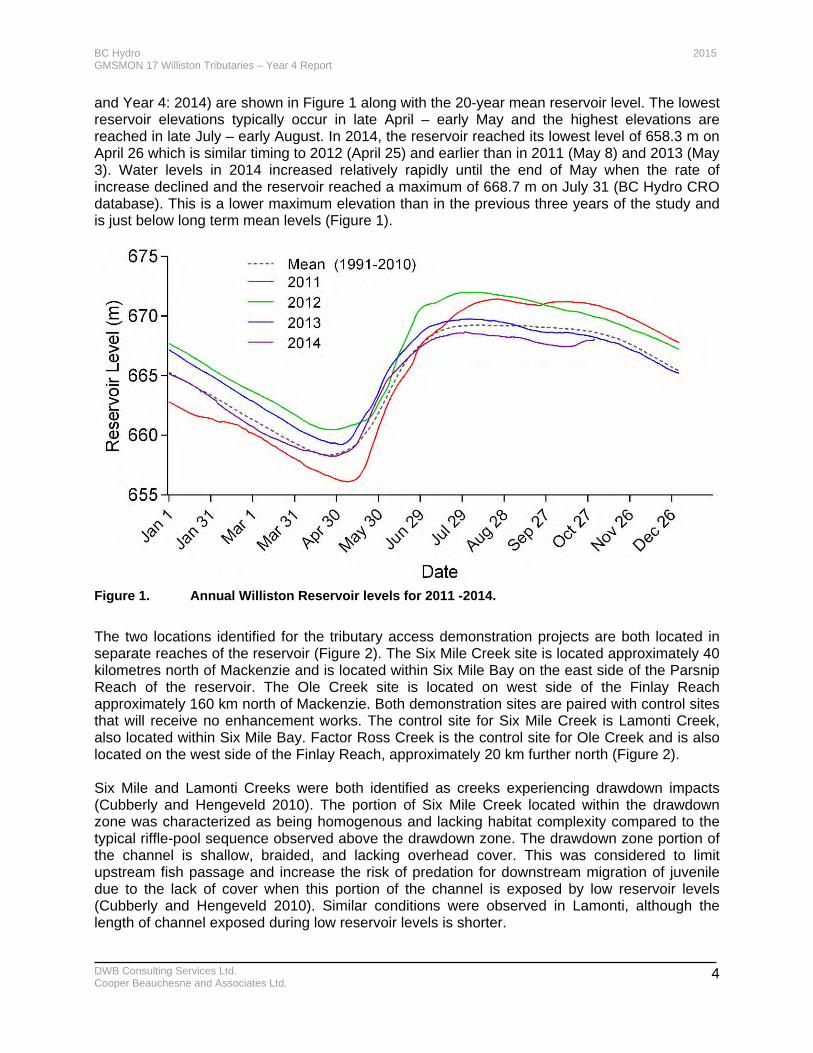
and Year 4: 2014) are shown in Figure 1 along with the 20-year mean reservoir level. The lowest reservoir elevations typically occur in late April – early May and the highest elevations are reached in late July – early August. In 2014, the reservoir reached its lowest level of 658.3 m on April 26 which is similar timing to 2012 (April 25) and earlier than in 2011 (May 8) and 2013 (May 3). Water levels in 2014 increased relatively rapidly until the end of May when the rate of increase declined and the reservoir reached a maximum of 668.7 m on July 31 (BC Hydro CRO database). This is a lower maximum elevation than in the previous three years of the study and is just below long term mean levels (Figure 1).
Figure 1. Annual Williston Reservoir levels for 2011 -2014.
The two locations identified for the tributary access demonstration projects are both located in separate reaches of the reservoir (Figure 2). The Six Mile Creek site is located approximately 40 kilometres north of Mackenzie and is located within Six Mile Bay on the east side of the Parsnip Reach of the reservoir. The Ole Creek site is located on west side of the Finlay Reach approximately 160 km north of Mackenzie. Both demonstration sites are paired with control sites that will receive no enhancement works. The control site for Six Mile Creek is Lamonti Creek, also located within Six Mile Bay. Factor Ross Creek is the control site for Ole Creek and is also located on the west side of the Finlay Reach, approximately 20 km further north (Figure 2). Six Mile and Lamonti Creeks were both identified as creeks experiencing drawdown impacts (Cubberly and Hengeveld 2010). The portion of Six Mile Creek located within the drawdown zone was characterized as being homogenous and lacking habitat complexity compared to the typical riffle-pool sequence observed above the drawdown zone. The drawdown zone portion of the channel is shallow, braided, and lacking overhead cover. This was considered to limit upstream fish passage and increase the risk of predation for downstream migration of juvenile due to the lack of cover when this portion of the channel is exposed by low reservoir levels (Cubberly and Hengeveld 2010). Similar conditions were observed in Lamonti, although the length of channel exposed during low reservoir levels is shorter.
BC Hydro 2015 GMSMON 17 Williston Tributaries – Year 4 Report
DWB Consulting Services Ltd. Cooper Beauchesne and Associates Ltd.
5
Figure 2. Location of the two tributary access enhancement treatment sites (Six Mile and Ole
Creeks) and their respective control sites (Lamonti and Factor Ross Creeks) on Williston Reservoir.
BC Hydro 2015 GMSMON 17 Williston Tributaries – Year 4 Report
DWB Consulting Services Ltd. Cooper Beauchesne and Associates Ltd.
6
Ole and Factor Ross Creeks were identified as sites with tributary access impacts primarily due to debris accumulation (Cubberly and Hengeveld 2010). Debris accumulation is typically higher in the Finlay Reach than in other parts of the reservoir due to the prevailing southeast winds, (Anon. 2003). The access enhancement treatments proposed for both Six Mile and Ole Creeks are similar in concept and intended to stabilize drawdown zone reach of the respective streams and minimize debris impacts. The preliminary design for Six Mile Creek consisted of a series of constructed berms and log jams to close off channel braids and create habitat complexity within the main channel (KWL 2013). The higher elevation berms were also to receive revegetation treatments to enhance riparian vegetation. The preliminary design for Ole Creek also included the construction of berms to close off channel braids and create habitat complexity. However, the main features of the proposed design for Ole Creek were the construction of two berms and associated debris catcher to limit the accumulation of debris at the stream mouth. Removal of existing debris was also part of the prescription for this site (KWL 2013).
4 METHODS
4.1 Environmental Conditions
Environmental conditions specific to each survey type were recorded at the start of each survey and periodically during the surveys. Daily mean air temperature data and precipitation prior to and during the survey period (April – August) were obtained from Environment Canada and observed at the Mackenzie Airport weather station (Station names: Mackenzie A and Mackenzie Airport Auto) to obtain a record of the regional conditions. Data on local environmental conditions were obtained from the satellite enabled satellite-enabled stream gauging stations located at Ole and Six Mile Creeks. The locations and installation dates for the two stations are provided in Table 1. For complete details on the installation and equipment at the stations refer to the reports from Years 2 and 3 of the project (Golder 2013, 2014). Data recorded by the stations includes water level, air temperature, and water temperature. A staff gauge for manually recording water level was also installed at each station and a Hobo Water Temperature Pro water temperature logger (Onset Computer Corporation) was also installed at each station as a secondary record of water temperature. Data for all variables was recorded at 15 minute intervals and set to be uploaded hourly to the data server by satellite. Data was downloaded at a minimum of once a month for later analysis. Water level and temperature data were reviewed frequently in May and June to determine the timing of the Rainbow Trout spawner surveys.
Table 1. Location and installation details for satellite-enabled stream gauging stations.
Site Station # Neon Serial # UTMs
Date of Installation Zone E N
Ole Creek 1 4870 10 V 404853 6257596 May 28, 2012
Six Mile Creek 2 5012 10 U 474511 6163771 May 27, 2012
BC Hydro 2015 GMSMON 17 Williston Tributaries – Year 4 Report
DWB Consulting Services Ltd. Cooper Beauchesne and Associates Ltd.
7
The stream gauging stations were re-surveyed on May 8 and 9, 2014 at Six Mile and Ole Creeks, respectively, to confirm that the stations had not moved. Manual discharge measurements were completed in May, June, and August for development of the rating curves for each of the streams. Two replicate measurements were completed on each date.
4.2 Fish Surveys
4.2.1 Tributary Access Assessment and Fish Habitat
The foreshore area of the Williston reservoir was inspected during the three main field visits in May, June, and August to assess each stream for potential barriers to fish passage. Habitat in the drawdown zone reach of each stream was mapped during the May site visit from the full pool elevation (672 m) down to the confluence with the Williston Reservoir (May 8 elevation: 658.6 m, May 9 elevation: 658.7 m). Channel boundaries, habitat types, and stream area were delineated within the drawdown zone during low pool conditions of the reservoir. Features were located by tight chainage from a GPS reference point and photographed. Any debris clusters, riffles, pools, boulders, and significant gradient changes were noted and a visual inspection for fish was also completed. The habitat information was georeferenced and sketched onto orthophotos of each stream. An initial Unmanned Aerial Vehicle (UAV) (or Systems-UAS) survey of the study sites was completed on June 16-19, 2014. High resolution digital orthophotos (with a target resolution of 5 cm ground sampling distance [GSD]), provided by JR Canadian Mapping Ltd from the UAV survey was used as the background layer for delineating stream features (e.g., debris clusters). Georeferencing interpretation was completed in 2-D softcopy using ArcGIS (version 9.3, ESRI 2008) and Artweaver (Boris Eyrich Software, 2014). Where 2014 orthophoto coverage was not available, previously collected 2011 orthophotos were utilized independently or in addition by conjoining data sets in Artweaver (Boris Eyrich Software, 2014). Photo documentation from the established reference locations near the mouth of each study stream and using the same orientations as in 2012 and 2013 was continued (Table 2).
Table 2. Location of stream mouth photo reference sites and reference photo direction.
Site UTMs Height Above
Ground (m) Azimuth (°)
Zone E N
Six Mile 10 U 474658 6162760 1.6 165,60
Lamonti 10 U 475293 6161984 1.4 290,200
Ole 10 V 405814 6257625 2.0 10,80
Factor Ross 10 V 395397 6275823 1.4 340, 280,220
4.2.2 Drawdown Zone Fish Sampling
Fish sampling by electrofishing was conducted under Fish Collection Permit PG14-148579 issued by the Ministry of Forest, Lands and Natural Resource Operations. Electrofishing surveys of the of the drawdown zone reach of each stream were completed on June 16-18, 2014. As the streams contain Bull Trout, electrofishing could not commence until after June 15 in accordance with the permit conditions (no electrofishing from September 15 – June 15). The drawdown zone surveys were completed from June 16 to 18, 2014 when the reservoir elevation was approximately 666 m. This allowed for sampling of 130 m to 300 m of stream channel length in the drawdown zone depending on the stream (Table 3). Due to the higher spring flows, only
BC Hydro 2015 GMSMON 17 Williston Tributaries – Year 4 Report
DWB Consulting Services Ltd. Cooper Beauchesne and Associates Ltd.
8
the slower stream margins on the left and right banks could be safely and effectively sampled. The exception was Lamonti Creek where the stream was small enough that the entire channel width could be sampled. The length and width of the sampling areas in each stream was recorded.
Table 3. Dates and drawdown zone stream length sampled at the four sites in 2014.
Site Date Surveyed Approximate Stream Length Sampled (m)
Water Temperature (°C)
Six Mile June 16, 2014 295 6.5
Lamonti June 17, 2014 290 5.5
Factor Ross June 18, 2014 165 6.0
Ole June 18, 2014 133 6
Backpack electrofishing (Smith-Root LR-24B) consisted of a single pass with no enclosure. A three or four person crew was used with one crew member operating the electrofisher, one dip netter, and two using a 4 m apron seine (Elson 1962). The apron seine was used to increase capture rates in the relatively high stream velocities encountered in the drawdown zone. When operating as a three person crew only the apron seine was used with no dip netter. This approach was used in the higher velocity areas where the apron seine captured all of the fish. All collected fish were held in buckets and maintained at stream temperature. Fish were quickly processed and enumerated by species, measured for fork length (FL) or total length (TL, sculpins and Burbot only), and weighed on a digital scale (nearest 1 g). Prickly and Slimy Sculpin were identified to species but were combined for the analysis as they are not a target species for enhancement. Fish were immediately released back into the stream following processing.
4.2.3 Spawner Surveys
Arctic Grayling and Rainbow Trout were identified in the Terms of Reference for this monitoring program as potential target species for the spring spawning surveys. However, since Arctic Grayling were not observed during spawner surveys in Years 1 and 2, it was recommended that the surveys be changed to focus on Rainbow Trout only beginning in Year 3 (Golder 2013). Spawning surveys followed the same methodology as used in Year 3 (Golder 2014). Foot-based visual surveys were conducted by two observers with each observer walking along one bank of the stream. One of the observers was equipped with a dry suit, mask, and snorkel to conduct snorkel surveys in locations where depth and water velocity permitted. During the snorkel surveys the other observer was stationed downstream from the snorkeler and was equipped with a throw bag for safety. The snorkel surveys were a supplement to the visual surveys and were intended to increase the detections of adult fish. The minimum length of stream surveyed was equal to the distance surveyed in the previous year of the monitoring program. When time permitted, the survey area was extended upstream, as recommended by Golder (2014). Additionally, the survey area at Six Mile Creek was extended by including a portion of its tributary, Patsuk Creek. The Year 4 spawner surveys were completed on the four systems from June 23-26, 2014. The timing of the spawner surveys was determined by monitoring water levels and temperatures from the remote gauging stations on Six Mile and Ole Creeks. The criteria for the timing of the
BC Hydro 2015 GMSMON 17 Williston Tributaries – Year 4 Report
DWB Consulting Services Ltd. Cooper Beauchesne and Associates Ltd.
9
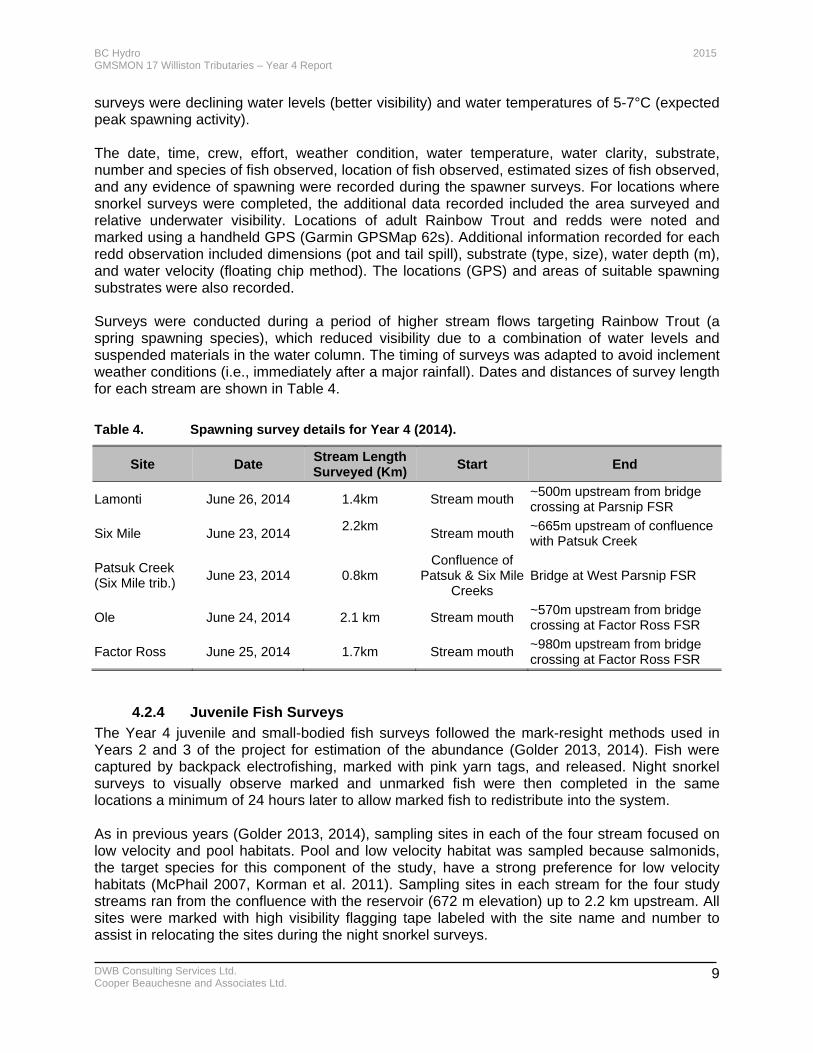
surveys were declining water levels (better visibility) and water temperatures of 5-7°C (expected peak spawning activity). The date, time, crew, effort, weather condition, water temperature, water clarity, substrate, number and species of fish observed, location of fish observed, estimated sizes of fish observed, and any evidence of spawning were recorded during the spawner surveys. For locations where snorkel surveys were completed, the additional data recorded included the area surveyed and relative underwater visibility. Locations of adult Rainbow Trout and redds were noted and marked using a handheld GPS (Garmin GPSMap 62s). Additional information recorded for each redd observation included dimensions (pot and tail spill), substrate (type, size), water depth (m), and water velocity (floating chip method). The locations (GPS) and areas of suitable spawning substrates were also recorded. Surveys were conducted during a period of higher stream flows targeting Rainbow Trout (a spring spawning species), which reduced visibility due to a combination of water levels and suspended materials in the water column. The timing of surveys was adapted to avoid inclement weather conditions (i.e., immediately after a major rainfall). Dates and distances of survey length for each stream are shown in Table 4.
Table 4. Spawning survey details for Year 4 (2014).
Site Date Stream Length Surveyed (Km)
Start End
Lamonti June 26, 2014 1.4km Stream mouth ~500m upstream from bridge crossing at Parsnip FSR
Six Mile June 23, 2014 2.2km
Stream mouth
~665m upstream of confluence with Patsuk Creek
Patsuk Creek (Six Mile trib.)
June 23, 2014 0.8km Confluence of
Patsuk & Six Mile Creeks
Bridge at West Parsnip FSR
Ole June 24, 2014 2.1 km Stream mouth ~570m upstream from bridge crossing at Factor Ross FSR
Factor Ross June 25, 2014 1.7km Stream mouth ~980m upstream from bridge crossing at Factor Ross FSR
4.2.4 Juvenile Fish Surveys
The Year 4 juvenile and small-bodied fish surveys followed the mark-resight methods used in Years 2 and 3 of the project for estimation of the abundance (Golder 2013, 2014). Fish were captured by backpack electrofishing, marked with pink yarn tags, and released. Night snorkel surveys to visually observe marked and unmarked fish were then completed in the same locations a minimum of 24 hours later to allow marked fish to redistribute into the system. As in previous years (Golder 2013, 2014), sampling sites in each of the four stream focused on low velocity and pool habitats. Pool and low velocity habitat was sampled because salmonids, the target species for this component of the study, have a strong preference for low velocity habitats (McPhail 2007, Korman et al. 2011). Sampling sites in each stream for the four study streams ran from the confluence with the reservoir (672 m elevation) up to 2.2 km upstream. All sites were marked with high visibility flagging tape labeled with the site name and number to assist in relocating the sites during the night snorkel surveys.
BC Hydro 2015 GMSMON 17 Williston Tributaries – Year 4 Report
DWB Consulting Services Ltd. Cooper Beauchesne and Associates Ltd.
10
Night snorkel surveys were conducted at all sites where electrofishing was conducted, as recommended in the Year 3 report (Golder, 2014). The same tagging methods have also been applied to studies of juvenile salmonids elsewhere in BC (e.g., Schick et al. 2013). Visual surveys were used at a few sites that were not possible to snorkel because of limited water depth. A handheld GPS was used to record UTM coordinates for all electrofishing and snorkeling sites. The majority of sites sampled in 2013 were re-sampled in 2014. A small number of sites were added, altered, or deleted as the site no longer provided low-velocity or pool habitat due to natural changes in stream morphology. Backpack electrofishing (Smith-Root LR-24) was used to capture fish for marking. The electrofishing crew consisted of one electrofisher operator and two dipnetters and a single pass with no enclosure was completed at each site. Electrofishing settings (voltage, frequency, duty cycle) were recorded along with the time electrofished in seconds (sample effort) and the area sampled (m²). All collected fish were held in buckets and maintained at stream temperature until electrofishing of the site was completed. Fish were quickly processed and enumerated by species, measured for fork length (FL) or total length (TL, sculpins and Burbot only), weighed on a digital scale (nearest 1 g), and tagged. Prickly and Slimy Sculpin were identified to species but were combined for data analysis as they are not a target species for enhancement. Captured sculpins can be easily identified but it is not possible to reliably identify observed but not captured individuals to species level. Fish were marked with size 16-20 barbed fishing hooks (size of hook depended on size of fish) that had fluorescent yarn tied around the shank and were attached through the flesh directly behind the dorsal fin. The tagging method was based on the method developed by Hagen et al. (2010) and used in Year 2 of this monitoring program (Golder 2013). The scales of larger Mountain Whitefish were found to be too thick directly behind the dorsal fin, so these fish were tagged in the adipose fin. Approximately 1-2 cm of fluorescent yarn was left trailing from the fish hook after being attached. Fish were allowed to fully recover prior to release into the same area of the stream they were captured from. Sculpin were not tagged in this study as they were too small for the tagging method and are not the target species for habitat enhancement. Besides sculpins, other fish <70 mm FL were not tagged because they were considered too small for the tagging method. Additionally, not all suitably-sized fish captured in Factor Ross Creek were tagged due to a shortage of tags as the number of fish captured was higher than anticipated. The wetted dimensions of each sampling site were recorded. Previous habitat ratings for each site (Golder 2014) were reviewed and either confirmed or updated based on the type and abundance (%) of available cover. Habitat ratings were based on the total of all cover types (e.g., large and small woody debris, cobble and boulders, undercuts) and were ranked as low (<10% cover), medium (10-40% cover), or high (>40% cover). The night snorkel surveys were completed by a three person crew. Two people were equipped with dry suits, waterproof flashlights, snorkels, and masks to conduct the survey while the third crew member carried out shoreline fry surveys and recorded the data. Equipment was prepared prior to arriving at each site and the sites were approached quietly to minimize disturbance to fish. A visual shoreline survey was first conducted to observe fish in shallow, near shore, and other instream areas where the bottom was visible. Each site was snorkel surveyed by a single
BC Hydro 2015 GMSMON 17 Williston Tributaries – Year 4 Report
DWB Consulting Services Ltd. Cooper Beauchesne and Associates Ltd.
11
crew member working from downstream to upstream. The second crew member independently surveyed the site as quality control of fish observations. Larger sites were snorkeled by both surveyors simultaneously while communicating to avoid double counting fish. Snorkelers continued observations until they were confident there were no un-counted visible fish within a sampled reach. Total underwater observation time depended on the size of the site and complexity of cover but typically ranged from 30 seconds up to several minutes per observer. At debris jams and other high cover areas, observers positioned themselves at various angles to view as much of the area as possible. Snorkel surveys were completed at as many of the sites where fish were marked as possible. However, a few sites could not be snorkeled due to debris build up, high flows, safety concerns, or pool depth was too shallow. Visual assessment was completed at all sites where snorkeling could not be completed. Sections that could not be effectively snorkel surveyed often matched sections where electrofishing was similarly restricted. All marked and unmarked fish were counted and identified to species. Fork lengths were estimated. The same spatial area that was measured and sampled during electrofishing was surveyed by snorkeling. If some of the electrofishing site was not observed by snorkeling then the spatial area that was surveyed was estimated and recorded. All snorkel surveys were conducted beginning 30 minutes after sunset one day following the release of the marked fish.
4.2.5 Fry Surveys
Salmonid fry surveys were conducted at the same time as the night-time snorkel surveys by the crew member who was recording data for the snorkel surveys. Fry surveys were conducted adjacent to the snorkeling sites in areas that provided good habitat (based on professional judgment) for salmonid fry. Although habitat variables were not measured, habitats considered suitable for fry were characterized by water depths less than 0.2 m and water velocities less than 0.1 m/s, and were typically near the stream margin (McPhail 2007). Fry surveys were only conducted at sites where suitable habitat was present. Surveys moved from downstream to upstream using a flashlight or headlamp to scan the habitat for fry. A subsample of observed fry was captured with a small dip-net to confirm species identification. For each site, the number of fry observed, estimated fork lengths, and the linear distance of shoreline survey was recorded.
4.2.6 Data Analysis
The catch-per-unit-effort (CPUE) for electrofishing (drawdown zone and juvenile fish surveys) was calculated for each species and stream as the number of fish per second and the number of fish per unit area (number/100m²). The CPUE for the snorkel surveys was calculated for each species and stream as the number of fish observed per unit area (number/100m²) based on the total area surveyed in each stream. For the fry surveys, the CPUE was calculated as the number of fry per linear meter of shoreline (number/m). Only Rainbow Trout <45mm and Bull Trout <55mm in length were considered to be fry and were included in the fry survey CPUE calculations. Fish larger than this observed in the fry surveys were considered to be older (age 1 or greater). Although age-length data from these stream is not available to support these criteria, they were selected based on other populations in British Columbia (McPhail 2007) and observations other fish of the same species during the surveys. Although sculpin were not the target species in the study, they were often observed
BC Hydro 2015 GMSMON 17 Williston Tributaries – Year 4 Report
DWB Consulting Services Ltd. Cooper Beauchesne and Associates Ltd.
12
during fry surveys and were included in the data summary to provide supporting information about potential changes in the fish community over time. Estimates of relative (CPUE) and absolute abundance (mark-resight) are based solely off the habitat sampled, which was limited to pools and low velocity habitats that could be safely sampled and did not included riffles, rapids, and other non-suitable habitat features. The mark-resight data was used to estimate the populations of juvenile salmonids in the four streams. A binomial Bayesian probability implementation of N using the same priors and WinBugs code used in Years 2 and 3 (Golder 2013, 2014) was implemented. A uniform prior of being in the sampled population was used. The estimation procedures are based on the following assumptions: (i) all marked and unmarked fish migrate within the area being sampled, (ii) there is no mark loss between release and recapture sites, (iii) there is no mortality between release and recapture sites, (iv) the catchability of a marked fish does not depend on the time spent in the river after release, and (v) marked and unmarked fish have equal catchability and equal aggregation patterns (Mäntyniemi and Romakkaniemi 2002). Initial values for unmarked fish were set in a manner similar to those used by Golder (2013, 2014). Species and stream strata that were included in the model were as follows: 6Mile-RT=125, 6Mile-BT=100, 6Mile-BB=10, Lamonti-RT=125, Ole-RT=80, Ole-BT=150, Ole-MW=80, Factor-RT=25, Factor-BT=100, Factor-MW=350. The following data list was inserted into the code: s=10, N = c(7, 3, 2, 20, 2, 24, 2, 4, 4, 12), n = c(4, 0, 0, 8, 0, 10, 0, 2, 1, 3), u = c(53, 30, 1, 47, 8, 65, 13, 2, 9, 79). R-stats (R Core Team 2014) version 3.1.2 and version 1.4.3 of WinBugs (Lunn et al. 2000) were used for the analysis including re-entry and compiling of previous years data. The FSA (Fisheries Stock Assessment) package (Ogle n.d.) was used to estimate the Petersen mark-recapture estimates of abundance, including the binomial method for obtaining confidence intervals for a closed population.
4.3 Vegetation Surveys
A combination of air photo interpretation and ground sampling of terrestrial vegetation was used to describe terrestrial vegetation communities at the project sites (Province of British Columbia 2010, RISC 2010). The TEM standards (Province of British Columbia 2010) were used to complete ground sampling of terrestrial vegetation as the plant species assemblages and soil profiles identified within the project sites were not consistent with the wetland classes described by Mackenzie and Moran (2004). Mackenzie and Moran (2004) describe naturally recurring wetlands within British Columbia that are relatively stable in terms of their hydrologic cycle and plant species composition and have established over long periods of time. Due to variability of flood events in the drawdown zone from dam operations, the plant species assemblages identified in this project are in constant transition to a stable state. All photo interpretation was completed in 2-D softcopy using ArcGIS (version 9.3, ESRI 2008). Digital ortho-rectified low and high resolution air photos taken of the project sites, provided by BC Hydro (approx. 100cm pixel resolution; 2011) and JR Canadian Mapping (5cm pixel resolution; 2014), were used as the background layers for delineating polygons. Field notes and photographs on vegetation composition and structure from informal inspections of the study sites prior to the air photo interpretation assisted with establishing and updating habitat classes. A habitat classification scheme based on RISC (2010) was developed to capture all the habitat classes in the study area visible at the air photo resolution available. Habitat classes were first determined from an overview of the study area to identify the larger vegetation features. As the
BC Hydro 2015 GMSMON 17 Williston Tributaries – Year 4 Report
DWB Consulting Services Ltd. Cooper Beauchesne and Associates Ltd.
13
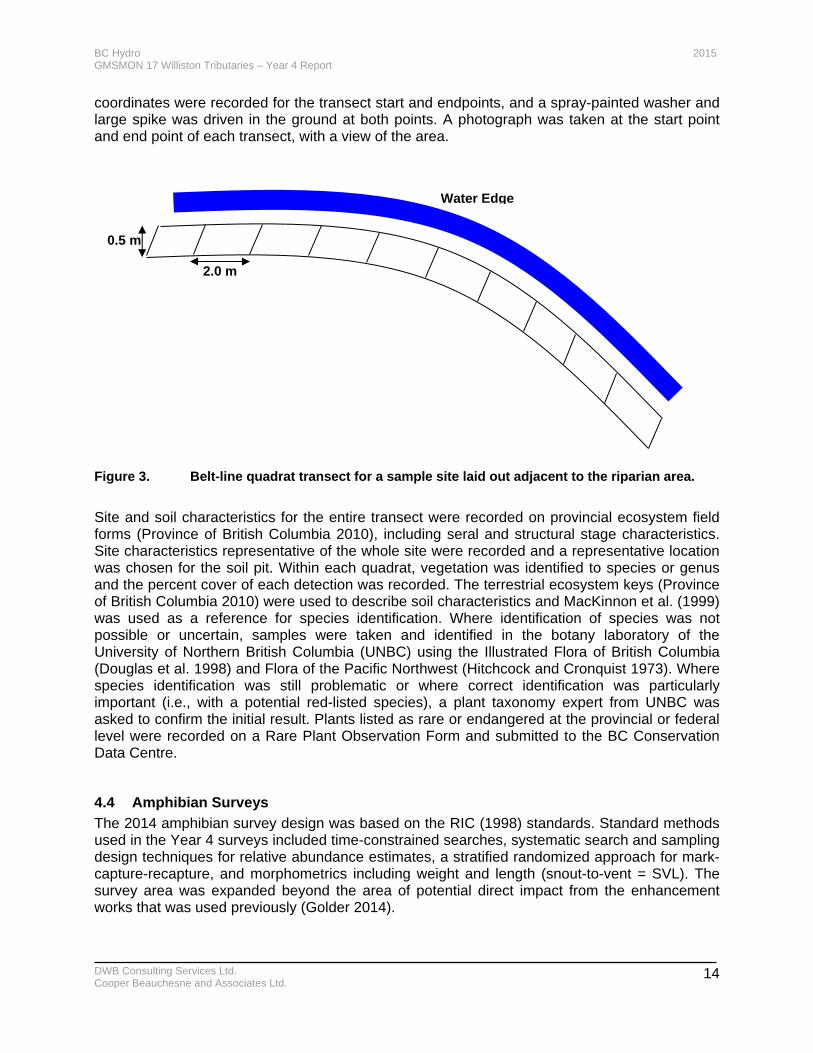
study area was viewed at finer scales during photo interpretation, more vegetation features were identified. As new vegetation features were encountered, additional habitat classes were created to accommodate them. Each habitat class was identified based on a common plant species assemblage or substrate and elevation position within the drawdown zone. The spatial arrangement of habitat classes often followed a similar pattern. In addition to habitat classification, an enhancement classification scheme was also developed for Six Mile and Ole Creeks, using the high resolution air photos collected during Year 4. The objective of the classification scheme was to identify and differentiate artificial structures and surfaces from undisturbed habitats at the enhancement sites. Any new structures, or areas were ground disturbance resulted in alterations to surface materials, were identified as enhancement structures and were designated with an enhancement class. Due to the relatively small area of the study sites, a map scale of 1:1000 was used as the initial resolution for polygon typing. Where required, a larger scale was used to differentiate similar or small area polygons. Overall, the scale varied roughly between 1:1000 and 1:200 throughout the interpretation process depending on the size of the habitat polygon and the resolution of the air photo. Although habitat mapping was originally planned to be completed only within 50m of the main channel on each side of the tributary, the area mapped was extended to include habitats outside of the riparian zone of the main channel (but within the drawdown zone) in order to monitor any changes to these habitats over time. Thus, delineation of habitat and enhancement class polygons included all non-flooded areas within the drawdown zone (from an elevation above the full pool level to below the pool level present during ground surveys and air photo collection). Ground sampling of terrestrial vegetation was conducted to support the interpretation of habitat classes and provide a description of plant communities (e.g., species diversity) at the sites. Ground sampling was completed along established vegetation transects at each of the sites in early June. The timing of ground sampling was selected to aid in the identification of plant species by attempting to observe species as close to the date of flowering as possible (as inflorescence is often required to identify a species), but prior to the sites being flooded by rising reservoir levels. In Year 4 (2014), ground sampling was completed on a total of 13 vegetation transects. Three transects were established at the Six Mile, Ole and Factor Ross Creek sites and four transects were established at the Lamonti Creek site. At each location, transects were located on identified riparian habitats (e.g., gravel bars and riparian benches) and on constructed enhancement structures (e.g., berms). Ground sampling of the vegetation transects was completed between June 8-14, 2014 as forecasted reservoir levels were low and flooding of the upper areas of the drawdown zone at the sites was not expected to begin until late June. Prior to commencing ground sampling, a list of plant species commonly known to occur within the area was developed and reviewed. In addition, a list of red- and blue-listed species know to occur in the Mackenzie Forest District was created using the BC Conservation Data Base (Conservation Data Centre; May 2014) and reviewed. The species lists for GMSMON 15 project sites during Year 3 surveys (Airport Lagoon and Beaver Pond) were also reviewed (CBA 2014). As the habitats being surveyed were often linear in shape, a transect-based method for vegetation sampling was selected over a grid-based method (using design components from LGL (2007) and US EPA (2002)). A 20 m long belt-line quadrat transect consisting of ten 2 m x 0.5 m rectangles was laid out (Figure 3) using a 30 m tape and 2 m measuring rod. UTM
BC Hydro 2015 GMSMON 17 Williston Tributaries – Year 4 Report
DWB Consulting Services Ltd. Cooper Beauchesne and Associates Ltd.
14
coordinates were recorded for the transect start and endpoints, and a spray-painted washer and large spike was driven in the ground at both points. A photograph was taken at the start point and end point of each transect, with a view of the area.
Figure 3. Belt-line quadrat transect for a sample site laid out adjacent to the riparian area.
Site and soil characteristics for the entire transect were recorded on provincial ecosystem field forms (Province of British Columbia 2010), including seral and structural stage characteristics. Site characteristics representative of the whole site were recorded and a representative location was chosen for the soil pit. Within each quadrat, vegetation was identified to species or genus and the percent cover of each detection was recorded. The terrestrial ecosystem keys (Province of British Columbia 2010) were used to describe soil characteristics and MacKinnon et al. (1999) was used as a reference for species identification. Where identification of species was not possible or uncertain, samples were taken and identified in the botany laboratory of the University of Northern British Columbia (UNBC) using the Illustrated Flora of British Columbia (Douglas et al. 1998) and Flora of the Pacific Northwest (Hitchcock and Cronquist 1973). Where species identification was still problematic or where correct identification was particularly important (i.e., with a potential red-listed species), a plant taxonomy expert from UNBC was asked to confirm the initial result. Plants listed as rare or endangered at the provincial or federal level were recorded on a Rare Plant Observation Form and submitted to the BC Conservation Data Centre.
4.4 Amphibian Surveys
The 2014 amphibian survey design was based on the RIC (1998) standards. Standard methods used in the Year 4 surveys included time-constrained searches, systematic search and sampling design techniques for relative abundance estimates, a stratified randomized approach for mark-capture-recapture, and morphometrics including weight and length (snout-to-vent = SVL). The survey area was expanded beyond the area of potential direct impact from the enhancement works that was used previously (Golder 2014).
2.0 m
0.5 m
Water Edge
BC Hydro 2015 GMSMON 17 Williston Tributaries – Year 4 Report
DWB Consulting Services Ltd. Cooper Beauchesne and Associates Ltd.
15
Ecological studies of amphibians require a landscape-scale analysis to effectively answer research questions pertaining to habitat alteration (Trenham and Shaffer 2005). Incidental observations of amphibians during the fish surveys and other visits to the study sites were included in the amphibian mapping. These incidental observations plus the stratified random approach for setting out plots and transects in Year 4 (2014) broadens the survey scope to a landscape level. This approach allows for the detection of upland effects and a better understanding of the spatial ecology of amphibians as it relates to the management questions and hypotheses. In addition to the RIC (1998) standards, photographic identification methods (PIMs) were employed with captures from the active searches rather than traps. While toe-clipping is a commonly used method for amphibian mark-recapture studies, PIMs have become more common in amphibian studies (e.g., Carafa and Biondi 2004, Gamble et al. 2008, Caorsi et al. 2012) and have been proven more effective than toe-clipping in some studies (Caorsi et al. 2012). Computer-assisted matching can also assist with mark-recapture using PIMs (e.g., Bolger et al. 2012). A further advantage of PIMs is that additional information on the biology of captured individuals such as the body-mass-index (Davis et al. 2008) can be obtained. Traditional SVL and weight measurements also provide information on body condition and may be improved by use of PIMs. Data on body condition is important for studies related to habitat alteration and abundance, because it is an indicator of environmental stress, habitat quality, and demographic variables (Wright and Zamudio 2002, Bancila et al. 2010). A PIMs approach was included in Year 4 to provide better accounting of the amphibian populations in relation to the management questions and hypotheses.
4.4.1 Terrestrial Surveys
Time-constrained and systematic surveys for amphibians were conducted at the four study locations. The design of the systematic search strategy for amphibians was revised for the post-enhancement phase of this project. Much of the 2014 amphibian field season involved reconnaissance for suitable habitat and locations to establish study plots and transects for post-enhancement monitoring at the landscape level. Previous pre-enhancement surveys (Years 1-3, 2011-2013) were spaced into two sampling intervals, spring and summer in Year 1, and a single spring survey for Year 2 and 3. Surveys were executed for several hours (2.5 – 6.5 hours) over broad and very general search areas (1,300-7,700 m2) (Golder 2014). The Year 4 surveys were spaced into three sampling intervals (mid-May, mid-June, mid-August) and search efforts were focused on specified plot, transect, or wetland survey areas. Circular terrestrial plots were established at 200 m2 in size and search times were recorded for each plot survey. Natural cover objects (rocks, logs-limbs, bark) that were light enough to be flipped by hand were turned over. Qualitative accounts of habitat features were noted at each plot visited including exposure, general vegetation type, ground cover conditions, and slope. Flipped materials were returned to their original positions to minimise disturbance. In each survey interval, plots were extended into an undisturbed (i.e., not previously searched) area that was immediately adjacent to the plot that had previously been searched. This process increases the size of a plot in 200 m2 increments with each survey interval and potentially avoids bias from searching previously disrupted habitat. General searches were repeated around the amphibian point locations identified in Golder (2013), including ponded areas in the drawdown zone. Occasional pieces of debris were flipped while traversing between plots, but the intensity of the search effort along transects was reduced relative to the level of search effort in the plots. GPS waypoints were recorded for each plot and tracking data was also recorded to estimate search
BC Hydro 2015 GMSMON 17 Williston Tributaries – Year 4 Report
DWB Consulting Services Ltd. Cooper Beauchesne and Associates Ltd.
16
lengths and times along paths traversed. Waypoints and tracking information were downloaded into Google Earth and the search times were obtained by reviewing the files. The pattern of plot and transect establishment was field fit and varied according to topography, access, and habitat considerations. Plots were separated by a minimum of 40 m (as measured by GPS) and spatially arranged to sample near the tributary enhancement area, approximately 50 m into adjacent forested area, and 200 m into adjacent forested area. A similar plot spacing was used in a survey area located >500 m upstream from the tributary enhancement works. Transects were located in the intervening spaces separating plots. Drier sites judged as suboptimal habitat with little canopy or effective ground cover were excluded from the plot and transect design. Three surveys were conducted in Year 4 on May 12-15, June 16-19, and August 13-15. No amphibians were handled until a Wildlife Act permit was obtained (Permit No. PG14-94627). Prior to issuance of the permit, amphibians were photographed in the locations where they were found with a measured object for relative scale included in the photograph. Adults captured in a plot were identified to species, weighed (nearest 0.01g), photographed, investigated for body health and measured (snout-to-vent length) after the scientific research permit was issued on May 22, 2014. Larger adults (>1.5 g) were anesthetized using OragelTM. Anesthetized adults were placed into a diffuser box for photographing. The rectangular diffuser box was fully enclosed except for a circular hole for camera access. The inside of the box was lined with linear LED lights and white reflector diffuser fabric was attached to all sides. The diffuser box was placed onto a metal clip board with plastic 1 mm graph paper background as a standard reference.
4.4.2 Wetland Surveys
Pre-enhancement surveys included visual inspection of ponded areas in the drawdown zone in Years 1 and 2 and near the stream mouths in Year 3 (Golder 2014). Reconnaissance and surveys of potential breeding wetlands continued in Year 4, including ponded areas in the drawdown zone and a repeated survey of places listed in Golder (2012). Historical orthophotos, Google Earth, and aerial photographs of the study area were reviewed to identify potential wetland breeding areas in proximity to the study locations. Identified wetland areas were targeted in the field-based search effort. The primary goal for the final August 2014 survey was to survey the identified wetland areas. Peripheries of wetlands were searched using visual surveys with polarized lenses and random dip net sweeps to sample in murky or densely vegetated areas. Larger, definable wetland types were photographed and classified according to MacKenzie and Moran (2004). Waypoints of smaller wetlands or open water sources were recorded. Temperatures were recorded at the wetland sites at the time of survey and habitat features noted. Larvae captured during the August survey were weighed on a digital scale and photographed. Larvae were placed into a trough carved into a paraffin wax block with 1 mm plastic graph paper embedded in the background for scale; adapting the method of Davis et al. (2008). Larvae were patted dry on a piece of paper towel prior to being transferred onto an electronic scale for measuring weights (nearest 0.01 g).
BC Hydro 2015 GMSMON 17 Williston Tributaries – Year 4 Report
DWB Consulting Services Ltd. Cooper Beauchesne and Associates Ltd.
17
4.4.3 Amphibian Data Analysis
Surface areas of wetlands at Six Mile were calculated using orthophotos from 2011 and 2014 respectively. These were scaled and calibrated using measured georeference points. Images were imported into ImageJ (Ferreira and Rasband 2012) for calculating surface areas. Digital photographs of amphibians were catalogued and then uploaded into ImageJ or Artweaver (Boris Eyrich Software 2014) for processing, visualizing and analysis. Photographed individuals were double checked for species identifications that were recorded in the field. Sizes of amphibians photographed without handling prior to obtaining the permit were measured by scaling images in ImageJ using the photographed scale object in the photograph. ImageJ was used to obtain measurements and the body mass index of salamander larvae and adults per the methods of Davis et al. (2008). Data on weights and snout-to-vent lengths from previous study years (Golder 2012, 2013) were graphed and compared to the current year. R-stats (R Core Team 2014) was used for statistical analysis, including log transformation and Pearson’s product-moment correlation tests on weights and allometrics of salamanders. Detection and search effort data were used to calculate catch-per-unit effort values for each study site, tabulated and compared to previous study years. Distances along transects for the 2014 season were calculated by mapping GPS tracking into Google Earth and measuring distances travelled. New transects were overlaid onto the tracked sections, numbered sequentially, and mapped to establish the strategic survey design for subsequent years.
4.5 Songbird and Waterfowl Surveys
Songbird surveys were conducting according to methods modified from the provincial Forest and Grassland Bird Inventory Standards (RIC 1999). All surveys were completed from June 10-13, 2014 within a four hour period commencing at sunrise. Each survey was 30 minutes in duration and the total survey time at each point was recorded. Two replicates were conducted at each site on two consecutive days. A centre point for each survey was established along each tributary within the drawdown zone. Upon arriving at the survey point, an initial scan for waterfowl and shorebirds was completed to note any birds that may have taken flight due to the observer’s arrival at the station. All observations of songbird activity within a 75 m radius of the centre point and waterfowl and shorebird activity at any distance from the centre point were recorded and mapped. Species and activity were recorded for each observation. For songbirds, species outside of the 75 m radius were recorded but not mapped. At Six Mile Creek, an additional 30 minute transect survey was also completed along the willows planted as part of the access enhancement project to look for evidence of avian use of this vegetation. Environmental conditions including survey start and end time, percent cloud cover, ceiling height, wind speed (Beaufort scale), precipitation, and temperature were recorded at the beginning of each point count. Based on previous experience conducting point count surveys in the cool, wet northern BC spring, surveys were conducted according to ‘modified’ RIC standards (RIC 1999) for environmental conditions. Acceptable conditions for surveys are as follows: wind speed ≤Beaufort 3 (gentle breeze, leaves and twigs constantly move), no precipitation >‘very’ light rain, and temperature > 3˚C.
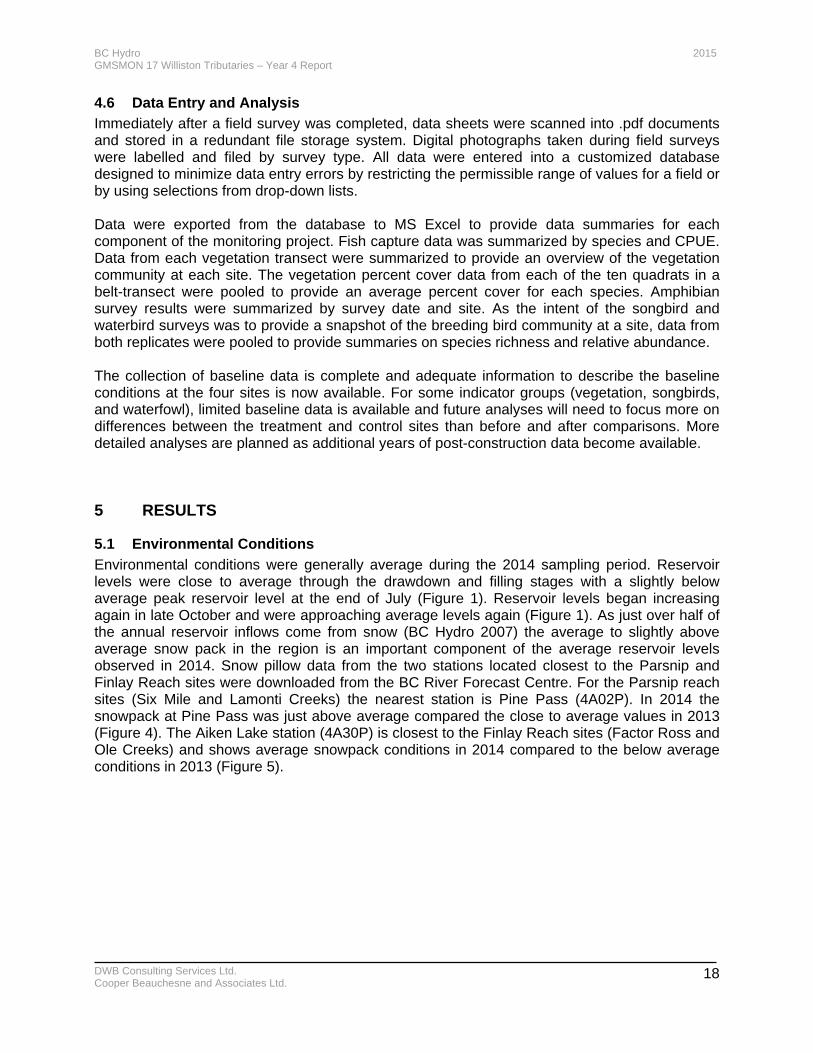
BC Hydro 2015 GMSMON 17 Williston Tributaries – Year 4 Report
DWB Consulting Services Ltd. Cooper Beauchesne and Associates Ltd.
18
4.6 Data Entry and Analysis
Immediately after a field survey was completed, data sheets were scanned into .pdf documents and stored in a redundant file storage system. Digital photographs taken during field surveys were labelled and filed by survey type. All data were entered into a customized database designed to minimize data entry errors by restricting the permissible range of values for a field or by using selections from drop-down lists. Data were exported from the database to MS Excel to provide data summaries for each component of the monitoring project. Fish capture data was summarized by species and CPUE. Data from each vegetation transect were summarized to provide an overview of the vegetation community at each site. The vegetation percent cover data from each of the ten quadrats in a belt-transect were pooled to provide an average percent cover for each species. Amphibian survey results were summarized by survey date and site. As the intent of the songbird and waterbird surveys was to provide a snapshot of the breeding bird community at a site, data from both replicates were pooled to provide summaries on species richness and relative abundance. The collection of baseline data is complete and adequate information to describe the baseline conditions at the four sites is now available. For some indicator groups (vegetation, songbirds, and waterfowl), limited baseline data is available and future analyses will need to focus more on differences between the treatment and control sites than before and after comparisons. More detailed analyses are planned as additional years of post-construction data become available.
5 RESULTS
5.1 Environmental Conditions
Environmental conditions were generally average during the 2014 sampling period. Reservoir levels were close to average through the drawdown and filling stages with a slightly below average peak reservoir level at the end of July (Figure 1). Reservoir levels began increasing again in late October and were approaching average levels again (Figure 1). As just over half of the annual reservoir inflows come from snow (BC Hydro 2007) the average to slightly above average snow pack in the region is an important component of the average reservoir levels observed in 2014. Snow pillow data from the two stations located closest to the Parsnip and Finlay Reach sites were downloaded from the BC River Forecast Centre. For the Parsnip reach sites (Six Mile and Lamonti Creeks) the nearest station is Pine Pass (4A02P). In 2014 the snowpack at Pine Pass was just above average compared the close to average values in 2013 (Figure 4). The Aiken Lake station (4A30P) is closest to the Finlay Reach sites (Factor Ross and Ole Creeks) and shows average snowpack conditions in 2014 compared to the below average conditions in 2013 (Figure 5).
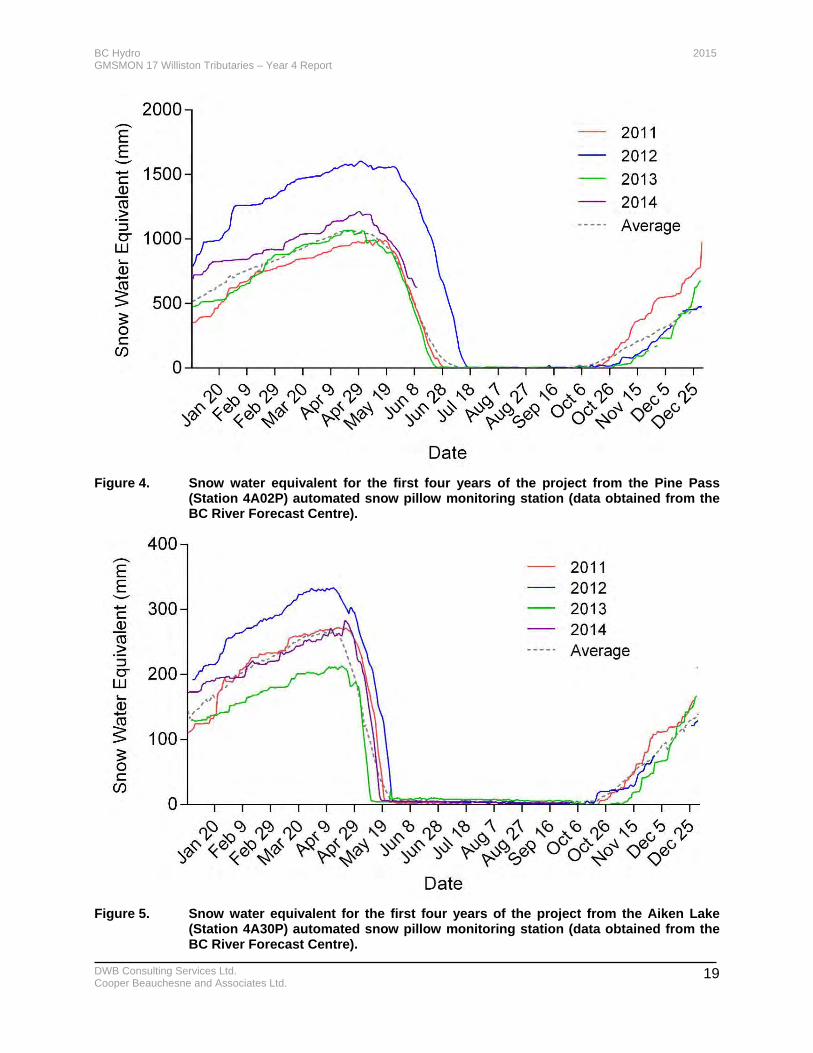
BC Hydro 2015 GMSMON 17 Williston Tributaries – Year 4 Report
DWB Consulting Services Ltd. Cooper Beauchesne and Associates Ltd.
19
Figure 4. Snow water equivalent for the first four years of the project from the Pine Pass
(Station 4A02P) automated snow pillow monitoring station (data obtained from the BC River Forecast Centre).
Figure 5. Snow water equivalent for the first four years of the project from the Aiken Lake
(Station 4A30P) automated snow pillow monitoring station (data obtained from the BC River Forecast Centre).
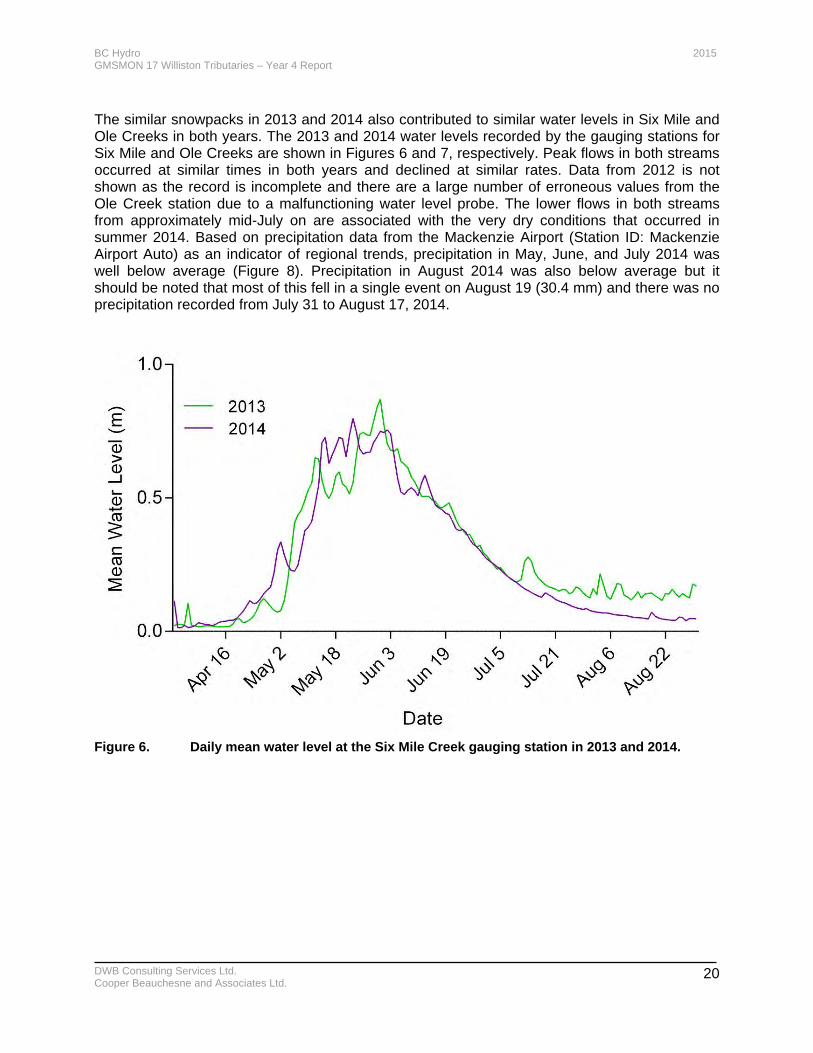
BC Hydro 2015 GMSMON 17 Williston Tributaries – Year 4 Report
DWB Consulting Services Ltd. Cooper Beauchesne and Associates Ltd.
20
The similar snowpacks in 2013 and 2014 also contributed to similar water levels in Six Mile and Ole Creeks in both years. The 2013 and 2014 water levels recorded by the gauging stations for Six Mile and Ole Creeks are shown in Figures 6 and 7, respectively. Peak flows in both streams occurred at similar times in both years and declined at similar rates. Data from 2012 is not shown as the record is incomplete and there are a large number of erroneous values from the Ole Creek station due to a malfunctioning water level probe. The lower flows in both streams from approximately mid-July on are associated with the very dry conditions that occurred in summer 2014. Based on precipitation data from the Mackenzie Airport (Station ID: Mackenzie Airport Auto) as an indicator of regional trends, precipitation in May, June, and July 2014 was well below average (Figure 8). Precipitation in August 2014 was also below average but it should be noted that most of this fell in a single event on August 19 (30.4 mm) and there was no precipitation recorded from July 31 to August 17, 2014.
Figure 6. Daily mean water level at the Six Mile Creek gauging station in 2013 and 2014.
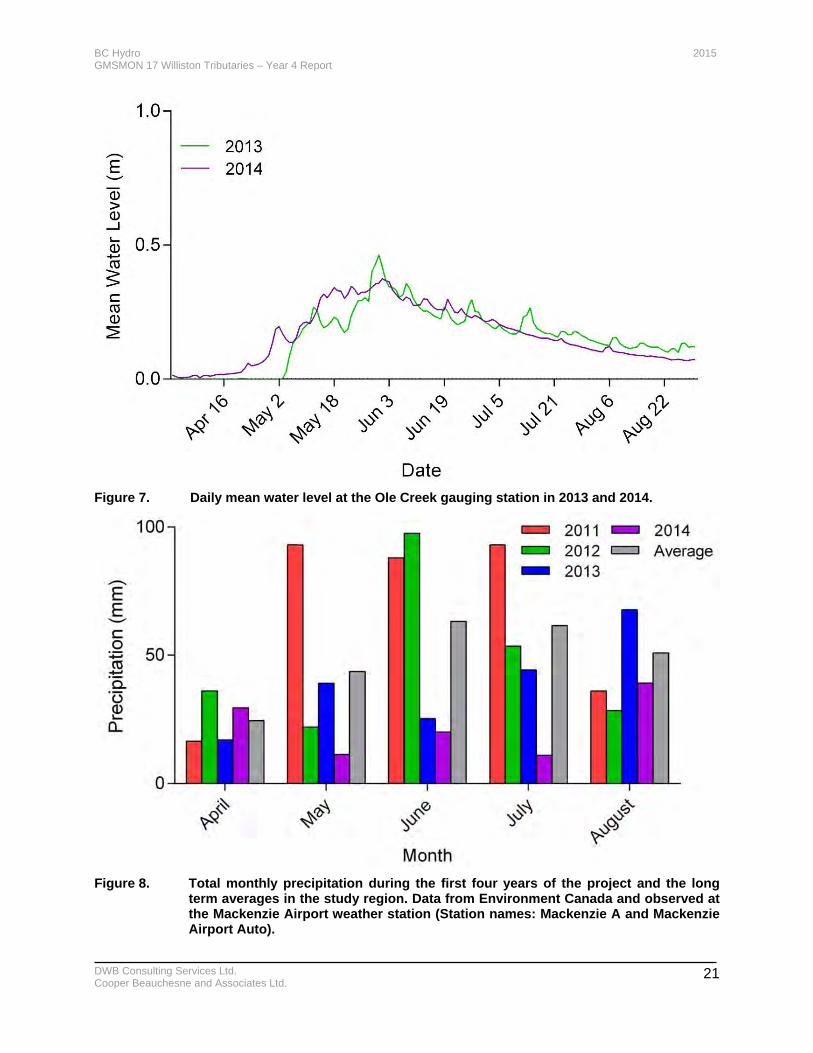
BC Hydro 2015 GMSMON 17 Williston Tributaries – Year 4 Report
DWB Consulting Services Ltd. Cooper Beauchesne and Associates Ltd.
21
Figure 7. Daily mean water level at the Ole Creek gauging station in 2013 and 2014.
Figure 8. Total monthly precipitation during the first four years of the project and the long
term averages in the study region. Data from Environment Canada and observed at the Mackenzie Airport weather station (Station names: Mackenzie A and Mackenzie Airport Auto).
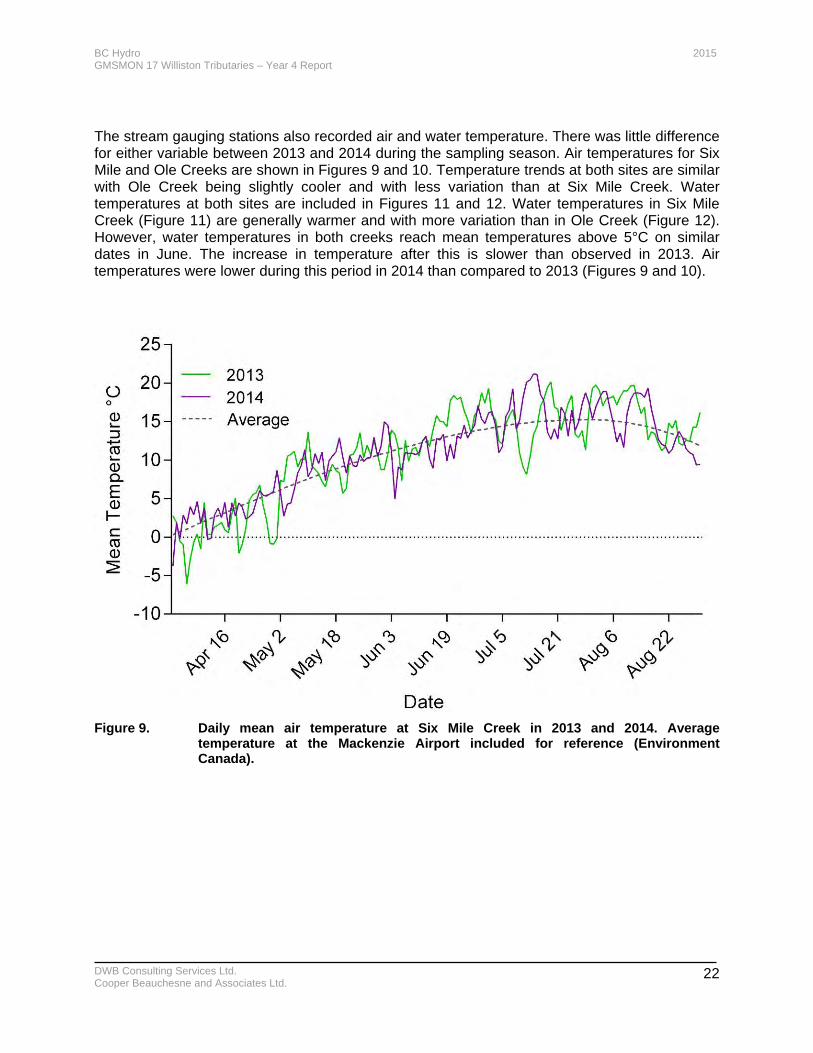
BC Hydro 2015 GMSMON 17 Williston Tributaries – Year 4 Report
DWB Consulting Services Ltd. Cooper Beauchesne and Associates Ltd.
22
The stream gauging stations also recorded air and water temperature. There was little difference for either variable between 2013 and 2014 during the sampling season. Air temperatures for Six Mile and Ole Creeks are shown in Figures 9 and 10. Temperature trends at both sites are similar with Ole Creek being slightly cooler and with less variation than at Six Mile Creek. Water temperatures at both sites are included in Figures 11 and 12. Water temperatures in Six Mile Creek (Figure 11) are generally warmer and with more variation than in Ole Creek (Figure 12). However, water temperatures in both creeks reach mean temperatures above 5°C on similar dates in June. The increase in temperature after this is slower than observed in 2013. Air temperatures were lower during this period in 2014 than compared to 2013 (Figures 9 and 10).
Figure 9. Daily mean air temperature at Six Mile Creek in 2013 and 2014. Average
temperature at the Mackenzie Airport included for reference (Environment Canada).
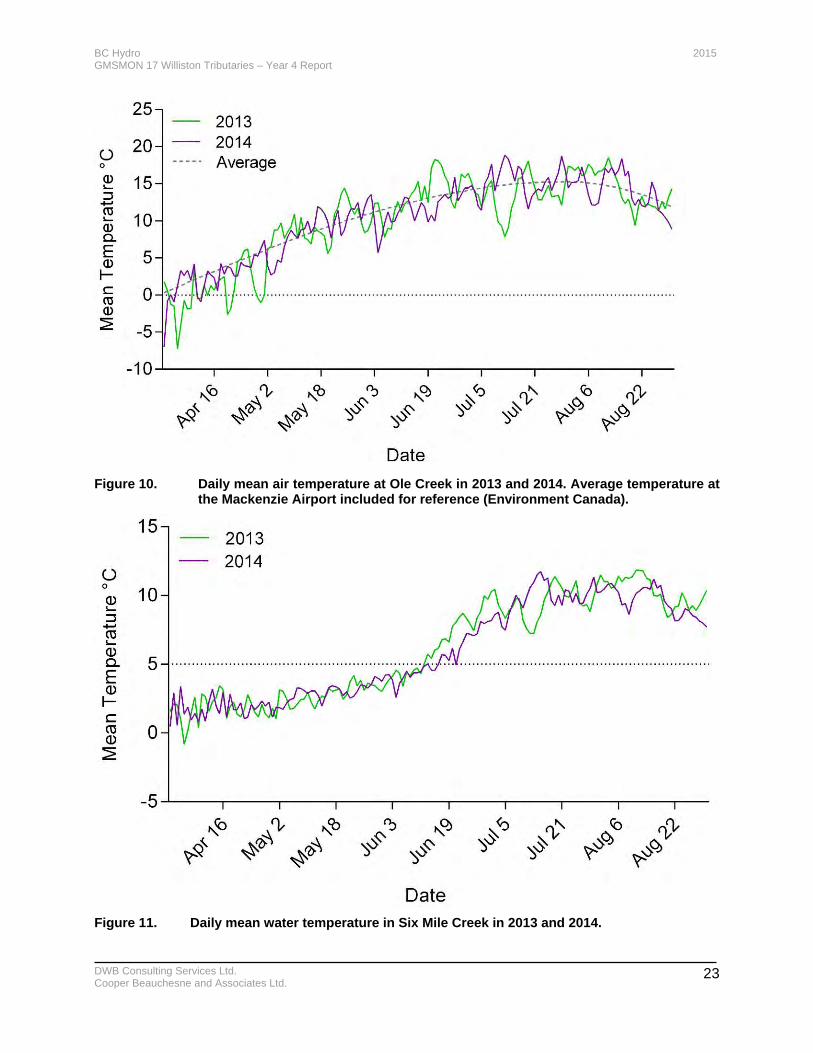
BC Hydro 2015 GMSMON 17 Williston Tributaries – Year 4 Report
DWB Consulting Services Ltd. Cooper Beauchesne and Associates Ltd.
23
Figure 10. Daily mean air temperature at Ole Creek in 2013 and 2014. Average temperature at
the Mackenzie Airport included for reference (Environment Canada).
Figure 11. Daily mean water temperature in Six Mile Creek in 2013 and 2014.
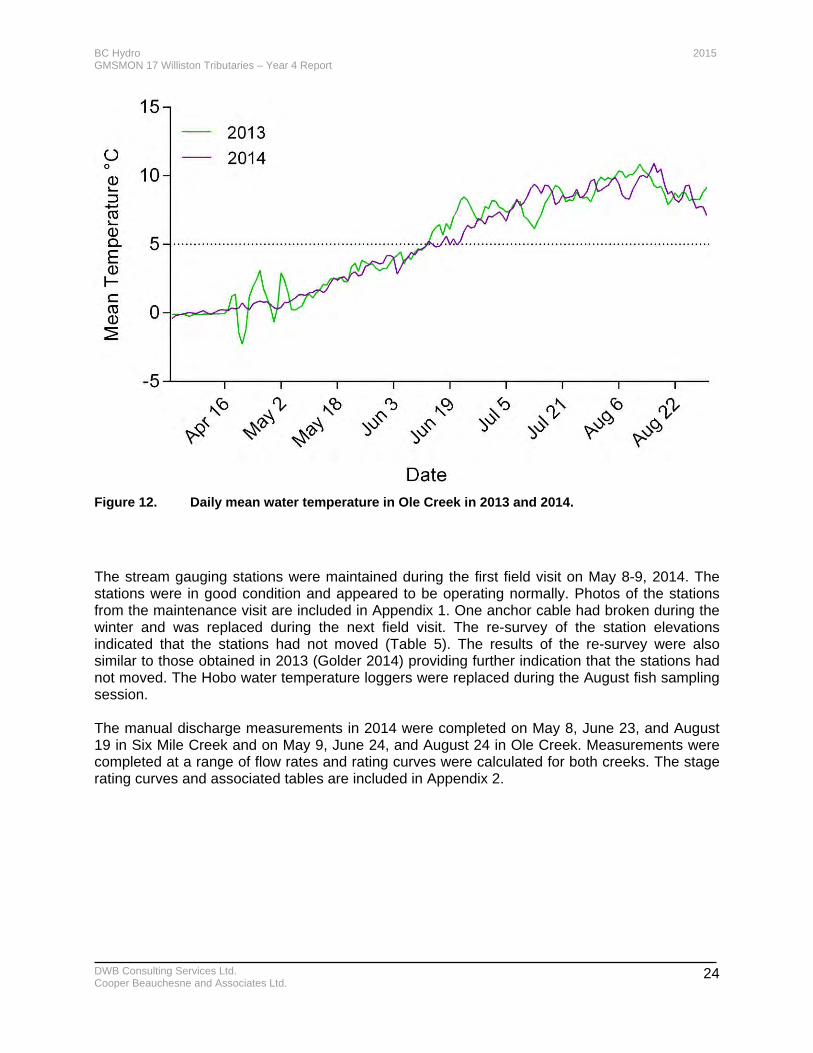
BC Hydro 2015 GMSMON 17 Williston Tributaries – Year 4 Report
DWB Consulting Services Ltd. Cooper Beauchesne and Associates Ltd.
24
Figure 12. Daily mean water temperature in Ole Creek in 2013 and 2014.
The stream gauging stations were maintained during the first field visit on May 8-9, 2014. The stations were in good condition and appeared to be operating normally. Photos of the stations from the maintenance visit are included in Appendix 1. One anchor cable had broken during the winter and was replaced during the next field visit. The re-survey of the station elevations indicated that the stations had not moved (Table 5). The results of the re-survey were also similar to those obtained in 2013 (Golder 2014) providing further indication that the stations had not moved. The Hobo water temperature loggers were replaced during the August fish sampling session. The manual discharge measurements in 2014 were completed on May 8, June 23, and August 19 in Six Mile Creek and on May 9, June 24, and August 24 in Ole Creek. Measurements were completed at a range of flow rates and rating curves were calculated for both creeks. The stage rating curves and associated tables are included in Appendix 2.
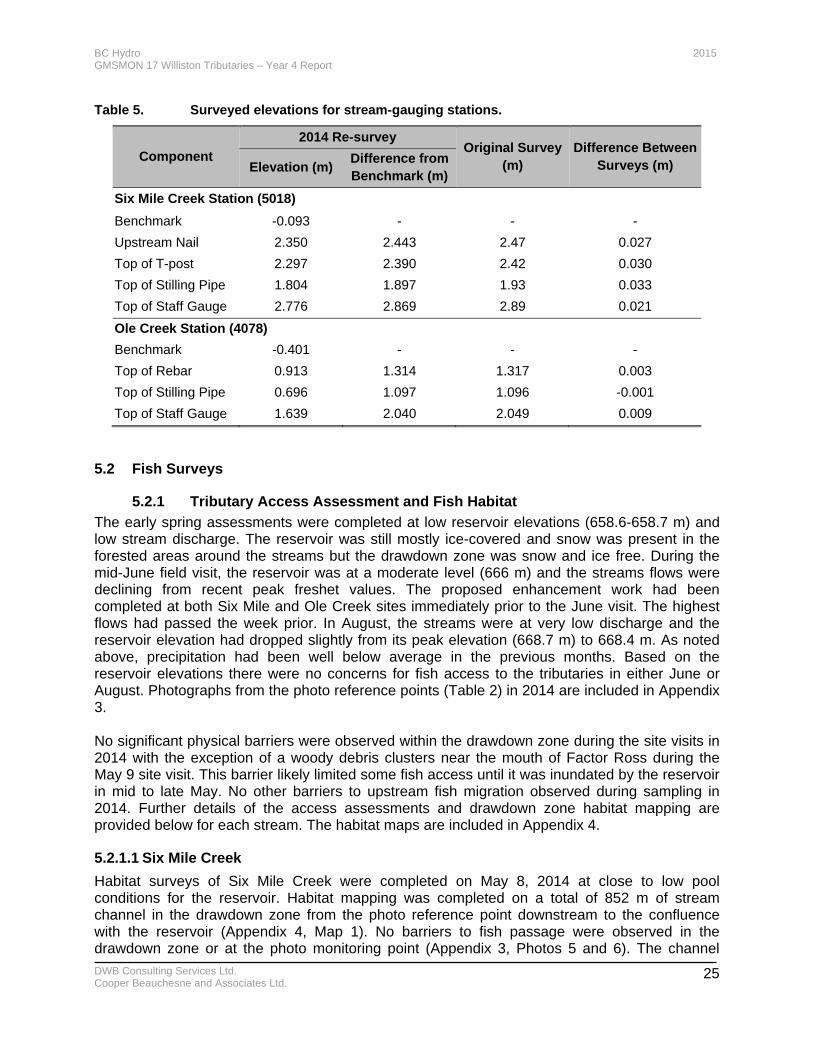
BC Hydro 2015 GMSMON 17 Williston Tributaries – Year 4 Report
DWB Consulting Services Ltd. Cooper Beauchesne and Associates Ltd.
25
Table 5. Surveyed elevations for stream-gauging stations.
Component
2014 Re-survey Original Survey
(m) Difference Between
Surveys (m) Elevation (m) Difference from Benchmark (m)
Six Mile Creek Station (5018)
Benchmark -0.093 - - -
Upstream Nail 2.350 2.443 2.47 0.027
Top of T-post 2.297 2.390 2.42 0.030
Top of Stilling Pipe 1.804 1.897 1.93 0.033
Top of Staff Gauge 2.776 2.869 2.89 0.021
Ole Creek Station (4078)
Benchmark -0.401 - - -
Top of Rebar 0.913 1.314 1.317 0.003
Top of Stilling Pipe 0.696 1.097 1.096 -0.001
Top of Staff Gauge 1.639 2.040 2.049 0.009
5.2 Fish Surveys
5.2.1 Tributary Access Assessment and Fish Habitat
The early spring assessments were completed at low reservoir elevations (658.6-658.7 m) and low stream discharge. The reservoir was still mostly ice-covered and snow was present in the forested areas around the streams but the drawdown zone was snow and ice free. During the mid-June field visit, the reservoir was at a moderate level (666 m) and the streams flows were declining from recent peak freshet values. The proposed enhancement work had been completed at both Six Mile and Ole Creek sites immediately prior to the June visit. The highest flows had passed the week prior. In August, the streams were at very low discharge and the reservoir elevation had dropped slightly from its peak elevation (668.7 m) to 668.4 m. As noted above, precipitation had been well below average in the previous months. Based on the reservoir elevations there were no concerns for fish access to the tributaries in either June or August. Photographs from the photo reference points (Table 2) in 2014 are included in Appendix 3. No significant physical barriers were observed within the drawdown zone during the site visits in 2014 with the exception of a woody debris clusters near the mouth of Factor Ross during the May 9 site visit. This barrier likely limited some fish access until it was inundated by the reservoir in mid to late May. No other barriers to upstream fish migration observed during sampling in 2014. Further details of the access assessments and drawdown zone habitat mapping are provided below for each stream. The habitat maps are included in Appendix 4.
5.2.1.1 Six Mile Creek
Habitat surveys of Six Mile Creek were completed on May 8, 2014 at close to low pool conditions for the reservoir. Habitat mapping was completed on a total of 852 m of stream channel in the drawdown zone from the photo reference point downstream to the confluence with the reservoir (Appendix 4, Map 1). No barriers to fish passage were observed in the drawdown zone or at the photo monitoring point (Appendix 3, Photos 5 and 6). The channel
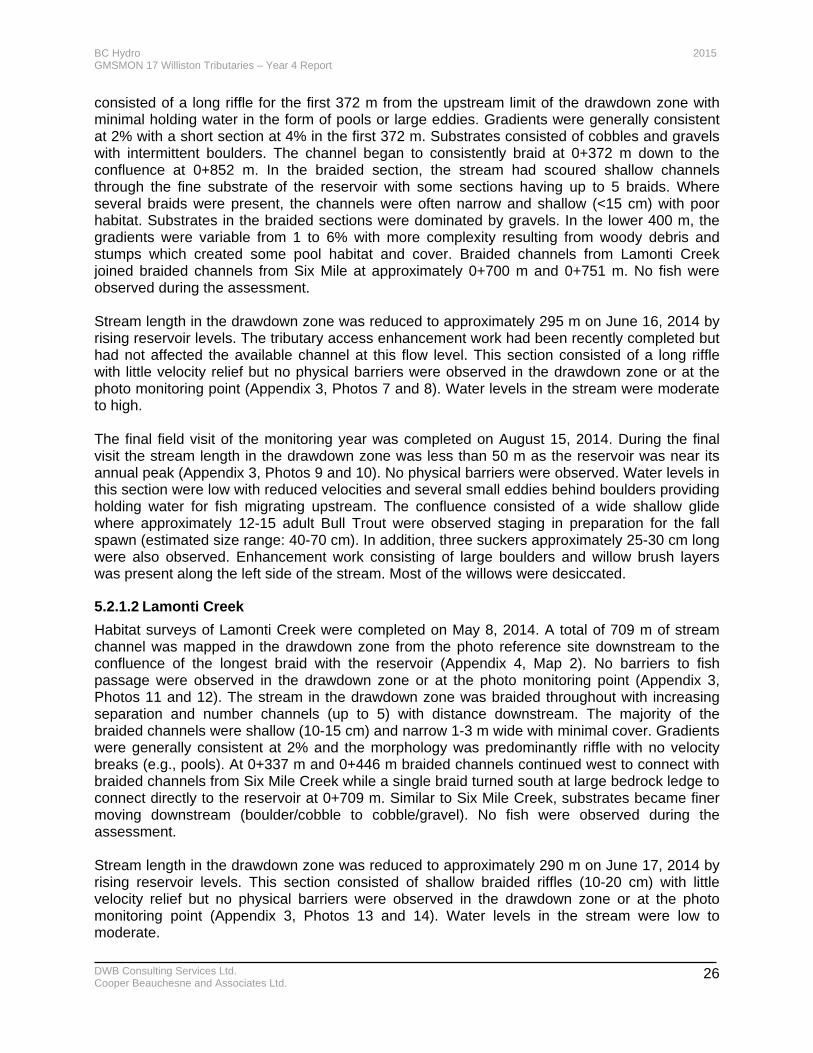
BC Hydro 2015 GMSMON 17 Williston Tributaries – Year 4 Report
DWB Consulting Services Ltd. Cooper Beauchesne and Associates Ltd.
26
consisted of a long riffle for the first 372 m from the upstream limit of the drawdown zone with minimal holding water in the form of pools or large eddies. Gradients were generally consistent at 2% with a short section at 4% in the first 372 m. Substrates consisted of cobbles and gravels with intermittent boulders. The channel began to consistently braid at 0+372 m down to the confluence at 0+852 m. In the braided section, the stream had scoured shallow channels through the fine substrate of the reservoir with some sections having up to 5 braids. Where several braids were present, the channels were often narrow and shallow (<15 cm) with poor habitat. Substrates in the braided sections were dominated by gravels. In the lower 400 m, the gradients were variable from 1 to 6% with more complexity resulting from woody debris and stumps which created some pool habitat and cover. Braided channels from Lamonti Creek joined braided channels from Six Mile at approximately 0+700 m and 0+751 m. No fish were observed during the assessment. Stream length in the drawdown zone was reduced to approximately 295 m on June 16, 2014 by rising reservoir levels. The tributary access enhancement work had been recently completed but had not affected the available channel at this flow level. This section consisted of a long riffle with little velocity relief but no physical barriers were observed in the drawdown zone or at the photo monitoring point (Appendix 3, Photos 7 and 8). Water levels in the stream were moderate to high. The final field visit of the monitoring year was completed on August 15, 2014. During the final visit the stream length in the drawdown zone was less than 50 m as the reservoir was near its annual peak (Appendix 3, Photos 9 and 10). No physical barriers were observed. Water levels in this section were low with reduced velocities and several small eddies behind boulders providing holding water for fish migrating upstream. The confluence consisted of a wide shallow glide where approximately 12-15 adult Bull Trout were observed staging in preparation for the fall spawn (estimated size range: 40-70 cm). In addition, three suckers approximately 25-30 cm long were also observed. Enhancement work consisting of large boulders and willow brush layers was present along the left side of the stream. Most of the willows were desiccated.
5.2.1.2 Lamonti Creek
Habitat surveys of Lamonti Creek were completed on May 8, 2014. A total of 709 m of stream channel was mapped in the drawdown zone from the photo reference site downstream to the confluence of the longest braid with the reservoir (Appendix 4, Map 2). No barriers to fish passage were observed in the drawdown zone or at the photo monitoring point (Appendix 3, Photos 11 and 12). The stream in the drawdown zone was braided throughout with increasing separation and number channels (up to 5) with distance downstream. The majority of the braided channels were shallow (10-15 cm) and narrow 1-3 m wide with minimal cover. Gradients were generally consistent at 2% and the morphology was predominantly riffle with no velocity breaks (e.g., pools). At 0+337 m and 0+446 m braided channels continued west to connect with braided channels from Six Mile Creek while a single braid turned south at large bedrock ledge to connect directly to the reservoir at 0+709 m. Similar to Six Mile Creek, substrates became finer moving downstream (boulder/cobble to cobble/gravel). No fish were observed during the assessment. Stream length in the drawdown zone was reduced to approximately 290 m on June 17, 2014 by rising reservoir levels. This section consisted of shallow braided riffles (10-20 cm) with little velocity relief but no physical barriers were observed in the drawdown zone or at the photo monitoring point (Appendix 3, Photos 13 and 14). Water levels in the stream were low to moderate.
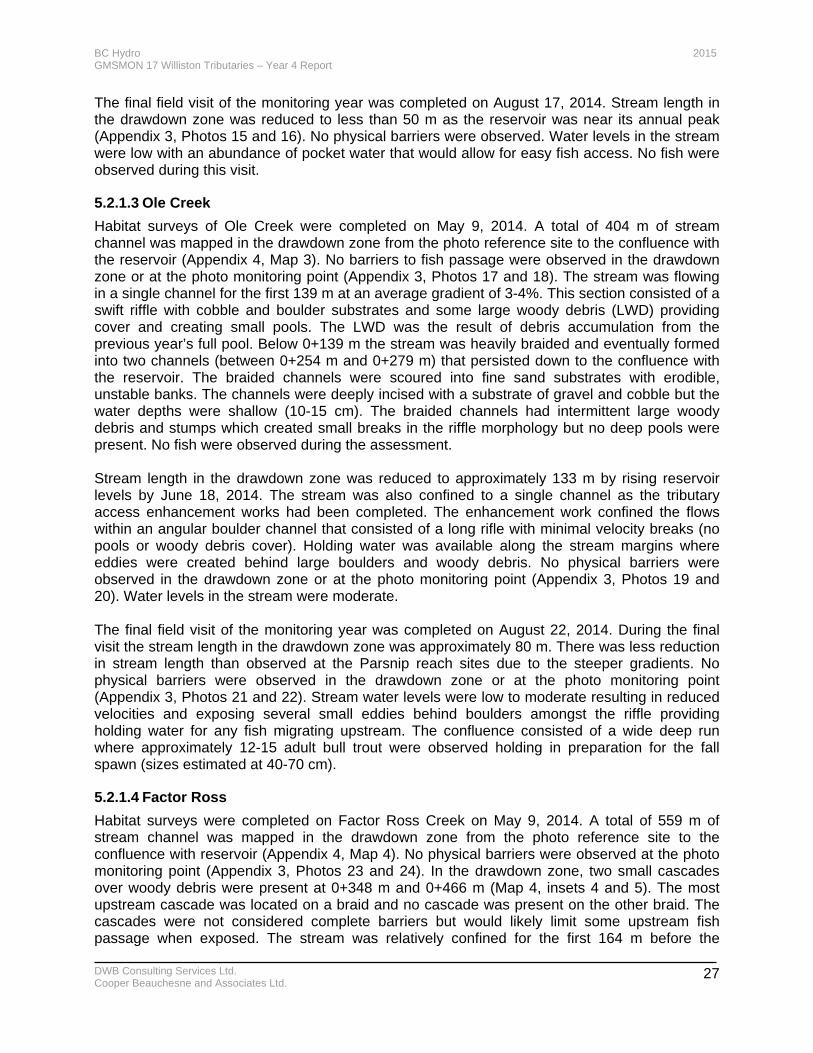
BC Hydro 2015 GMSMON 17 Williston Tributaries – Year 4 Report
DWB Consulting Services Ltd. Cooper Beauchesne and Associates Ltd.
27
The final field visit of the monitoring year was completed on August 17, 2014. Stream length in the drawdown zone was reduced to less than 50 m as the reservoir was near its annual peak (Appendix 3, Photos 15 and 16). No physical barriers were observed. Water levels in the stream were low with an abundance of pocket water that would allow for easy fish access. No fish were observed during this visit.
5.2.1.3 Ole Creek
Habitat surveys of Ole Creek were completed on May 9, 2014. A total of 404 m of stream channel was mapped in the drawdown zone from the photo reference site to the confluence with the reservoir (Appendix 4, Map 3). No barriers to fish passage were observed in the drawdown zone or at the photo monitoring point (Appendix 3, Photos 17 and 18). The stream was flowing in a single channel for the first 139 m at an average gradient of 3-4%. This section consisted of a swift riffle with cobble and boulder substrates and some large woody debris (LWD) providing cover and creating small pools. The LWD was the result of debris accumulation from the previous year’s full pool. Below 0+139 m the stream was heavily braided and eventually formed into two channels (between 0+254 m and 0+279 m) that persisted down to the confluence with the reservoir. The braided channels were scoured into fine sand substrates with erodible, unstable banks. The channels were deeply incised with a substrate of gravel and cobble but the water depths were shallow (10-15 cm). The braided channels had intermittent large woody debris and stumps which created small breaks in the riffle morphology but no deep pools were present. No fish were observed during the assessment. Stream length in the drawdown zone was reduced to approximately 133 m by rising reservoir levels by June 18, 2014. The stream was also confined to a single channel as the tributary access enhancement works had been completed. The enhancement work confined the flows within an angular boulder channel that consisted of a long rifle with minimal velocity breaks (no pools or woody debris cover). Holding water was available along the stream margins where eddies were created behind large boulders and woody debris. No physical barriers were observed in the drawdown zone or at the photo monitoring point (Appendix 3, Photos 19 and 20). Water levels in the stream were moderate. The final field visit of the monitoring year was completed on August 22, 2014. During the final visit the stream length in the drawdown zone was approximately 80 m. There was less reduction in stream length than observed at the Parsnip reach sites due to the steeper gradients. No physical barriers were observed in the drawdown zone or at the photo monitoring point (Appendix 3, Photos 21 and 22). Stream water levels were low to moderate resulting in reduced velocities and exposing several small eddies behind boulders amongst the riffle providing holding water for any fish migrating upstream. The confluence consisted of a wide deep run where approximately 12-15 adult bull trout were observed holding in preparation for the fall spawn (sizes estimated at 40-70 cm).
5.2.1.4 Factor Ross
Habitat surveys were completed on Factor Ross Creek on May 9, 2014. A total of 559 m of stream channel was mapped in the drawdown zone from the photo reference site to the confluence with reservoir (Appendix 4, Map 4). No physical barriers were observed at the photo monitoring point (Appendix 3, Photos 23 and 24). In the drawdown zone, two small cascades over woody debris were present at 0+348 m and 0+466 m (Map 4, insets 4 and 5). The most upstream cascade was located on a braid and no cascade was present on the other braid. The cascades were not considered complete barriers but would likely limit some upstream fish passage when exposed. The stream was relatively confined for the first 164 m before the
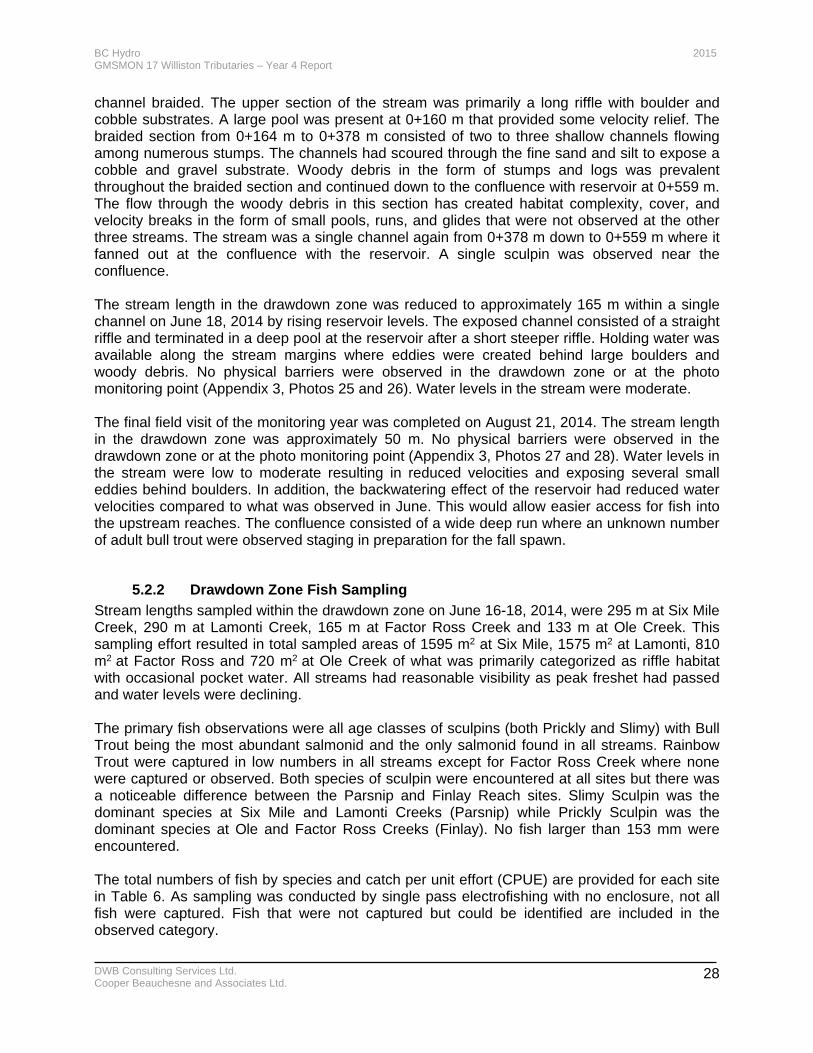
BC Hydro 2015 GMSMON 17 Williston Tributaries – Year 4 Report
DWB Consulting Services Ltd. Cooper Beauchesne and Associates Ltd.
28
channel braided. The upper section of the stream was primarily a long riffle with boulder and cobble substrates. A large pool was present at 0+160 m that provided some velocity relief. The braided section from 0+164 m to 0+378 m consisted of two to three shallow channels flowing among numerous stumps. The channels had scoured through the fine sand and silt to expose a cobble and gravel substrate. Woody debris in the form of stumps and logs was prevalent throughout the braided section and continued down to the confluence with reservoir at 0+559 m. The flow through the woody debris in this section has created habitat complexity, cover, and velocity breaks in the form of small pools, runs, and glides that were not observed at the other three streams. The stream was a single channel again from 0+378 m down to 0+559 m where it fanned out at the confluence with the reservoir. A single sculpin was observed near the confluence. The stream length in the drawdown zone was reduced to approximately 165 m within a single channel on June 18, 2014 by rising reservoir levels. The exposed channel consisted of a straight riffle and terminated in a deep pool at the reservoir after a short steeper riffle. Holding water was available along the stream margins where eddies were created behind large boulders and woody debris. No physical barriers were observed in the drawdown zone or at the photo monitoring point (Appendix 3, Photos 25 and 26). Water levels in the stream were moderate. The final field visit of the monitoring year was completed on August 21, 2014. The stream length in the drawdown zone was approximately 50 m. No physical barriers were observed in the drawdown zone or at the photo monitoring point (Appendix 3, Photos 27 and 28). Water levels in the stream were low to moderate resulting in reduced velocities and exposing several small eddies behind boulders. In addition, the backwatering effect of the reservoir had reduced water velocities compared to what was observed in June. This would allow easier access for fish into the upstream reaches. The confluence consisted of a wide deep run where an unknown number of adult bull trout were observed staging in preparation for the fall spawn.
5.2.2 Drawdown Zone Fish Sampling
Stream lengths sampled within the drawdown zone on June 16-18, 2014, were 295 m at Six Mile Creek, 290 m at Lamonti Creek, 165 m at Factor Ross Creek and 133 m at Ole Creek. This sampling effort resulted in total sampled areas of 1595 m2 at Six Mile, 1575 m2 at Lamonti, 810 m2 at Factor Ross and 720 m2 at Ole Creek of what was primarily categorized as riffle habitat with occasional pocket water. All streams had reasonable visibility as peak freshet had passed and water levels were declining. The primary fish observations were all age classes of sculpins (both Prickly and Slimy) with Bull Trout being the most abundant salmonid and the only salmonid found in all streams. Rainbow Trout were captured in low numbers in all streams except for Factor Ross Creek where none were captured or observed. Both species of sculpin were encountered at all sites but there was a noticeable difference between the Parsnip and Finlay Reach sites. Slimy Sculpin was the dominant species at Six Mile and Lamonti Creeks (Parsnip) while Prickly Sculpin was the dominant species at Ole and Factor Ross Creeks (Finlay). No fish larger than 153 mm were encountered. The total numbers of fish by species and catch per unit effort (CPUE) are provided for each site in Table 6. As sampling was conducted by single pass electrofishing with no enclosure, not all fish were captured. Fish that were not captured but could be identified are included in the observed category.
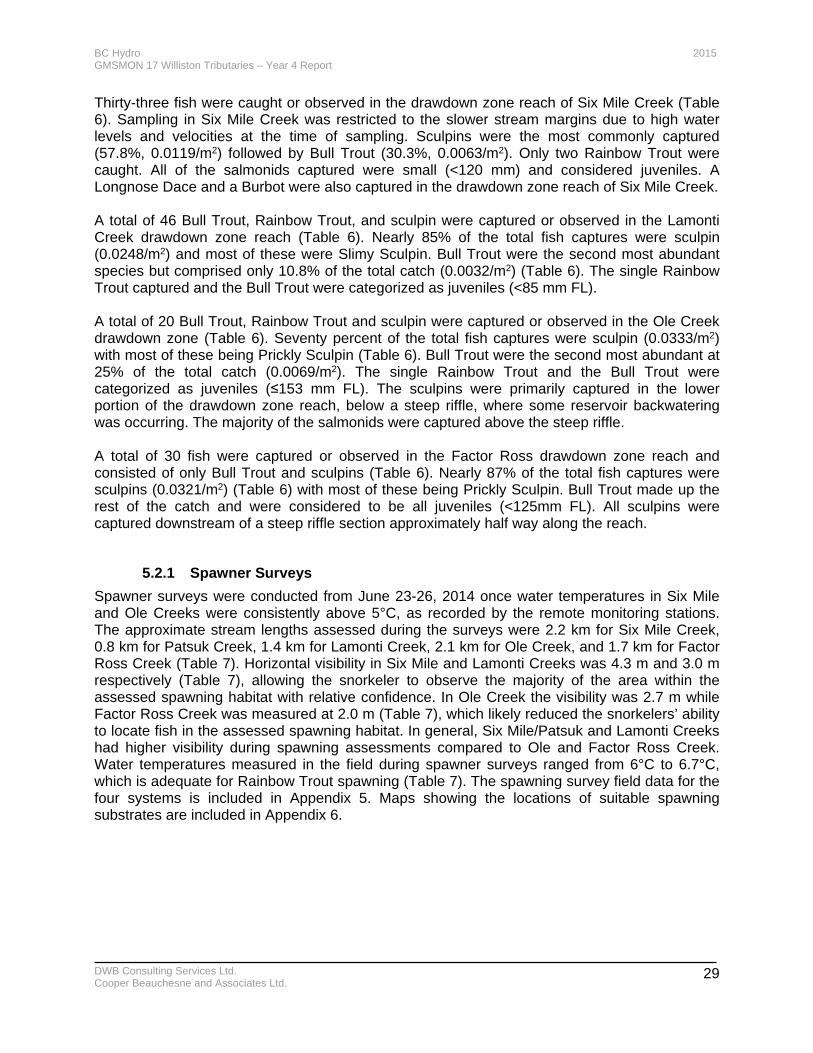
BC Hydro 2015 GMSMON 17 Williston Tributaries – Year 4 Report
DWB Consulting Services Ltd. Cooper Beauchesne and Associates Ltd.
29
Thirty-three fish were caught or observed in the drawdown zone reach of Six Mile Creek (Table 6). Sampling in Six Mile Creek was restricted to the slower stream margins due to high water levels and velocities at the time of sampling. Sculpins were the most commonly captured (57.8%, 0.0119/m2) followed by Bull Trout (30.3%, 0.0063/m2). Only two Rainbow Trout were caught. All of the salmonids captured were small (<120 mm) and considered juveniles. A Longnose Dace and a Burbot were also captured in the drawdown zone reach of Six Mile Creek. A total of 46 Bull Trout, Rainbow Trout, and sculpin were captured or observed in the Lamonti Creek drawdown zone reach (Table 6). Nearly 85% of the total fish captures were sculpin (0.0248/m2) and most of these were Slimy Sculpin. Bull Trout were the second most abundant species but comprised only 10.8% of the total catch (0.0032/m2) (Table 6). The single Rainbow Trout captured and the Bull Trout were categorized as juveniles (<85 mm FL). A total of 20 Bull Trout, Rainbow Trout and sculpin were captured or observed in the Ole Creek drawdown zone (Table 6). Seventy percent of the total fish captures were sculpin (0.0333/m2) with most of these being Prickly Sculpin (Table 6). Bull Trout were the second most abundant at 25% of the total catch (0.0069/m2). The single Rainbow Trout and the Bull Trout were categorized as juveniles (≤153 mm FL). The sculpins were primarily captured in the lower portion of the drawdown zone reach, below a steep riffle, where some reservoir backwatering was occurring. The majority of the salmonids were captured above the steep riffle. A total of 30 fish were captured or observed in the Factor Ross drawdown zone reach and consisted of only Bull Trout and sculpins (Table 6). Nearly 87% of the total fish captures were sculpins (0.0321/m2) (Table 6) with most of these being Prickly Sculpin. Bull Trout made up the rest of the catch and were considered to be all juveniles (<125mm FL). All sculpins were captured downstream of a steep riffle section approximately half way along the reach.
5.2.1 Spawner Surveys
Spawner surveys were conducted from June 23-26, 2014 once water temperatures in Six Mile and Ole Creeks were consistently above 5°C, as recorded by the remote monitoring stations. The approximate stream lengths assessed during the surveys were 2.2 km for Six Mile Creek, 0.8 km for Patsuk Creek, 1.4 km for Lamonti Creek, 2.1 km for Ole Creek, and 1.7 km for Factor Ross Creek (Table 7). Horizontal visibility in Six Mile and Lamonti Creeks was 4.3 m and 3.0 m respectively (Table 7), allowing the snorkeler to observe the majority of the area within the assessed spawning habitat with relative confidence. In Ole Creek the visibility was 2.7 m while Factor Ross Creek was measured at 2.0 m (Table 7), which likely reduced the snorkelers’ ability to locate fish in the assessed spawning habitat. In general, Six Mile/Patsuk and Lamonti Creeks had higher visibility during spawning assessments compared to Ole and Factor Ross Creek. Water temperatures measured in the field during spawner surveys ranged from 6°C to 6.7°C, which is adequate for Rainbow Trout spawning (Table 7). The spawning survey field data for the four systems is included in Appendix 5. Maps showing the locations of suitable spawning substrates are included in Appendix 6.
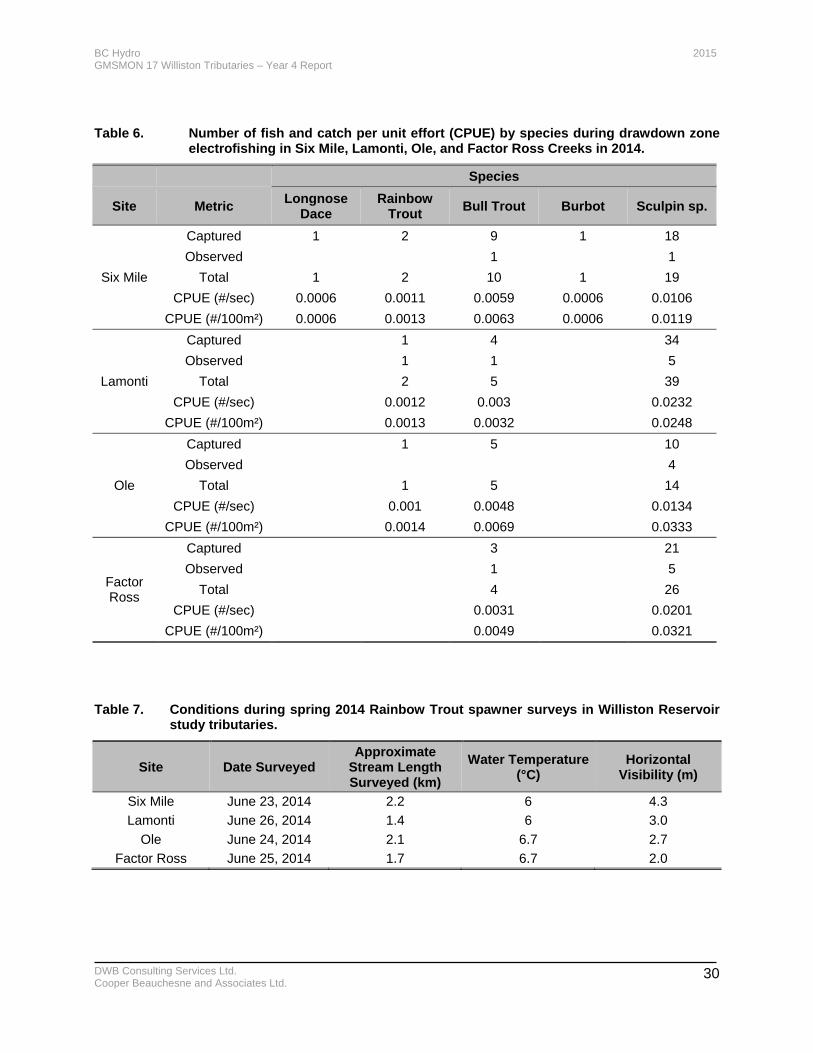
BC Hydro 2015 GMSMON 17 Williston Tributaries – Year 4 Report
DWB Consulting Services Ltd. Cooper Beauchesne and Associates Ltd.
30
Table 6. Number of fish and catch per unit effort (CPUE) by species during drawdown zone electrofishing in Six Mile, Lamonti, Ole, and Factor Ross Creeks in 2014.
Species
Site Metric Longnose
Dace Rainbow
Trout Bull Trout Burbot Sculpin sp.
Six Mile
Captured 1 2 9 1 18
Observed 1 1
Total 1 2 10 1 19
CPUE (#/sec) 0.0006 0.0011 0.0059 0.0006 0.0106
CPUE (#/100m²) 0.0006 0.0013 0.0063 0.0006 0.0119
Lamonti
Captured 1 4 34
Observed 1 1 5
Total 2 5 39
CPUE (#/sec) 0.0012 0.003 0.0232
CPUE (#/100m²) 0.0013 0.0032 0.0248
Ole
Captured 1 5 10
Observed 4
Total 1 5 14
CPUE (#/sec) 0.001 0.0048 0.0134
CPUE (#/100m²) 0.0014 0.0069 0.0333
Factor Ross
Captured 3 21
Observed 1 5
Total 4 26
CPUE (#/sec) 0.0031 0.0201
CPUE (#/100m²) 0.0049 0.0321
Table 7. Conditions during spring 2014 Rainbow Trout spawner surveys in Williston Reservoir study tributaries.
Site Date Surveyed Approximate
Stream Length Surveyed (km)
Water Temperature (°C)
Horizontal Visibility (m)
Six Mile June 23, 2014 2.2 6 4.3
Lamonti June 26, 2014 1.4 6 3.0
Ole June 24, 2014 2.1 6.7 2.7
Factor Ross June 25, 2014 1.7 6.7 2.0
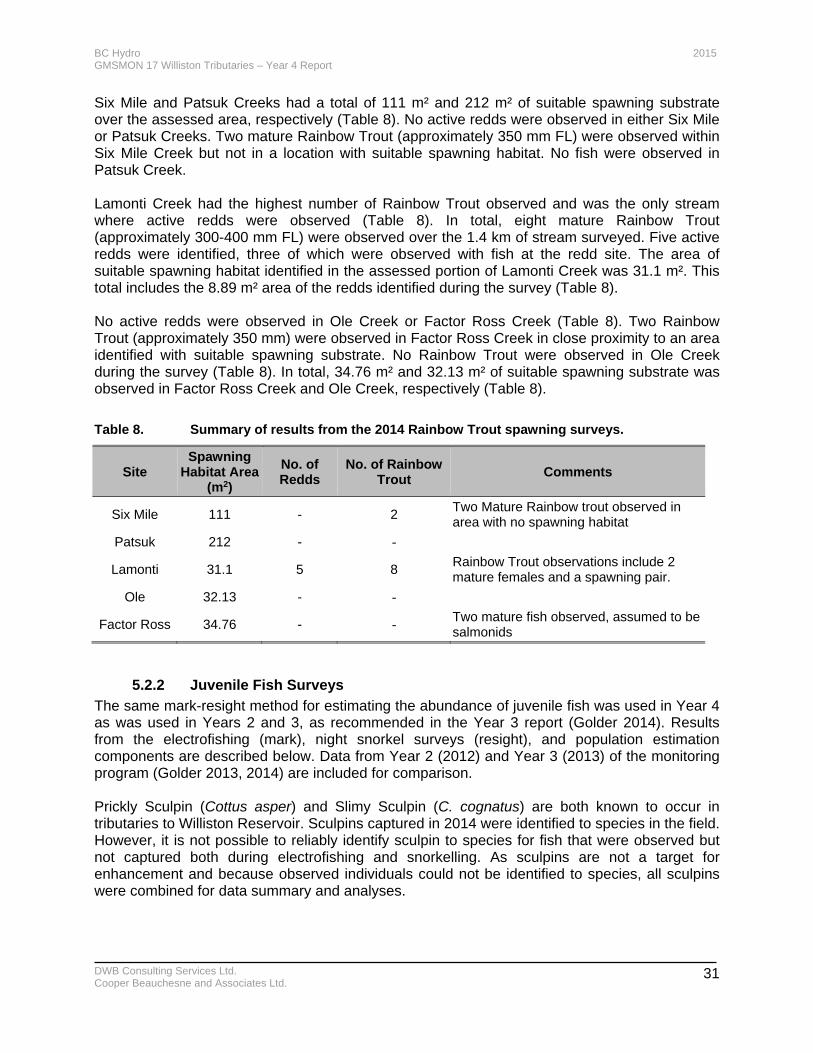
BC Hydro 2015 GMSMON 17 Williston Tributaries – Year 4 Report
DWB Consulting Services Ltd. Cooper Beauchesne and Associates Ltd.
31
Six Mile and Patsuk Creeks had a total of 111 m² and 212 m² of suitable spawning substrate over the assessed area, respectively (Table 8). No active redds were observed in either Six Mile or Patsuk Creeks. Two mature Rainbow Trout (approximately 350 mm FL) were observed within Six Mile Creek but not in a location with suitable spawning habitat. No fish were observed in Patsuk Creek. Lamonti Creek had the highest number of Rainbow Trout observed and was the only stream where active redds were observed (Table 8). In total, eight mature Rainbow Trout (approximately 300-400 mm FL) were observed over the 1.4 km of stream surveyed. Five active redds were identified, three of which were observed with fish at the redd site. The area of suitable spawning habitat identified in the assessed portion of Lamonti Creek was 31.1 m². This total includes the 8.89 m² area of the redds identified during the survey (Table 8). No active redds were observed in Ole Creek or Factor Ross Creek (Table 8). Two Rainbow Trout (approximately 350 mm) were observed in Factor Ross Creek in close proximity to an area identified with suitable spawning substrate. No Rainbow Trout were observed in Ole Creek during the survey (Table 8). In total, 34.76 m² and 32.13 m² of suitable spawning substrate was observed in Factor Ross Creek and Ole Creek, respectively (Table 8).
Table 8. Summary of results from the 2014 Rainbow Trout spawning surveys.
Site Spawning
Habitat Area (m2)
No. of Redds
No. of Rainbow Trout
Comments
Six Mile 111 - 2 Two Mature Rainbow trout observed in area with no spawning habitat
Patsuk 212 - -
Lamonti 31.1 5 8 Rainbow Trout observations include 2 mature females and a spawning pair.
Ole 32.13 - -
Factor Ross 34.76 - - Two mature fish observed, assumed to be salmonids
5.2.2 Juvenile Fish Surveys
The same mark-resight method for estimating the abundance of juvenile fish was used in Year 4 as was used in Years 2 and 3, as recommended in the Year 3 report (Golder 2014). Results from the electrofishing (mark), night snorkel surveys (resight), and population estimation components are described below. Data from Year 2 (2012) and Year 3 (2013) of the monitoring program (Golder 2013, 2014) are included for comparison. Prickly Sculpin (Cottus asper) and Slimy Sculpin (C. cognatus) are both known to occur in tributaries to Williston Reservoir. Sculpins captured in 2014 were identified to species in the field. However, it is not possible to reliably identify sculpin to species for fish that were observed but not captured both during electrofishing and snorkelling. As sculpins are not a target for enhancement and because observed individuals could not be identified to species, all sculpins were combined for data summary and analyses.

BC Hydro 2015 GMSMON 17 Williston Tributaries – Year 4 Report
DWB Consulting Services Ltd. Cooper Beauchesne and Associates Ltd.
32
5.2.2.1 Electrofishing
Fish captures through electrofishing in Year 4 were higher than in either Year 2 or 3 but varied between the four streams. Maps showing the locations of the electrofishing and snorkelling sites for each stream are included in Appendix 6. A summary of the electrofishing sites and effort for all streams is included in Appendix 7. A total of 32 fish were marked in the Parsnip Reach sites with 12 in Six Mile Creek and 20 in Lamonti Creek (Table 9). In the Finlay Reach sites, a total of 48 fish were marked with 28 in Ole Creek and 20 in Factor Ross Creek (Table 10). Rainbow Trout was the only species that was captured and marked in all four streams (and). No Bull Trout were captured or marked in Lamonti Creek in 2014. As in previous years, Burbot were only found in Six Mile Creek. Mountain Whitefish were captured and marked in both Ole and Factor Ross Creek (Table 10). No Arctic Grayling were captured during electrofishing in Factor Ross Creek in 2014 (Table 10). In 2014, fish species captured and observed in Six Mile Creek by electrofishing included Bull Trout, Rainbow Trout, Burbot, and sculpins (Prickly and Slimy) (Table 9). Six Mile Creek is the only stream in the project where Burbot have been observed. Sculpins were the most abundant fish captured during electrofishing comprising 63.8% of the total in Six Mile Creek (Table 9). Sculpins were also the most abundant fish captured during electrofishing in Lamonti Creek representing 60.8% of the total. Rainbow trout were the only other species captured in Lamonti Creek in 2014 (Table 9). Fish species captured and observed during electrofishing in Ole and Factor Ross Creeks were similar to those observed in 2012 and 2013 with Rainbow Trout, Bull Trout, Mountain Whitefish and sculpins captured in both streams (Table 10). Kokanee and Arctic Grayling were not captured or observed during electrofishing in 2014 (Table 10). The relative abundance of Bull Trout was higher than Rainbow Trout in both Ole and Factor Ross Creeks (Table 10), which is the opposite of what was observed in the Parsnip Reach sites. The relative abundance of Bull Trout in Ole Creek and Mountain Whitefish in Factor Ross Creek based on the electrofishing surveys was notably higher than in previous years (Table 10).
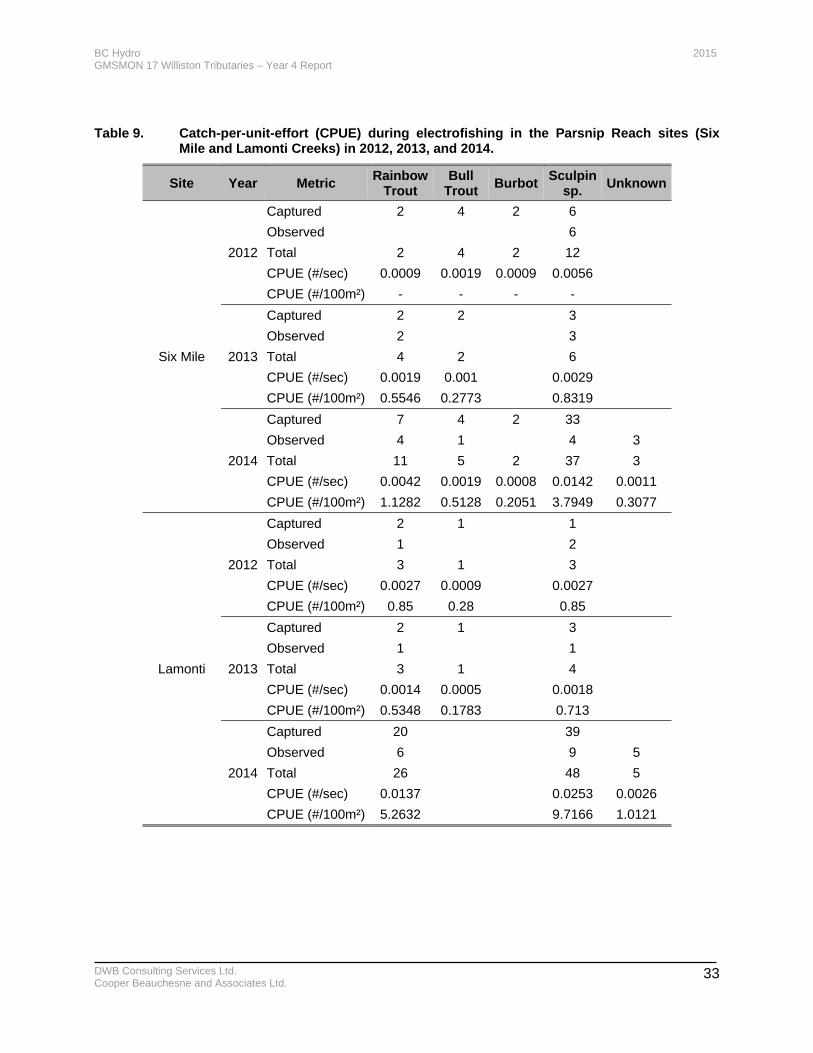
BC Hydro 2015 GMSMON 17 Williston Tributaries – Year 4 Report
DWB Consulting Services Ltd. Cooper Beauchesne and Associates Ltd.
33
Table 9. Catch-per-unit-effort (CPUE) during electrofishing in the Parsnip Reach sites (Six Mile and Lamonti Creeks) in 2012, 2013, and 2014.
Site Year Metric Rainbow
Trout Bull
Trout Burbot
Sculpin sp.
Unknown
Six Mile
2012
Captured 2 4 2 6
Observed 6
Total 2 4 2 12
CPUE (#/sec) 0.0009 0.0019 0.0009 0.0056
CPUE (#/100m²) - - - -
2013
Captured 2 2 3
Observed 2 3
Total 4 2 6
CPUE (#/sec) 0.0019 0.001 0.0029
CPUE (#/100m²) 0.5546 0.2773 0.8319
2014
Captured 7 4 2 33
Observed 4 1 4 3
Total 11 5 2 37 3
CPUE (#/sec) 0.0042 0.0019 0.0008 0.0142 0.0011
CPUE (#/100m²) 1.1282 0.5128 0.2051 3.7949 0.3077
Lamonti
2012
Captured 2 1 1
Observed 1 2
Total 3 1 3
CPUE (#/sec) 0.0027 0.0009 0.0027
CPUE (#/100m²) 0.85 0.28 0.85
2013
Captured 2 1 3
Observed 1 1
Total 3 1 4
CPUE (#/sec) 0.0014 0.0005 0.0018
CPUE (#/100m²) 0.5348 0.1783 0.713
2014
Captured 20 39
Observed 6 9 5
Total 26 48 5
CPUE (#/sec) 0.0137 0.0253 0.0026
CPUE (#/100m²) 5.2632 9.7166 1.0121
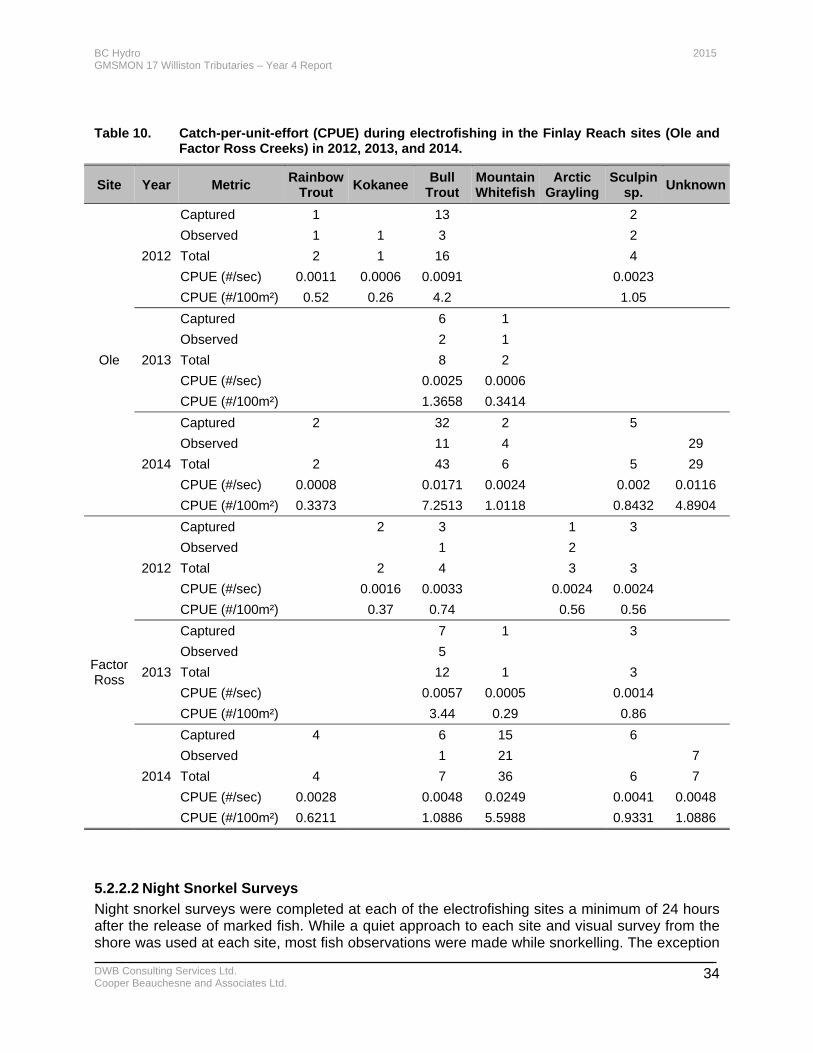
BC Hydro 2015 GMSMON 17 Williston Tributaries – Year 4 Report
DWB Consulting Services Ltd. Cooper Beauchesne and Associates Ltd.
34
Table 10. Catch-per-unit-effort (CPUE) during electrofishing in the Finlay Reach sites (Ole and Factor Ross Creeks) in 2012, 2013, and 2014.
Site Year Metric Rainbow
Trout Kokanee
Bull Trout
Mountain Whitefish
Arctic Grayling
Sculpin sp.
Unknown
Ole
2012
Captured 1 13 2
Observed 1 1 3 2
Total 2 1 16 4
CPUE (#/sec) 0.0011 0.0006 0.0091 0.0023
CPUE (#/100m²) 0.52 0.26 4.2 1.05
2013
Captured 6 1
Observed 2 1
Total 8 2
CPUE (#/sec) 0.0025 0.0006
CPUE (#/100m²) 1.3658 0.3414
2014
Captured 2 32 2 5
Observed 11 4 29
Total 2 43 6 5 29
CPUE (#/sec) 0.0008 0.0171 0.0024 0.002 0.0116
CPUE (#/100m²) 0.3373 7.2513 1.0118 0.8432 4.8904
Factor Ross
2012
Captured 2 3 1 3
Observed 1 2
Total 2 4 3 3
CPUE (#/sec) 0.0016 0.0033 0.0024 0.0024
CPUE (#/100m²) 0.37 0.74 0.56 0.56
2013
Captured 7 1 3
Observed 5
Total 12 1 3
CPUE (#/sec) 0.0057 0.0005 0.0014
CPUE (#/100m²) 3.44 0.29 0.86
2014
Captured 4 6 15 6
Observed 1 21 7
Total 4 7 36 6 7
CPUE (#/sec) 0.0028 0.0048 0.0249 0.0041 0.0048
CPUE (#/100m²) 0.6211 1.0886 5.5988 0.9331 1.0886
5.2.2.2 Night Snorkel Surveys
Night snorkel surveys were completed at each of the electrofishing sites a minimum of 24 hours after the release of marked fish. While a quiet approach to each site and visual survey from the shore was used at each site, most fish observations were made while snorkelling. The exception
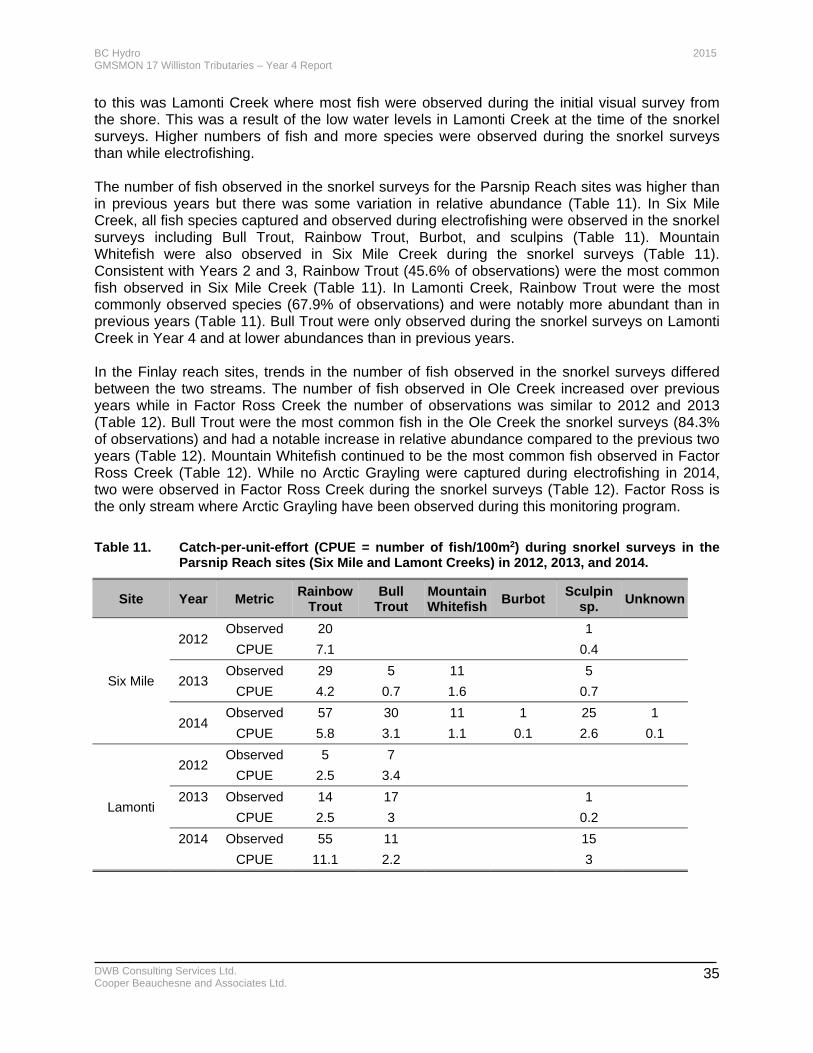
BC Hydro 2015 GMSMON 17 Williston Tributaries – Year 4 Report
DWB Consulting Services Ltd. Cooper Beauchesne and Associates Ltd.
35
to this was Lamonti Creek where most fish were observed during the initial visual survey from the shore. This was a result of the low water levels in Lamonti Creek at the time of the snorkel surveys. Higher numbers of fish and more species were observed during the snorkel surveys than while electrofishing. The number of fish observed in the snorkel surveys for the Parsnip Reach sites was higher than in previous years but there was some variation in relative abundance (Table 11). In Six Mile Creek, all fish species captured and observed during electrofishing were observed in the snorkel surveys including Bull Trout, Rainbow Trout, Burbot, and sculpins (Table 11). Mountain Whitefish were also observed in Six Mile Creek during the snorkel surveys (Table 11). Consistent with Years 2 and 3, Rainbow Trout (45.6% of observations) were the most common fish observed in Six Mile Creek (Table 11). In Lamonti Creek, Rainbow Trout were the most commonly observed species (67.9% of observations) and were notably more abundant than in previous years (Table 11). Bull Trout were only observed during the snorkel surveys on Lamonti Creek in Year 4 and at lower abundances than in previous years. In the Finlay reach sites, trends in the number of fish observed in the snorkel surveys differed between the two streams. The number of fish observed in Ole Creek increased over previous years while in Factor Ross Creek the number of observations was similar to 2012 and 2013 (Table 12). Bull Trout were the most common fish in the Ole Creek the snorkel surveys (84.3% of observations) and had a notable increase in relative abundance compared to the previous two years (Table 12). Mountain Whitefish continued to be the most common fish observed in Factor Ross Creek (Table 12). While no Arctic Grayling were captured during electrofishing in 2014, two were observed in Factor Ross Creek during the snorkel surveys (Table 12). Factor Ross is the only stream where Arctic Grayling have been observed during this monitoring program.
Table 11. Catch-per-unit-effort (CPUE = number of fish/100m2) during snorkel surveys in the Parsnip Reach sites (Six Mile and Lamont Creeks) in 2012, 2013, and 2014.
Site Year Metric Rainbow
Trout Bull
Trout Mountain Whitefish
Burbot Sculpin
sp. Unknown
Six Mile
2012 Observed 20 1
CPUE 7.1 0.4
2013 Observed 29 5 11 5
CPUE 4.2 0.7 1.6 0.7
2014 Observed 57 30 11 1 25 1
CPUE 5.8 3.1 1.1 0.1 2.6 0.1
Lamonti
2012 Observed 5 7
CPUE 2.5 3.4
2013 Observed 14 17 1
CPUE 2.5 3 0.2
2014 Observed 55 11 15
CPUE 11.1 2.2 3
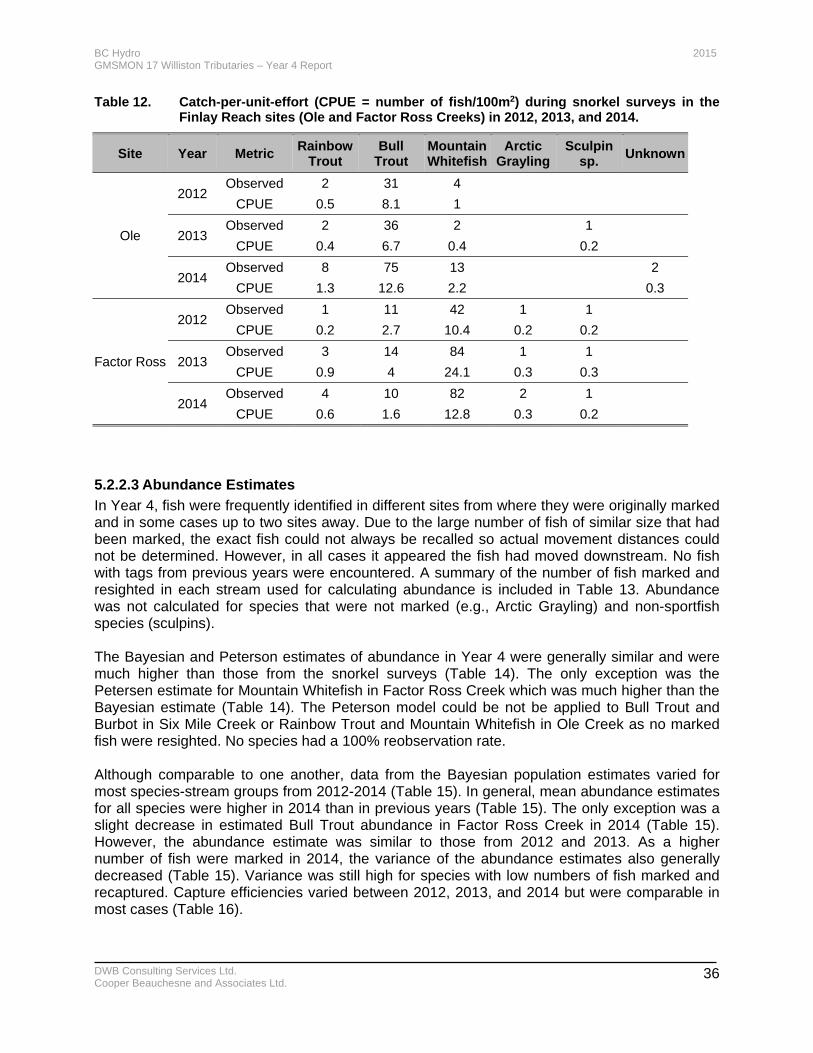
BC Hydro 2015 GMSMON 17 Williston Tributaries – Year 4 Report
DWB Consulting Services Ltd. Cooper Beauchesne and Associates Ltd.
36
Table 12. Catch-per-unit-effort (CPUE = number of fish/100m2) during snorkel surveys in the Finlay Reach sites (Ole and Factor Ross Creeks) in 2012, 2013, and 2014.
Site Year Metric Rainbow
Trout Bull
Trout Mountain Whitefish
Arctic Grayling
Sculpin sp.
Unknown
Ole
2012 Observed 2 31 4
CPUE 0.5 8.1 1
2013 Observed 2 36 2 1
CPUE 0.4 6.7 0.4 0.2
2014 Observed 8 75 13 2
CPUE 1.3 12.6 2.2 0.3
Factor Ross
2012 Observed 1 11 42 1 1
CPUE 0.2 2.7 10.4 0.2 0.2
2013 Observed 3 14 84 1 1
CPUE 0.9 4 24.1 0.3 0.3
2014 Observed 4 10 82 2 1
CPUE 0.6 1.6 12.8 0.3 0.2
5.2.2.3 Abundance Estimates
In Year 4, fish were frequently identified in different sites from where they were originally marked and in some cases up to two sites away. Due to the large number of fish of similar size that had been marked, the exact fish could not always be recalled so actual movement distances could not be determined. However, in all cases it appeared the fish had moved downstream. No fish with tags from previous years were encountered. A summary of the number of fish marked and resighted in each stream used for calculating abundance is included in Table 13. Abundance was not calculated for species that were not marked (e.g., Arctic Grayling) and non-sportfish species (sculpins). The Bayesian and Peterson estimates of abundance in Year 4 were generally similar and were much higher than those from the snorkel surveys (Table 14). The only exception was the Petersen estimate for Mountain Whitefish in Factor Ross Creek which was much higher than the Bayesian estimate (Table 14). The Peterson model could be not be applied to Bull Trout and Burbot in Six Mile Creek or Rainbow Trout and Mountain Whitefish in Ole Creek as no marked fish were resighted. No species had a 100% reobservation rate. Although comparable to one another, data from the Bayesian population estimates varied for most species-stream groups from 2012-2014 (Table 15). In general, mean abundance estimates for all species were higher in 2014 than in previous years (Table 15). The only exception was a slight decrease in estimated Bull Trout abundance in Factor Ross Creek in 2014 (Table 15). However, the abundance estimate was similar to those from 2012 and 2013. As a higher number of fish were marked in 2014, the variance of the abundance estimates also generally decreased (Table 15). Variance was still high for species with low numbers of fish marked and recaptured. Capture efficiencies varied between 2012, 2013, and 2014 but were comparable in most cases (Table 16).
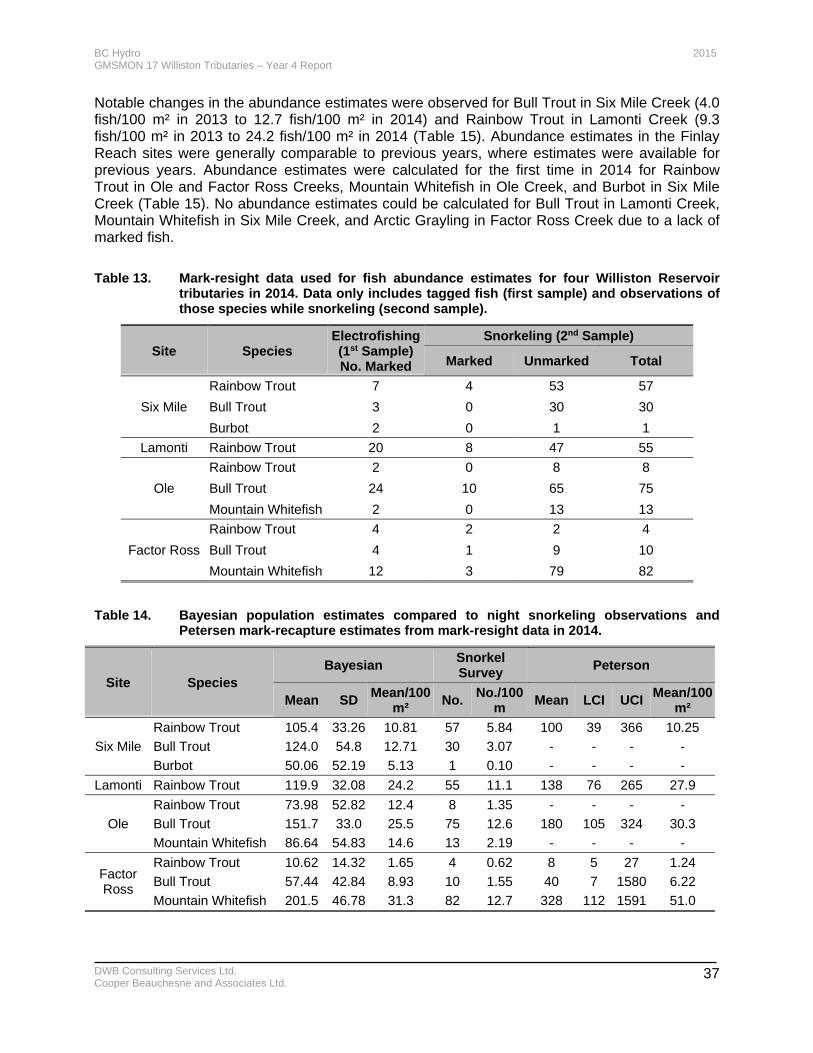
BC Hydro 2015 GMSMON 17 Williston Tributaries – Year 4 Report
DWB Consulting Services Ltd. Cooper Beauchesne and Associates Ltd.
37
Notable changes in the abundance estimates were observed for Bull Trout in Six Mile Creek (4.0 fish/100 m² in 2013 to 12.7 fish/100 m² in 2014) and Rainbow Trout in Lamonti Creek (9.3 fish/100 m² in 2013 to 24.2 fish/100 m² in 2014 (Table 15). Abundance estimates in the Finlay Reach sites were generally comparable to previous years, where estimates were available for previous years. Abundance estimates were calculated for the first time in 2014 for Rainbow Trout in Ole and Factor Ross Creeks, Mountain Whitefish in Ole Creek, and Burbot in Six Mile Creek (Table 15). No abundance estimates could be calculated for Bull Trout in Lamonti Creek, Mountain Whitefish in Six Mile Creek, and Arctic Grayling in Factor Ross Creek due to a lack of marked fish.
Table 13. Mark-resight data used for fish abundance estimates for four Williston Reservoir tributaries in 2014. Data only includes tagged fish (first sample) and observations of those species while snorkeling (second sample).
Site Species Electrofishing (1st Sample) No. Marked
Snorkeling (2nd Sample)
Marked Unmarked Total
Six Mile
Rainbow Trout 7 4 53 57
Bull Trout 3 0 30 30
Burbot 2 0 1 1
Lamonti Rainbow Trout 20 8 47 55
Ole
Rainbow Trout 2 0 8 8
Bull Trout 24 10 65 75
Mountain Whitefish 2 0 13 13
Factor Ross
Rainbow Trout 4 2 2 4
Bull Trout 4 1 9 10
Mountain Whitefish 12 3 79 82
Table 14. Bayesian population estimates compared to night snorkeling observations and Petersen mark-recapture estimates from mark-resight data in 2014.
Site Species Bayesian
Snorkel Survey
Peterson
Mean SD Mean/100
m² No.
No./100 m
Mean LCI UCI Mean/100
m²
Six Mile
Rainbow Trout 105.4 33.26 10.81 57 5.84 100 39 366 10.25
Bull Trout 124.0 54.8 12.71 30 3.07 - - - -
Burbot 50.06 52.19 5.13 1 0.10 - - - -
Lamonti Rainbow Trout 119.9 32.08 24.2 55 11.1 138 76 265 27.9
Ole
Rainbow Trout 73.98 52.82 12.4 8 1.35 - - - -
Bull Trout 151.7 33.0 25.5 75 12.6 180 105 324 30.3
Mountain Whitefish 86.64 54.83 14.6 13 2.19 - - - -
Factor Ross
Rainbow Trout 10.62 14.32 1.65 4 0.62 8 5 27 1.24
Bull Trout 57.44 42.84 8.93 10 1.55 40 7 1580 6.22
Mountain Whitefish 201.5 46.78 31.3 82 12.7 328 112 1591 51.0
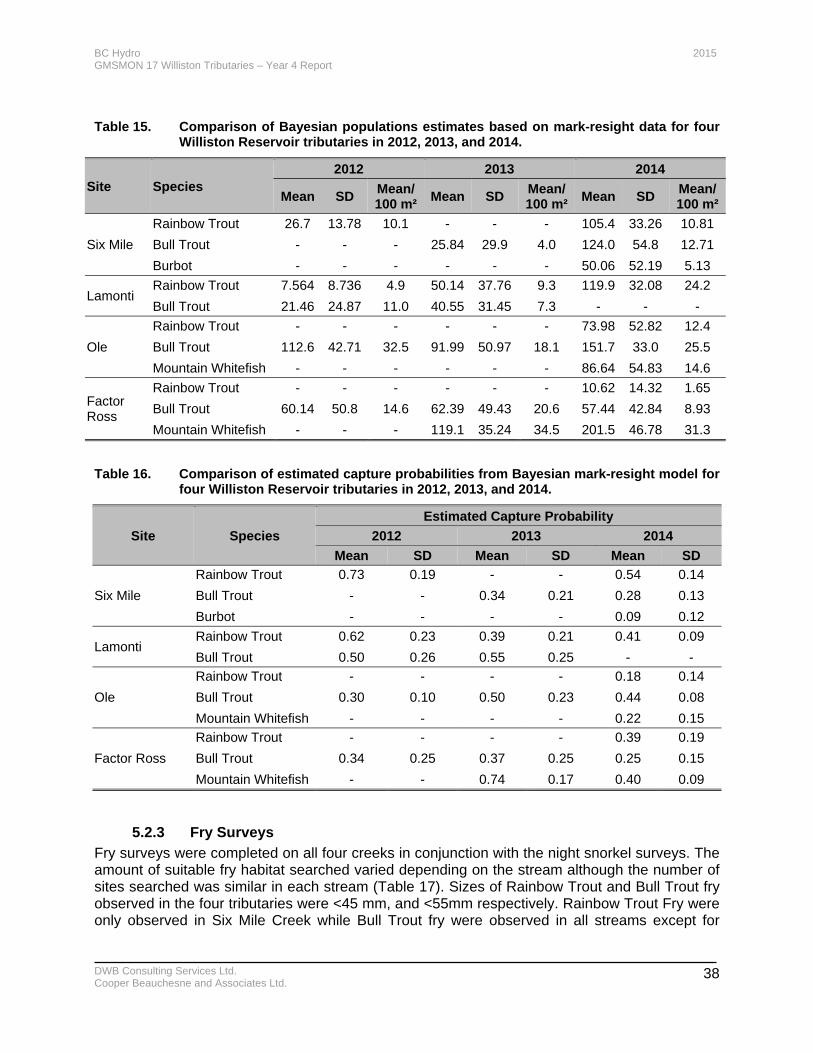
BC Hydro 2015 GMSMON 17 Williston Tributaries – Year 4 Report
DWB Consulting Services Ltd. Cooper Beauchesne and Associates Ltd.
38
Table 15. Comparison of Bayesian populations estimates based on mark-resight data for four Williston Reservoir tributaries in 2012, 2013, and 2014.
Site Species 2012 2013 2014
Mean SD Mean/ 100 m²
Mean SD Mean/ 100 m²
Mean SD Mean/ 100 m²
Six Mile
Rainbow Trout 26.7 13.78 10.1 - - - 105.4 33.26 10.81
Bull Trout - - - 25.84 29.9 4.0 124.0 54.8 12.71
Burbot - - - - - - 50.06 52.19 5.13
Lamonti Rainbow Trout 7.564 8.736 4.9 50.14 37.76 9.3 119.9 32.08 24.2
Bull Trout 21.46 24.87 11.0 40.55 31.45 7.3 - - -
Ole
Rainbow Trout - - - - - - 73.98 52.82 12.4
Bull Trout 112.6 42.71 32.5 91.99 50.97 18.1 151.7 33.0 25.5
Mountain Whitefish - - - - - - 86.64 54.83 14.6
Factor Ross
Rainbow Trout - - - - - - 10.62 14.32 1.65
Bull Trout 60.14 50.8 14.6 62.39 49.43 20.6 57.44 42.84 8.93
Mountain Whitefish - - - 119.1 35.24 34.5 201.5 46.78 31.3
Table 16. Comparison of estimated capture probabilities from Bayesian mark-resight model for four Williston Reservoir tributaries in 2012, 2013, and 2014.
Site Species
Estimated Capture Probability
2012 2013 2014
Mean SD Mean SD Mean SD
Six Mile
Rainbow Trout 0.73 0.19 - - 0.54 0.14
Bull Trout - - 0.34 0.21 0.28 0.13
Burbot - - - - 0.09 0.12
Lamonti Rainbow Trout 0.62 0.23 0.39 0.21 0.41 0.09
Bull Trout 0.50 0.26 0.55 0.25 - -
Ole
Rainbow Trout - - - - 0.18 0.14
Bull Trout 0.30 0.10 0.50 0.23 0.44 0.08
Mountain Whitefish - - - - 0.22 0.15
Factor Ross
Rainbow Trout - - - - 0.39 0.19
Bull Trout 0.34 0.25 0.37 0.25 0.25 0.15
Mountain Whitefish - - 0.74 0.17 0.40 0.09
5.2.3 Fry Surveys
Fry surveys were completed on all four creeks in conjunction with the night snorkel surveys. The amount of suitable fry habitat searched varied depending on the stream although the number of sites searched was similar in each stream (Table 17). Sizes of Rainbow Trout and Bull Trout fry observed in the four tributaries were <45 mm, and <55mm respectively. Rainbow Trout Fry were only observed in Six Mile Creek while Bull Trout fry were observed in all streams except for
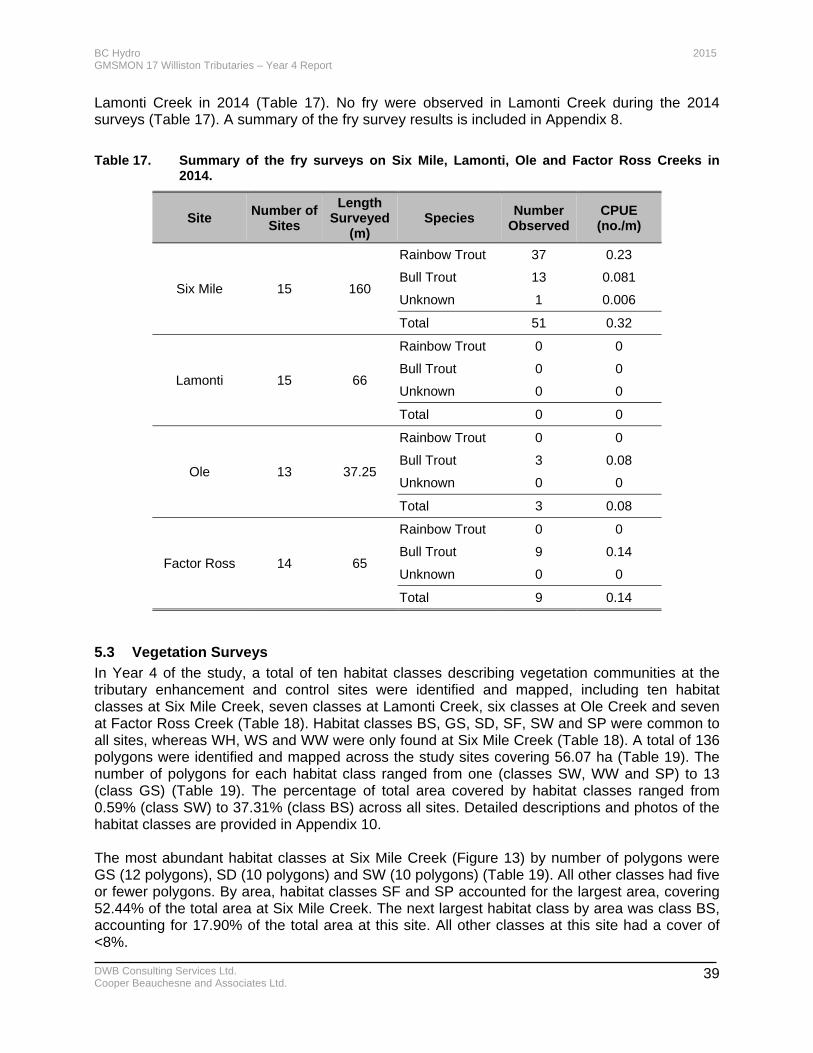
BC Hydro 2015 GMSMON 17 Williston Tributaries – Year 4 Report
DWB Consulting Services Ltd. Cooper Beauchesne and Associates Ltd.
39
Lamonti Creek in 2014 (Table 17). No fry were observed in Lamonti Creek during the 2014 surveys (Table 17). A summary of the fry survey results is included in Appendix 8.
Table 17. Summary of the fry surveys on Six Mile, Lamonti, Ole and Factor Ross Creeks in 2014.
Site Number of
Sites
Length Surveyed
(m) Species
Number Observed
CPUE (no./m)
Six Mile 15 160
Rainbow Trout 37 0.23
Bull Trout 13 0.081
Unknown 1 0.006
Total 51 0.32
Lamonti 15 66
Rainbow Trout 0 0
Bull Trout 0 0
Unknown 0 0
Total 0 0
Ole 13 37.25
Rainbow Trout 0 0
Bull Trout 3 0.08
Unknown 0 0
Total 3 0.08
Factor Ross 14 65
Rainbow Trout 0 0
Bull Trout 9 0.14
Unknown 0 0
Total 9 0.14
5.3 Vegetation Surveys
In Year 4 of the study, a total of ten habitat classes describing vegetation communities at the tributary enhancement and control sites were identified and mapped, including ten habitat classes at Six Mile Creek, seven classes at Lamonti Creek, six classes at Ole Creek and seven at Factor Ross Creek (Table 18). Habitat classes BS, GS, SD, SF, SW and SP were common to all sites, whereas WH, WS and WW were only found at Six Mile Creek (Table 18). A total of 136 polygons were identified and mapped across the study sites covering 56.07 ha (Table 19). The number of polygons for each habitat class ranged from one (classes SW, WW and SP) to 13 (class GS) (Table 19). The percentage of total area covered by habitat classes ranged from 0.59% (class SW) to 37.31% (class BS) across all sites. Detailed descriptions and photos of the habitat classes are provided in Appendix 10. The most abundant habitat classes at Six Mile Creek (Figure 13) by number of polygons were GS (12 polygons), SD (10 polygons) and SW (10 polygons) (Table 19). All other classes had five or fewer polygons. By area, habitat classes SF and SP accounted for the largest area, covering 52.44% of the total area at Six Mile Creek. The next largest habitat class by area was class BS, accounting for 17.90% of the total area at this site. All other classes at this site had a cover of <8%.
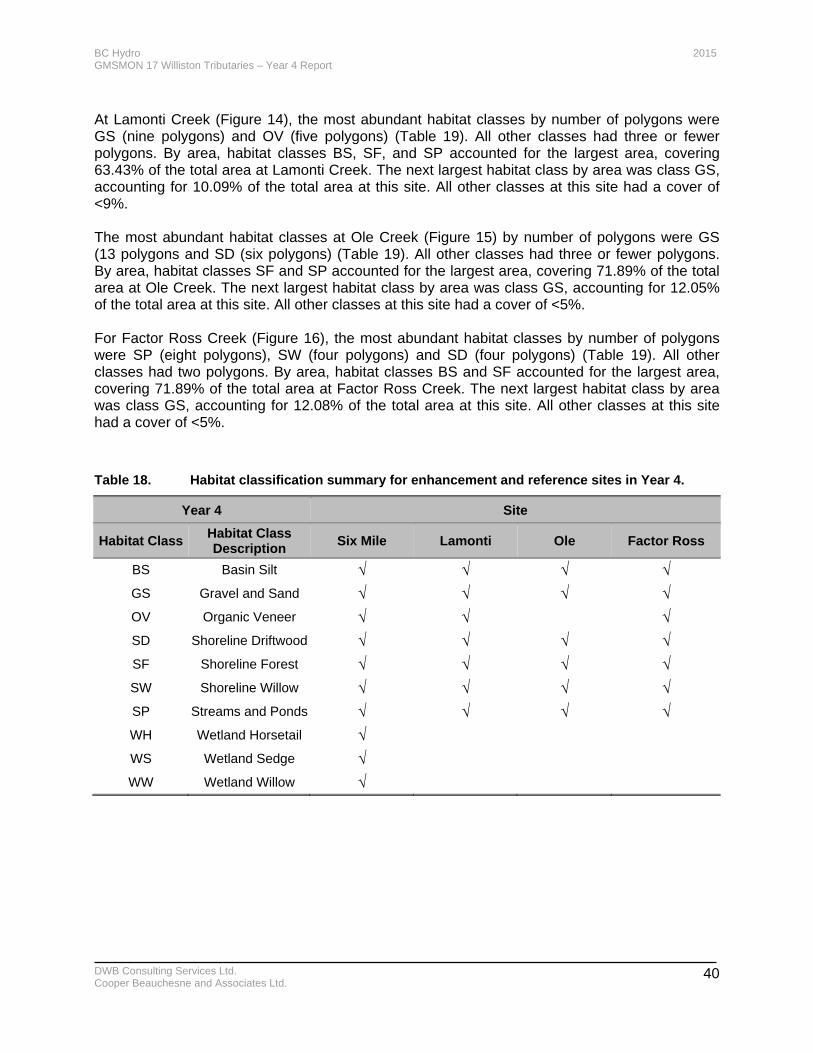
BC Hydro 2015 GMSMON 17 Williston Tributaries – Year 4 Report
DWB Consulting Services Ltd. Cooper Beauchesne and Associates Ltd.
40
At Lamonti Creek (Figure 14), the most abundant habitat classes by number of polygons were GS (nine polygons) and OV (five polygons) (Table 19). All other classes had three or fewer polygons. By area, habitat classes BS, SF, and SP accounted for the largest area, covering 63.43% of the total area at Lamonti Creek. The next largest habitat class by area was class GS, accounting for 10.09% of the total area at this site. All other classes at this site had a cover of <9%. The most abundant habitat classes at Ole Creek (Figure 15) by number of polygons were GS (13 polygons and SD (six polygons) (Table 19). All other classes had three or fewer polygons. By area, habitat classes SF and SP accounted for the largest area, covering 71.89% of the total area at Ole Creek. The next largest habitat class by area was class GS, accounting for 12.05% of the total area at this site. All other classes at this site had a cover of <5%. For Factor Ross Creek (Figure 16), the most abundant habitat classes by number of polygons were SP (eight polygons), SW (four polygons) and SD (four polygons) (Table 19). All other classes had two polygons. By area, habitat classes BS and SF accounted for the largest area, covering 71.89% of the total area at Factor Ross Creek. The next largest habitat class by area was class GS, accounting for 12.08% of the total area at this site. All other classes at this site had a cover of <5%.
Table 18. Habitat classification summary for enhancement and reference sites in Year 4.
Year 4 Site
Habitat Class Habitat Class Description
Six Mile Lamonti Ole Factor Ross
BS Basin Silt √ √ √ √
GS Gravel and Sand √ √ √ √
OV Organic Veneer √ √ √
SD Shoreline Driftwood √ √ √ √
SF Shoreline Forest √ √ √ √
SW Shoreline Willow √ √ √ √
SP Streams and Ponds √ √ √ √
WH Wetland Horsetail √
WS Wetland Sedge √
WW Wetland Willow √
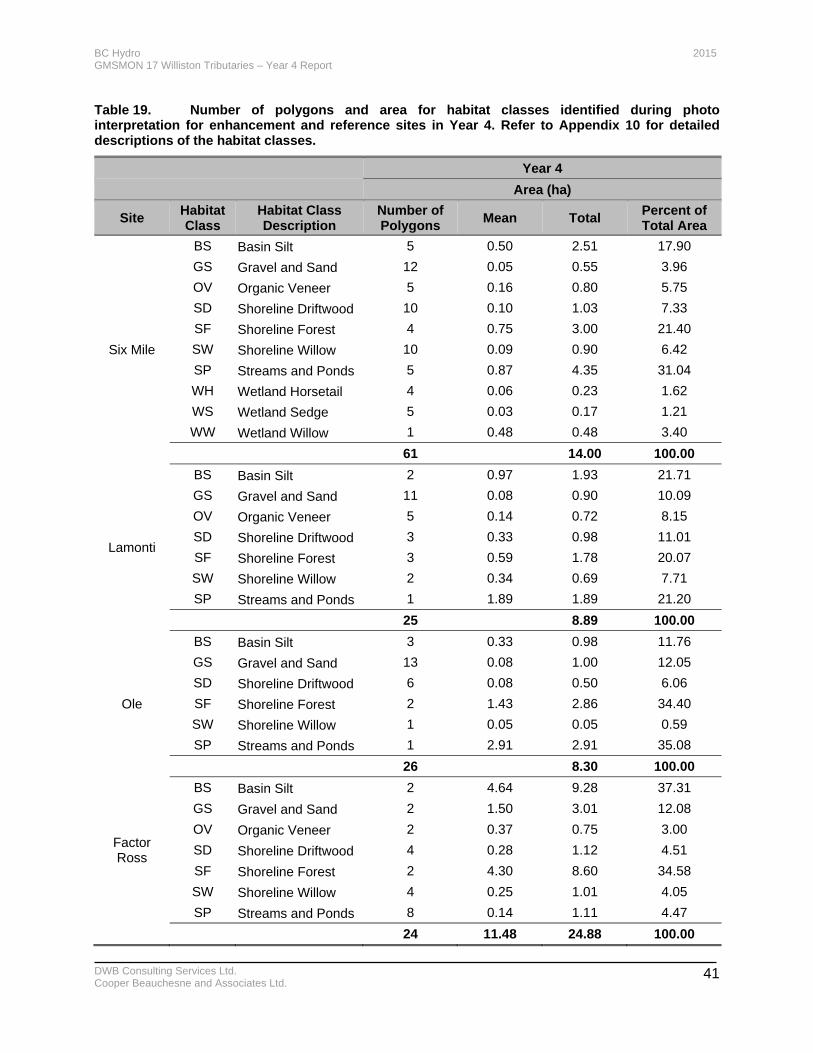
BC Hydro 2015 GMSMON 17 Williston Tributaries – Year 4 Report
DWB Consulting Services Ltd. Cooper Beauchesne and Associates Ltd.
41
Table 19. Number of polygons and area for habitat classes identified during photo interpretation for enhancement and reference sites in Year 4. Refer to Appendix 10 for detailed descriptions of the habitat classes.
Year 4
Area (ha)
Site Habitat Class
Habitat Class Description
Number of Polygons
Mean Total Percent of Total Area
Six Mile
BS Basin Silt 5 0.50 2.51 17.90
GS Gravel and Sand 12 0.05 0.55 3.96
OV Organic Veneer 5 0.16 0.80 5.75
SD Shoreline Driftwood 10 0.10 1.03 7.33
SF Shoreline Forest 4 0.75 3.00 21.40
SW Shoreline Willow 10 0.09 0.90 6.42
SP Streams and Ponds 5 0.87 4.35 31.04
WH Wetland Horsetail 4 0.06 0.23 1.62
WS Wetland Sedge 5 0.03 0.17 1.21
WW Wetland Willow 1 0.48 0.48 3.40
61 14.00 100.00
Lamonti
BS Basin Silt 2 0.97 1.93 21.71
GS Gravel and Sand 11 0.08 0.90 10.09
OV Organic Veneer 5 0.14 0.72 8.15
SD Shoreline Driftwood 3 0.33 0.98 11.01
SF Shoreline Forest 3 0.59 1.78 20.07
SW Shoreline Willow 2 0.34 0.69 7.71
SP Streams and Ponds 1 1.89 1.89 21.20
25 8.89 100.00
Ole
BS Basin Silt 3 0.33 0.98 11.76
GS Gravel and Sand 13 0.08 1.00 12.05
SD Shoreline Driftwood 6 0.08 0.50 6.06
SF Shoreline Forest 2 1.43 2.86 34.40
SW Shoreline Willow 1 0.05 0.05 0.59
SP Streams and Ponds 1 2.91 2.91 35.08
26 8.30 100.00
Factor Ross
BS Basin Silt 2 4.64 9.28 37.31
GS Gravel and Sand 2 1.50 3.01 12.08
OV Organic Veneer 2 0.37 0.75 3.00
SD Shoreline Driftwood 4 0.28 1.12 4.51
SF Shoreline Forest 2 4.30 8.60 34.58
SW Shoreline Willow 4 0.25 1.01 4.05
SP Streams and Ponds 8 0.14 1.11 4.47
24 11.48 24.88 100.00
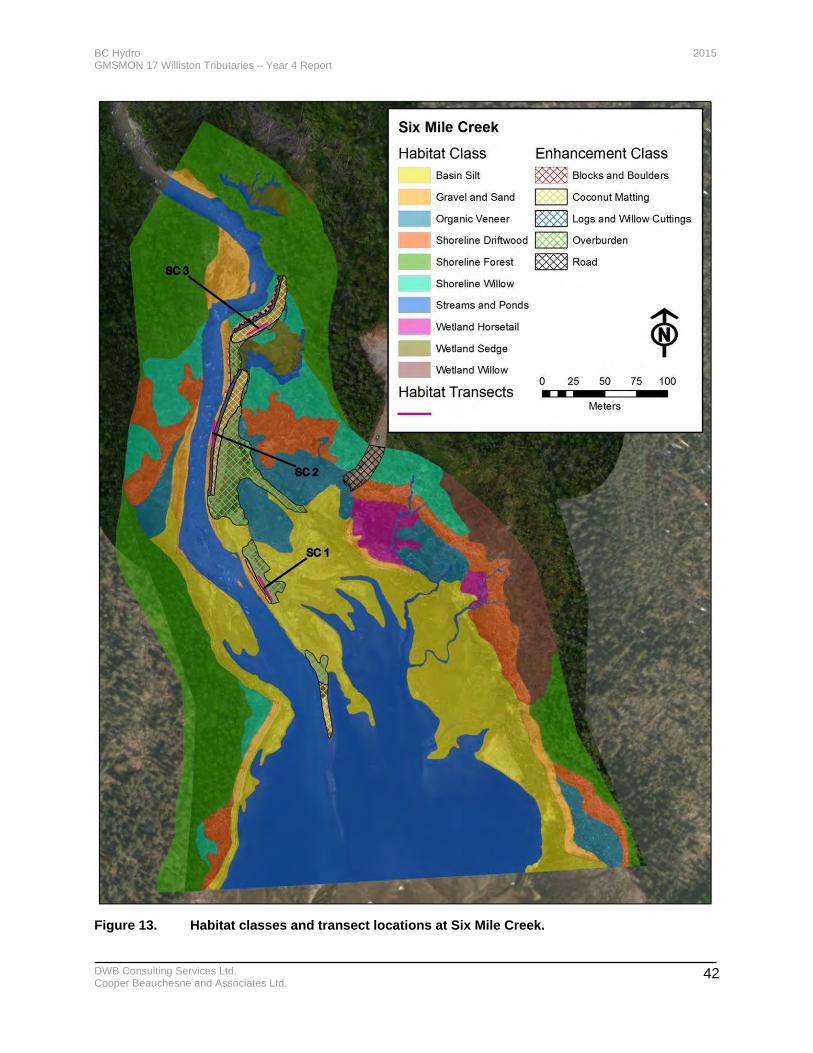
BC Hydro 2015 GMSMON 17 Williston Tributaries – Year 4 Report
DWB Consulting Services Ltd. Cooper Beauchesne and Associates Ltd.
42
Figure 13. Habitat classes and transect locations at Six Mile Creek.
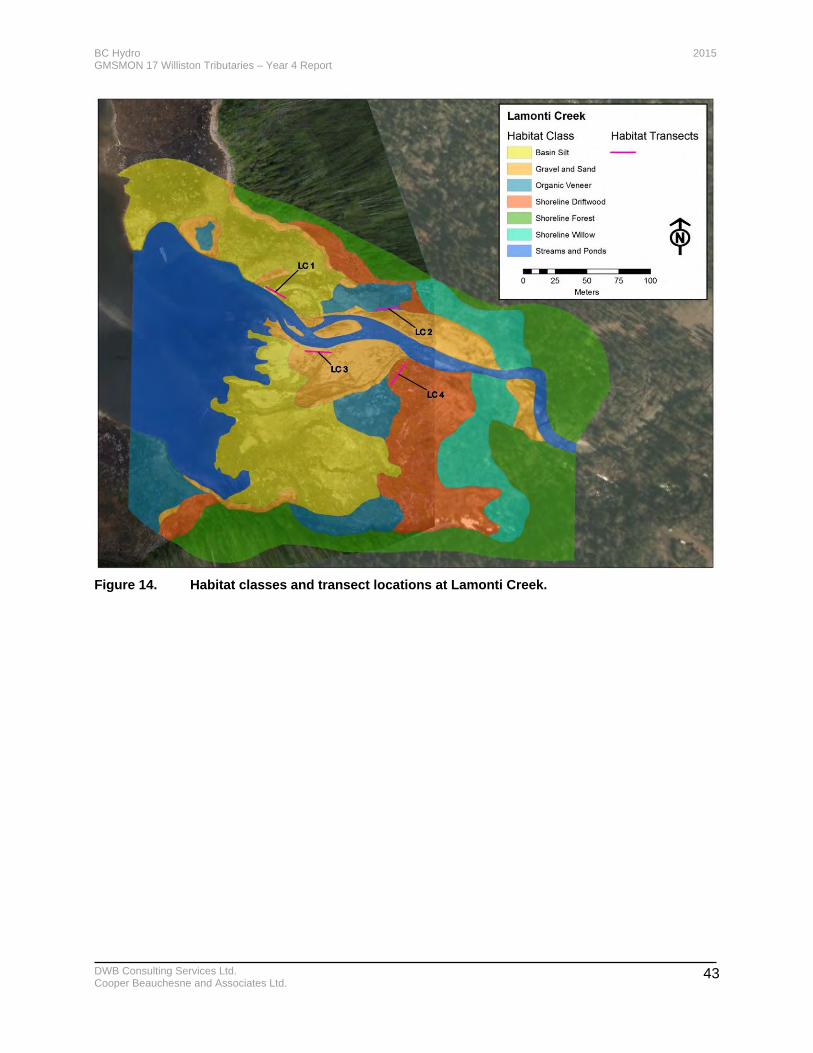
BC Hydro 2015 GMSMON 17 Williston Tributaries – Year 4 Report
DWB Consulting Services Ltd. Cooper Beauchesne and Associates Ltd.
43
Figure 14. Habitat classes and transect locations at Lamonti Creek.
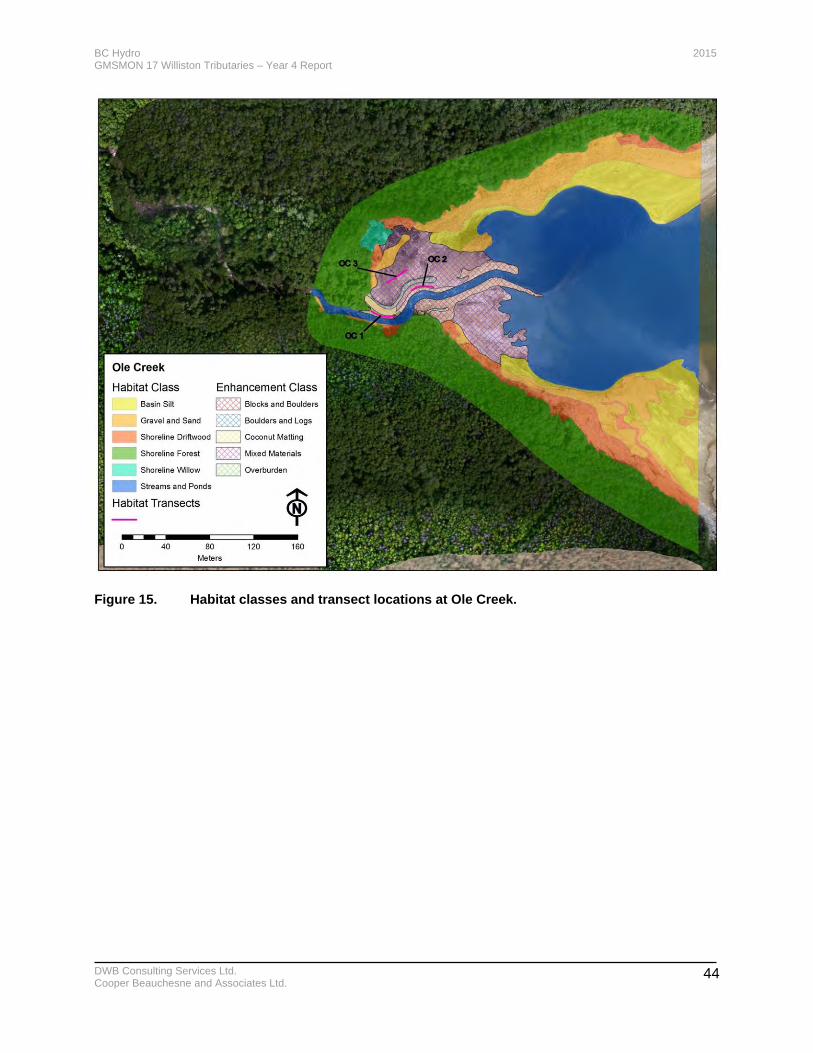
BC Hydro 2015 GMSMON 17 Williston Tributaries – Year 4 Report
DWB Consulting Services Ltd. Cooper Beauchesne and Associates Ltd.
44
Figure 15. Habitat classes and transect locations at Ole Creek.
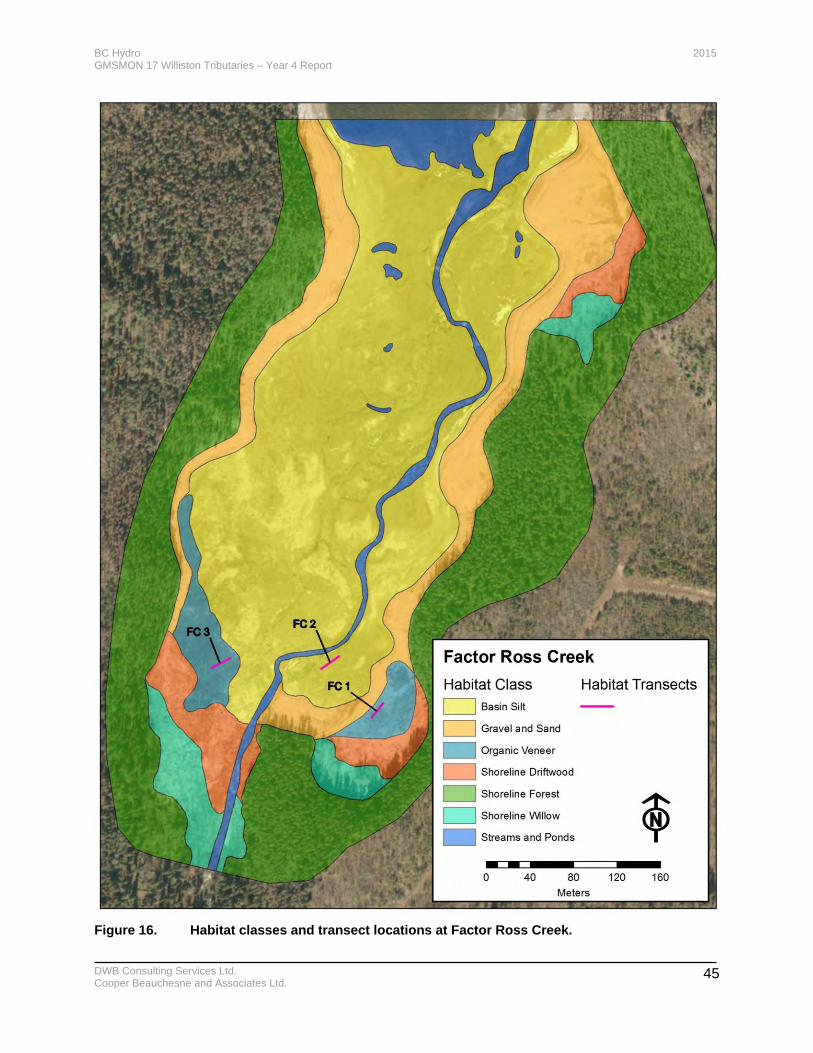
BC Hydro 2015 GMSMON 17 Williston Tributaries – Year 4 Report
DWB Consulting Services Ltd. Cooper Beauchesne and Associates Ltd.
45
Figure 16. Habitat classes and transect locations at Factor Ross Creek.
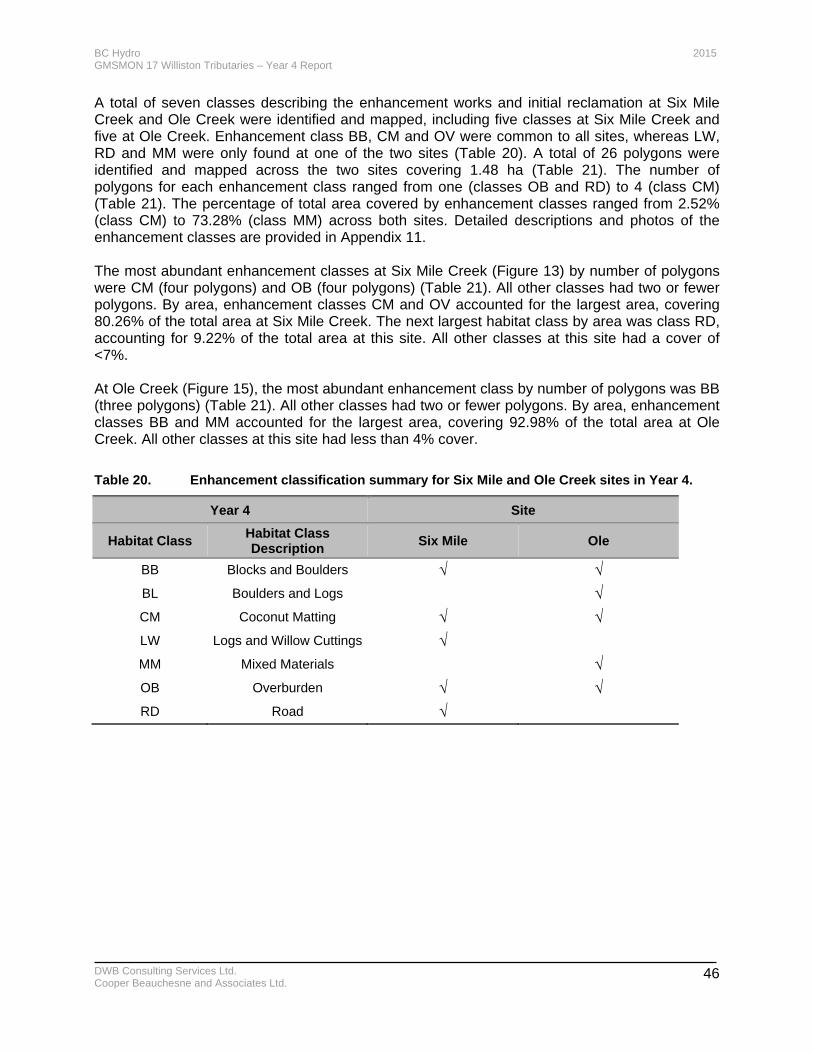
BC Hydro 2015 GMSMON 17 Williston Tributaries – Year 4 Report
DWB Consulting Services Ltd. Cooper Beauchesne and Associates Ltd.
46
A total of seven classes describing the enhancement works and initial reclamation at Six Mile Creek and Ole Creek were identified and mapped, including five classes at Six Mile Creek and five at Ole Creek. Enhancement class BB, CM and OV were common to all sites, whereas LW, RD and MM were only found at one of the two sites (Table 20). A total of 26 polygons were identified and mapped across the two sites covering 1.48 ha (Table 21). The number of polygons for each enhancement class ranged from one (classes OB and RD) to 4 (class CM) (Table 21). The percentage of total area covered by enhancement classes ranged from 2.52% (class CM) to 73.28% (class MM) across both sites. Detailed descriptions and photos of the enhancement classes are provided in Appendix 11. The most abundant enhancement classes at Six Mile Creek (Figure 13) by number of polygons were CM (four polygons) and OB (four polygons) (Table 21). All other classes had two or fewer polygons. By area, enhancement classes CM and OV accounted for the largest area, covering 80.26% of the total area at Six Mile Creek. The next largest habitat class by area was class RD, accounting for 9.22% of the total area at this site. All other classes at this site had a cover of <7%. At Ole Creek (Figure 15), the most abundant enhancement class by number of polygons was BB (three polygons) (Table 21). All other classes had two or fewer polygons. By area, enhancement classes BB and MM accounted for the largest area, covering 92.98% of the total area at Ole Creek. All other classes at this site had less than 4% cover.
Table 20. Enhancement classification summary for Six Mile and Ole Creek sites in Year 4.
Year 4 Site
Habitat Class Habitat Class Description
Six Mile Ole
BB Blocks and Boulders √ √
BL Boulders and Logs √
CM Coconut Matting √ √
LW Logs and Willow Cuttings √
MM Mixed Materials √
OB Overburden √ √
RD Road √
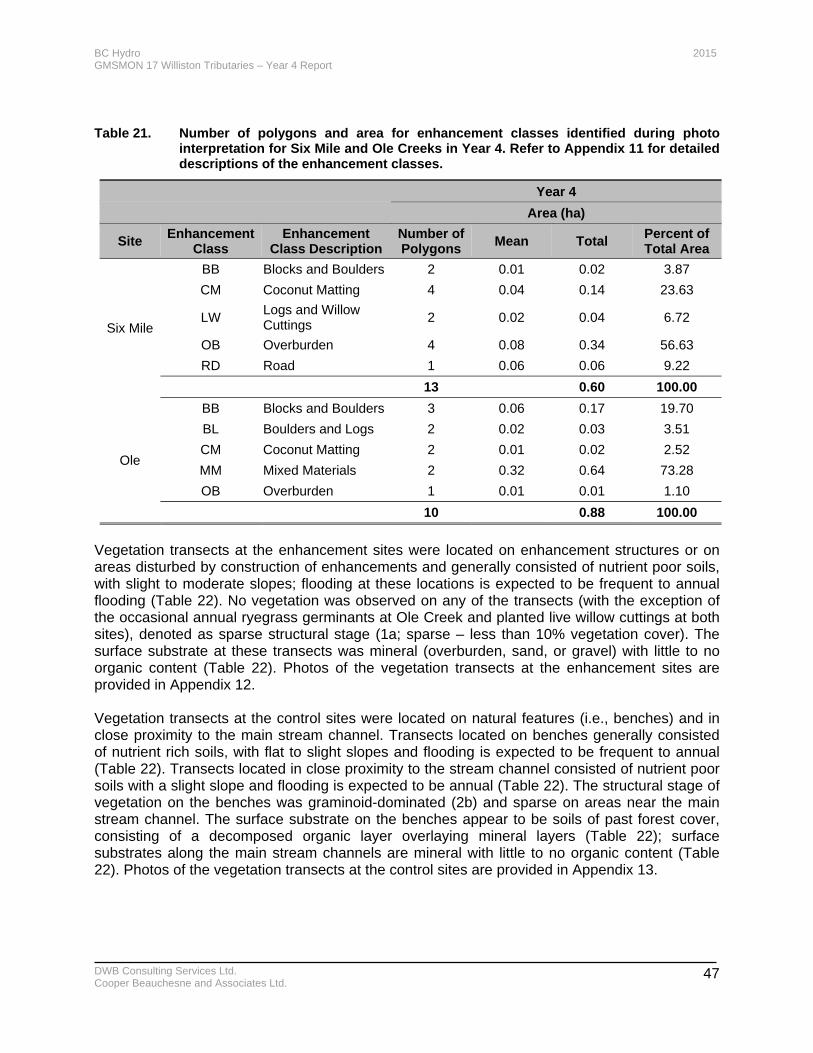
BC Hydro 2015 GMSMON 17 Williston Tributaries – Year 4 Report
DWB Consulting Services Ltd. Cooper Beauchesne and Associates Ltd.
47
Table 21. Number of polygons and area for enhancement classes identified during photo interpretation for Six Mile and Ole Creeks in Year 4. Refer to Appendix 11 for detailed descriptions of the enhancement classes.
Year 4
Area (ha)
Site Enhancement
Class Enhancement
Class Description Number of Polygons
Mean Total Percent of Total Area
Six Mile
BB Blocks and Boulders 2 0.01 0.02 3.87
CM Coconut Matting 4 0.04 0.14 23.63
LW Logs and Willow Cuttings
2 0.02 0.04 6.72
OB Overburden 4 0.08 0.34 56.63
RD Road 1 0.06 0.06 9.22
13 0.60 100.00
Ole
BB Blocks and Boulders 3 0.06 0.17 19.70
BL Boulders and Logs 2 0.02 0.03 3.51
CM Coconut Matting 2 0.01 0.02 2.52
MM Mixed Materials 2 0.32 0.64 73.28
OB Overburden 1 0.01 0.01 1.10
10 0.88 100.00
Vegetation transects at the enhancement sites were located on enhancement structures or on areas disturbed by construction of enhancements and generally consisted of nutrient poor soils, with slight to moderate slopes; flooding at these locations is expected to be frequent to annual flooding (Table 22). No vegetation was observed on any of the transects (with the exception of the occasional annual ryegrass germinants at Ole Creek and planted live willow cuttings at both sites), denoted as sparse structural stage (1a; sparse – less than 10% vegetation cover). The surface substrate at these transects was mineral (overburden, sand, or gravel) with little to no organic content (Table 22). Photos of the vegetation transects at the enhancement sites are provided in Appendix 12. Vegetation transects at the control sites were located on natural features (i.e., benches) and in close proximity to the main stream channel. Transects located on benches generally consisted of nutrient rich soils, with flat to slight slopes and flooding is expected to be frequent to annual (Table 22). Transects located in close proximity to the stream channel consisted of nutrient poor soils with a slight slope and flooding is expected to be annual (Table 22). The structural stage of vegetation on the benches was graminoid-dominated (2b) and sparse on areas near the main stream channel. The surface substrate on the benches appear to be soils of past forest cover, consisting of a decomposed organic layer overlaying mineral layers (Table 22); surface substrates along the main stream channels are mineral with little to no organic content (Table 22). Photos of the vegetation transects at the control sites are provided in Appendix 13.
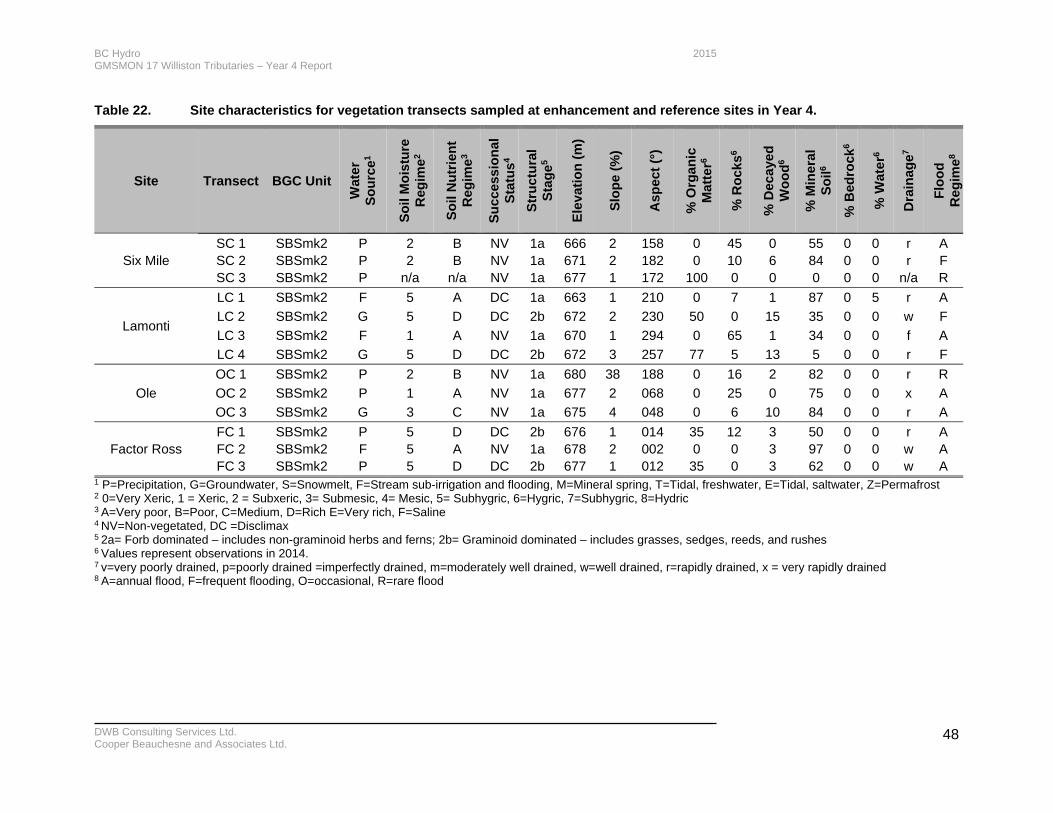
BC Hydro 2015 GMSMON 17 Williston Tributaries – Year 4 Report
DWB Consulting Services Ltd. Cooper Beauchesne and Associates Ltd.
48
Table 22. Site characteristics for vegetation transects sampled at enhancement and reference sites in Year 4.
Site Transect BGC Unit
Wat
er
So
urc
e1
So
il M
ois
ture
R
egim
e2
So
il N
utr
ien
t R
egim
e3
Su
cces
sio
nal
S
tatu
s4
Str
uct
ura
l S
tag
e5
Ele
vati
on
(m
)
Slo
pe
(%)
Asp
ect
(°)
% O
rgan
ic
Mat
ter6
% R
ock
s6
% D
ecay
ed
Wo
od
6
% M
iner
al
So
il6
% B
edro
ck6
% W
ate
r6
Dra
inag
e7
Flo
od
R
egim
e8
Six Mile SC 1 SBSmk2 P 2 B NV 1a 666 2 158 0 45 0 55 0 0 r A SC 2 SBSmk2 P 2 B NV 1a 671 2 182 0 10 6 84 0 0 r F SC 3 SBSmk2 P n/a n/a NV 1a 677 1 172 100 0 0 0 0 0 n/a R
Lamonti
LC 1 SBSmk2 F 5 A DC 1a 663 1 210 0 7 1 87 0 5 r A
LC 2 SBSmk2 G 5 D DC 2b 672 2 230 50 0 15 35 0 0 w F
LC 3 SBSmk2 F 1 A NV 1a 670 1 294 0 65 1 34 0 0 f A
LC 4 SBSmk2 G 5 D DC 2b 672 3 257 77 5 13 5 0 0 r F
Ole
OC 1 SBSmk2 P 2 B NV 1a 680 38 188 0 16 2 82 0 0 r R
OC 2 SBSmk2 P 1 A NV 1a 677 2 068 0 25 0 75 0 0 x A
OC 3 SBSmk2 G 3 C NV 1a 675 4 048 0 6 10 84 0 0 r A
Factor Ross FC 1 SBSmk2 P 5 D DC 2b 676 1 014 35 12 3 50 0 0 r A FC 2 SBSmk2 F 5 A NV 1a 678 2 002 0 0 3 97 0 0 w A FC 3 SBSmk2 P 5 D DC 2b 677 1 012 35 0 3 62 0 0 w A
1 P=Precipitation, G=Groundwater, S=Snowmelt, F=Stream sub-irrigation and flooding, M=Mineral spring, T=Tidal, freshwater, E=Tidal, saltwater, Z=Permafrost 2 0=Very Xeric, 1 = Xeric, 2 = Subxeric, 3= Submesic, 4= Mesic, 5= Subhygric, 6=Hygric, 7=Subhygric, 8=Hydric 3 A=Very poor, B=Poor, C=Medium, D=Rich E=Very rich, F=Saline 4 NV=Non-vegetated, DC =Disclimax 5 2a= Forb dominated – includes non-graminoid herbs and ferns; 2b= Graminoid dominated – includes grasses, sedges, reeds, and rushes 6 Values represent observations in 2014. 7 v=very poorly drained, p=poorly drained =imperfectly drained, m=moderately well drained, w=well drained, r=rapidly drained, x = very rapidly drained 8 A=annual flood, F=frequent flooding, O=occasional, R=rare flood
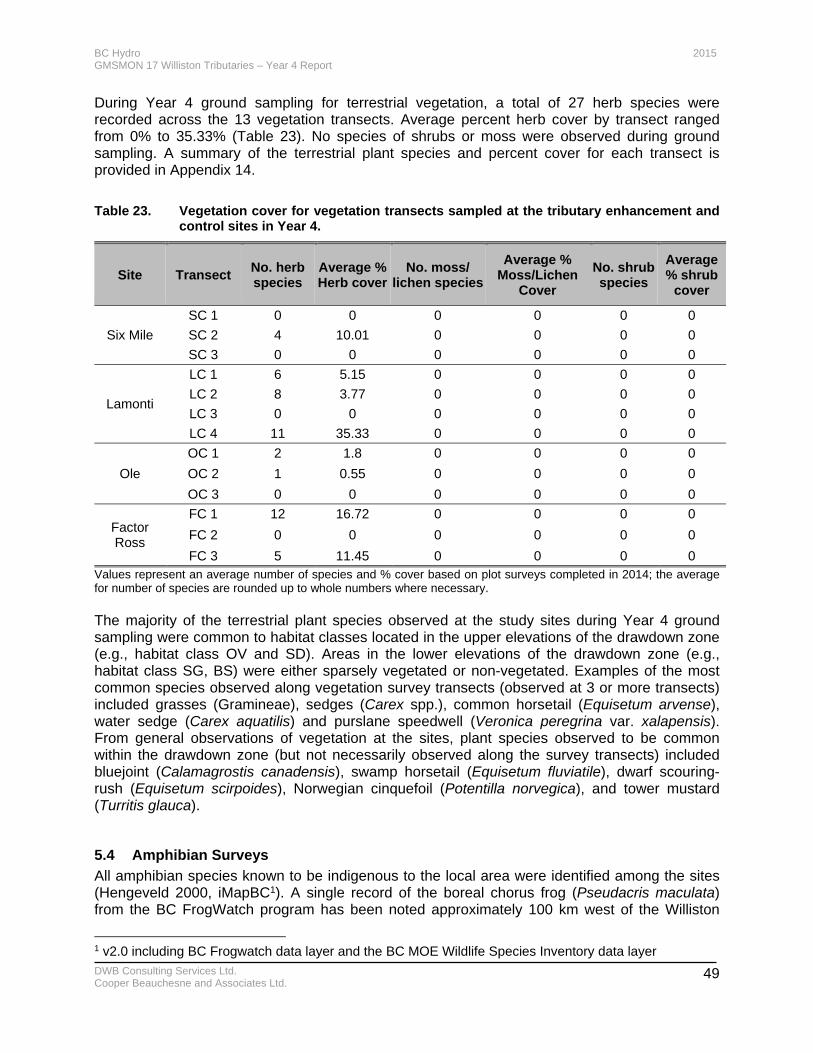
BC Hydro 2015 GMSMON 17 Williston Tributaries – Year 4 Report
DWB Consulting Services Ltd. Cooper Beauchesne and Associates Ltd.
49
During Year 4 ground sampling for terrestrial vegetation, a total of 27 herb species were recorded across the 13 vegetation transects. Average percent herb cover by transect ranged from 0% to 35.33% (Table 23). No species of shrubs or moss were observed during ground sampling. A summary of the terrestrial plant species and percent cover for each transect is provided in Appendix 14.
Table 23. Vegetation cover for vegetation transects sampled at the tributary enhancement and control sites in Year 4.
Site Transect No. herb species
Average %Herb cover
No. moss/ lichen species
Average % Moss/Lichen
Cover
No. shrub species
Average % shrub
cover
Six Mile
SC 1 0 0 0 0 0 0
SC 2 4 10.01 0 0 0 0
SC 3 0 0 0 0 0 0
Lamonti
LC 1 6 5.15 0 0 0 0
LC 2 8 3.77 0 0 0 0
LC 3 0 0 0 0 0 0
LC 4 11 35.33 0 0 0 0
Ole
OC 1 2 1.8 0 0 0 0
OC 2 1 0.55 0 0 0 0
OC 3 0 0 0 0 0 0
Factor Ross
FC 1 12 16.72 0 0 0 0
FC 2 0 0 0 0 0 0
FC 3 5 11.45 0 0 0 0 Values represent an average number of species and % cover based on plot surveys completed in 2014; the average for number of species are rounded up to whole numbers where necessary. The majority of the terrestrial plant species observed at the study sites during Year 4 ground sampling were common to habitat classes located in the upper elevations of the drawdown zone (e.g., habitat class OV and SD). Areas in the lower elevations of the drawdown zone (e.g., habitat class SG, BS) were either sparsely vegetated or non-vegetated. Examples of the most common species observed along vegetation survey transects (observed at 3 or more transects) included grasses (Gramineae), sedges (Carex spp.), common horsetail (Equisetum arvense), water sedge (Carex aquatilis) and purslane speedwell (Veronica peregrina var. xalapensis). From general observations of vegetation at the sites, plant species observed to be common within the drawdown zone (but not necessarily observed along the survey transects) included bluejoint (Calamagrostis canadensis), swamp horsetail (Equisetum fluviatile), dwarf scouring-rush (Equisetum scirpoides), Norwegian cinquefoil (Potentilla norvegica), and tower mustard (Turritis glauca).
5.4 Amphibian Surveys
All amphibian species known to be indigenous to the local area were identified among the sites (Hengeveld 2000, iMapBC1). A single record of the boreal chorus frog (Pseudacris maculata) from the BC FrogWatch program has been noted approximately 100 km west of the Williston
1 v2.0 including BC Frogwatch data layer and the BC MOE Wildlife Species Inventory data layer
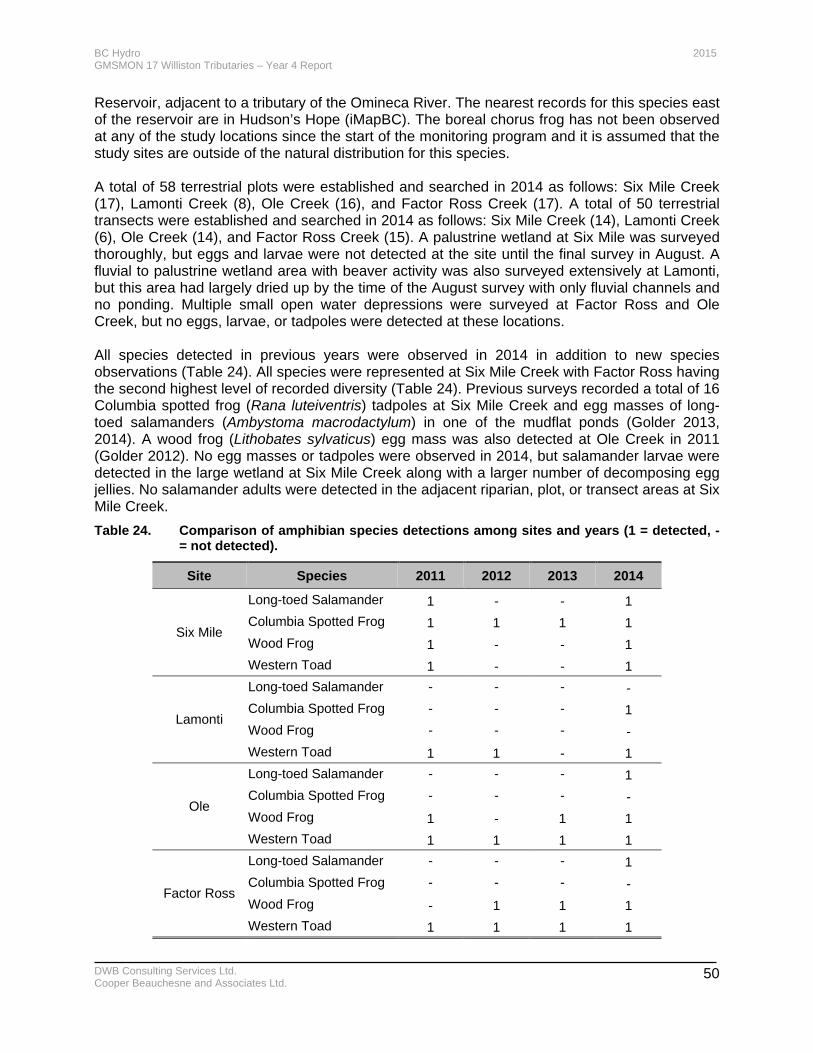
BC Hydro 2015 GMSMON 17 Williston Tributaries – Year 4 Report
DWB Consulting Services Ltd. Cooper Beauchesne and Associates Ltd.
50
Reservoir, adjacent to a tributary of the Omineca River. The nearest records for this species east of the reservoir are in Hudson’s Hope (iMapBC). The boreal chorus frog has not been observed at any of the study locations since the start of the monitoring program and it is assumed that the study sites are outside of the natural distribution for this species. A total of 58 terrestrial plots were established and searched in 2014 as follows: Six Mile Creek (17), Lamonti Creek (8), Ole Creek (16), and Factor Ross Creek (17). A total of 50 terrestrial transects were established and searched in 2014 as follows: Six Mile Creek (14), Lamonti Creek (6), Ole Creek (14), and Factor Ross Creek (15). A palustrine wetland at Six Mile was surveyed thoroughly, but eggs and larvae were not detected at the site until the final survey in August. A fluvial to palustrine wetland area with beaver activity was also surveyed extensively at Lamonti, but this area had largely dried up by the time of the August survey with only fluvial channels and no ponding. Multiple small open water depressions were surveyed at Factor Ross and Ole Creek, but no eggs, larvae, or tadpoles were detected at these locations. All species detected in previous years were observed in 2014 in addition to new species observations (Table 24). All species were represented at Six Mile Creek with Factor Ross having the second highest level of recorded diversity (Table 24). Previous surveys recorded a total of 16 Columbia spotted frog (Rana luteiventris) tadpoles at Six Mile Creek and egg masses of long-toed salamanders (Ambystoma macrodactylum) in one of the mudflat ponds (Golder 2013, 2014). A wood frog (Lithobates sylvaticus) egg mass was also detected at Ole Creek in 2011 (Golder 2012). No egg masses or tadpoles were observed in 2014, but salamander larvae were detected in the large wetland at Six Mile Creek along with a larger number of decomposing egg jellies. No salamander adults were detected in the adjacent riparian, plot, or transect areas at Six Mile Creek.
Table 24. Comparison of amphibian species detections among sites and years (1 = detected, - = not detected).
Site Species 2011 2012 2013 2014
Six Mile
Long-toed Salamander 1 - - 1
Columbia Spotted Frog 1 1 1 1
Wood Frog 1 - - 1
Western Toad 1 - - 1
Lamonti
Long-toed Salamander - - - -
Columbia Spotted Frog - - - 1
Wood Frog - - - -
Western Toad 1 1 - 1
Ole
Long-toed Salamander - - - 1
Columbia Spotted Frog - - - -
Wood Frog 1 - 1 1
Western Toad 1 1 1 1
Factor Ross
Long-toed Salamander - - - 1
Columbia Spotted Frog - - - -
Wood Frog - 1 1 1
Western Toad 1 1 1 1
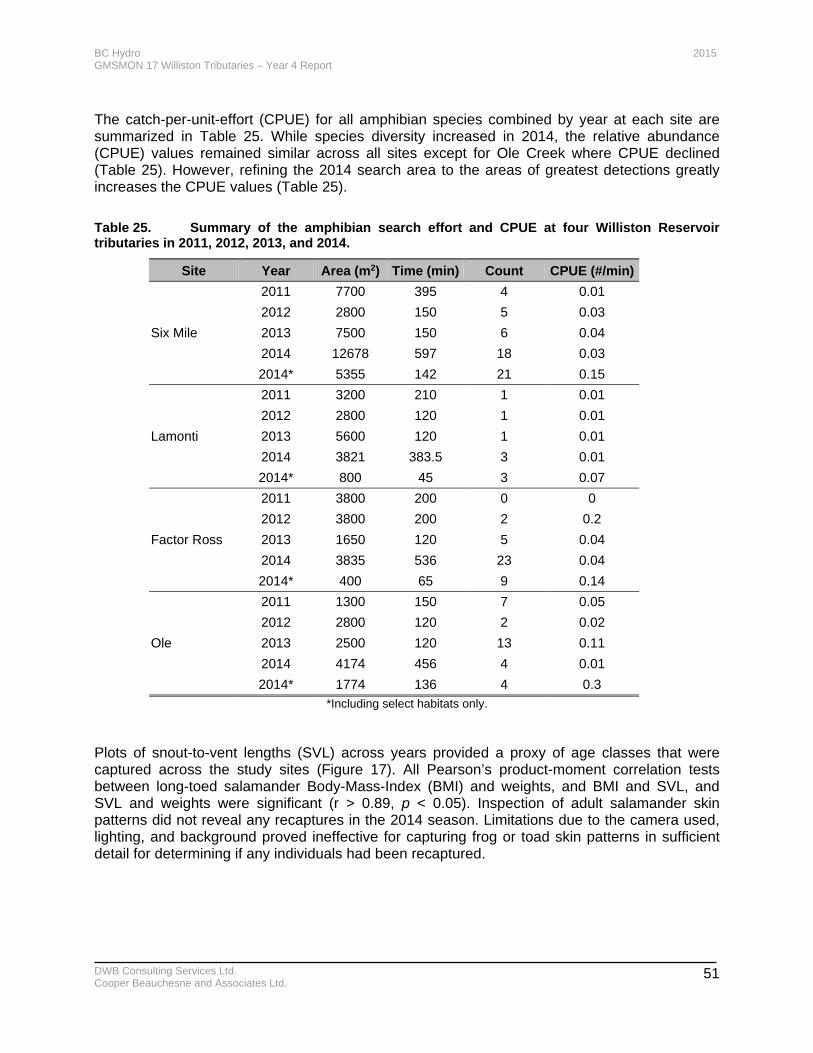
BC Hydro 2015 GMSMON 17 Williston Tributaries – Year 4 Report
DWB Consulting Services Ltd. Cooper Beauchesne and Associates Ltd.
51
The catch-per-unit-effort (CPUE) for all amphibian species combined by year at each site are summarized in Table 25. While species diversity increased in 2014, the relative abundance (CPUE) values remained similar across all sites except for Ole Creek where CPUE declined (Table 25). However, refining the 2014 search area to the areas of greatest detections greatly increases the CPUE values (Table 25).
Table 25. Summary of the amphibian search effort and CPUE at four Williston Reservoir tributaries in 2011, 2012, 2013, and 2014.
Site Year Area (m2) Time (min) Count CPUE (#/min)
Six Mile
2011 7700 395 4 0.01
2012 2800 150 5 0.03
2013 7500 150 6 0.04
2014 12678 597 18 0.03
2014* 5355 142 21 0.15
Lamonti
2011 3200 210 1 0.01
2012 2800 120 1 0.01
2013 5600 120 1 0.01
2014 3821 383.5 3 0.01
2014* 800 45 3 0.07
Factor Ross
2011 3800 200 0 0
2012 3800 200 2 0.2
2013 1650 120 5 0.04
2014 3835 536 23 0.04
2014* 400 65 9 0.14
Ole
2011 1300 150 7 0.05
2012 2800 120 2 0.02
2013 2500 120 13 0.11
2014 4174 456 4 0.01
2014* 1774 136 4 0.3
*Including select habitats only.
Plots of snout-to-vent lengths (SVL) across years provided a proxy of age classes that were captured across the study sites (Figure 17). All Pearson’s product-moment correlation tests between long-toed salamander Body-Mass-Index (BMI) and weights, and BMI and SVL, and SVL and weights were significant (r > 0.89, p < 0.05). Inspection of adult salamander skin patterns did not reveal any recaptures in the 2014 season. Limitations due to the camera used, lighting, and background proved ineffective for capturing frog or toad skin patterns in sufficient detail for determining if any individuals had been recaptured.
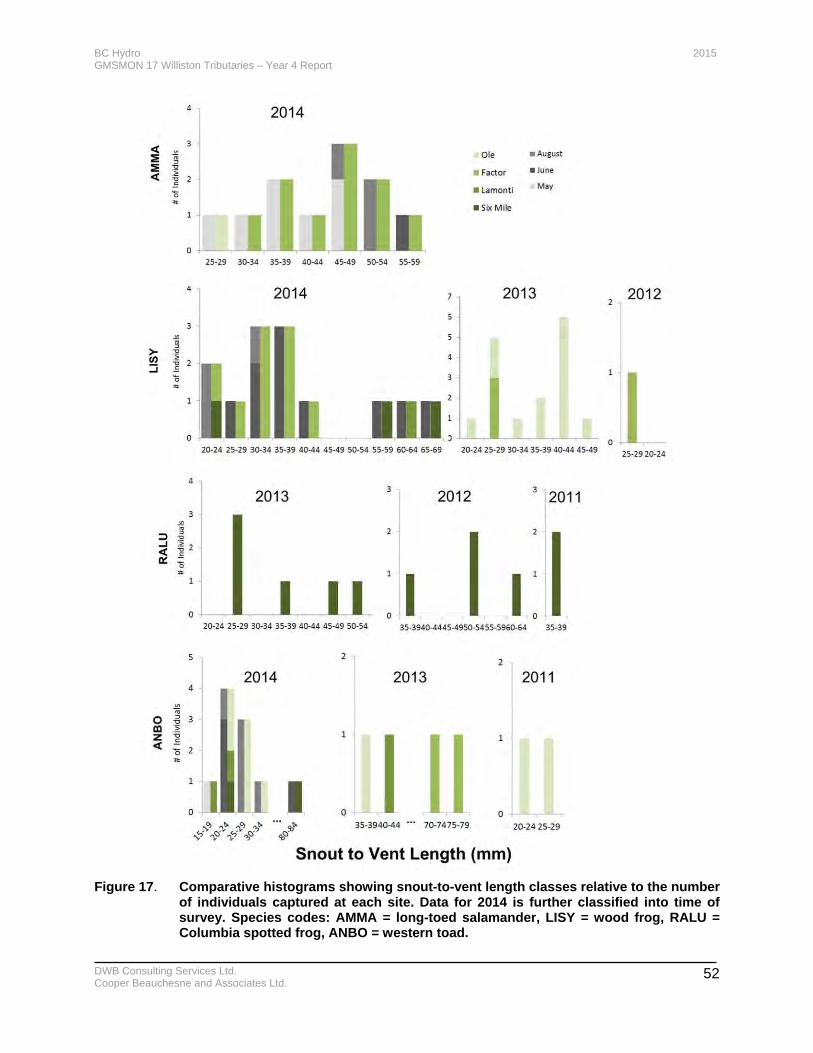
BC Hydro 2015 GMSMON 17 Williston Tributaries – Year 4 Report
DWB Consulting Services Ltd. Cooper Beauchesne and Associates Ltd.
52
Figure 17. Comparative histograms showing snout-to-vent length classes relative to the number
of individuals captured at each site. Data for 2014 is further classified into time of survey. Species codes: AMMA = long-toed salamander, LISY = wood frog, RALU = Columbia spotted frog, ANBO = western toad.
BC Hydro 2015 GMSMON 17 Williston Tributaries – Year 4 Report
DWB Consulting Services Ltd. Cooper Beauchesne and Associates Ltd.
53
Distribution and detection maps for all four sites are included in Appendix 15. Two wetlands are located at Six Mile Creek. Four amphibian species were detected at the wetland immediately adjacent to plot 1.06 (Appendix 15, Map 9). Western toads (Anaxyrus boreas) were observed continuously at this location early in the season and appeared to be exhibiting courtship behaviour in May, but no eggs or tadpoles were observed during later surveys. The area of this wetland was measured as 1684 m2 from the 2014 UAV photo and 1047 m2 from the 2011 BC Hydro orthophoto. While western toads were clumped in distribution at the Six Mile Creek wetland (site 1.06) they were more dispersed along the stream margins and areas of debris cover in the floodplains at all the sites. Older, aerial photo imagery (Bing Maps, unknown date, prior to Dec 2006) assumed to be taken at a reservoir level at or close to full pool shows Six Mile plot 1.06 flooded and continuous with the adjacent stream channel. The western edge of this wetland site has been impounded by an old beaver dam. A small flow exited the wetland through the dam and toward the stream from May through June. Columbia spotted frogs were observed at the marsh SA2 (Appendix 15, Map 9), which is connected to the wetland at 1.06 by a small, ephemeral stream channel. An ephemeral channel also connects SA2 with Six Mile Creek along the southern edge. An old beaver dam was observed at this site as well. The SA2 site measures 3380 m2 from the 2014 UAV imagery, 1376 m2 from the 2011 BC Hydro orthophoto, and 2329 m2 from Bing Maps. A smaller wetland site 2.P and a second fluvial to palustrine wetland system site 2.BP with lots of beaver activity were identified at Lamonti Creek (Appendix 15, Map 10). No apparent submerged aquatic vegetation was observed at site 2.P, which is dominated by large amounts of woody debris, shallow water, and minor fluvial activity. No amphibians were detected at this site. The larger site, 2.BP, had lots of fluvial activity, beaver dams, and shallow open water ponding. No apparent submerged aquatic vegetation was observed at site 2.BP. Western toads and Columbia spotted frogs were observed at this site, but no eggs or tadpoles were detected (Appendix 15, Map 10). Small open ponds were observed at both Factor Ross and Lamonti Creeks, but they were too small to be classified as wetlands. A noticeable population of wood frogs was observed in the organic veneer and shoreline driftwood habitats (see vegetation mapping, Figure 16) along the floodplain at Factor Ross Creek (sites FA1, 1.01, 1.02). Rain showers the night before the June survey may have contributed to increased activity (Figure 17) as wood frogs were relatively easy to capture and were detected as they were flushed out during walks through the area. Several frogs that were spotted at Factor Ross (Appendix 15, Map 12) were not captured and could be reliably identified to species.
5.5 Songbird and Waterbird Surveys
The numbers of songbirds and waterbirds detected during the surveys in 2014 was relatively low with the highest number of species and detections at Six Mile Creek (Table 26). Within the 75 m radius survey circles, at total of 12 species were detected, including eight species at Six Mile Creek, three species at Lamonti Creek, one species at Factor Ross Creek, and zero species at Ole Creek. Thirteen additional species were detected beyond the 75 m circle during the point count, including seven at Six Mile Creek, six at Lamonti Creek, seven at Ole Creek, , and seven at Factor Ross Creek. Eight additional species were detected while on the sites outside of the official survey period. No species at risk were detected. However, one Olive-sided Flycatcher, a provincially blue listed species, was heard singing distant from Six Mile Creek.
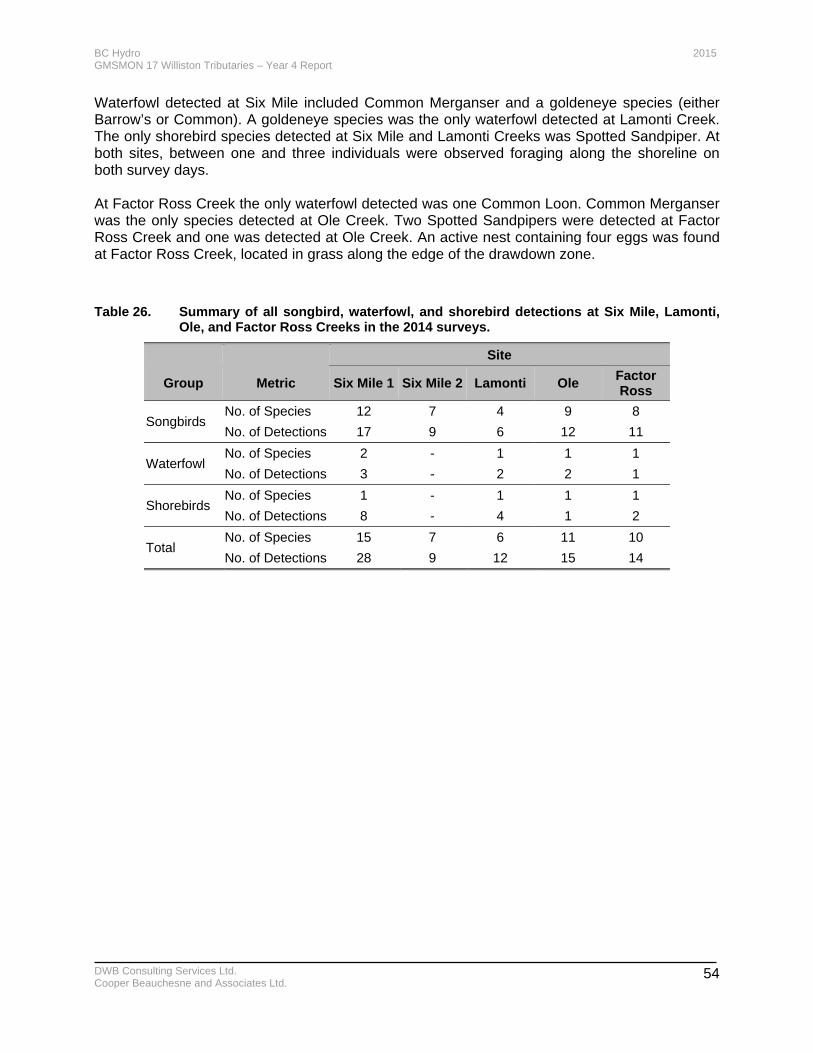
BC Hydro 2015 GMSMON 17 Williston Tributaries – Year 4 Report
DWB Consulting Services Ltd. Cooper Beauchesne and Associates Ltd.
54
Waterfowl detected at Six Mile included Common Merganser and a goldeneye species (either Barrow’s or Common). A goldeneye species was the only waterfowl detected at Lamonti Creek. The only shorebird species detected at Six Mile and Lamonti Creeks was Spotted Sandpiper. At both sites, between one and three individuals were observed foraging along the shoreline on both survey days. At Factor Ross Creek the only waterfowl detected was one Common Loon. Common Merganser was the only species detected at Ole Creek. Two Spotted Sandpipers were detected at Factor Ross Creek and one was detected at Ole Creek. An active nest containing four eggs was found at Factor Ross Creek, located in grass along the edge of the drawdown zone.
Table 26. Summary of all songbird, waterfowl, and shorebird detections at Six Mile, Lamonti, Ole, and Factor Ross Creeks in the 2014 surveys.
Site
Group Metric Six Mile 1 Six Mile 2 Lamonti Ole Factor Ross
Songbirds No. of Species 12 7 4 9 8
No. of Detections 17 9 6 12 11
Waterfowl No. of Species 2 - 1 1 1
No. of Detections 3 - 2 2 1
Shorebirds No. of Species 1 - 1 1 1
No. of Detections 8 - 4 1 2
Total No. of Species 15 7 6 11 10
No. of Detections 28 9 12 15 14
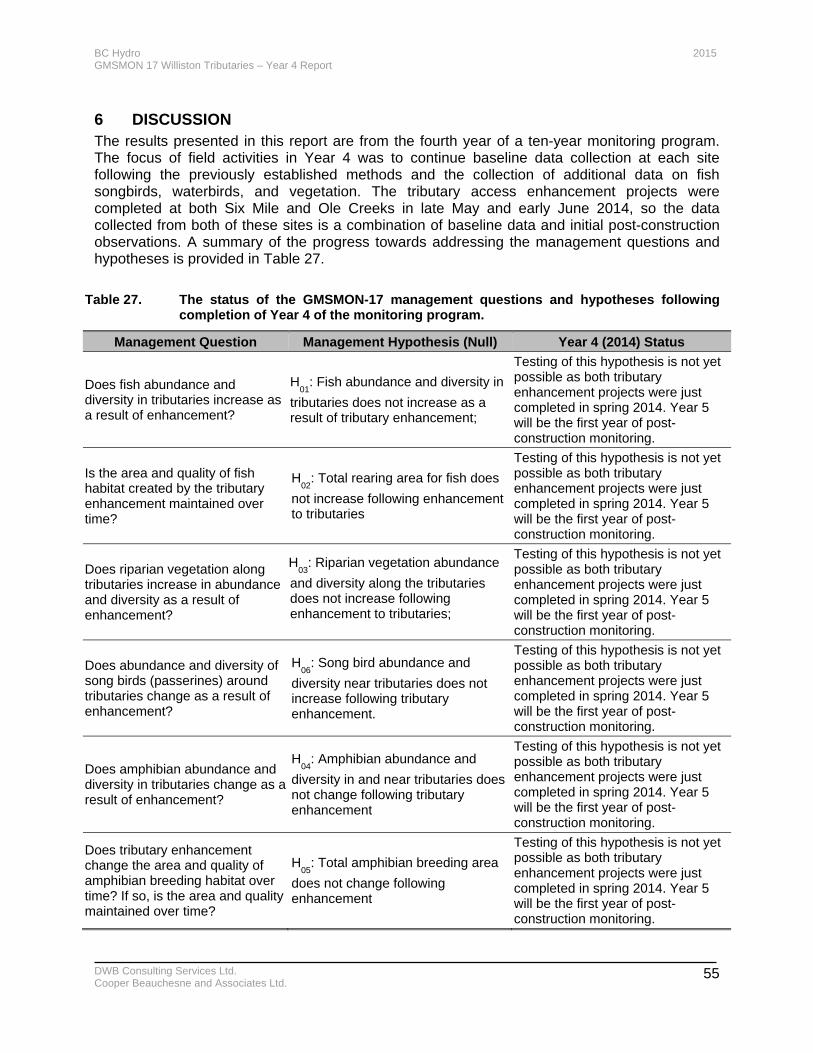
BC Hydro 2015 GMSMON 17 Williston Tributaries – Year 4 Report
DWB Consulting Services Ltd. Cooper Beauchesne and Associates Ltd.
55
6 DISCUSSION The results presented in this report are from the fourth year of a ten-year monitoring program. The focus of field activities in Year 4 was to continue baseline data collection at each site following the previously established methods and the collection of additional data on fish songbirds, waterbirds, and vegetation. The tributary access enhancement projects were completed at both Six Mile and Ole Creeks in late May and early June 2014, so the data collected from both of these sites is a combination of baseline data and initial post-construction observations. A summary of the progress towards addressing the management questions and hypotheses is provided in Table 27.
Table 27. The status of the GMSMON-17 management questions and hypotheses following completion of Year 4 of the monitoring program.
Management Question Management Hypothesis (Null) Year 4 (2014) Status
Does fish abundance and diversity in tributaries increase as a result of enhancement?
H01
: Fish abundance and diversity in
tributaries does not increase as a result of tributary enhancement;
Testing of this hypothesis is not yet possible as both tributary enhancement projects were just completed in spring 2014. Year 5 will be the first year of post-construction monitoring.
Is the area and quality of fish habitat created by the tributary enhancement maintained over time?
H02
: Total rearing area for fish does
not increase following enhancement to tributaries
Testing of this hypothesis is not yet possible as both tributary enhancement projects were just completed in spring 2014. Year 5 will be the first year of post-construction monitoring.
Does riparian vegetation along tributaries increase in abundance and diversity as a result of enhancement?
H03
: Riparian vegetation abundance
and diversity along the tributaries does not increase following enhancement to tributaries;
Testing of this hypothesis is not yet possible as both tributary enhancement projects were just completed in spring 2014. Year 5 will be the first year of post-construction monitoring.
Does abundance and diversity of song birds (passerines) around tributaries change as a result of enhancement?
H06
: Song bird abundance and
diversity near tributaries does not increase following tributary enhancement.
Testing of this hypothesis is not yet possible as both tributary enhancement projects were just completed in spring 2014. Year 5 will be the first year of post-construction monitoring.
Does amphibian abundance and diversity in tributaries change as a result of enhancement?
H04
: Amphibian abundance and
diversity in and near tributaries does not change following tributary enhancement
Testing of this hypothesis is not yet possible as both tributary enhancement projects were just completed in spring 2014. Year 5 will be the first year of post-construction monitoring.
Does tributary enhancement change the area and quality of amphibian breeding habitat over time? If so, is the area and quality maintained over time?
H05
: Total amphibian breeding area
does not change following enhancement
Testing of this hypothesis is not yet possible as both tributary enhancement projects were just completed in spring 2014. Year 5 will be the first year of post-construction monitoring.
BC Hydro 2015 GMSMON 17 Williston Tributaries – Year 4 Report
DWB Consulting Services Ltd. Cooper Beauchesne and Associates Ltd.
56
6.1 Environmental Conditions
The general conditions observed at the Parsnip and Finlay Reach sites in Year 4 were similar to those observed in Year 3 and were close to average values. The regional snowpack for the winter of 2013-2014 was close to average for both the Pine Pass (Parsnip Reach sites) and Aiken Lake (Finlay Reach sites) stations. The similarity in regional snowpack in Years 3 and 4 also resulted in similar water levels in Six Mile and Ole Creeks in both Year 3 and 4. The notable difference between the two years were the lower water levels in both streams beginning in mid-July. The difference in water levels was greatest in Six Mile Creek with the recorded water level in late August of Year 4 only being 30-40% of the water level recorded in Year 3. In Ole Creek, the late August water levels were about 50-60% of those recorded in Year 3. Low water levels were observed in all four streams during the August juvenile fish sampling. The low water levels are a result of the well below average precipitation received in May, June, and July 2014. While total precipitation in August was just below average, the majority of this occurred in a single event on August 19 and made little or no difference in the recorded water levels in either stream. Air temperatures recorded at both Six Mile and Ole Creeks in Year 4 and followed similar patterns with Ole Creek air temperatures slightly cooler than those observed at Six Mile Creek. The same pattern was true for water temperatures at both sites with cooler temperatures observed at Ole Creek. Less variation in the daily average temperature was also observed at Ole Creek. There was a noticeable difference in water temperatures between Year 3 and 4 in late June at both Six Mile and Ole Creeks with warmer temperatures and a faster increase in temperature in this period observed in Year 3 compared to Year 4. This period also coincides with the predicted and observed spawning time for Rainbow Trout. The difference in temperatures between years may have contributed to the apparent difference in fry emergence times between Years 3 and 4. Rating curves and stage discharge tables were developed for both Six Mile and Ole Creeks based on the manual discharge measurements recorded across a variety of discharge levels in Year 4. Re-surveying the gauging stations and stream cross-sections will be required in future years to confirm that the staff gauges have not moved and that the stream cross-section profiles do not change.
6.2 Fish
6.2.1 Tributary Access and Fish Habitat
No physical barriers to upstream fish access were observed in any of the four project streams in the first three years of the monitoring program (2011-2013) (Golder 2012, 2013, 2014). In Year 4, no physical barriers to upstream fish passage were observed in any of the streams except for during the early May survey at Factor Ross Creek. Two cascades created by woody debris were observed in the lower portion of Factor Ross Creek (Appendix 4, Map 4). While the cascades may have limited some fish passage, they were not considered complete barriers to upstream migration by adult spawning Arctic Grayling or Rainbow Trout. The largest of the two blockages was near the confluence with the reservoir in the early May survey and would have been submerged by rising reservoir levels by the time spawning Rainbow Trout would likely be migrating upstream in late May and through June. During drawdown zone fish sampling in mid-June, both debris jams had been flooded by the reservoir and juvenile Bull Trout and sculpins were captured in areas upstream of both cascades (they were submerged by this time). Of the four streams, Factor Ross Creek had the highest level of habitat complexity as a result of stream channel interaction with an abundance of stumps and LWD (Appendix 4, Map 4). The

BC Hydro 2015 GMSMON 17 Williston Tributaries – Year 4 Report
DWB Consulting Services Ltd. Cooper Beauchesne and Associates Ltd.
57
debris created small to large pools and eddies that provide cover and resting areas for migrating fish. Stumps were not as visible at the other streams and were considered to have been either washed away due to more consistent flows through the drawdown zone or buried by sediment deposits resulting in longer riffles. This pattern was particularly apparent at Ole Creek which had very few residual stumps. While the highest level of habitat complexity was observed at Factor Ross Creek, the drawdown zone portion of all four streams was considered low quality habitat consisting of heavily braided shallow channels, long fast-flowing riffles, with little to no cover, pools, or resting areas despite the lack of physical or debris blockages. The lack of suitable habitat in addition to the cold temperatures experienced in the early spring in the drawdown zone may be a deterrent to fish migration upstream from the reservoir despite the presence of more suitable habitats upstream (Binder and Stevens 2004, Golder 2014). The identification of spawning Rainbow Trout in Six Mile, Lamonti, and Factor Ross Creeks as well as redds in Lamonti Creek is evidence that adfluvial fish are moving upstream by the late spring in those streams. The peak reservoir level reached in Year 4 was approximately 0.5 m below average (Figure 1) and portions of the drawdown zone reaches were still exposed in all four streams during the late August survey. By this time, the streams were all reduced to single channels and the long-riffle sections were greatly reduced. Several adult Bull Trout with spawning colouration were observed staging at the stream mouths or within all the streams during the August electrofishing and snorkelling surveys. The streams were at low flows at this time of year, lower than observed in the spring but these large adults were still able to access upstream areas. As previously suggested (Cubberly and Hengeveld 2010, Golder 2014), tributary access for adfluvial fall spawners is not considered an issue. However, the enhancement works to improve access for spring spawners may also improve or maintain tributary access for adfluvial fall spawning species such as Bull Trout in years with low stream discharge and low reservoir levels. The assessment of tributary access was extended in Year 4 to included fish habitat mapping for the reach of each stream located below the full pool level. Mapping was based on existing orthophotos of the drawdown zone and all stream channel mapping was completed in early May 2014 when the reservoir was close to low pool and prior to construction of the access enhancements. The habitat mapping will provide a record of annual changes in each stream channel to assist in determining the effectiveness and stability of the tributary access enhancements under low pool conditions. The established photo reference sites were reused in Year 4 but they appear to be located too far upstream to show any stream channel changes that would affect fish access or the effectiveness of the enhancement works. This is particularly true for the upstream views from each reference point where only minor enhancement work was completed on the two treatment streams (Six Mile and Ole Creeks). While the enhancement works do extend up to the photo reference sites on Six Mile and Ole Creek, the stream channels at the upper limits of the drawdown zone for all four streams appear to be relatively stable and are unlikely to be the locations of large changes in stream morphology. The enhancement works also extend well downstream into the drawdown zone and out of the effective field of view for the photo reference sites, particularly for the summer photos when the vegetation is fully flushed. Therefore the collection of high resolution orthophotos and annual mapping of the drawdown zone portion of each stream will be more useful in determining the effectiveness of the tributary access enhancements and changes at the control sites. Logistical issues prevented the collection of high resolution orthophotos by UAV at low pool conditions in 2014. The collection of high resolution orthophotos at near low pool conditions is recommended in future years to identify potential barriers to upstream fish passage.
BC Hydro 2015 GMSMON 17 Williston Tributaries – Year 4 Report
DWB Consulting Services Ltd. Cooper Beauchesne and Associates Ltd.
58
6.2.2 Drawdown Zone Fish Sampling
This was the first year fish sampling was completed in drawdown zone reach of each stream. This sampling was completed to provide a better understanding of fish use of the lower quality drawdown zone habitats during spring. The 2014 results showed that sculpins (Slimy and Prickly Sculpins) were primary fish present in the drawdown zone reaches of all four streams followed by lower numbers of juvenile Bull Trout and juvenile Rainbow Trout. No adult salmonids were captured. Sculpins were generally located in the lowest portions of streams in the drawdown zones, often close to the confluence with the reservoir. This was particularly the case at Ole and Factor Ross Creeks which featured steeper riffles than Six Mile and Lamonti Creeks. In the latter streams, sculpins were captured throughout. Higher spring flows limited sampling to the stream margins as the middle of the streams were generally too deep or swift to safely electrofish, except for Lamonti Creek where the entire channel could be sampled. The stream margins generally contained slower velocities and eddies where smaller fish would be expected. It is possible that adults were present in the streams but were utilizing the deeper portions of the channel that was not sampled as this may have been their preferred habitat (Bjorn and Reiser 1991, Keeley and Slaney 1996). However, no adult salmonids were encountered in Lamonti Creek where the entire channel width was sampled. Adult Rainbow Trout were observed upstream of the drawdown zone during the spawner surveys completed in the week following the drawdown electrofishing survey. This suggests that these fish either moved up immediately after the survey or had moved upstream prior to the sampling. As the drawdown zone sampling only occurred on a single day in each stream, it is possible that migrating fish could have been missed. However, the primary intent of these surveys is to provide an index of fish use of the drawdown zone reach of each stream and not for detection of fish migrating upstream to spawn. Additional sampling in future years will provide a better picture of fish use of the drawdown zone reaches of each stream and if there are any changes as a result of the access enhancement works. Single pass electrofishing can provide an index of fish abundance without the constraints associated with multiple-pass-removal methods (Kruse et al. 1998). While sampling earlier in the season when more of the drawdown zone portion of the stream is exposed would be preferable, sampling permit conditions restrict electrofishing when the water temperature is below 5°C and in streams containing Bull Trout between September 15 and June 15.
6.2.3 Spawner Surveys
The Rainbow Trout spring spawner surveys were completed once stream temperatures were consistently above 5°C in late June (temperatures were recorded at 6 to 6.7°C during the surveys). The surveys included all areas surveyed in previous years and were expanded further upstream for all streams. The portion of Patsuk Creek, a tributary of Six Mile Creek, downstream of the West Parsnip FSR was also included in the spawner survey. Discharge in Patsuk Creek was higher than from the upstream section of Six Mile Creek. In Year 4, Rainbow Trout spawning activity and redds were observed for the first time in this monitoring project. A total of five redds were observed in Lamonti Creek. Four pairs of adult Rainbow Trout were also observed in Lamonti Creek, with three of the pairs associated with redds. The observation of spawning activity confirms that the timing of the surveys in late June with the observed water temperatures was appropriate. In addition to the observations in Lamonti Creek, adult Rainbow Trout pairs were also observed in Six Mile and Factor Ross Creeks but no redds were observed.
BC Hydro 2015 GMSMON 17 Williston Tributaries – Year 4 Report
DWB Consulting Services Ltd. Cooper Beauchesne and Associates Ltd.
59
A larger area of suitable spawning substrate were identified in each stream relative to the amounts reported in 2013. As a greater length was assessed in each stream this was to be expected. Unmeasured natural changes in channel morphology or visibility may also have contributed to the increase in are of spawning substrates (visibility was generally better in 2014 than in 2013). Annual changes in the area of spawning substrates will be verified through continuation of the spring spawner surveys. The lack of redd observations during the previous years of the program and in most streams in Year 4 is not considered evidence of an absence of spawning as the surveys are completed over a short time frame during the spawning period (Golder 2014). However, spawning has been confirmed in previous years by the identification of Rainbow Trout fry and juveniles in all four streams during the August field surveys (Golder 2014). In 2014, Rainbow Trout fry were only observed in Six Mile Creek during the August field surveys. During the August surveys, stream flows were very low as result of the dry summer in 2014. In Lamonti Creek, at least two of the redds identified in the June spawner surveys were found to be dry in August. While it is not possible to determine when the redds were exposed, the conditions observed in August would suggest complete failure of these two redds. Summer water levels in Six Mile Creek in 2014 were consistently lower than in 2013 and continued to drop from July 10 on. During the spawner surveys, the majority of spawning habitat and fish were observed from the stream banks. The primary limiting factor in observing spawning fish and habitat is the higher water levels that occur in conjunction with the timing of the spawning surveys. Reduced fish activity during the day was also suggested as contributing to the low level of spawning activity observed (Golder 2014).The addition of snorkelling to the spawner surveys was beneficial in Six Mile and Factor Ross Creeks, the two larger streams in the monitoring program. In both of these streams, it was not possible to effectively observe all areas from the banks. The primary benefit of supplementing the spawning surveys with snorkelling is to identify staging fish in deeper, low-velocity habitats.
6.2.4 Juvenile and Small-Bodied Fish Survey
The mark-resight method used in Years 2 and 3 (Golder 2013, 2014) of the monitoring was continued in Year 4. Overall a higher number of fish were captured or observed in Year 4 allowing for a higher number of marked fish and population estimates for more species than in Years 2 and 3. Reasons for the higher number of fish captures and observations in the August surveys are likely a result of the low water levels and associated reduction in velocities and wetted widths. The reduced velocities and wetted widths likely increased the sampling efficiency and may have increased the relative density of fish in the streams. The higher number of fish marked and resighted in Year 4 resulted in proportionately lower standard deviations for population estimates of the most abundant species compared to previous years (Table 15). However, the standard deviations were still quite large. The large variance will make it difficult to detect statistically significant population changes in the post-construction monitoring phase of the program. This is additionally problematic given the annual variation in population estimates and limited data resulting in missing estimates. As an example of variability, estimated Rainbow Trout densities in Lamonti Creek increased from 4.9 fish/100 m2 in 2012 to 9.3 fish/100 m2 in 2013 and 24.2 fish/100 m2 in 2014 (Table 15). In contrast, there was little change in Six Mile Creek over the same period with an estimated density of 10.1
BC Hydro 2015 GMSMON 17 Williston Tributaries – Year 4 Report
DWB Consulting Services Ltd. Cooper Beauchesne and Associates Ltd.
60
fish/100 m2 in 2012 and 10.81 fish/100 m2 in 2014 (Table 15). Additional data collection using the same methods will be required to determine if the observed differences are the result of natural variability, sampling variability, or a change in population. In previous years, the juvenile fish populations were assumed to be closed due to lack of movement when resighting marked fish (Golder 2013, 2014). However, the large number of unmarked fish observed and number of marked fish not observed in the 2014 snorkel surveys suggests that fish are actively moving about the stream as they were likely residing in other habitats not sampled at the time of the specific surveys. In most streams there was ample rearing habitat in adjacent pocket water or other low-velocity areas that were not sampled where fish were likely present. Even though the fish were moving about the stream, it is assumed they are staying in the streams as documented movement was typically within 100 m of the original capture location so the closed population assumption is still valid. However, additional considerations for fish movement may need to be considered in the model. Movement is likely dictated by feeding and temperature but the sampling may have also have caused some fish to move as it was noted on at least two occasions where a fish moved downstream out of its capture pool after release. A goal in subsequent years is to reduce the size of the confidence intervals in the Bayesian abundance estimator. The current methodology has low statistical power with reduces the confidence of inference in relation to a Before–After Control-Impact study design. Future estimates may need to consider a likelihood theoretic or mixed effects modelling approach that accounts for additional or multi-state factors (e.g., imperfect detection, body condition, quantifying habitat complexity, other study groups) that may increase the effect size (Lukacs et al. 2007, Price and Connors 2014) or better care may be also used in selecting priors (Link 2013). It is important to note that “a model that assumes equal catchability of individuals generally leads to an underestimation of the population” (Mantyniemi et al. 2005).
6.2.5 Fry Surveys
In Year 4, Rainbow Trout fry were only observed in Six Mile Creek during the August surveys. Bull Trout fry were also observed in all streams except for Lamonti Creek. The lack of Rainbow Trout in Lamonti Creek was surprising given the observations of spawning activity in late June. A combination of factors may have contributed to the lack of sightings but it is suspected that emergence had not yet occurred in the other streams due to cooler water temperatures. Based on the recorded temperatures from the Ole Creek gauging station (Figure 12), both Finlay Reach sites are considered to be cooler than Six Mile Creek. It was also noted that water temperatures in Lamonti Creek during the August survey were approximately 5°C cooler than in Six Mile Creek. Additionally, the Rainbow Trout fry observed in Six Mile Creek in Year 4 were smaller than those observed in Year 3 suggesting they had only recently emerged. Egg development and fry emergence is water temperature dependent (Murray 1980) so it is possible that emergence had not yet occurred in the other streams. The observed temperature disparity in late August between Six Mile and Lamonti Creeks could not be confirmed over the length of the incubation period as continuous temperature monitoring has not been completed on Lamonti Creek. Following the incubation and spawning timing estimated by Golder (Golder 2013) based on Murray (1980), if Rainbow Trout spawned in Six Mile Creek around the same time as they did in Lamonti (June 26), emergence would have occurred in early August based on the temperatures measured at the gauging station. This corresponds with the first field observations of fry in Six Mile Creek on August 16. The fry appeared to have recently emerged (<week) based on their small size. A temperature disparity
BC Hydro 2015 GMSMON 17 Williston Tributaries – Year 4 Report
DWB Consulting Services Ltd. Cooper Beauchesne and Associates Ltd.
61
between Six Mile and Lamonti Creeks throughout the incubation period could delay fry emergence in Lamonti by a few weeks depending on the temperatures. A temperature difference of 2°C (10°C to 8°C) could result in an incubation period that was 23 days longer (increase from 42 to 65 days) (Murray 1980). If an average 2°C disparity existed between Lamonti and Six Mile Creek, fry emergence may not have occurred until late August. Based on the observed spawning on June 26 this would result in emergence after the night-time fry surveys occurred on August 18 and 19. As previously mentioned, it is suspected that emergence had not yet occurred in the Finlay Reach streams due to cooler temperatures. Ole and Factor Ross Creeks also appear to have relatively low Rainbow Trout populations which limits the number of fry that could potentially be present. In 2013, only one Rainbow Trout fry was observed in the Finlay Reach streams (Ole Creek) (Golder 2014). Although fry survey sites were not randomly selected, they provide a representation of suitable fry habitat and relative fry abundance in the study tributaries. The data can be used to quantify how well suitable young-of-the-year habitats are seeded with fry, and compared to years following habitat enhancement. Continuation of the night-time fry surveys in conjunction with the mark-resight for juvenile fish will provide supporting information for the annual spawner surveys. Assessment of length-frequency distributions from the mark-recapture data will provide additional support to the spawning data by quantifying the abundance of parr (age-1+). Juvenile Rainbow Trout were observed in all four streams indicating spawning success in previous years despite the lack of fry observed in 2014. In order to ensure that emergence has occurred, the fry surveys at Six Mile Creek and Lamonti Creek should be completed closer to the end of August. This strategy would also assist in obtaining information on redd failure during dry years if fry emergence was not observed by the end of August. This timing would also assist with the fry surveys in the Finlay Reach streams due to the cooler temperatures observed in those streams. However, Rainbow Trout appear to be less abundant in Ole and Factor Ross Creeks compared to Six Mile and Lamonti Creeks. Therefore fry observations may be of lesser value in determining spawning success in the two Finlay Reach sites. However, continuing the fry surveys in the post-enhancement period may yield an increase in fry numbers at Ole Creek if the objectives of the tributary access enhancements are realized (an increase in juveniles in subsequent years would also suggest this).
6.2.6 Fish Communities
Fish communities observed in the four tributary streams in Year 4 (the August surveys in particular) are similar to what has been previously documented throughout the pre-enhancement phase of this project. There was an overall trend to higher relative abundance compared to previous years but this was likely associated with higher catch efficiencies under low water conditions. In Six Mile and Lamonti Creeks, Bull Trout and Rainbow Trout are the most common species with a similar abundance of sculpins in both streams. Rainbow Trout were much more prevalent than Bull Trout in Lamonti Creek in 2014 compared to previous years and while Bull Trout were more abundant in Six Mile Creek in 2014, Rainbow Trout were still the most common species. Six Mile Creek is a larger stream and also contains Mountain Whitefish and Burbot which have not been observed to date in Lamonti Creek. Mountain Whitefish prefer deeper, fast flowing streams with larger substrates (McPhail 2007), habitats that are more typical of Six Mile Creek than Lamonti Creek.
BC Hydro 2015 GMSMON 17 Williston Tributaries – Year 4 Report
DWB Consulting Services Ltd. Cooper Beauchesne and Associates Ltd.
62
Similar community structure was observed in Ole and Factor Ross Creeks in Year 4 when compared to previous years with the exception of Kokanee which have not been captured or observed in either stream since 2012. Bull Trout were the most common species in Ole Creek with considerably lower abundances of Mountain Whitefish and Rainbow Trout. In Factor Ross Creek, Mountain Whitefish were the dominant species, followed by smaller numbers of Bull Trout and Rainbow Trout. Sculpins were present in both streams but in low numbers above the drawdown zone relative to their abundance in the drawdown zone reaches of the streams. These results are not surprising given the steeper and faster flows, preferred by Bull Trout and Mountain Whitefish (McPhail 2007), found in the Finlay Reach streams versus the Parsnip Reach streams which have lower gradients and a higher proportion of low-velocity glides and pools. Arctic Grayling were again only observed in Factor Ross Creek during the August snorkel surveys. Arctic Grayling were originally a target species of the tributary access enhancement project but low numbers of fish have only been documented in one of the study streams and no spawning activity has been observed. No population estimates have been calculated as a result. Historical data has shown presence of Arctic Grayling in other project streams including Six Mile Creek (BC MOE Habitat Wizard). However, the present distribution of Arctic Grayling has been reduced to a few of the major tributaries as a result of habitat loss and fragmentation following creation of the reservoir (Blackman 2002, Clarke et al. 2007). Based on the present distribution, it is unlikely that Artic Grayling will be observed in any of the other project streams. Evidence of spawning for Rainbow Trout in Six Mile Creek (fry observation) and Lamonti (redd construction) in 2014 suggests that tributary access is not an issue during migration for this species under the Spring reservoir elevations observed to date in this study. This also assumes that any observed adult fish are adfluvial. Rainbow Trout in the two Finlay Reach streams appear to be generally less abundant than in the two Parsnip Reach streams and may be limited by availability of preferred habitats (Golder 2014). No distinct barriers to fish passage have been observed but it has been previously suggested that the higher gradient, continuous riffles in the drawdown zone of the Finlay Reach streams may act as a behavioural deterrent to fish passage (Golder 2014). Both Parsnip Reach streams have lower gradients in the drawdown zone than the Finlay Reach streams. A juvenile Rainbow Trout was observed in the drawdown zone portion of Ole Creek in Year 4.
6.3 Vegetation
Terrestrial vegetation mapping during Year 4 identified nine habitat classes and one non-vegetated (open water) habitat class at the four sites. With the exception of three wetland habitat classes identified at Six Mile Creek and one habitat class not present at Ole Creek, the vegetation communities documented at all sites were similar and their distribution in the drawdown zone followed a similar pattern. The general pattern, beginning at the forest edge and moving down the drawdown zone in bands generally parallel to the shoreline, begins with willows and grasses, followed by a moderate to high cover of coarse woody debris, transitioning into sparsely vegetated organic and coarse mineral soil surfaces and ending on non-vegetated silt flats that meet the reservoir at low pool. Vegetation mapping also identified seven enhancement classes at Six Mile and Ole Creek sites. Enhancement structures at the two sites were for the most part similar and were concentrated along the edge of the main stream channels. During Year 4 ground sampling, no vegetation was observed on the enhancement structures, with the exception of the planted live willow cuttings and the occasional annual ryegrass germinants establishing on seeded areas. However,
BC Hydro 2015 GMSMON 17 Williston Tributaries – Year 4 Report
DWB Consulting Services Ltd. Cooper Beauchesne and Associates Ltd.
63
vegetation cover is expected to increase on enhancement structures in the years following construction. With the exception of the undisturbed forest cover at shoreline, the habitat classes observed at the four sites have developed in response to the annual flooding regime from reservoir operations. As the timing of reservoir filling and the maximum elevation reached varies from year to year the species present in each of the habitat classes is expected to be variable, particularly in higher elevation habitat classes that may not be flooded every year. In a year where the reservoir level does not reach full pool, species less tolerant to flooding may colonize the drawdown zone during the following growing season (e.g., the GMSMON-15 Airport Lagoon site in 2011; CBA 2014). In comparison, following a year where full pool is reached, species that are less tolerant to flooding are typically absent. All terrestrial species identified during Year 4 ground sampling are likely to be tolerant to flooding events. A majority of these species are adapted to wet soils that are often saturated for a portion of or the entire growing season (e.g., lady’s thumb, common and swamp horsetail, bluejoint and water sedge). Many of these species have also been observed as regularly occurring in other areas of the Williston reservoir (e.g., GMSMON 15 Airport Lagoon and Beaver Pond sites).
6.4 Amphibians
More amphibian species were detected in Year 4 compared to previous years (Table 24). While the CPUE values were comparable, the refined systematic plot and transect methodology showed that amphibians are not randomly distributed and cluster into specific habitats (Appendix 15). Previous amphibian surveys used very general search strategies and did not identify clearly which habitats were searched (Golder 2012, 2013, 2014). Focusing the search effort on specific habitats dramatically increases the CPUE (Table 25) and makes it difficult to compare this index to previous years as level of effort varies greatly according to the type of habitat searched. The comparative histograms on SVL’s from different locations may provide a rough proxy for relative age class or cohort distributions, but SVL is too variable for age estimation in amphibians (Halliday and Verrell 1988, Russell et al. 1996). The results from this analysis indicate that detection has been variable across years through the range of sizes captured in one year and missed in another (e.g., Ole Creek wood frogs; Figure 17). While the sample size was insufficient to provide any sufficient determination for allometric body condition analysis (Wright and Zamudio 2002, Bancila et al. 2010), early results are promising and may prove effective in subsequent years as sample size increases. The number of plots and transects that have been established are likely insufficient to achieve rigorous statistical power to account for imperfect detection. Small population size also reduces detection probabilities. Variation in weather, habitat type, species, and the level of experience of the surveyor are also important variables to consider in the analysis and interpretation of results. Imperfect detection can cause negative bias in any subsequent analyses of abundance, richness, or distribution (Tanadini and Schmidt 2011). While demographic statistics may be limited by detection and sample sizes, the distribution maps of observed amphibians in the study areas (Appendix 15) provide valuable spatial data that can be used to address the management questions including information on the location of different developmental stages. Salamanders generally have smaller home ranges than frogs and toads (Wells 2007). Long-toed salamanders migrate in areas less than 100 m2 in a season (Sheppard 1977). Western toads migrate up to 2.4 km (Semlitsch 2007), spotted frogs >1km (Pilliod et al. 2002), and wood frogs
BC Hydro 2015 GMSMON 17 Williston Tributaries – Year 4 Report
DWB Consulting Services Ltd. Cooper Beauchesne and Associates Ltd.
64
<0.5 km (Baldwin et al. 2006). However, these estimates were obtained from telemetry studies that can underestimate the movement patterns (Trenham and Shaffer 2005). The plot design used in this study may share the advantage of Trenham and Shaffer’s (2005) approach in providing an improved estimate on migration distances as it will register occurrence in the landscape. Moving the plot center into immediately adjacent undisturbed habitat on follow-up surveys may help to ensure that recapture rate is not as greatly impacted by disturbance induced emigration. The alteration of coarse woody debris types during searches modifies the environmental state and could potential increase emigration rates. Coarse woody debris features in plots were classified, typed (e.g., Stevenson et al. 2006), and counted to provide a descriptor of the habitat quality. This data can be used in future analyses of detection and abundance estimates as the sample sizes increase. Alternative sampling approaches such as setting trap arrays (e.g., Trenham and Shaffer 2005) may offer an advantage in terms of reduced disturbance, but require a much higher effort to maintain and monitor the traps than the plot method used in this study. Likewise, transect survey areas are less intrusive, but detection rates seem to be diminished as very few amphibians were encountered. Nocturnal searches may improve on capture rates as many amphibians are more active at night (Buderman and Liebgold 2012). Several locations of key importance to amphibians were identified at the study sites. The amphibian populations at the study sites appear to be relatively small and primarily rely on ephemeral breeding locations. The inference of small population size is based on past experience of capture and encounter rates and relative biomass of tadpoles or eggs observed at other locations. As amphibians generally exhibit high levels of biomass per unit of area relative to other vertebrate species (Semlitsch et al. 2014) any given habitat will have relatively high importance for the sustainability of amphibians at the location due to small population sizes. This also highlights the importance of the surrounding landscape to understand connectivity and sources of immigrants to the study sites. A single observation of a long-toed salamander adult was made at Ole Creek in 2014 in an area containing shoreline driftwood of similar habitat quality to the organic veneer noted at Factor Ross Creek where salamanders were also captured. Driftwood in these areas are in an advanced stage of decay with organic matter accumulating at the base, which creates a moist substrate at the bottom that is also inhabited by an invertebrate food supply. The Ole Creek (site 1.01; Appendix 15) is located immediately adjacent to the enhancement works. Coconut matting was added or driftwood debris was removed from the adjacent areas where plots 1.02 and 1.03 had been established and searched prior to construction of the enhancement works. Salamanders within these foreshore areas at Ole and Factor Ross Creek may also be isolated from the upland sites as no detections were made in the immediate upland plots. Salamanders that were detected in the upland areas at Factor Ross Creek (Appendix 15) may provide recruitment via dispersal by travelling through the stream. Alternatively, the populations within the foreshore area may receive recruitment from the reservoir itself. Ponding may occur in the foreshore area at these locations during high reservoir levels to provide breeding habitat for salamander or frogs. Individuals captured in 2014 may be remnants from breeding that occurred at the location in previous years, but not necessarily in the immediate preceding year as no small juveniles were detected. Long-toed salamanders can live from six years in the wild (Russell et al. 1996), which would leave a recruitment window for sit and wait residents. The marsh site 1.06 at Six Mile Creek is an important breeding pond for salamanders and life history activities of the other amphibian species inhabiting the area. Although tadpoles or eggs

BC Hydro 2015 GMSMON 17 Williston Tributaries – Year 4 Report
DWB Consulting Services Ltd. Cooper Beauchesne and Associates Ltd.
65
of other species have not been reported at this site, this may depend on the water level. The aerial photo imagery from different years shows a wide range in water level. Flooding at this site may be reduced due to the stream enhancement works. The earth berm added to the north-end of this site could also contribute to the longer-term stability of the site. The lead amphibian researcher for this project (M. Thompson) was on-site as an environmental monitor during construction of the enhancement works at Six Mile Creek. Direction was provided on the design and engineered field fit of the earth berm as it encroached into riparian areas adjacent to site 1.06. The construction crew were directed to leave riparian features around the wetland including avoidance of open water to the extent feasible, placement of large pieces of CWD, and leaving mounds of excavated dirt in locations that could provide cover in the riparian site. A small outflow from the wetland into Six Mile Creek that was altered by construction was re-created under the direction of the environmental monitor. However, construction of the tributary access enhancements may affect water level fluctuations, depth, temperature, and habitat availability at this site. Long-toed salamander eggs were identified by Golder (2012) in one of the ponded areas along the drawdown zone on May 11, 2011. This site is 193 m away from site 1.06 and may be part of a continuous metapopulation. The entire foreshore area was thoroughly searched in Year 4 on numerous occasions by the environmental monitor during construction and no eggs were identified. Salamander larvae were not observed at the 1.06 site until August 13, 2014. The larvae were well developed and numerous decaying egg masses were highly visible. This is consistent with observations and dates of egg masses from other locations across the province for this species (Thompson 2003). While Columbia spotted frogs were easily detected at the upper wetland site at Six Mile Creek, the numbers still appear to be relatively small. Golder (2014) reported only 9 spotted frog tadpoles for Six Mile Creek in 2013, but did not indicate if they were observed at the SA2 site. Egg mass and tadpole surveys were originally proposed as part of the study design using methods of Grant et al. (2005) and Gray et al. (2013). However, the relatively small encounter rates makes this type of analysis difficult. Wood frog eggs were previously detected at Ole Creek (May 16, 2011; Golder 2012) in a small ponded area along the road that was searched extensively in 2014. The hydrodynamics of these study locations will be important for future study of amphibian breeding at these sites. Quality photographs are critical for PIMs (Yoshizaki et al. 2009), particularly when dealing with species that have mottled or low contrast in the skin patterns. Methods are being adapted for the photographic technique in this project to provide a stronger contrasting background and an improved lighting/diffuser box to assist with capturing skin patterns in frogs and toads. The strong contrast in the yellow dorsal stripe of a long-toed salamander makes this an ideal tool for mark-recapture study of this species. The proposed effort for measuring environmental parameters at the amphibian breeding locations (including temperature, pH, top depth of eggs, bottom deepest depth of eggs, slope, aspect and general notes on egg substrate attachment sites) was not applied in Year 4 since the general pattern of breeding was not established. However, the high resolution images obtained by UAV do provide detailed information on habitat complexity. Individual pieces of woody debris can be identified in the UAV orthophotos (e.g., the pieces strategically placed at Six Mile Creek site 1.06), so that this information can be quantified in future study years. Future UAV flights at different times of the season can provide greater insight into the hydrodynamics of breeding sites that can be coupled with more intensive investigations in subsequent years of analysis.
BC Hydro 2015 GMSMON 17 Williston Tributaries – Year 4 Report
DWB Consulting Services Ltd. Cooper Beauchesne and Associates Ltd.
66
The key management questions relating to the amphibian inventory are about changes in abundance, diversity, and habitat over time in relation to the enhancement works. Continued sampling of amphibians at a landscape scale can be used to detect changes in amphibian abundance over time. Attributing a change in abundance to a particular cause such as disturbance or the enhancement works requires consistent monitoring of the same parameters over time. While a robust before-after comparison will be challenging, the average fraction of years that a species is present in an area can be positively correlated to local population size (Werner et al. 2007) and this data was gathered throughout the duration of this project. Furthermore, body condition indices that can be extracted from the adopted PIM methodology, such as fluctuating asymmetry in colour pattern or body condition, can be used as a marker of disturbance through comparison to undisturbed reference populations (e.g., Wright and Zamudio 2002). More details and a more robust test of the hypotheses will be made possible by continued study of habitat use, age classes, body condition, and the spatial ecology of amphibians in relation to the enhancement works and habitat characteristics using the systematic landscape-scale search design that was initiated in Year 4.
6.5 Songbirds and Waterbirds
The low numbers of species detected within the survey circles is likely due to the lack of habitat (vegetation) for songbirds at the survey points, which were located along the streams near the enhancement works within the drawdown zone. Additional species were present beyond 75 m where there is more vegetation available. Surveys prior to construction in 2011 (Golder 2012) detected a total of 70 species at these sites, but those surveys included many more points at each site covering a wider variety of habitat. As the enhancement works, including planted vegetation, were recently completed, avian use of these areas may increase in upcoming years. Abundance and diversity of waterfowl and shorebirds was low at all the sites surveyed and no unusual species were detected. Waterfowl and shorebird surveys were not previously conducted at these sites, so it is unknown whether any changes in abundance and diversity of species has occurred.
7 CONCLUSIONS The additional baseline data and initial post-construction observations collected in Year 4 of the GMSMON-17 project are generally consistent with data collected in the previous years of the project. Data collected at the two control sites (Lamonti and Factor Ross Creeks) in Year 4 adds to the existing baseline data at these two sites. At the two tributary enhancement sites (Six Mile and Ole Creeks) the tributary access enhancement projects were constructed in late May – early June during part of the field data collection period for Year 4. Therefore, the data collected from these two sites is a combination of both baseline and initial post-construction observations. Construction activities may have had some influence on the data collected for all indicator groups (fish, vegetation, amphibians, and birds) and this will need to be considered in future analyses to assess the effectiveness of the projects. The key management questions relating to fish within the monitoring program focus on changes in fish abundance and diversity as well habitat quantity and quality as a result of the tributary access enhancements. As the management questions are targeted at post-enhancement results and the enhancement work was only completed in June 2014 no conclusions can be reached

BC Hydro 2015 GMSMON 17 Williston Tributaries – Year 4 Report
DWB Consulting Services Ltd. Cooper Beauchesne and Associates Ltd.
67
yet with respect to the success of the projects. It assumed that completion of the enhancement works in June would have limited influence on the Year 4 results as it is too soon for the projects to have any effects on fish populations. The higher number of fish captures in 2014 is most likely associated with the low water conditions encountered during the August surveys. The larger number of captures resulted in improved abundance estimates for some species, although the variance of the estimates was still large. A longer time series for the post-enhancement data than the pre-enhancement data set will assist in future data analyses as similar estimates rather than the CPUE from different sampling methods can be compared and used to refine the power of inference. The area and quality of fish habitat as a result of the enhancement works can now be monitored through the combination of high resolution orthophotos (obtained by UAV), habitat mapping, and photo referencing tasks. The habitat data is highly important to the study questions. Continuing the early season UAV data acquisition will prove invaluable for quantifying changes in habitat complexity and stream channel characteristics. Assessing the tributary channels through the drawdown zone will provide information on annual changes in accessibility and channel stability for both the enhancement and control streams. The habitat monitoring will be supported by habitat usage information by fish through the drawdown zone sampling program and spawner surveys in the spring. The baseline vegetation data collected in Year 4 provides a better characterization of the vegetation types at the four study sites in comparison to vegetation data collected in previous years. The completed tributary enhancements are likely to increase vegetation establishment along the stream channels within the drawdown zone over time. However, the abundance and diversity of vegetation in these areas is still expected to be primarily influenced by annual reservoir elevations. Changes in vegetation communities as a result of the tributary enhancements is most likely to be observed on the enhancement structures themselves due to the revegetation and the increased elevation. Changes in vegetation communities are also expected on areas adjacent to the structures where the ground has been disturbed as a result of construction activities. The key management questions relating to the amphibian inventory are about changes in abundance, diversity, and habitat over time in relation to the enhancement works. However, it will be challenging to provide a robust test of changes in the abundance and diversity of amphibians through a before-after comparison due to differences in survey methods. The refined amphibian methods established in 2014 will assist in monitoring changes in the relative abundance and diversity in terms of habitat use, age classes, body condition, and spatial ecology over the duration of the project. More details on amphibian spatial ecology in relation to the enhancement works are revealed when coupled with the systematic landscape-scale search design that was initiated in Year 4. The enhancement works at Ole Creek directly impacted one location where long-toed salamanders were identified (site 1.01; Appendix 15). The impact may be negative as some of the debris that provided cover around this location was removed. The debris at this location was likely a longer-term habitat feature as there was development an organic layer between the log and substrate. The removal of the debris and placement of the coconut matting at Ole Creek site 1.02 may also impede the available habitat for migration and foraging out of and around site 1.01. The enhancement works at Six Mile Creek directly impacted an important wetland (site 1.06, Appendix 15). However, the impact may be positive as the stability of the wetland may be better
BC Hydro 2015 GMSMON 17 Williston Tributaries – Year 4 Report
DWB Consulting Services Ltd. Cooper Beauchesne and Associates Ltd.
68
maintained over time and improved cover along the riparian area may increase the available breeding area. The earth berm south of the wetland and diversion of flows may also create new stable wetland areas. However, the access roads to the site might also be an important effect to consider in relation to the upland dynamics. Upland migratory behaviour of the adult and sub-adult stages can be more important for sustaining the population than wetlands (Trenham and Shaffer 2005). The number of birds and diversity observed in both of these surveys was relatively low. As previously noted by Golder (2012), the tributary access enhancements were not expected to have an impact on habitat for songbirds. However, the enhancements at Six Mile Creek did result in the modification of some riparian habitat and potentially creation of new riparian habitat on the two upper berms. This area was incorporated into the Year 4 surveys to allow for monitoring of changes associated with the enhancements. Additionally, little information exists on songbird and waterbird use of the drawdown zone and adjacent areas in Williston Reservoir. The information collected in these surveys will assist in the planning and assessment of future projects around the Williston Reservoir.
8 LITERATURE CITED Anon. 2003. Committee report: Peace River water use plan. Peace River Water Use Plan
Consultative Committee. Baldwin, R. F., A. J. K. Calhoun, and P. G. deMaynadier. 2006. Conservation planning for
amphibian species with complex habitat requirements: a case study using movements and habitat selection of the wood frog Rana sylvatica. Journal of Herpetology 40:442–453.
Bancila, R. I., T. Hartel, R. Plaiasu, J. Smets, and D. Cogalniceanu. 2010. Comparing three body condition indices in amphibians: a case study of yellow-bellied toad Bombina variegata. Amphibia-Reptilia 31:558–562.
BC Hydro. 2007. Peace project water use plan. Revised for acceptance for the comptroller of water rights. BC Hydro.
BC Hydro. 2008. Peace Project Water Use Plan, Monitoring Program Terms of Reference, GMSMON-17 Tributary Habitat Review.
Binder, T. R., and E. D. Stevens. 2004. Appetitive conditioning technique reveals behavioural limits to passage performance in fishes. Environmental Biology of Fishes 71:224–232.
Bjorn, T. C., and D. W. Reiser. 1991. Habitat requirements of salmonids in streams. Influences of forest and rangeland management on salmonid fishes and their habitats.
Blackman, B. G. 2002. An information summary on Arctic Grayling from the Williston Reservoir watershed with data gap analysis and recommendations. Peace Williston Fish and Wildlife Compensation Program.
Bolger, D. T., T. A. Morrison, B. Vance, D. Lee, and H. Farid. 2012. A computer-assisted system for photographic mark–recapture analysis. Methods in Ecology and Evolution 3:813–822.
Buderman, F. E., and E. B. Liebgold. 2012. Effect of search method and age class on mark-recapture parameter estimation in a population of red-backed salamanders. Population Ecology 54:157–167.
Caorsi, V. Z., R. R. Santos, and T. Grant. 2012. An evaluation of toe-clipping and photo-identification methods for identifying individual southern red-bellied toads Melanophryniscus scambaraensi. South American Journal of Herpetology 7:79–84.
Carafa, M., and M. Biondi. 2004. Carafa, M., and M. Biondi. 2004. Application of a method for individual photographic identification during a study on Salamandra salamandra gigliolii
BC Hydro 2015 GMSMON 17 Williston Tributaries – Year 4 Report
DWB Consulting Services Ltd. Cooper Beauchesne and Associates Ltd.
69
in central Italy. Italian Journal of Zoology, Supplement 2: 181-184. Italian Journal of Zoology Supplement 2:181–184.
Clarke, A. D., K. H. Telmer, and J. M. Shrimpton. 2007. Habitat use and movement patterns for a fluvial species, the Arctic grayling, in a watershed impacted by a large reservoir: evidence from otolith microchemistry. Journal of Applied Ecology 44:1156–1165.
Cooper Beauchesne and Associates Ltd (CBA). 2014. GMSMON-15: Reservoir Wetland Habitat Monitoring, Year 3 – Final Report. BC Hydro Generation, Water Licence Requirements, Burnaby, BC.
Cubberly, J. C., and P. E. Hengeveld. 2010. Site selection and design recommendations for Williston Reservoir fish access mitigation trial, northern British Columbia. Synergy Applied Ecology, Mackenzie, BC.
Davis, A. K., L. L. Connell, A. Grosse, and J. C. Maerz. 2008. A fast, non-invasive method of measuring growth in tadpoles using image analysis. Herpetological Review 39:56–58.
Douglas, G. W., G. B. Straley, D. Meidinger, and J. Pojar. 1998. Illustrated Flora of British Columbia Dicotyledons (Balsaminaceae through Cuscutaceae). Ministry of Environment, Lands and Parks and Ministry of Forests.
Elson, P. F. 1962. The Pollett apron seine. Journal of the Fisheries Research Board of Canada 19:93–100.
Ferreira, T., and W. S. Rasband. 2012. ImageJ User Guide — IJ 1.46. Gamble, L., S. Ravela, and K. McGarigal. 2008. Multi-scale features for identifying individuals in
large biological databases: an application of pattern recognition technology to the marbled salamander Ambystoma opacum. Journal of Applied Ecology 4:170–180.
Golder Associates Ltd. 2012. Williston Reservoir tributary habitat review - 2011 summary report. BC Hydro, Burnaby, BC.
Golder Associates Ltd. 2013. Williston Reservoir tributary habitat review - 2012 data summary report. BC Hydro, Burnaby, BC.
Golder Associates Ltd. 2014. Williston Reservoir tributary habitat review - 2013 data summary report. BC Hydro, Burnaby, BC.
Grant, C. E., R. Jung, J. Nichols, and J. Hines. 2005. Double-observer approach to estimating egg mass abundance of pool-breeding amphibians. Wetlands Ecology and Management 13:305–320.
Gray, M. J., M. J. Chamberlain, D. A. Buehler, and W. B. Sutton. 2013. Wetland wildlife monitoring and assessment. Wetland Techniques. Springer, New York, NY.
Hagen, J., A. S. Decker, J. Korman, and R. Bison. 2010. Effectiveness of night snorkeling for estimating steelhead parr abundance in a large river basin. North American Journal of Fisheries Management 30:1280–1302.
Halliday, T. R., and P. A. Verrell. 1988. Body size and age in amphibians and reptiles. Journal of Herpetology 22:253–265.
Hengeveld, P. E. 2000. Presence and distribution of amphibians in the Williston and Dinosaur Reservoir watersheds. PWFWCP Report No. 212, Peace/Williston Fish and Wildlife Compensation Program, Prince George, B.C.
Hitchcock, C. L., and A. Cronquist. 1973. Flora of the Pacific Northwest. University of Washington Press, Seattle, WA.
Keeley, E. R., and P. A. Slaney. 1996. Quantitative measures of rearing and spawning habitat characteristics for stream-dwelling salmonids: guidelines for habitat restoration. Province of British Columbia, Ministry of Environment, Lands and Parks and Ministry of Forests.
Kerr Wood Leidal and Associates Ltd (KWL). 2013. GMSWORKS #19 Williston Reservoir Trial Tributaries, Ole Creek and Six Mile Creek, Construction Drawings.
Korman, J., J. Schick, C. C. Melville, and D. J. F. McCubbing. 2011. Cheakamus River steelhead juvenile abundance monitoring Fall 2010 – Spring 2011 Draft Report. BC Hydro, Burnaby, BC.
BC Hydro 2015 GMSMON 17 Williston Tributaries – Year 4 Report
DWB Consulting Services Ltd. Cooper Beauchesne and Associates Ltd.
70
Kruse, C. G., W. A. Hubert, and F. J. Rahel. 1998. Single-pass electrofishing predicts trout abundance in mountain streams with sparse habitat. North American Journal of Fisheries Management 18:940–946.
LGL Limited. 2007. Columbia River project water use plan. Kinbasket and Arrow Lake revegetation management plan. BC Hydro Generation, Burnaby, B.C.
Link, W. A. 2013. A cautionary note on the discrete uniform prior for the binomial N. Ecology 94:2173–2179.
Lukacs, P. M., W. L. Thompson, W. L. Kendall, W. R. Gould, P. F. Doherty Jr., K. P. Burnham, and D. R. Anderson. 2007. Concerns regarding a call for pluralism of information theory and hypothesis testing. Journal of Applied Ecology 44:456–460.
Lunn, D. J., A. Thomas, N. Best, and D. Spiegelhalter. 2000. WinBUGS - Bayesian modelling framework: concepts, structure, and extensibility. Statistics and Computing 10:325–337.
MacKenzie, W. H., and J. R. Moran. 2004. Wetlands of British Columbia: a guide to identification. B.C. Ministry of Forests, Victoria, B.C.
MacKinnon, A., J. Pojar, and R. Coupe. 1999. Plants of northern British Columbia. Second edition. Lone Pine Publishing, Vancouver BC, Edmonton AB, Auburn Washington.
Mantyniemi, S., and A. Romakkaniemi. 2002. Bayesian mark–recapture estimation with an application to a salmonid smolt population. Canadian Journal of Fisheries and Aquatic Sciences 59:1748–1758.
Mantyniemi, S., A. Romakkaniemi, and E. Arjas. 2005. Bayesian removal estimation of a population size under unequal catchability. Canadian Journal of Fisheries and Aquatic Sciences 62:291–300.
McPhail, J. D. 2007. The Freshwater Fishes of British Columbia. The University of Alberta Press, Edmonton, AB.
Meidinger, D., and J. Pojar. 1991. Ecosystems of British Columbia. BC Ministry of Forests, Victoria, B.C.
Murray, C. B. 1980. Some effects of temperature on zygote and alevin survival, rate of development and size at hatching and emergence of Pacific salmon and Rainbow Trout. Masters of Science, University of British Columbia, Vancouver, BC.
Ogle, D. (n.d.). FSA: Fisheries Stock Assessment. R package. Pilliod, D. S., C. R. Petereon, and P. I. Ritson. 2002. Seasonal migration of Columbia spotted
frogs (Rana luteiventris) among complementary resources in a high mountain basin. Canadian Journal of Zoology 80:1849–1862.
Price, M. H. H., and B. M. Connors. 2014. Evaluating relationships between wild Skeena River Sockeye Salmon productivity and the abundance of spawning channel enhanced Sockeye smolts. PLoS ONE 9:e95718.
Province of British Columbia. 2010. Field manual for describing terrestrial ecosystems. 2nd ed. Ministry of Forests and Range and Ministry of Environment, Forest Science Program, Victoria, BC.
R Core Team. 2014. R: a language and environment for statistical computing. R Foundation for Statistical Computing, Vienna, Austria.
Resources Information Standards Committee. 2010. Vegetation resources inventory. Photo interpretation procedures. Ministry of Forests and Range, Victoria, B.C.
Resources Inventory Committee. 1999. Inventory methods for forest and grassland songbirds. Ministry of Environment, Lands and Parks, Victoria, BC.
Resources Inventory Committee (RIC). 1998. Inventory methods for pond-breeding amphibians and painted turtle. Ministry of Environment, Lands and Parks, Victoria, BC.
Russell, A. P., G. L. Powell, and D. R. Hall. 1996. Growth and age of Alberta long-toed salamanders (Ambystoma macrodactylum krausei): a comparison of two methods of estimation. Canadian Journal of Zoology 74:397–412.
BC Hydro 2015 GMSMON 17 Williston Tributaries – Year 4 Report
DWB Consulting Services Ltd. Cooper Beauchesne and Associates Ltd.
71
Schick, J., S. Decker, J. Macnair, and G. Lewis. 2013. Coquitlam - Buntzen Water Use Plan, Lower Coquitlam River Fish Productivity Index, Implementation Year 6 (COQMON #7). BC Hydro, Burnaby, BC.
Semlitsch, R. D. 2007. Differentiating migration and dispersal processes for pond-breeding amphibians. Journal of Wildlife Management 72:260–267.
Semlitsch, R. D., K. M. Dohms, and F. R. Thompson. 2014. Abundance, biomass production, nutrient content, and the possible role of terrestrial salamanders in Missouri Ozark forest ecosystems. Canadian Journal of Zoology 92:997–1004.
Sheppard, R. F. 1977. The ecology and home range movements of Ambystoma macrodactylum krausei (Amphibia: Urodela). M.Sc., University of Calgary, Calgary, Alberta.
Stevenson, S. K., M. J. Jull, and B. J. Rogers. 2006. Abundance and attributes of wildlife trees and coarse woody debris at three silvicultural systems study areas in the interior cedar-hemlock zone, British Columbia. Forest Ecology and Management 233:176–91.
Tanadini, L. G., and B. R. Schmidt. 2011. Population Size Influences Amphibian Detection Probability: Implications for Biodiversity Monitoring Programs. PLoS ONE 6:e28244.
Thompson, M. D. 2003. Phylogeography of the long-toed salamander (Ambystoma macrodactylum). M.Sc., University of Calgary, Calgary, Alberta.
Trenham, P. C., and H. B. Shaffer. 2005. Amphibian upland habitat use and its consequences for population viability. Ecological Applications 15:1158–1168.
US Environmental Protection Agency. 2002. Methods for evaluating wetland condition: using vegetation to assess environmental condition in wetlands. Office of Water, US Environmental Protection Agency, Washington, DC.
Wells, K. D. 2007. The Ecology and Behaviour of Amphibians. The University of Chicago Press, Chicago.
Werner, E. E., K. L. Yurewicz, K. D. Skelly, and R. A. Relyea. 2007. Turnover in an amphibian metacommunity: The role of local and regional factors. Oikos 116:1713–1725.
Wright, A. N., and K. R. Zamudio. 2002. Color pattern asymmetry as a correlate of habitat disturbance in spotted salamanders (Ambystoma maculatum). Journal of Herpetology 36:129–132.
Yoshizaki, J., K. H. Pollock, C. Brownie, and R. A. Webster. 2009. Modeling misidentification errors in capture–recapture studies using photographic identification of evolving marks. Ecology 90:3–9.
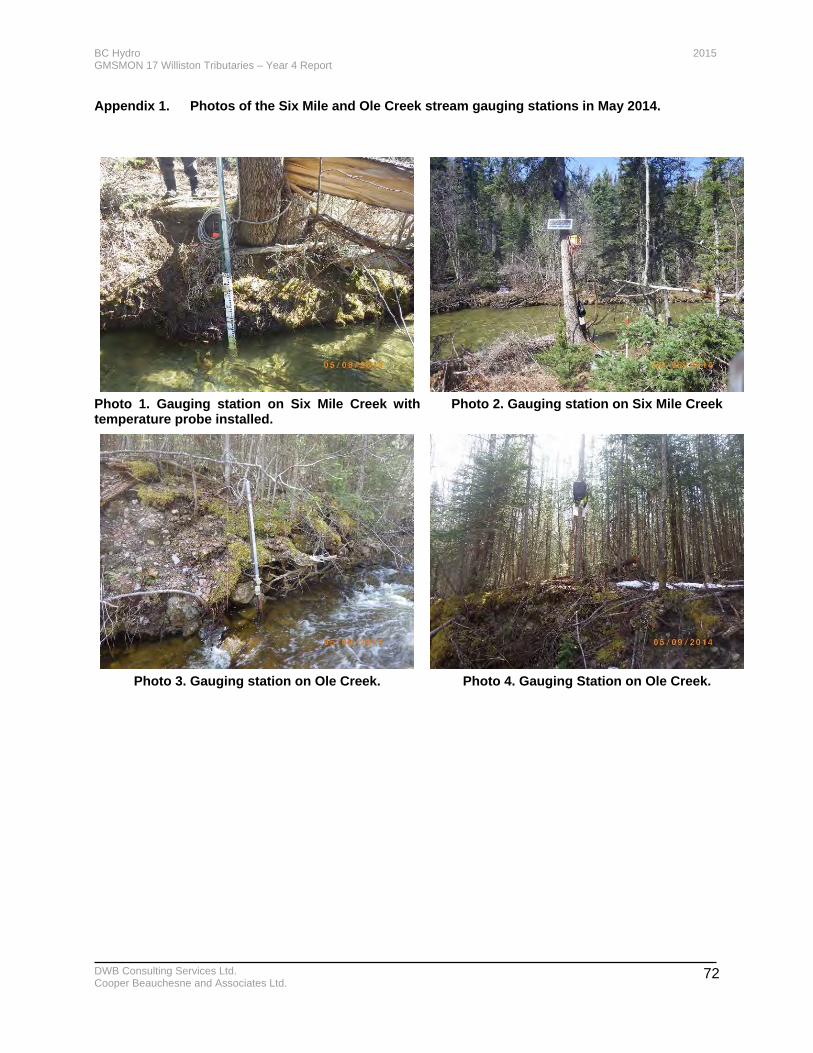
BC Hydro 2015 GMSMON 17 Williston Tributaries – Year 4 Report
DWB Consulting Services Ltd. Cooper Beauchesne and Associates Ltd.
72
Appendix 1. Photos of the Six Mile and Ole Creek stream gauging stations in May 2014.
Photo 1. Gauging station on Six Mile Creek with temperature probe installed.
Photo 2. Gauging station on Six Mile Creek
Photo 3. Gauging station on Ole Creek. Photo 4. Gauging Station on Ole Creek.

BC Hydro 2015 GMSMON 17 Williston Tributaries – Year 4 Report
DWB Consulting Services Ltd. Cooper Beauchesne and Associates Ltd.
73
Appendix 2. Rating curves and stage-discharge tables for Six Mile and Ole Creeks.
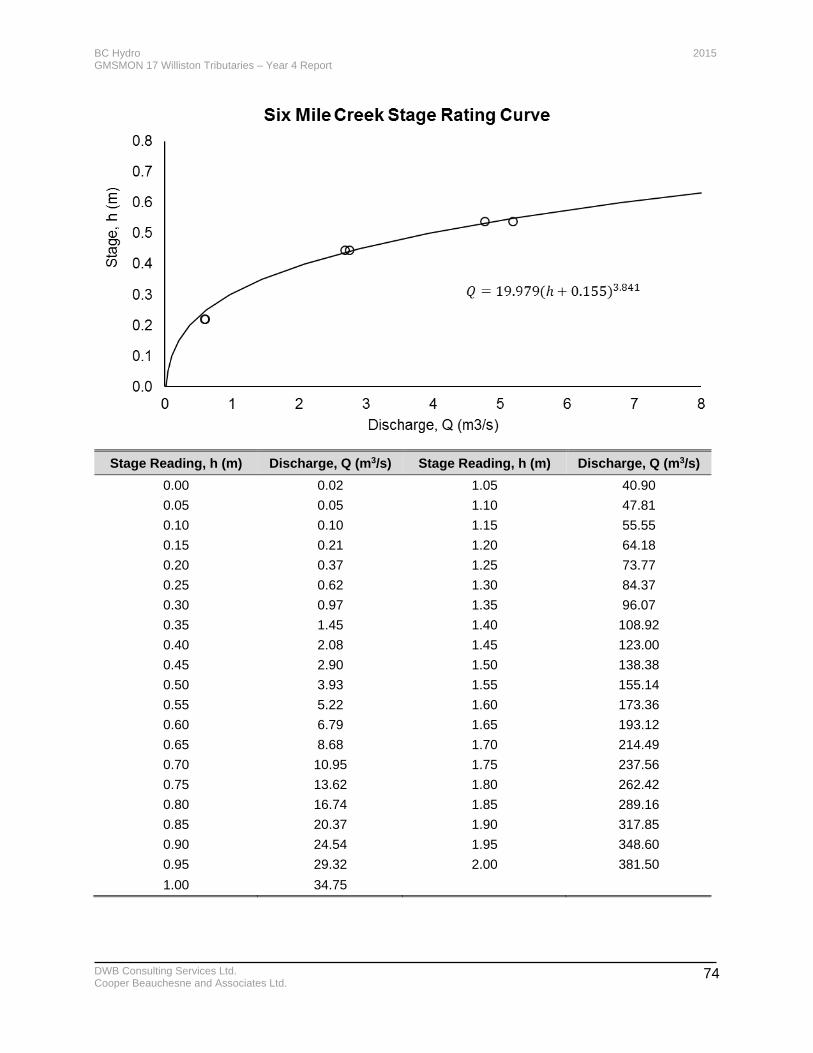
BC Hydro 2015 GMSMON 17 Williston Tributaries – Year 4 Report
DWB Consulting Services Ltd. Cooper Beauchesne and Associates Ltd.
74
Stage Reading, h (m) Discharge, Q (m3/s) Stage Reading, h (m) Discharge, Q (m3/s)
0.00 0.02 1.05 40.90
0.05 0.05 1.10 47.81
0.10 0.10 1.15 55.55
0.15 0.21 1.20 64.18
0.20 0.37 1.25 73.77
0.25 0.62 1.30 84.37
0.30 0.97 1.35 96.07
0.35 1.45 1.40 108.92
0.40 2.08 1.45 123.00
0.45 2.90 1.50 138.38
0.50 3.93 1.55 155.14
0.55 5.22 1.60 173.36
0.60 6.79 1.65 193.12
0.65 8.68 1.70 214.49
0.70 10.95 1.75 237.56
0.75 13.62 1.80 262.42
0.80 16.74 1.85 289.16
0.85 20.37 1.90 317.85
0.90 24.54 1.95 348.60
0.95 29.32 2.00 381.50
1.00 34.75
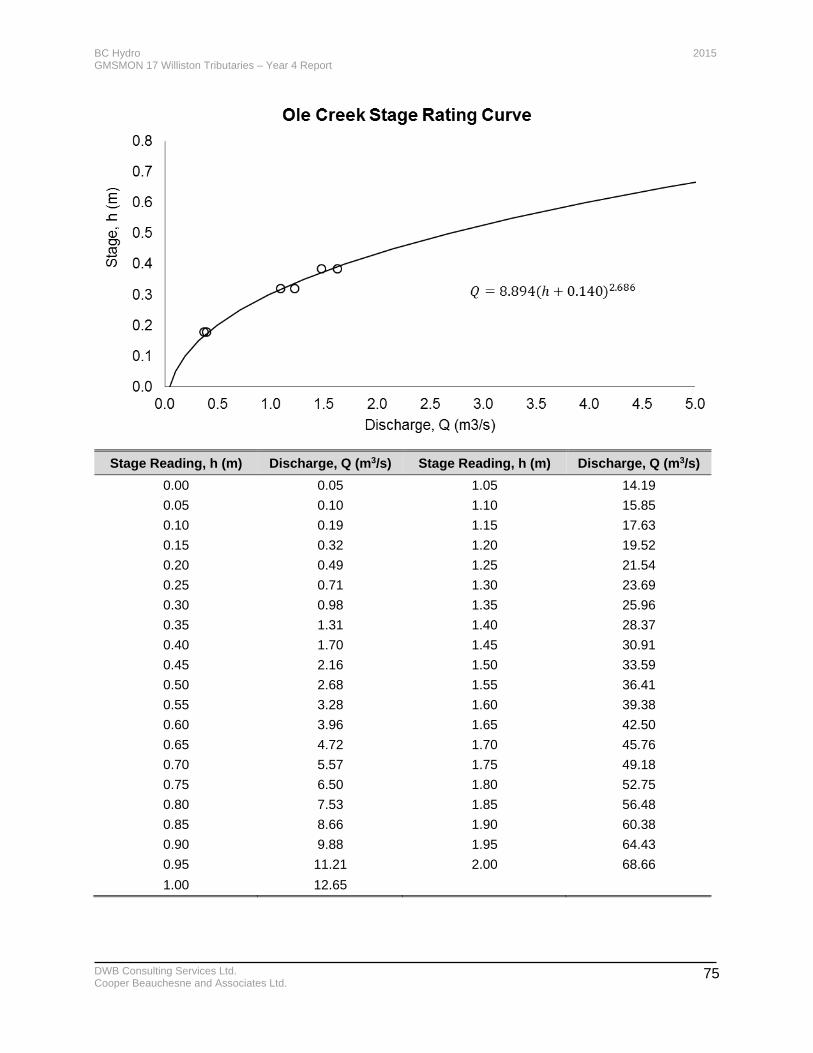
BC Hydro 2015 GMSMON 17 Williston Tributaries – Year 4 Report
DWB Consulting Services Ltd. Cooper Beauchesne and Associates Ltd.
75
Stage Reading, h (m) Discharge, Q (m3/s) Stage Reading, h (m) Discharge, Q (m3/s)
0.00 0.05 1.05 14.19
0.05 0.10 1.10 15.85
0.10 0.19 1.15 17.63
0.15 0.32 1.20 19.52
0.20 0.49 1.25 21.54
0.25 0.71 1.30 23.69
0.30 0.98 1.35 25.96
0.35 1.31 1.40 28.37
0.40 1.70 1.45 30.91
0.45 2.16 1.50 33.59
0.50 2.68 1.55 36.41
0.55 3.28 1.60 39.38
0.60 3.96 1.65 42.50
0.65 4.72 1.70 45.76
0.70 5.57 1.75 49.18
0.75 6.50 1.80 52.75
0.80 7.53 1.85 56.48
0.85 8.66 1.90 60.38
0.90 9.88 1.95 64.43
0.95 11.21 2.00 68.66
1.00 12.65

BC Hydro 2015 GMSMON 17 Williston Tributaries – Year 4 Report
DWB Consulting Services Ltd. Cooper Beauchesne and Associates Ltd.
76
Appendix 3. 2014 photos from the photo monitoring points on Six Mile, Lamonti, Ole, and Factor Ross Creeks.
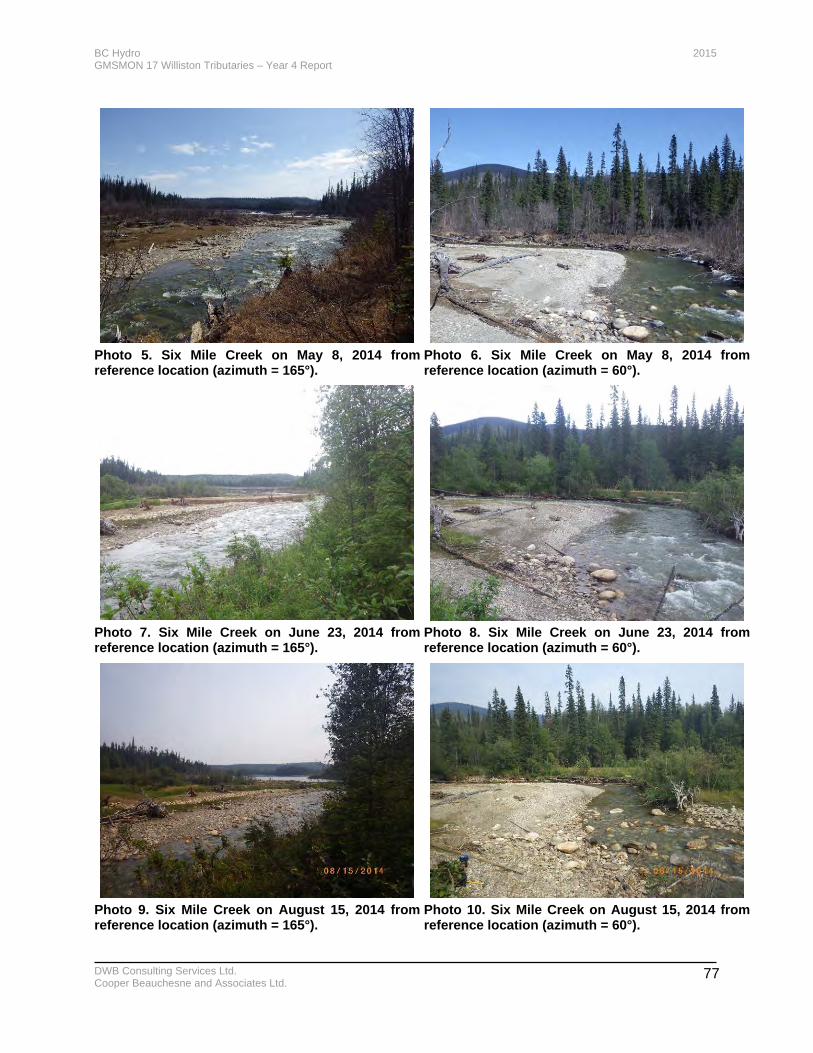
BC Hydro 2015 GMSMON 17 Williston Tributaries – Year 4 Report
DWB Consulting Services Ltd. Cooper Beauchesne and Associates Ltd.
77
Photo 5. Six Mile Creek on May 8, 2014 from reference location (azimuth = 165°).
Photo 6. Six Mile Creek on May 8, 2014 from reference location (azimuth = 60°).
Photo 7. Six Mile Creek on June 23, 2014 from reference location (azimuth = 165°).
Photo 8. Six Mile Creek on June 23, 2014 from reference location (azimuth = 60°).
Photo 9. Six Mile Creek on August 15, 2014 from reference location (azimuth = 165°).
Photo 10. Six Mile Creek on August 15, 2014 from reference location (azimuth = 60°).
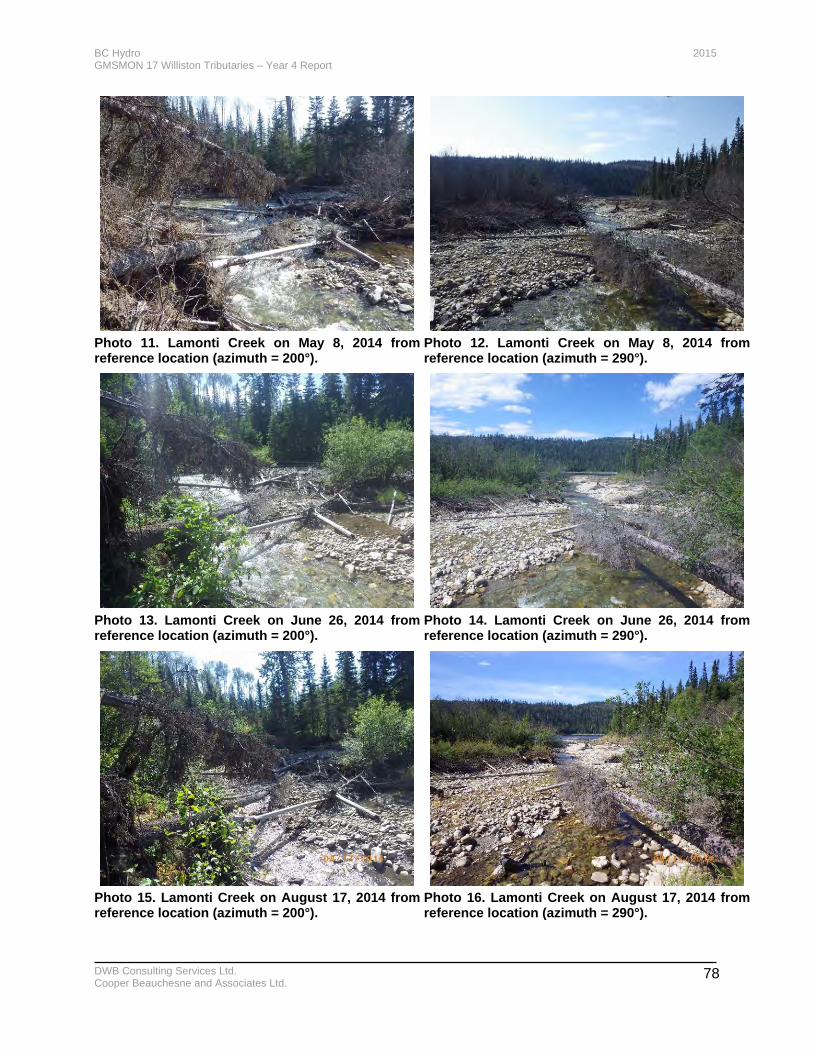
BC Hydro 2015 GMSMON 17 Williston Tributaries – Year 4 Report
DWB Consulting Services Ltd. Cooper Beauchesne and Associates Ltd.
78
Photo 11. Lamonti Creek on May 8, 2014 from reference location (azimuth = 200°).
Photo 12. Lamonti Creek on May 8, 2014 from reference location (azimuth = 290°).
Photo 13. Lamonti Creek on June 26, 2014 from reference location (azimuth = 200°).
Photo 14. Lamonti Creek on June 26, 2014 from reference location (azimuth = 290°).
Photo 15. Lamonti Creek on August 17, 2014 from reference location (azimuth = 200°).
Photo 16. Lamonti Creek on August 17, 2014 from reference location (azimuth = 290°).
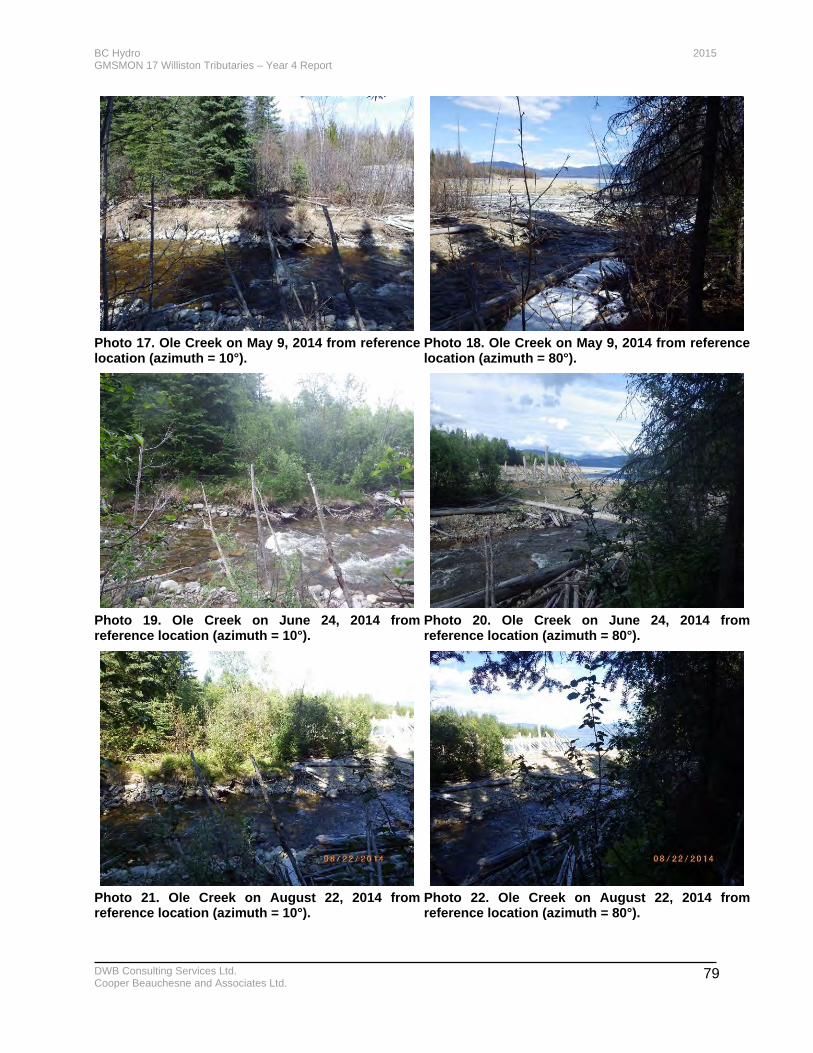
BC Hydro 2015 GMSMON 17 Williston Tributaries – Year 4 Report
DWB Consulting Services Ltd. Cooper Beauchesne and Associates Ltd.
79
Photo 17. Ole Creek on May 9, 2014 from reference location (azimuth = 10°).
Photo 18. Ole Creek on May 9, 2014 from reference location (azimuth = 80°).
Photo 19. Ole Creek on June 24, 2014 from reference location (azimuth = 10°).
Photo 20. Ole Creek on June 24, 2014 from reference location (azimuth = 80°).
Photo 21. Ole Creek on August 22, 2014 from reference location (azimuth = 10°).
Photo 22. Ole Creek on August 22, 2014 from reference location (azimuth = 80°).
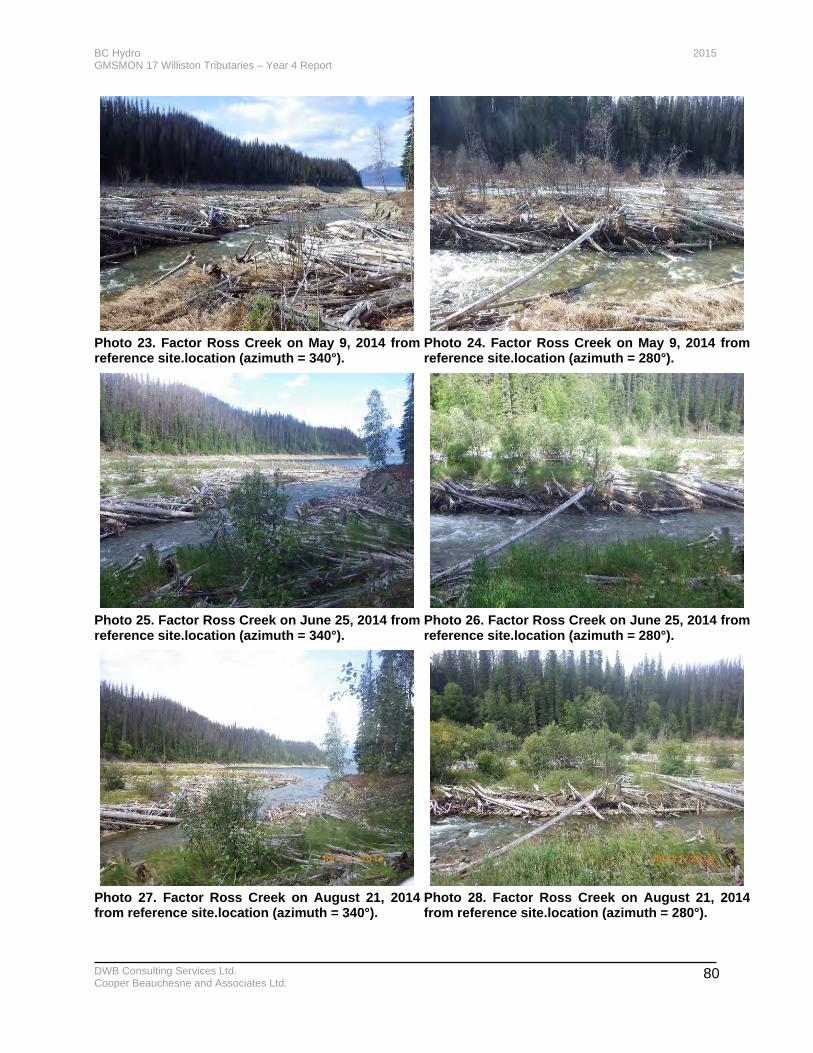
BC Hydro 2015 GMSMON 17 Williston Tributaries – Year 4 Report
DWB Consulting Services Ltd. Cooper Beauchesne and Associates Ltd.
80
Photo 23. Factor Ross Creek on May 9, 2014 from reference site.location (azimuth = 340°).
Photo 24. Factor Ross Creek on May 9, 2014 from reference site.location (azimuth = 280°).
Photo 25. Factor Ross Creek on June 25, 2014 from reference site.location (azimuth = 340°).
Photo 26. Factor Ross Creek on June 25, 2014 from reference site.location (azimuth = 280°).
Photo 27. Factor Ross Creek on August 21, 2014 from reference site.location (azimuth = 340°).
Photo 28. Factor Ross Creek on August 21, 2014 from reference site.location (azimuth = 280°).

BC Hydro 2015 GMSMON 17 Williston Tributaries – Year 4 Report
DWB Consulting Services Ltd. Cooper Beauchesne and Associates Ltd.
81
Appendix 4. Drawdown zone stream habitat maps for Six Mile, Lamonti, Ole, and Factor Ross Creeks.
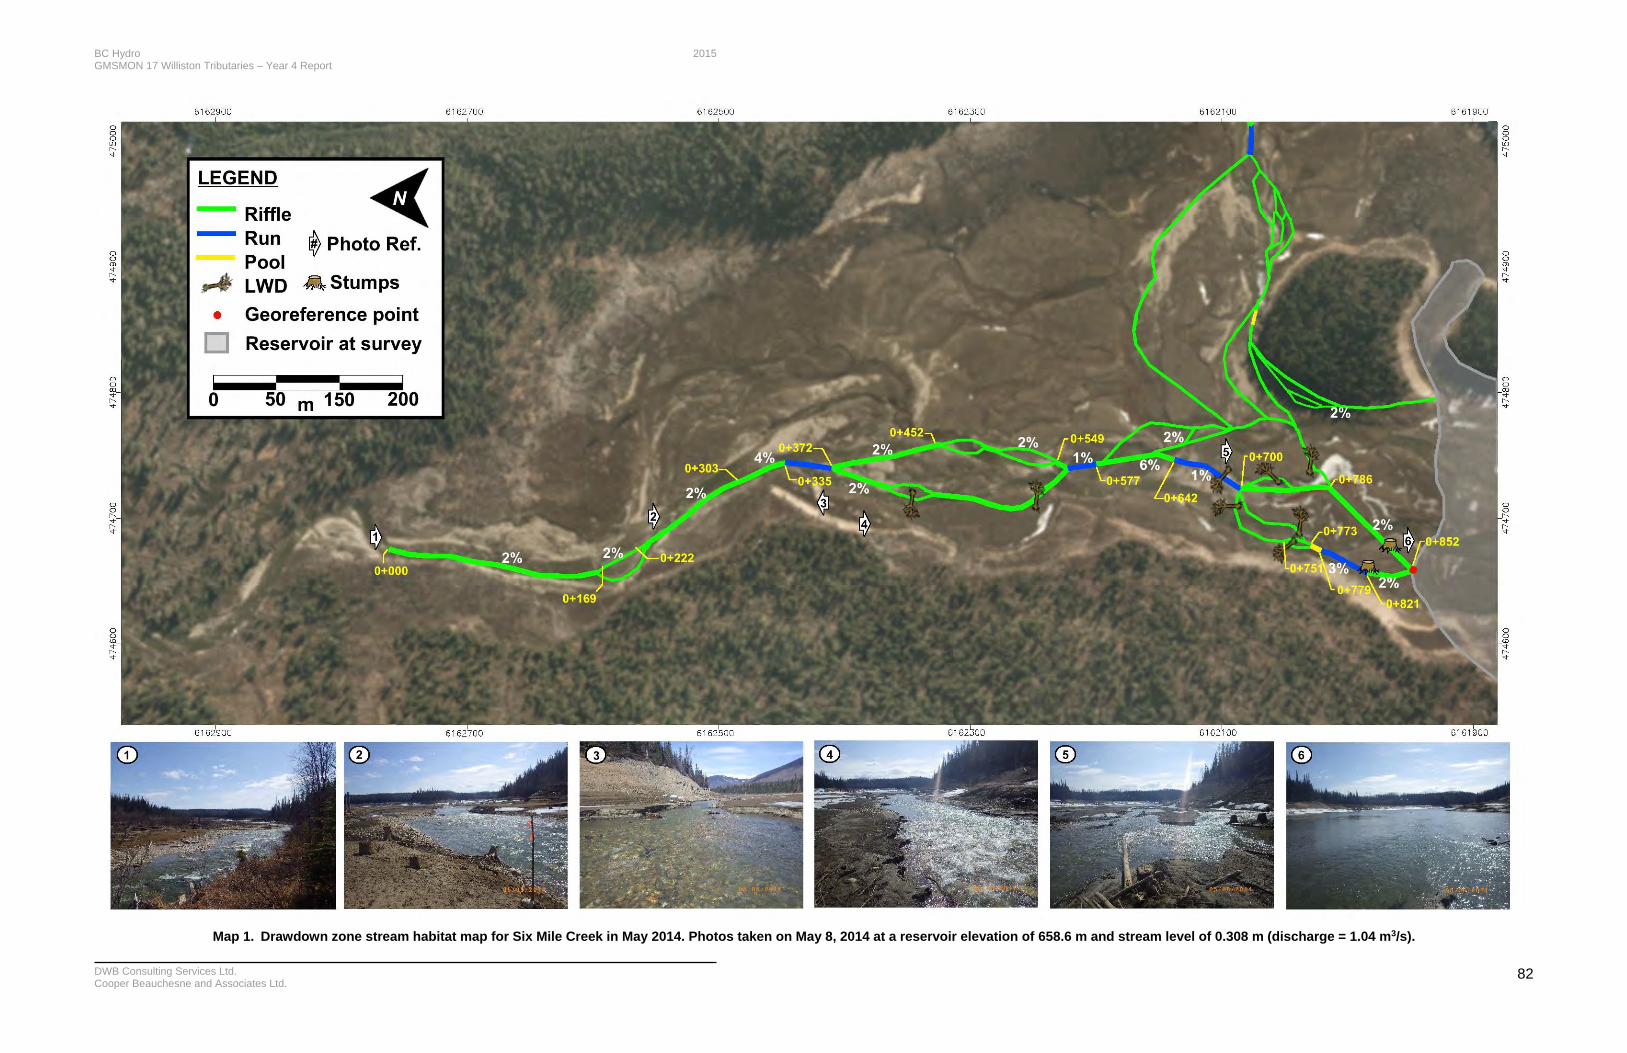
BC Hydro 2015 GMSMON 17 Williston Tributaries – Year 4 Report
DWB Consulting Services Ltd. Cooper Beauchesne and Associates Ltd.
82
Map 1. Drawdown zone stream habitat map for Six Mile Creek in May 2014. Photos taken on May 8, 2014 at a reservoir elevation of 658.6 m and stream level of 0.308 m (discharge = 1.04 m3/s).
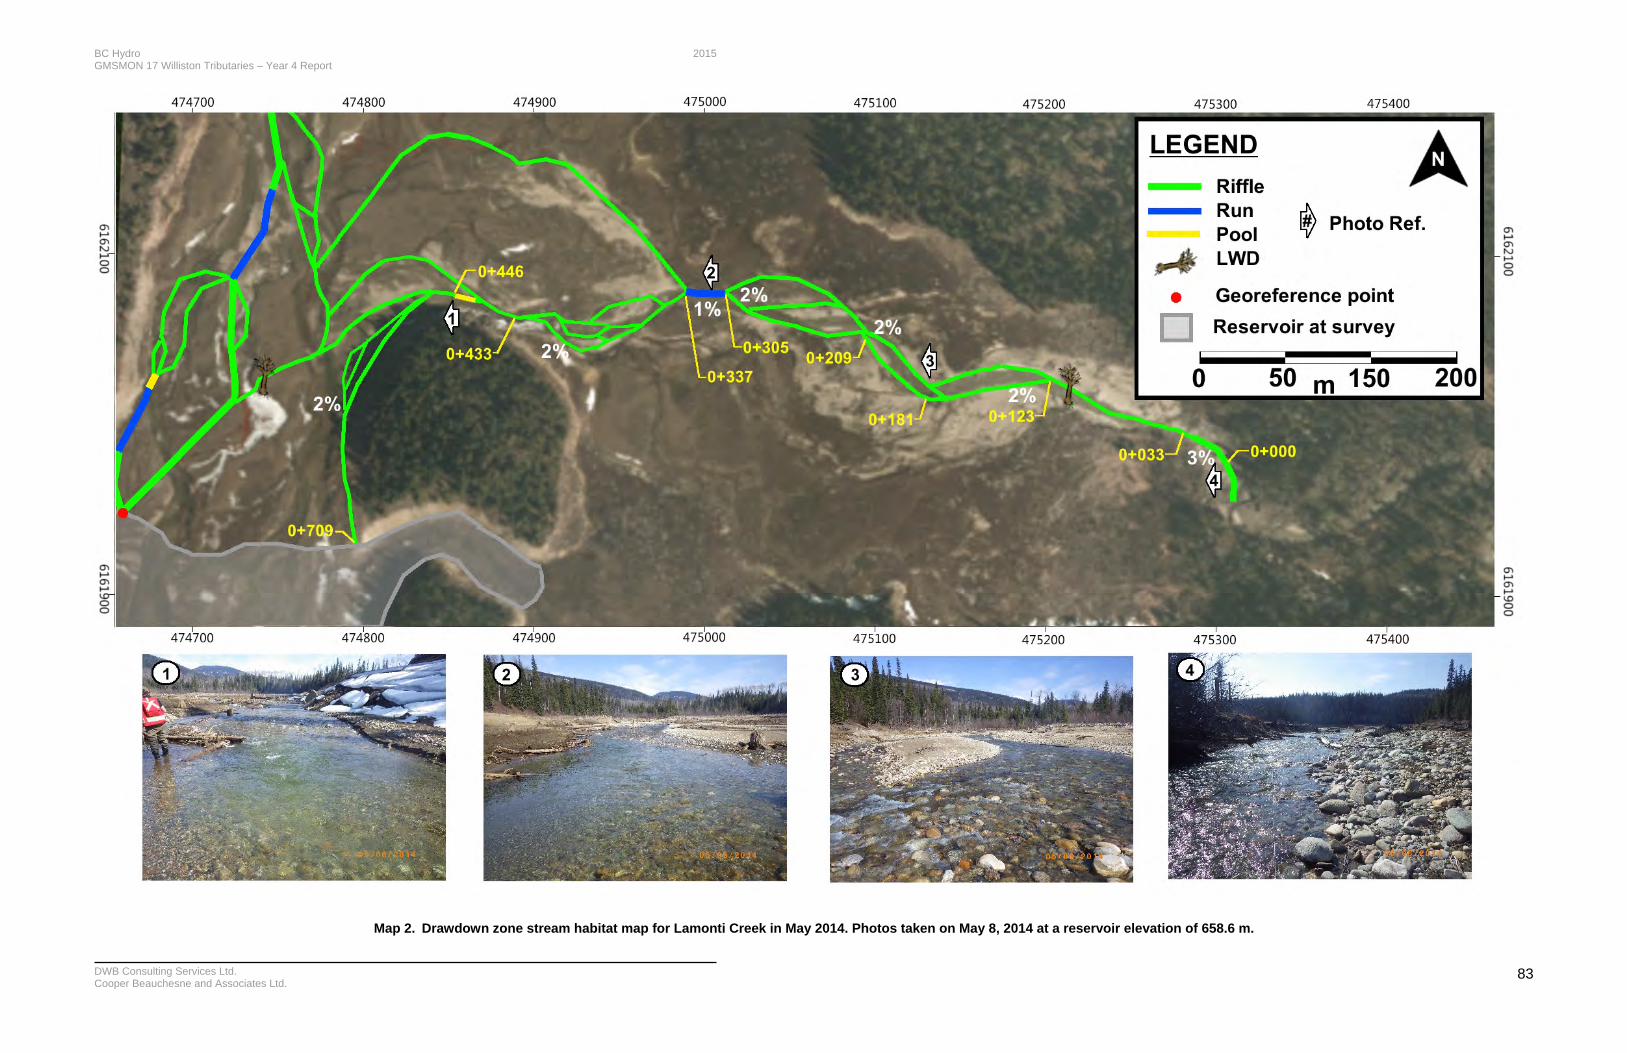
BC Hydro 2015 GMSMON 17 Williston Tributaries – Year 4 Report
DWB Consulting Services Ltd. Cooper Beauchesne and Associates Ltd.
83
Map 2. Drawdown zone stream habitat map for Lamonti Creek in May 2014. Photos taken on May 8, 2014 at a reservoir elevation of 658.6 m.
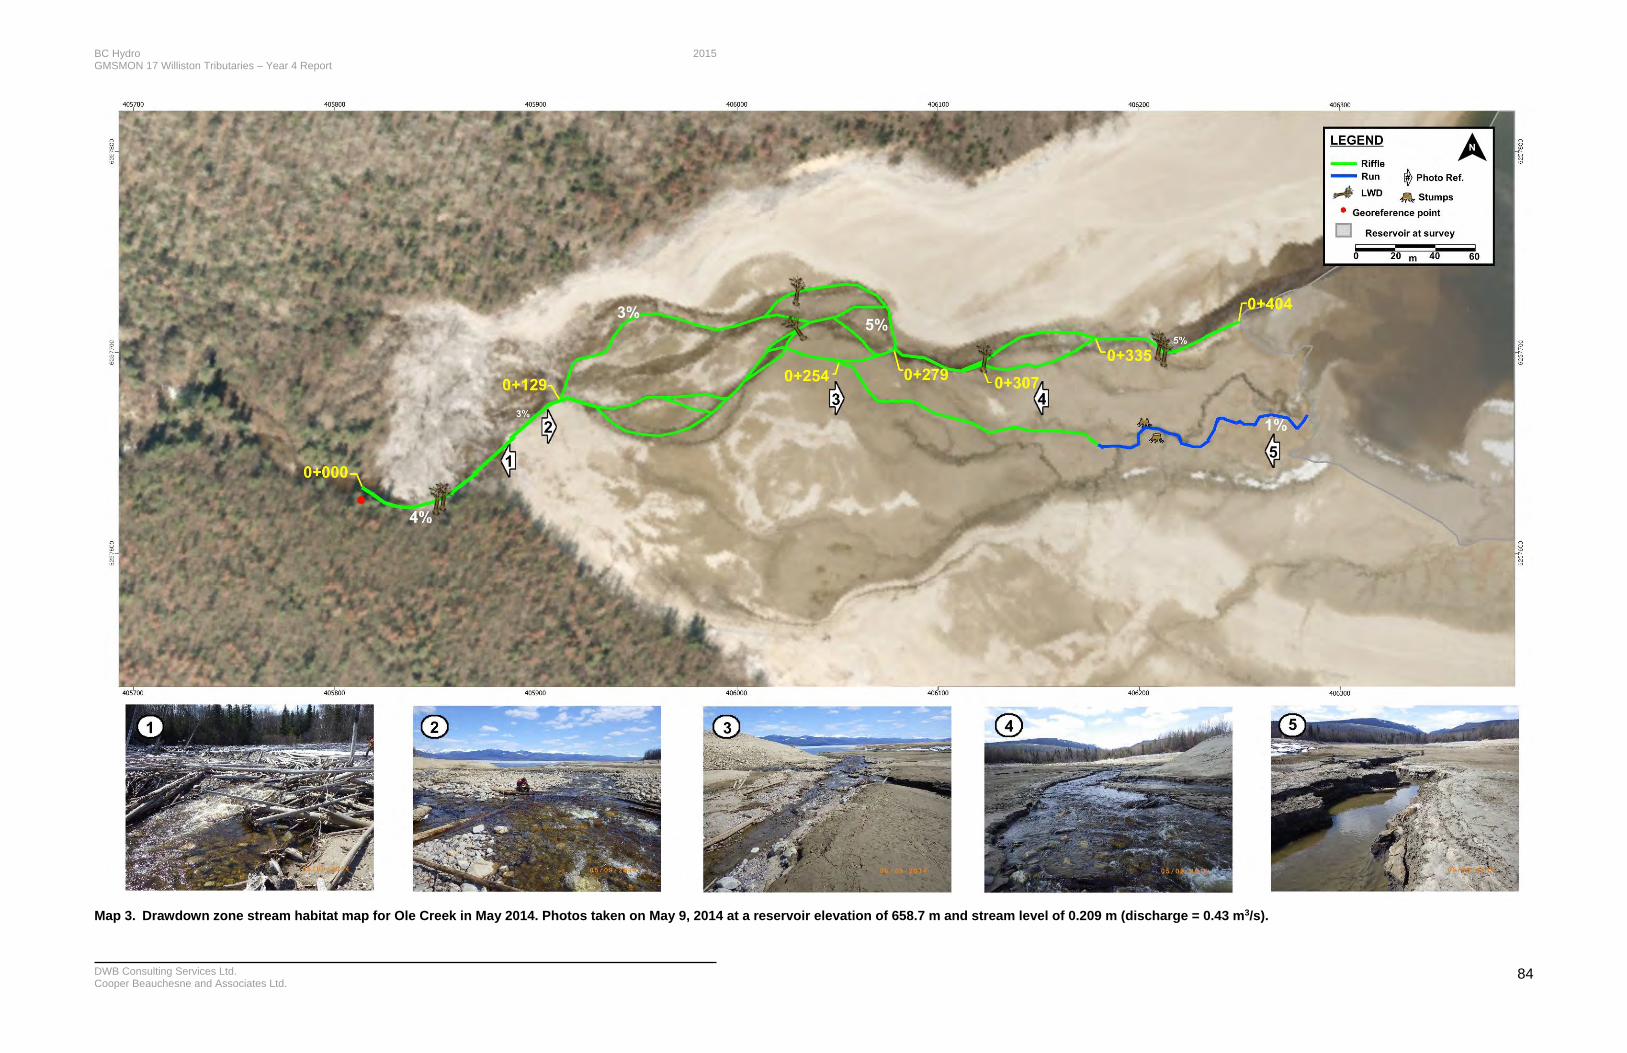
BC Hydro 2015 GMSMON 17 Williston Tributaries – Year 4 Report
DWB Consulting Services Ltd. Cooper Beauchesne and Associates Ltd.
84
Map 3. Drawdown zone stream habitat map for Ole Creek in May 2014. Photos taken on May 9, 2014 at a reservoir elevation of 658.7 m and stream level of 0.209 m (discharge = 0.43 m3/s).
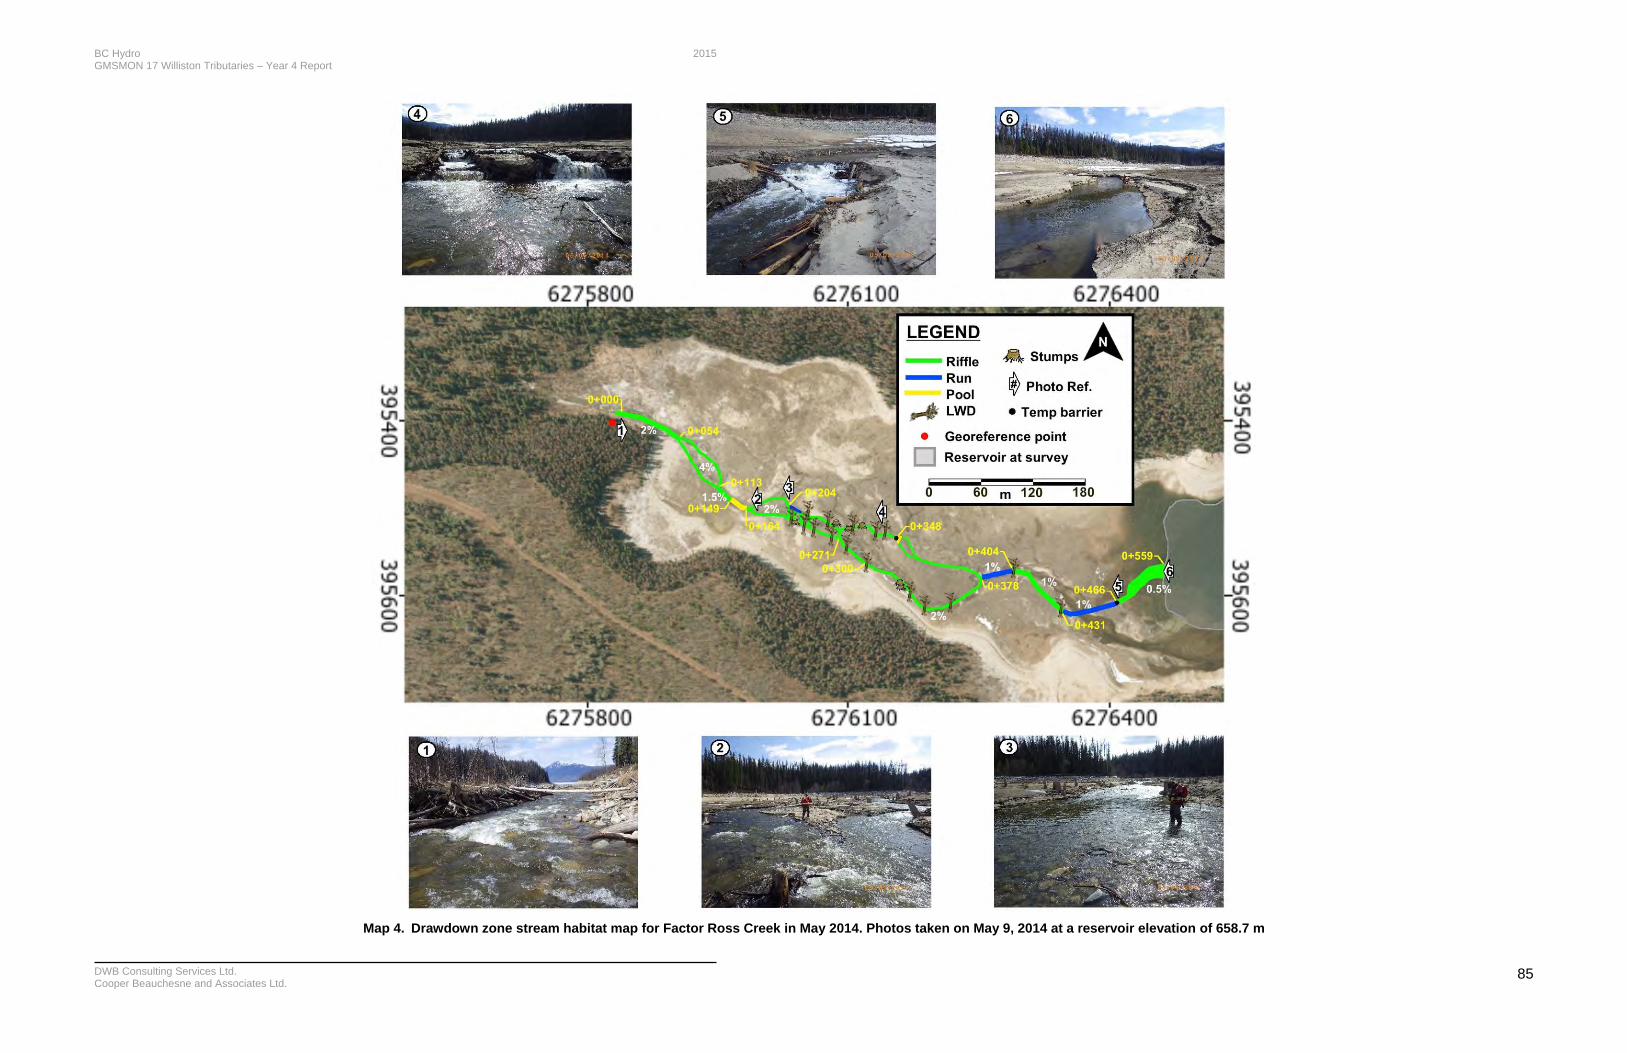
BC Hydro 2015 GMSMON 17 Williston Tributaries – Year 4 Report
DWB Consulting Services Ltd. Cooper Beauchesne and Associates Ltd.
85
Map 4. Drawdown zone stream habitat map for Factor Ross Creek in May 2014. Photos taken on May 9, 2014 at a reservoir elevation of 658.7 m
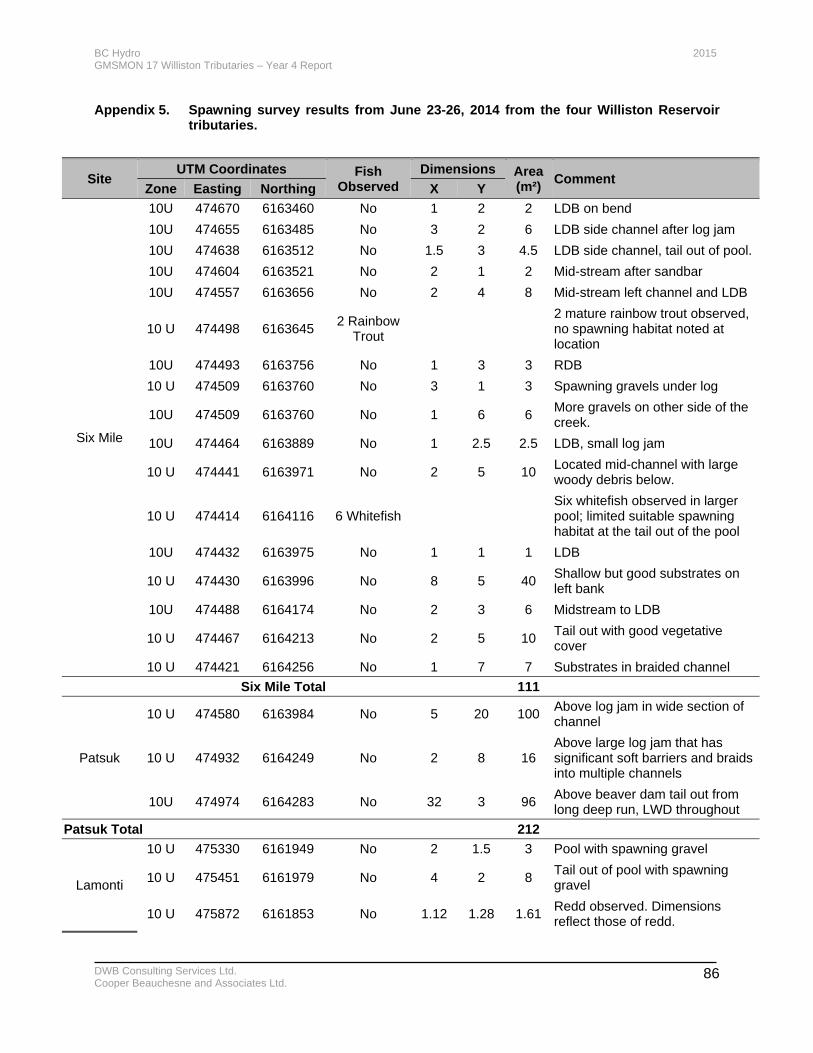
BC Hydro 2015 GMSMON 17 Williston Tributaries – Year 4 Report
DWB Consulting Services Ltd. Cooper Beauchesne and Associates Ltd.
86
Appendix 5. Spawning survey results from June 23-26, 2014 from the four Williston Reservoir tributaries.
Site UTM Coordinates Fish
Observed Dimensions Area
(m²) Comment
Zone Easting Northing X Y
Six Mile
10U 474670 6163460 No 1 2 2 LDB on bend
10U 474655 6163485 No 3 2 6 LDB side channel after log jam
10U 474638 6163512 No 1.5 3 4.5 LDB side channel, tail out of pool.
10U 474604 6163521 No 2 1 2 Mid-stream after sandbar
10U 474557 6163656 No 2 4 8 Mid-stream left channel and LDB
10 U 474498 6163645 2 Rainbow
Trout
2 mature rainbow trout observed, no spawning habitat noted at location
10U 474493 6163756 No 1 3 3 RDB
10 U 474509 6163760 No 3 1 3 Spawning gravels under log
10U 474509 6163760 No 1 6 6 More gravels on other side of the creek.
10U 474464 6163889 No 1 2.5 2.5 LDB, small log jam
10 U 474441 6163971 No 2 5 10 Located mid-channel with large woody debris below.
10 U 474414 6164116 6 Whitefish Six whitefish observed in larger pool; limited suitable spawning habitat at the tail out of the pool
10U 474432 6163975 No 1 1 1 LDB
10 U 474430 6163996 No 8 5 40 Shallow but good substrates on left bank
10U 474488 6164174 No 2 3 6 Midstream to LDB
10 U 474467 6164213 No 2 5 10 Tail out with good vegetative cover
10 U 474421 6164256 No 1 7 7 Substrates in braided channel
Six Mile Total 111
Patsuk
10 U 474580 6163984 No 5 20 100 Above log jam in wide section of channel
10 U 474932 6164249 No 2 8 16 Above large log jam that has significant soft barriers and braids into multiple channels
10U 474974 6164283 No 32 3 96 Above beaver dam tail out from long deep run, LWD throughout
Patsuk Total 212
Lamonti
10 U 475330 6161949 No 2 1.5 3 Pool with spawning gravel
10 U 475451 6161979 No 4 2 8 Tail out of pool with spawning gravel
10 U 475872 6161853 No 1.12 1.28 1.61 Redd observed. Dimensions reflect those of redd.
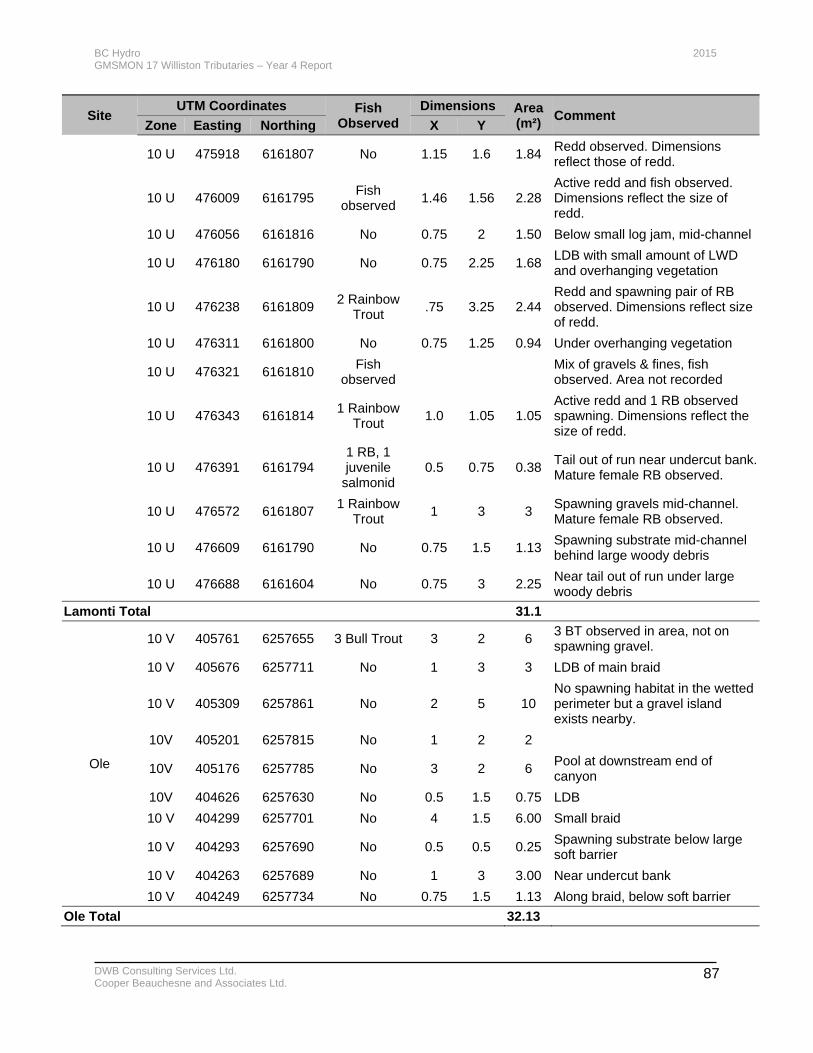
BC Hydro 2015 GMSMON 17 Williston Tributaries – Year 4 Report
DWB Consulting Services Ltd. Cooper Beauchesne and Associates Ltd.
87
Site UTM Coordinates Fish
Observed Dimensions Area
(m²) Comment
Zone Easting Northing X Y
10 U 475918 6161807 No 1.15 1.6 1.84 Redd observed. Dimensions reflect those of redd.
10 U 476009 6161795 Fish
observed 1.46 1.56 2.28
Active redd and fish observed. Dimensions reflect the size of redd.
10 U 476056 6161816 No 0.75 2 1.50 Below small log jam, mid-channel
10 U 476180 6161790 No 0.75 2.25 1.68 LDB with small amount of LWD and overhanging vegetation
10 U 476238 6161809 2 Rainbow
Trout .75 3.25 2.44
Redd and spawning pair of RB observed. Dimensions reflect size of redd.
10 U 476311 6161800 No 0.75 1.25 0.94 Under overhanging vegetation
10 U 476321 6161810 Fish
observed
Mix of gravels & fines, fish observed. Area not recorded
10 U 476343 6161814 1 Rainbow
Trout 1.0 1.05 1.05
Active redd and 1 RB observed spawning. Dimensions reflect the size of redd.
10 U 476391 6161794 1 RB, 1 juvenile
salmonid 0.5 0.75 0.38
Tail out of run near undercut bank. Mature female RB observed.
10 U 476572 6161807 1 Rainbow
Trout 1 3 3
Spawning gravels mid-channel. Mature female RB observed.
10 U 476609 6161790 No 0.75 1.5 1.13 Spawning substrate mid-channel behind large woody debris
10 U 476688 6161604 No 0.75 3 2.25 Near tail out of run under large woody debris
Lamonti Total 31.1
Ole
10 V 405761 6257655 3 Bull Trout 3 2 6 3 BT observed in area, not on spawning gravel.
10 V 405676 6257711 No 1 3 3 LDB of main braid
10 V 405309 6257861 No 2 5 10 No spawning habitat in the wetted perimeter but a gravel island exists nearby.
10V 405201 6257815 No 1 2 2
10V 405176 6257785 No 3 2 6 Pool at downstream end of canyon
10V 404626 6257630 No 0.5 1.5 0.75 LDB
10 V 404299 6257701 No 4 1.5 6.00 Small braid
10 V 404293 6257690 No 0.5 0.5 0.25 Spawning substrate below large soft barrier
10 V 404263 6257689 No 1 3 3.00 Near undercut bank
10 V 404249 6257734 No 0.75 1.5 1.13 Along braid, below soft barrier
Ole Total 32.13
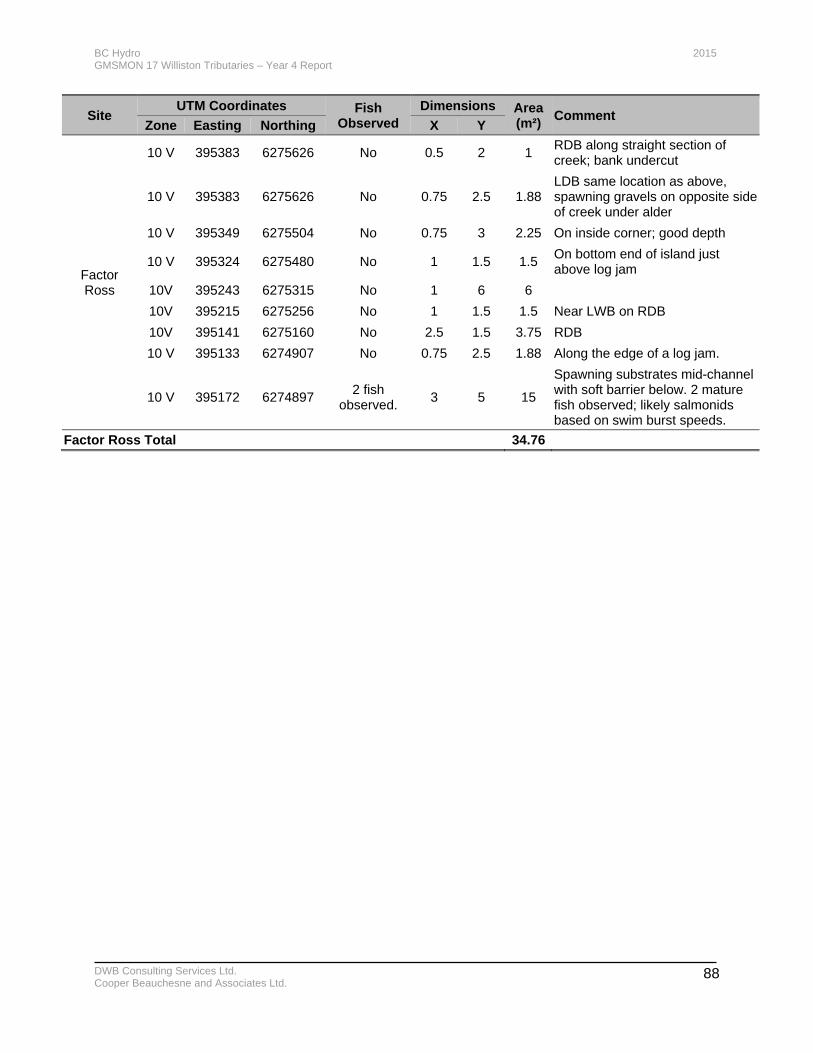
BC Hydro 2015 GMSMON 17 Williston Tributaries – Year 4 Report
DWB Consulting Services Ltd. Cooper Beauchesne and Associates Ltd.
88
Site UTM Coordinates Fish
Observed Dimensions Area
(m²) Comment
Zone Easting Northing X Y
Factor Ross
10 V 395383 6275626 No 0.5 2 1 RDB along straight section of creek; bank undercut
10 V 395383 6275626 No 0.75 2.5 1.88 LDB same location as above, spawning gravels on opposite side of creek under alder
10 V 395349 6275504 No 0.75 3 2.25 On inside corner; good depth
10 V 395324 6275480 No 1 1.5 1.5 On bottom end of island just above log jam
10V 395243 6275315 No 1 6 6
10V 395215 6275256 No 1 1.5 1.5 Near LWB on RDB
10V 395141 6275160 No 2.5 1.5 3.75 RDB
10 V 395133 6274907 No 0.75 2.5 1.88 Along the edge of a log jam.
10 V 395172 6274897 2 fish
observed. 3 5 15
Spawning substrates mid-channel with soft barrier below. 2 mature fish observed; likely salmonids based on swim burst speeds.
Factor Ross Total 34.76

BC Hydro 2015 GMSMON 17 Williston Tributaries – Year 4 Report
DWB Consulting Services Ltd. Cooper Beauchesne and Associates Ltd.
89
Appendix 6. Rainbow Trout spawning survey and juvenile fish survey location maps for Six Mile, Lamonti, Ole, and Factor Ross Creeks.
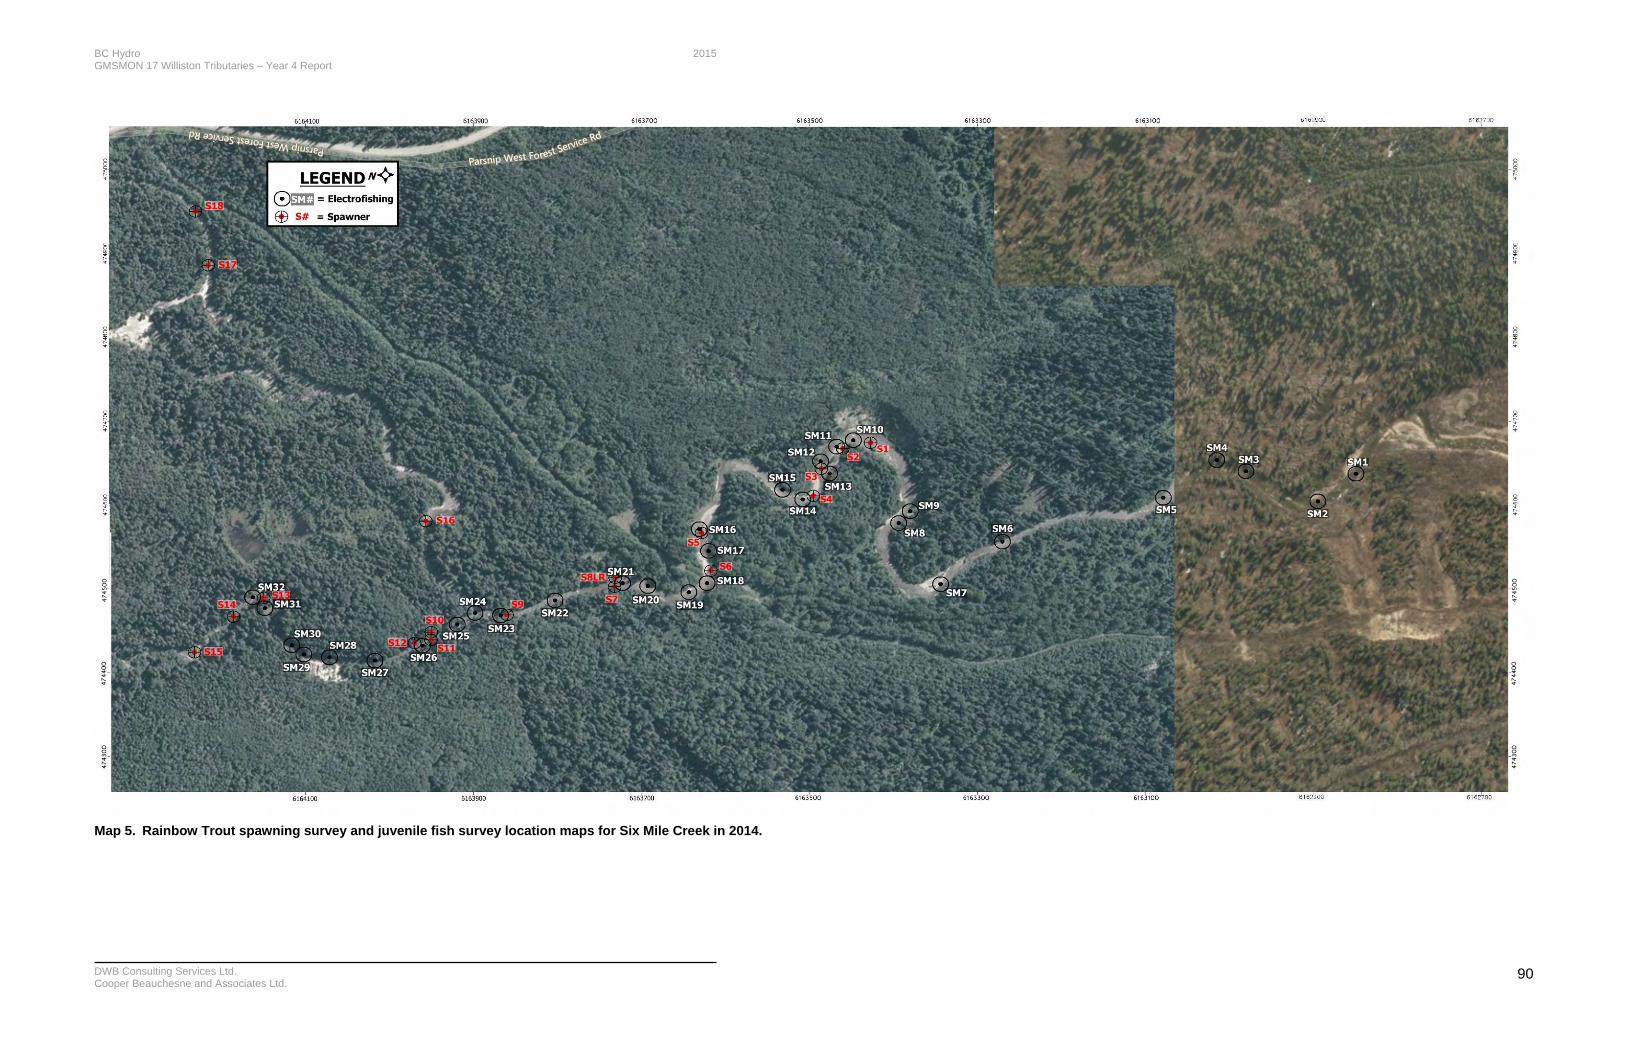
BC Hydro 2015 GMSMON 17 Williston Tributaries – Year 4 Report
DWB Consulting Services Ltd. Cooper Beauchesne and Associates Ltd.
90
Map 5. Rainbow Trout spawning survey and juvenile fish survey location maps for Six Mile Creek in 2014.
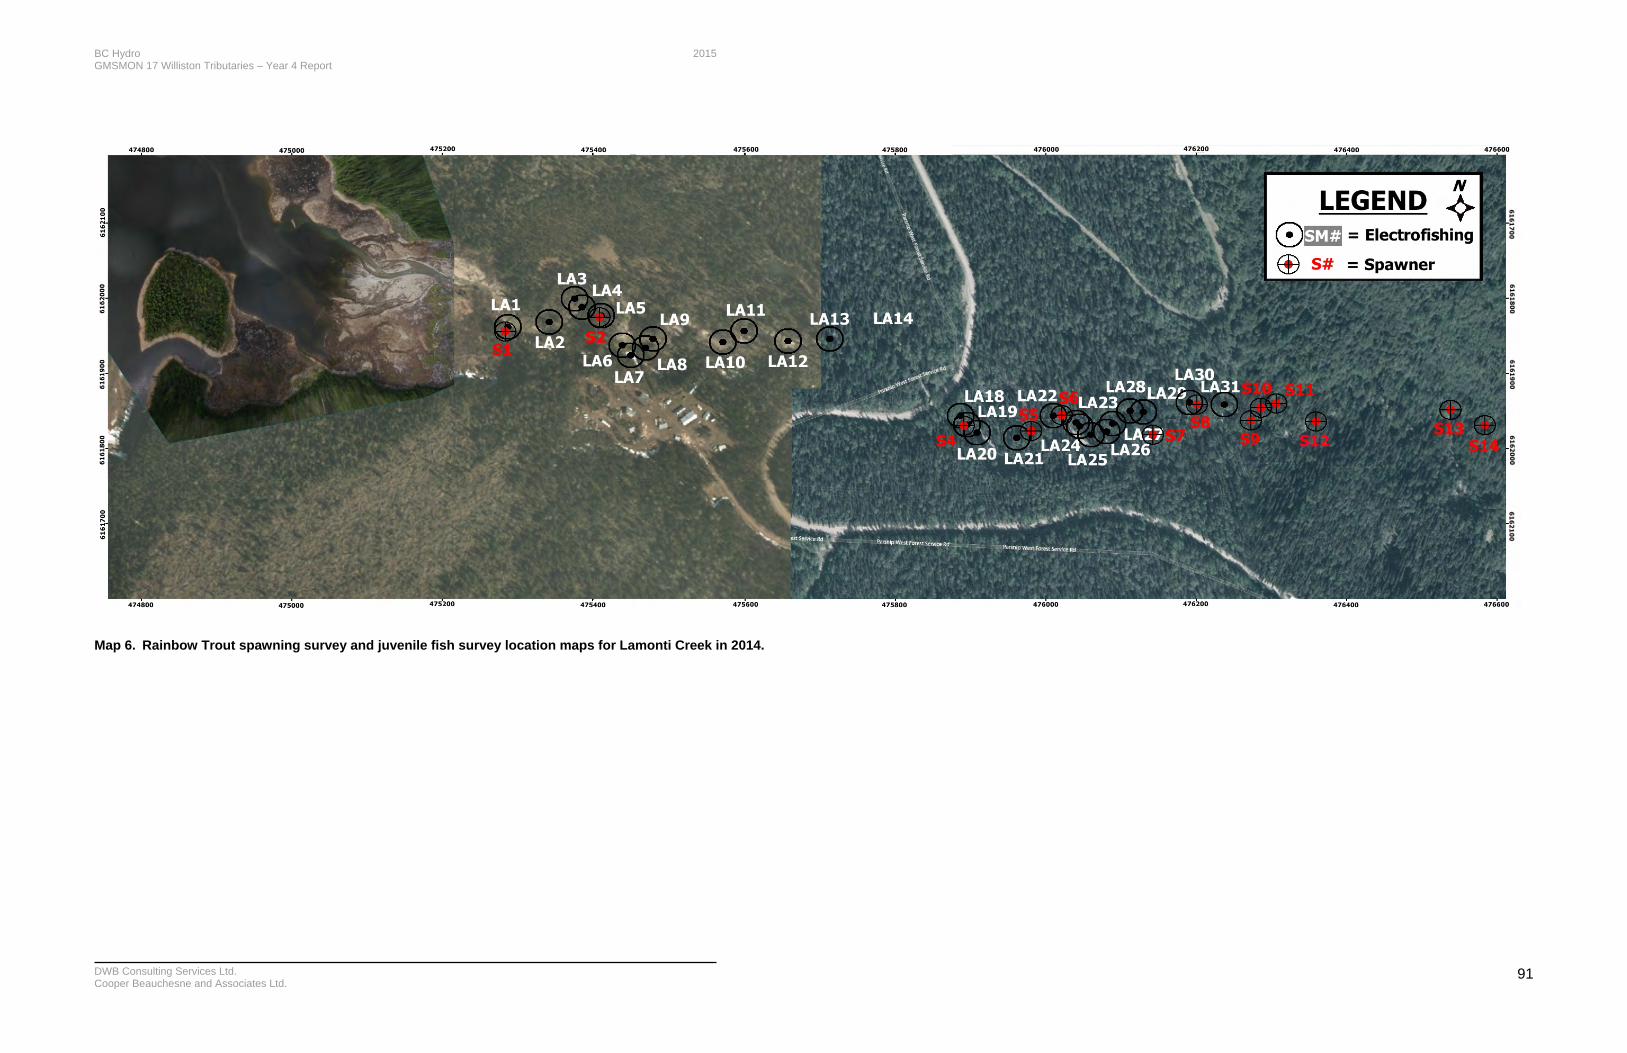
BC Hydro 2015 GMSMON 17 Williston Tributaries – Year 4 Report
DWB Consulting Services Ltd. Cooper Beauchesne and Associates Ltd.
91
Map 6. Rainbow Trout spawning survey and juvenile fish survey location maps for Lamonti Creek in 2014.
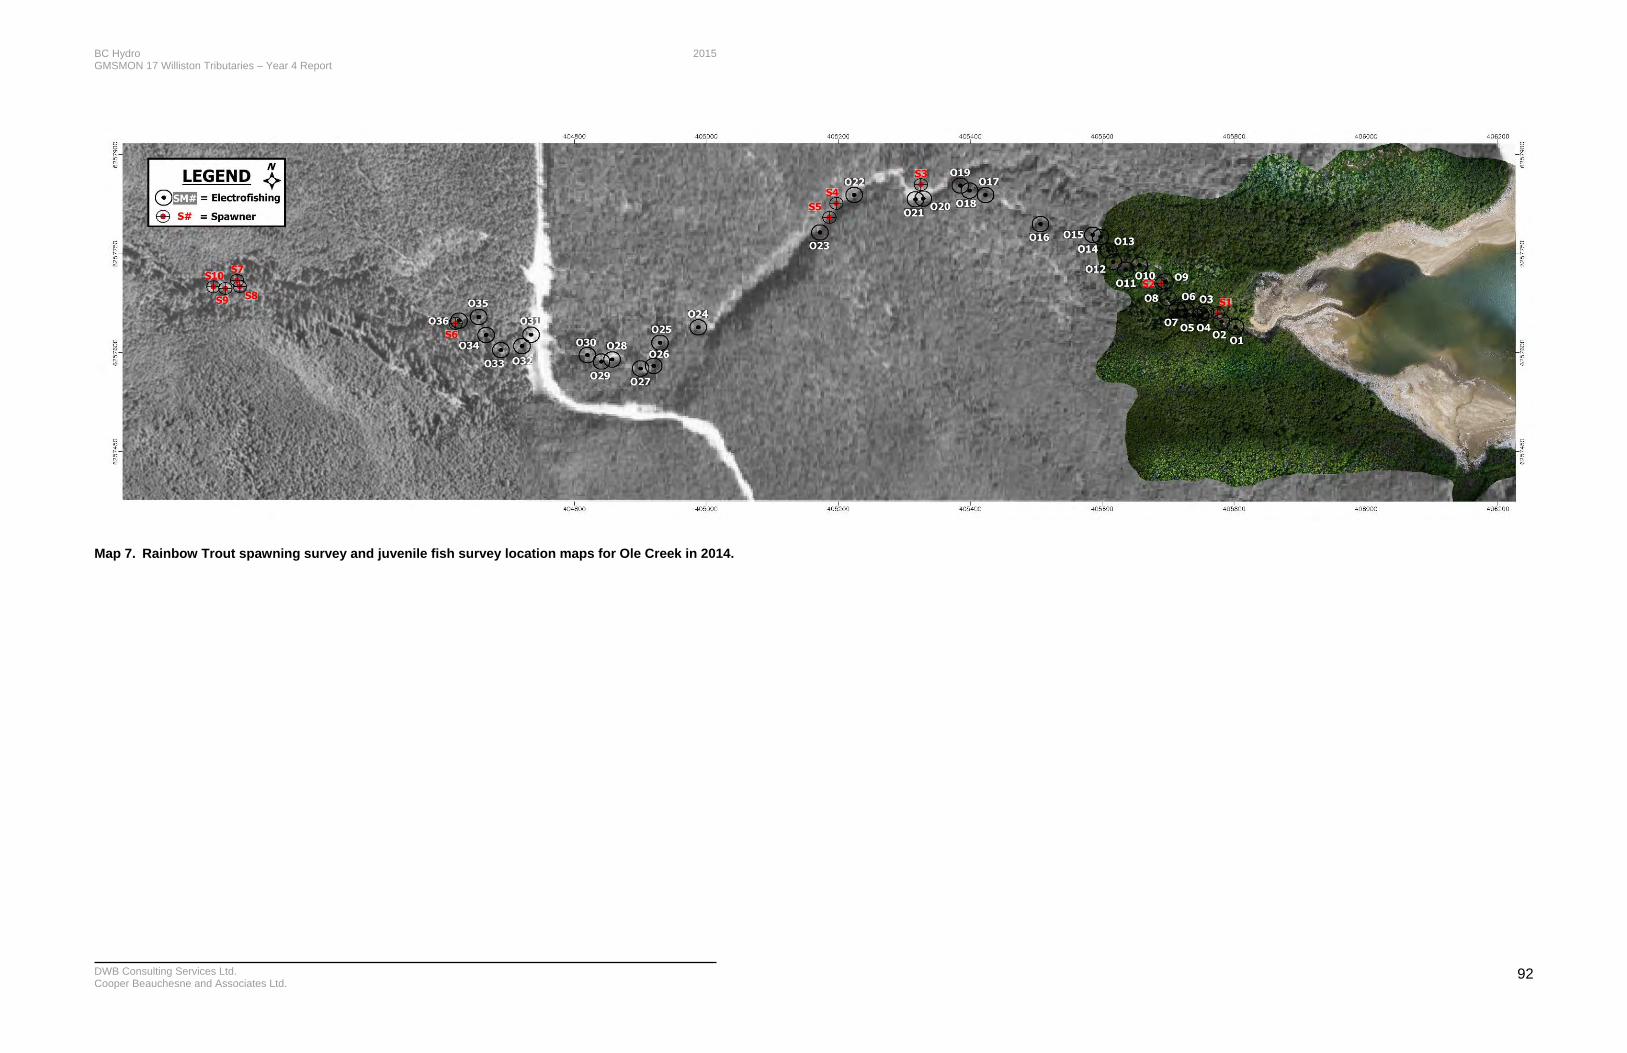
BC Hydro 2015 GMSMON 17 Williston Tributaries – Year 4 Report
DWB Consulting Services Ltd. Cooper Beauchesne and Associates Ltd.
92
Map 7. Rainbow Trout spawning survey and juvenile fish survey location maps for Ole Creek in 2014.
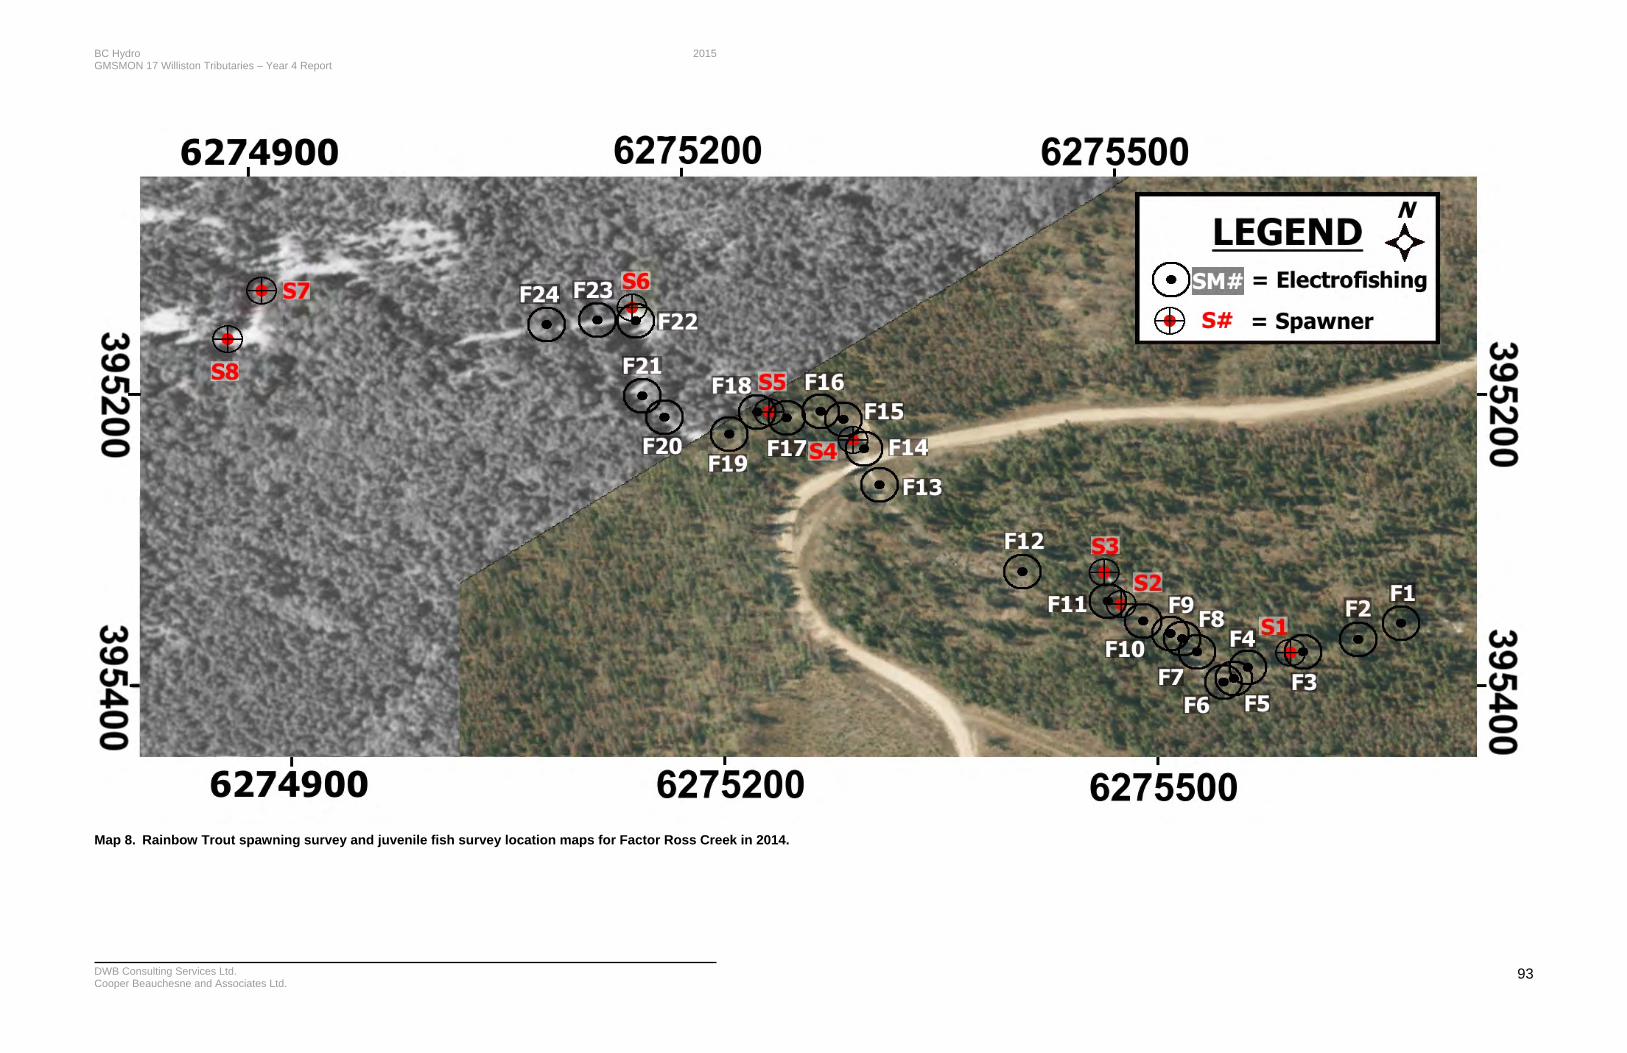
BC Hydro 2015 GMSMON 17 Williston Tributaries – Year 4 Report
DWB Consulting Services Ltd. Cooper Beauchesne and Associates Ltd.
93
Map 8. Rainbow Trout spawning survey and juvenile fish survey location maps for Factor Ross Creek in 2014.
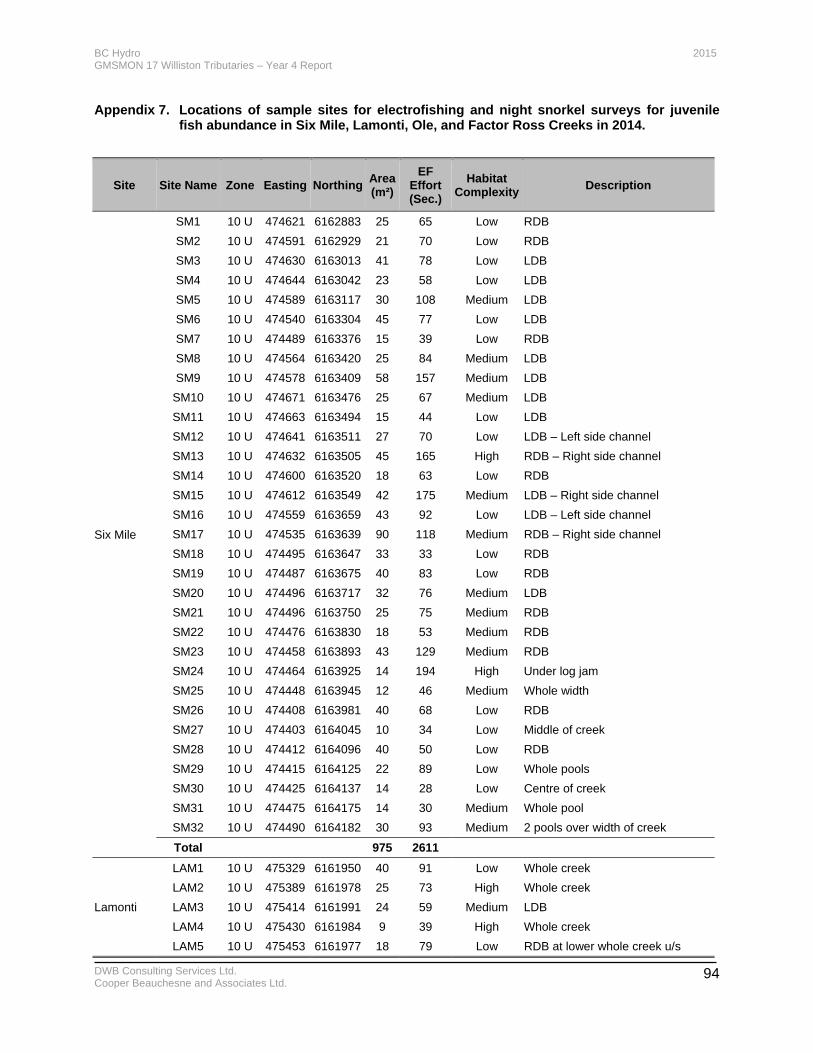
BC Hydro 2015 GMSMON 17 Williston Tributaries – Year 4 Report
DWB Consulting Services Ltd. Cooper Beauchesne and Associates Ltd.
94
Appendix 7. Locations of sample sites for electrofishing and night snorkel surveys for juvenile fish abundance in Six Mile, Lamonti, Ole, and Factor Ross Creeks in 2014.
Site Site Name Zone Easting NorthingArea (m²)
EF Effort (Sec.)
Habitat Complexity
Description
Six Mile
SM1 10 U 474621 6162883 25 65 Low RDB
SM2 10 U 474591 6162929 21 70 Low RDB
SM3 10 U 474630 6163013 41 78 Low LDB
SM4 10 U 474644 6163042 23 58 Low LDB
SM5 10 U 474589 6163117 30 108 Medium LDB
SM6 10 U 474540 6163304 45 77 Low LDB
SM7 10 U 474489 6163376 15 39 Low RDB
SM8 10 U 474564 6163420 25 84 Medium LDB
SM9 10 U 474578 6163409 58 157 Medium LDB
SM10 10 U 474671 6163476 25 67 Medium LDB
SM11 10 U 474663 6163494 15 44 Low LDB
SM12 10 U 474641 6163511 27 70 Low LDB – Left side channel
SM13 10 U 474632 6163505 45 165 High RDB – Right side channel
SM14 10 U 474600 6163520 18 63 Low RDB
SM15 10 U 474612 6163549 42 175 Medium LDB – Right side channel
SM16 10 U 474559 6163659 43 92 Low LDB – Left side channel
SM17 10 U 474535 6163639 90 118 Medium RDB – Right side channel
SM18 10 U 474495 6163647 33 33 Low RDB
SM19 10 U 474487 6163675 40 83 Low RDB
SM20 10 U 474496 6163717 32 76 Medium LDB
SM21 10 U 474496 6163750 25 75 Medium RDB
SM22 10 U 474476 6163830 18 53 Medium RDB
SM23 10 U 474458 6163893 43 129 Medium RDB
SM24 10 U 474464 6163925 14 194 High Under log jam
SM25 10 U 474448 6163945 12 46 Medium Whole width
SM26 10 U 474408 6163981 40 68 Low RDB
SM27 10 U 474403 6164045 10 34 Low Middle of creek
SM28 10 U 474412 6164096 40 50 Low RDB
SM29 10 U 474415 6164125 22 89 Low Whole pools
SM30 10 U 474425 6164137 14 28 Low Centre of creek
SM31 10 U 474475 6164175 14 30 Medium Whole pool
SM32 10 U 474490 6164182 30 93 Medium 2 pools over width of creek
Total 975 2611
Lamonti
LAM1 10 U 475329 6161950 40 91 Low Whole creek
LAM2 10 U 475389 6161978 25 73 High Whole creek
LAM3 10 U 475414 6161991 24 59 Medium LDB
LAM4 10 U 475430 6161984 9 39 High Whole creek
LAM5 10 U 475453 6161977 18 79 Low RDB at lower whole creek u/s
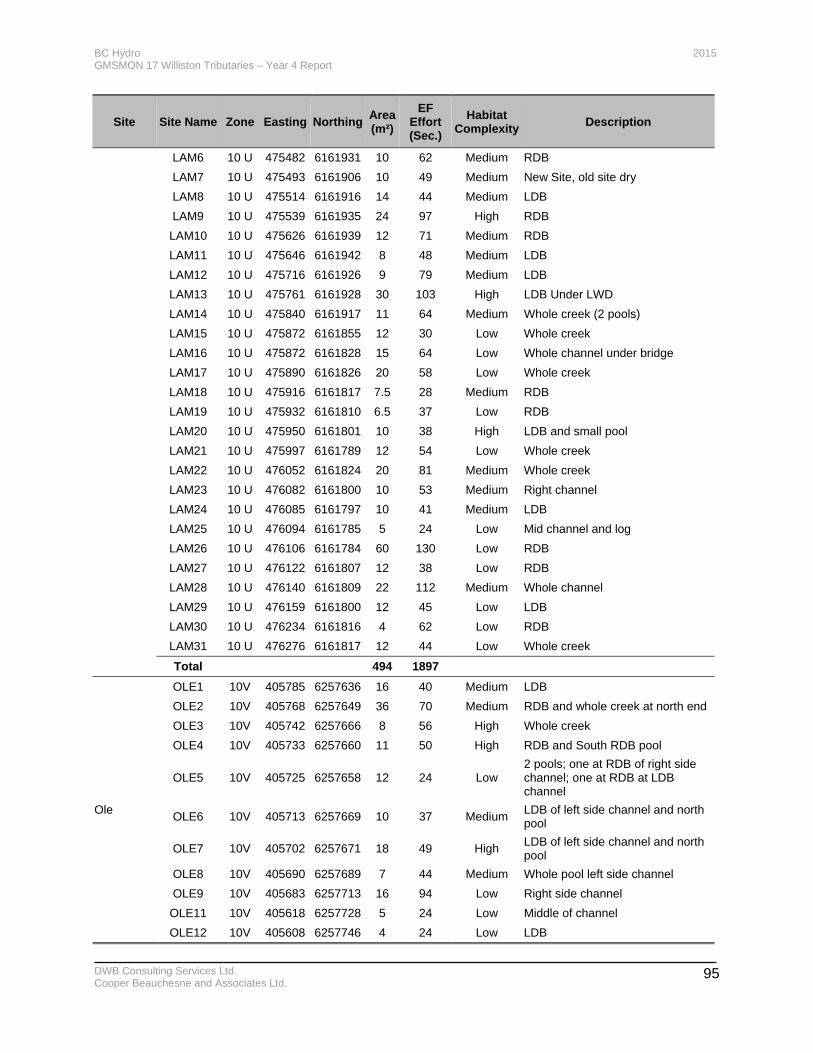
BC Hydro 2015 GMSMON 17 Williston Tributaries – Year 4 Report
DWB Consulting Services Ltd. Cooper Beauchesne and Associates Ltd.
95
Site Site Name Zone Easting NorthingArea (m²)
EF Effort (Sec.)
Habitat Complexity
Description
LAM6 10 U 475482 6161931 10 62 Medium RDB
LAM7 10 U 475493 6161906 10 49 Medium New Site, old site dry
LAM8 10 U 475514 6161916 14 44 Medium LDB
LAM9 10 U 475539 6161935 24 97 High RDB
LAM10 10 U 475626 6161939 12 71 Medium RDB
LAM11 10 U 475646 6161942 8 48 Medium LDB
LAM12 10 U 475716 6161926 9 79 Medium LDB
LAM13 10 U 475761 6161928 30 103 High LDB Under LWD
LAM14 10 U 475840 6161917 11 64 Medium Whole creek (2 pools)
LAM15 10 U 475872 6161855 12 30 Low Whole creek
LAM16 10 U 475872 6161828 15 64 Low Whole channel under bridge
LAM17 10 U 475890 6161826 20 58 Low Whole creek
LAM18 10 U 475916 6161817 7.5 28 Medium RDB
LAM19 10 U 475932 6161810 6.5 37 Low RDB
LAM20 10 U 475950 6161801 10 38 High LDB and small pool
LAM21 10 U 475997 6161789 12 54 Low Whole creek
LAM22 10 U 476052 6161824 20 81 Medium Whole creek
LAM23 10 U 476082 6161800 10 53 Medium Right channel
LAM24 10 U 476085 6161797 10 41 Medium LDB
LAM25 10 U 476094 6161785 5 24 Low Mid channel and log
LAM26 10 U 476106 6161784 60 130 Low RDB
LAM27 10 U 476122 6161807 12 38 Low RDB
LAM28 10 U 476140 6161809 22 112 Medium Whole channel
LAM29 10 U 476159 6161800 12 45 Low LDB
LAM30 10 U 476234 6161816 4 62 Low RDB
LAM31 10 U 476276 6161817 12 44 Low Whole creek
Total 494 1897
Ole
OLE1 10V 405785 6257636 16 40 Medium LDB
OLE2 10V 405768 6257649 36 70 Medium RDB and whole creek at north end
OLE3 10V 405742 6257666 8 56 High Whole creek
OLE4 10V 405733 6257660 11 50 High RDB and South RDB pool
OLE5 10V 405725 6257658 12 24 Low 2 pools; one at RDB of right side channel; one at RDB at LDB channel
OLE6 10V 405713 6257669 10 37 Medium LDB of left side channel and north pool
OLE7 10V 405702 6257671 18 49 High LDB of left side channel and north pool
OLE8 10V 405690 6257689 7 44 Medium Whole pool left side channel
OLE9 10V 405683 6257713 16 94 Low Right side channel
OLE11 10V 405618 6257728 5 24 Low Middle of channel
OLE12 10V 405608 6257746 4 24 Low LDB
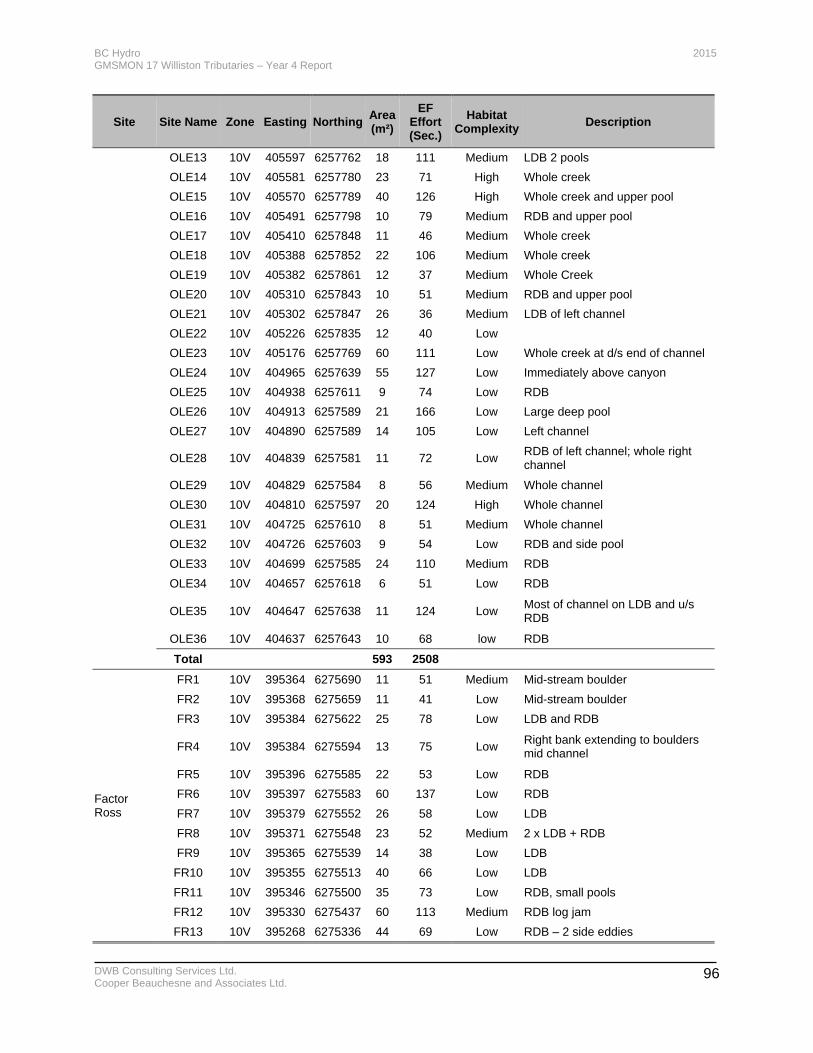
BC Hydro 2015 GMSMON 17 Williston Tributaries – Year 4 Report
DWB Consulting Services Ltd. Cooper Beauchesne and Associates Ltd.
96
Site Site Name Zone Easting NorthingArea (m²)
EF Effort (Sec.)
Habitat Complexity
Description
OLE13 10V 405597 6257762 18 111 Medium LDB 2 pools
OLE14 10V 405581 6257780 23 71 High Whole creek
OLE15 10V 405570 6257789 40 126 High Whole creek and upper pool
OLE16 10V 405491 6257798 10 79 Medium RDB and upper pool
OLE17 10V 405410 6257848 11 46 Medium Whole creek
OLE18 10V 405388 6257852 22 106 Medium Whole creek
OLE19 10V 405382 6257861 12 37 Medium Whole Creek
OLE20 10V 405310 6257843 10 51 Medium RDB and upper pool
OLE21 10V 405302 6257847 26 36 Medium LDB of left channel
OLE22 10V 405226 6257835 12 40 Low
OLE23 10V 405176 6257769 60 111 Low Whole creek at d/s end of channel
OLE24 10V 404965 6257639 55 127 Low Immediately above canyon
OLE25 10V 404938 6257611 9 74 Low RDB
OLE26 10V 404913 6257589 21 166 Low Large deep pool
OLE27 10V 404890 6257589 14 105 Low Left channel
OLE28 10V 404839 6257581 11 72 Low RDB of left channel; whole right channel
OLE29 10V 404829 6257584 8 56 Medium Whole channel
OLE30 10V 404810 6257597 20 124 High Whole channel
OLE31 10V 404725 6257610 8 51 Medium Whole channel
OLE32 10V 404726 6257603 9 54 Low RDB and side pool
OLE33 10V 404699 6257585 24 110 Medium RDB
OLE34 10V 404657 6257618 6 51 Low RDB
OLE35 10V 404647 6257638 11 124 Low Most of channel on LDB and u/s RDB
OLE36 10V 404637 6257643 10 68 low RDB
Total 593 2508
Factor Ross
FR1 10V 395364 6275690 11 51 Medium Mid-stream boulder
FR2 10V 395368 6275659 11 41 Low Mid-stream boulder
FR3 10V 395384 6275622 25 78 Low LDB and RDB
FR4 10V 395384 6275594 13 75 Low Right bank extending to boulders mid channel
FR5 10V 395396 6275585 22 53 Low RDB
FR6 10V 395397 6275583 60 137 Low RDB
FR7 10V 395379 6275552 26 58 Low LDB
FR8 10V 395371 6275548 23 52 Medium 2 x LDB + RDB
FR9 10V 395365 6275539 14 38 Low LDB
FR10 10V 395355 6275513 40 66 Low LDB
FR11 10V 395346 6275500 35 73 Low RDB, small pools
FR12 10V 395330 6275437 60 113 Medium RDB log jam
FR13 10V 395268 6275336 44 69 Low RDB – 2 side eddies
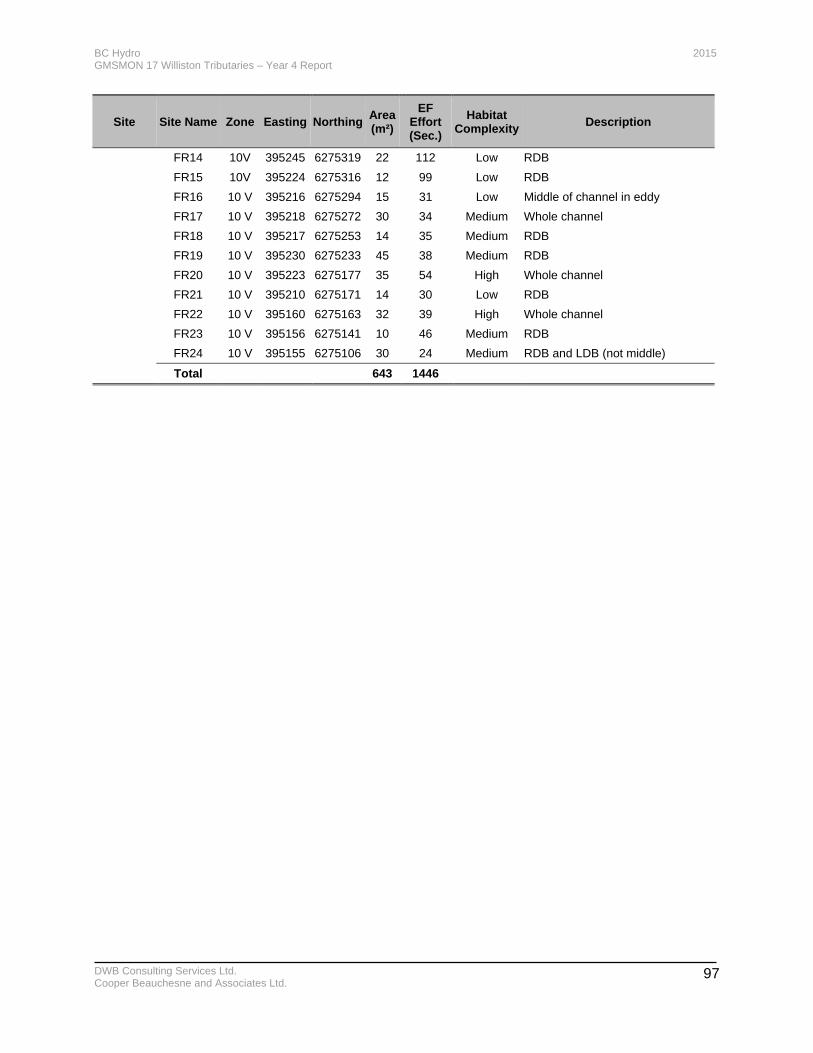
BC Hydro 2015 GMSMON 17 Williston Tributaries – Year 4 Report
DWB Consulting Services Ltd. Cooper Beauchesne and Associates Ltd.
97
Site Site Name Zone Easting NorthingArea (m²)
EF Effort (Sec.)
Habitat Complexity
Description
FR14 10V 395245 6275319 22 112 Low RDB
FR15 10V 395224 6275316 12 99 Low RDB
FR16 10 V 395216 6275294 15 31 Low Middle of channel in eddy
FR17 10 V 395218 6275272 30 34 Medium Whole channel
FR18 10 V 395217 6275253 14 35 Medium RDB
FR19 10 V 395230 6275233 45 38 Medium RDB
FR20 10 V 395223 6275177 35 54 High Whole channel
FR21 10 V 395210 6275171 14 30 Low RDB
FR22 10 V 395160 6275163 32 39 High Whole channel
FR23 10 V 395156 6275141 10 46 Medium RDB
FR24 10 V 395155 6275106 30 24 Medium RDB and LDB (not middle)
Total 643 1446
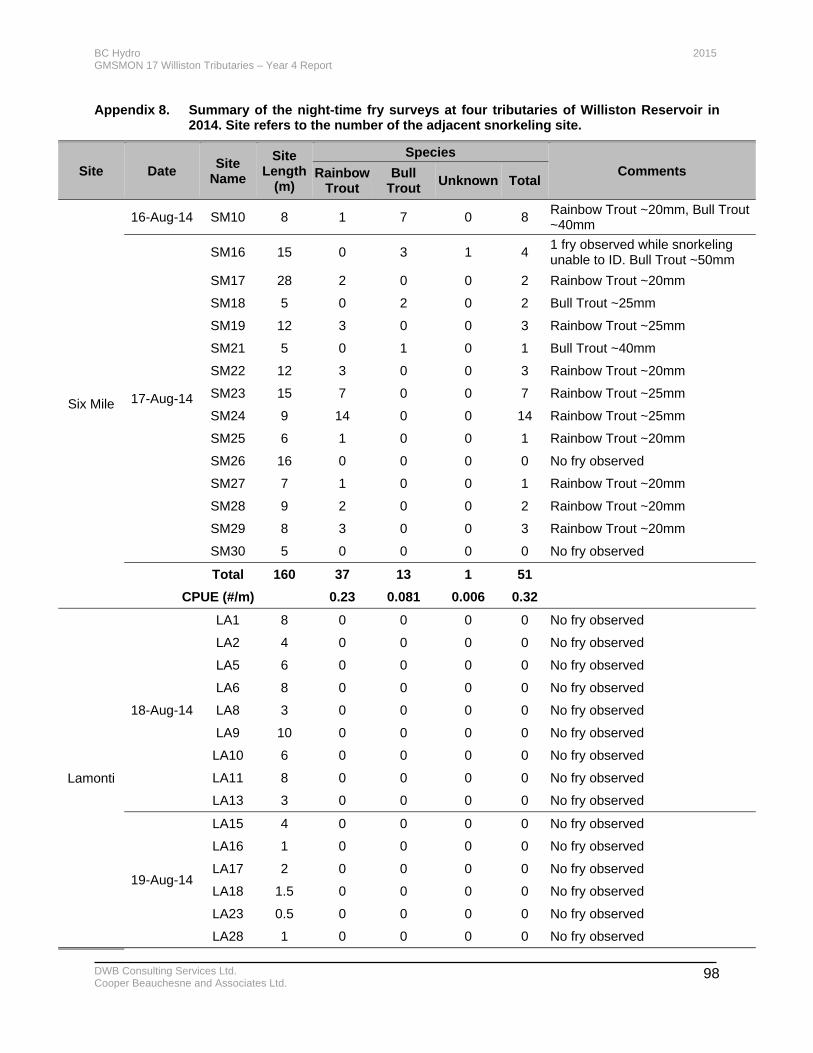
BC Hydro 2015 GMSMON 17 Williston Tributaries – Year 4 Report
DWB Consulting Services Ltd. Cooper Beauchesne and Associates Ltd.
98
Appendix 8. Summary of the night-time fry surveys at four tributaries of Williston Reservoir in 2014. Site refers to the number of the adjacent snorkeling site.
Site Date Site
Name
Site Length
(m)
Species
Comments Rainbow Trout
Bull Trout
Unknown Total
Six Mile
16-Aug-14 SM10 8 1 7 0 8 Rainbow Trout ~20mm, Bull Trout ~40mm
17-Aug-14
SM16 15 0 3 1 4 1 fry observed while snorkeling unable to ID. Bull Trout ~50mm
SM17 28 2 0 0 2 Rainbow Trout ~20mm
SM18 5 0 2 0 2 Bull Trout ~25mm
SM19 12 3 0 0 3 Rainbow Trout ~25mm
SM21 5 0 1 0 1 Bull Trout ~40mm
SM22 12 3 0 0 3 Rainbow Trout ~20mm
SM23 15 7 0 0 7 Rainbow Trout ~25mm
SM24 9 14 0 0 14 Rainbow Trout ~25mm
SM25 6 1 0 0 1 Rainbow Trout ~20mm
SM26 16 0 0 0 0 No fry observed
SM27 7 1 0 0 1 Rainbow Trout ~20mm
SM28 9 2 0 0 2 Rainbow Trout ~20mm
SM29 8 3 0 0 3 Rainbow Trout ~20mm
SM30 5 0 0 0 0 No fry observed
Total 160 37 13 1 51
CPUE (#/m) 0.23 0.081 0.006 0.32
Lamonti
18-Aug-14
LA1 8 0 0 0 0 No fry observed
LA2 4 0 0 0 0 No fry observed
LA5 6 0 0 0 0 No fry observed
LA6 8 0 0 0 0 No fry observed
LA8 3 0 0 0 0 No fry observed
LA9 10 0 0 0 0 No fry observed
LA10 6 0 0 0 0 No fry observed
LA11 8 0 0 0 0 No fry observed
LA13 3 0 0 0 0 No fry observed
19-Aug-14
LA15 4 0 0 0 0 No fry observed
LA16 1 0 0 0 0 No fry observed
LA17 2 0 0 0 0 No fry observed
LA18 1.5 0 0 0 0 No fry observed
LA23 0.5 0 0 0 0 No fry observed
LA28 1 0 0 0 0 No fry observed
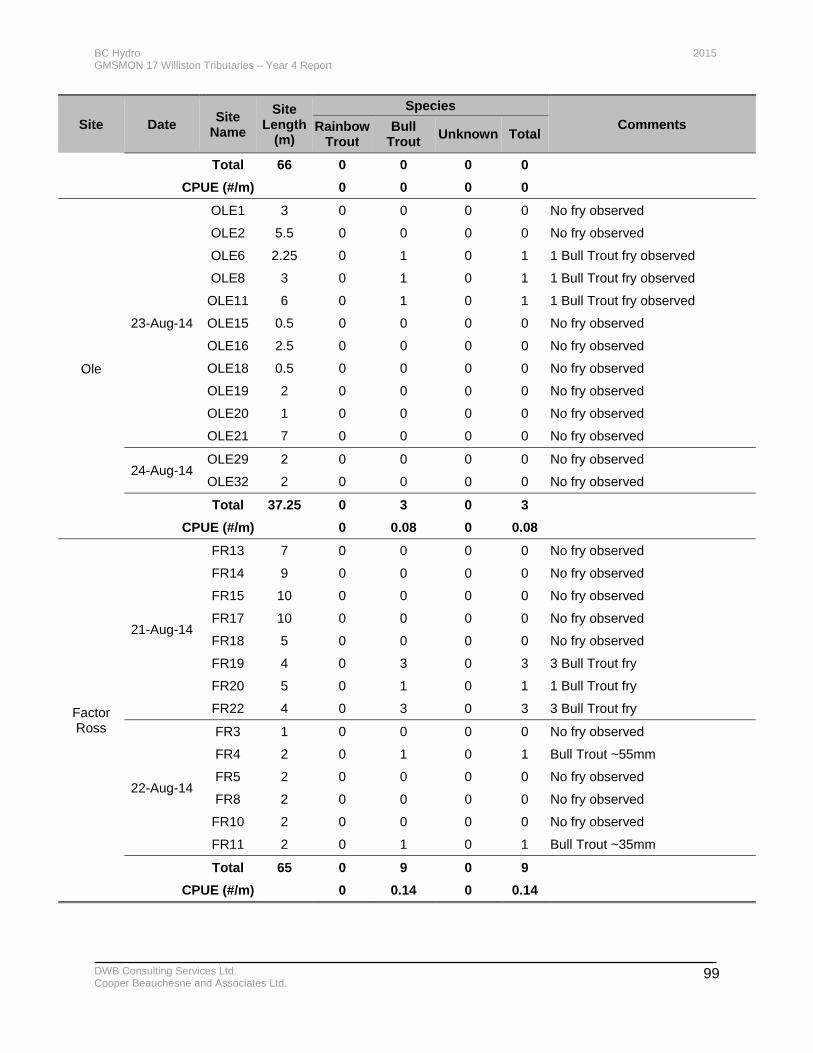
BC Hydro 2015 GMSMON 17 Williston Tributaries – Year 4 Report
DWB Consulting Services Ltd. Cooper Beauchesne and Associates Ltd.
99
Site Date Site
Name
Site Length
(m)
Species
Comments Rainbow Trout
Bull Trout
Unknown Total
Total 66 0 0 0 0
CPUE (#/m) 0 0 0 0
Ole
23-Aug-14
OLE1 3 0 0 0 0 No fry observed
OLE2 5.5 0 0 0 0 No fry observed
OLE6 2.25 0 1 0 1 1 Bull Trout fry observed
OLE8 3 0 1 0 1 1 Bull Trout fry observed
OLE11 6 0 1 0 1 1 Bull Trout fry observed
OLE15 0.5 0 0 0 0 No fry observed
OLE16 2.5 0 0 0 0 No fry observed
OLE18 0.5 0 0 0 0 No fry observed
OLE19 2 0 0 0 0 No fry observed
OLE20 1 0 0 0 0 No fry observed
OLE21 7 0 0 0 0 No fry observed
24-Aug-14 OLE29 2 0 0 0 0 No fry observed
OLE32 2 0 0 0 0 No fry observed
Total 37.25 0 3 0 3
CPUE (#/m) 0 0.08 0 0.08
Factor Ross
21-Aug-14
FR13 7 0 0 0 0 No fry observed
FR14 9 0 0 0 0 No fry observed
FR15 10 0 0 0 0 No fry observed
FR17 10 0 0 0 0 No fry observed
FR18 5 0 0 0 0 No fry observed
FR19 4 0 3 0 3 3 Bull Trout fry
FR20 5 0 1 0 1 1 Bull Trout fry
FR22 4 0 3 0 3 3 Bull Trout fry
22-Aug-14
FR3 1 0 0 0 0 No fry observed
FR4 2 0 1 0 1 Bull Trout ~55mm
FR5 2 0 0 0 0 No fry observed
FR8 2 0 0 0 0 No fry observed
FR10 2 0 0 0 0 No fry observed
FR11 2 0 1 0 1 Bull Trout ~35mm
Total 65 0 9 0 9
CPUE (#/m) 0 0.14 0 0.14
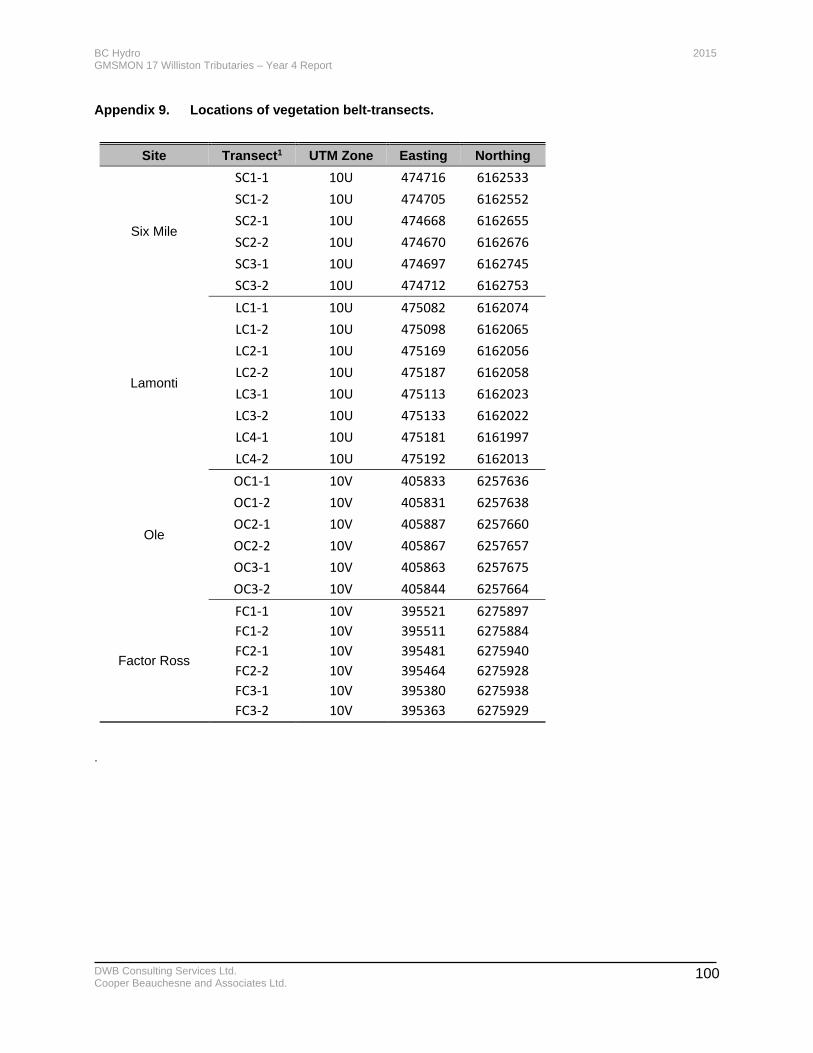
BC Hydro 2015 GMSMON 17 Williston Tributaries – Year 4 Report
DWB Consulting Services Ltd. Cooper Beauchesne and Associates Ltd.
100
Appendix 9. Locations of vegetation belt-transects.
Site Transect1 UTM Zone Easting Northing
Six Mile
SC1‐1 10U 474716 6162533
SC1‐2 10U 474705 6162552
SC2‐1 10U 474668 6162655
SC2‐2 10U 474670 6162676
SC3‐1 10U 474697 6162745
SC3‐2 10U 474712 6162753
Lamonti
LC1‐1 10U 475082 6162074
LC1‐2 10U 475098 6162065
LC2‐1 10U 475169 6162056
LC2‐2 10U 475187 6162058
LC3‐1 10U 475113 6162023
LC3‐2 10U 475133 6162022
LC4‐1 10U 475181 6161997
LC4‐2 10U 475192 6162013
Ole
OC1‐1 10V 405833 6257636
OC1‐2 10V 405831 6257638
OC2‐1 10V 405887 6257660
OC2‐2 10V 405867 6257657
OC3‐1 10V 405863 6257675
OC3‐2 10V 405844 6257664
Factor Ross
FC1‐1 10V 395521 6275897
FC1‐2 10V 395511 6275884
FC2‐1 10V 395481 6275940
FC2‐2 10V 395464 6275928
FC3‐1 10V 395380 6275938
FC3‐2 10V 395363 6275929
.
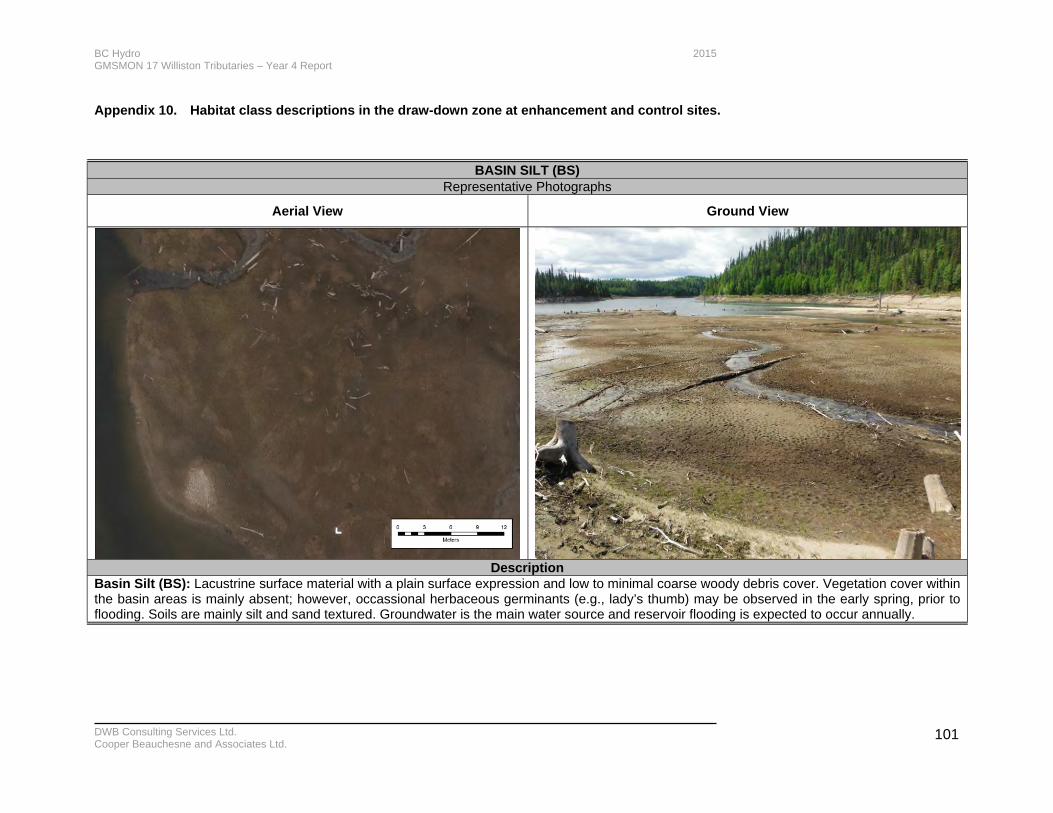
BC Hydro 2015 GMSMON 17 Williston Tributaries – Year 4 Report
DWB Consulting Services Ltd. Cooper Beauchesne and Associates Ltd.
101
Appendix 10. Habitat class descriptions in the draw-down zone at enhancement and control sites.
BASIN SILT (BS) Representative Photographs
Aerial View Ground View
Description Basin Silt (BS): Lacustrine surface material with a plain surface expression and low to minimal coarse woody debris cover. Vegetation cover within the basin areas is mainly absent; however, occassional herbaceous germinants (e.g., lady’s thumb) may be observed in the early spring, prior to flooding. Soils are mainly silt and sand textured. Groundwater is the main water source and reservoir flooding is expected to occur annually.
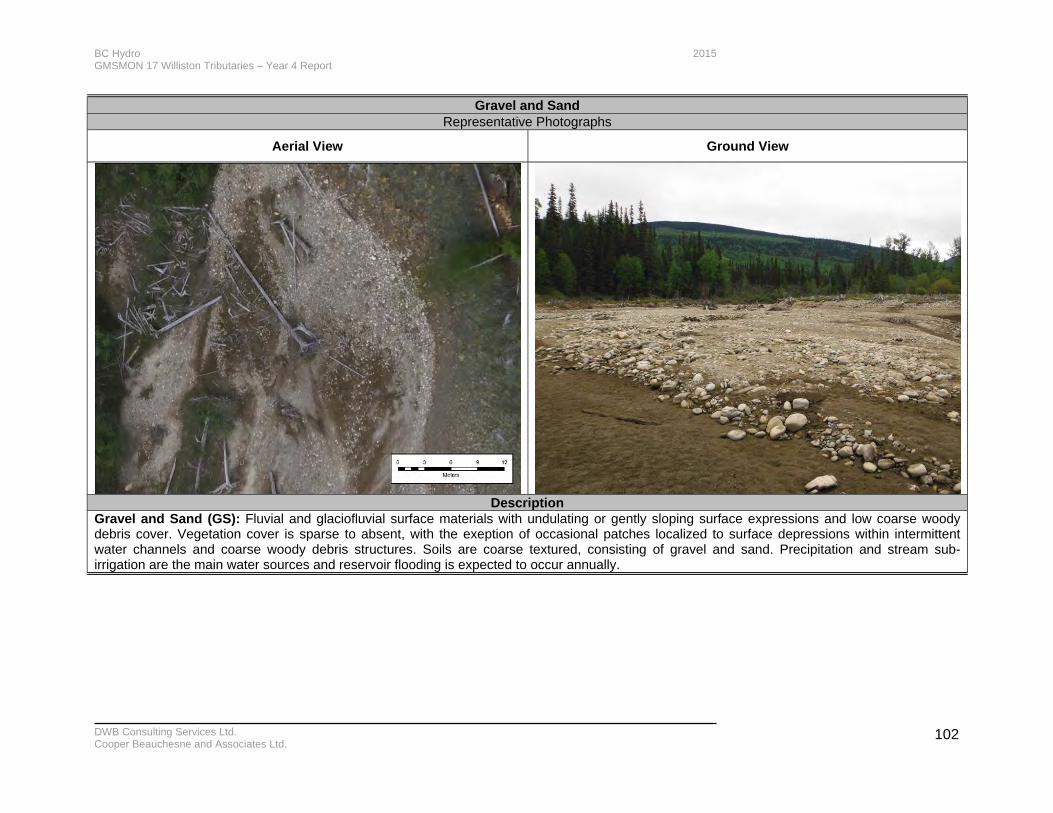
BC Hydro 2015 GMSMON 17 Williston Tributaries – Year 4 Report
DWB Consulting Services Ltd. Cooper Beauchesne and Associates Ltd.
102
Gravel and Sand Representative Photographs
Aerial View Ground View
Description Gravel and Sand (GS): Fluvial and glaciofluvial surface materials with undulating or gently sloping surface expressions and low coarse woody debris cover. Vegetation cover is sparse to absent, with the exeption of occasional patches localized to surface depressions within intermittent water channels and coarse woody debris structures. Soils are coarse textured, consisting of gravel and sand. Precipitation and stream sub-irrigation are the main water sources and reservoir flooding is expected to occur annually.
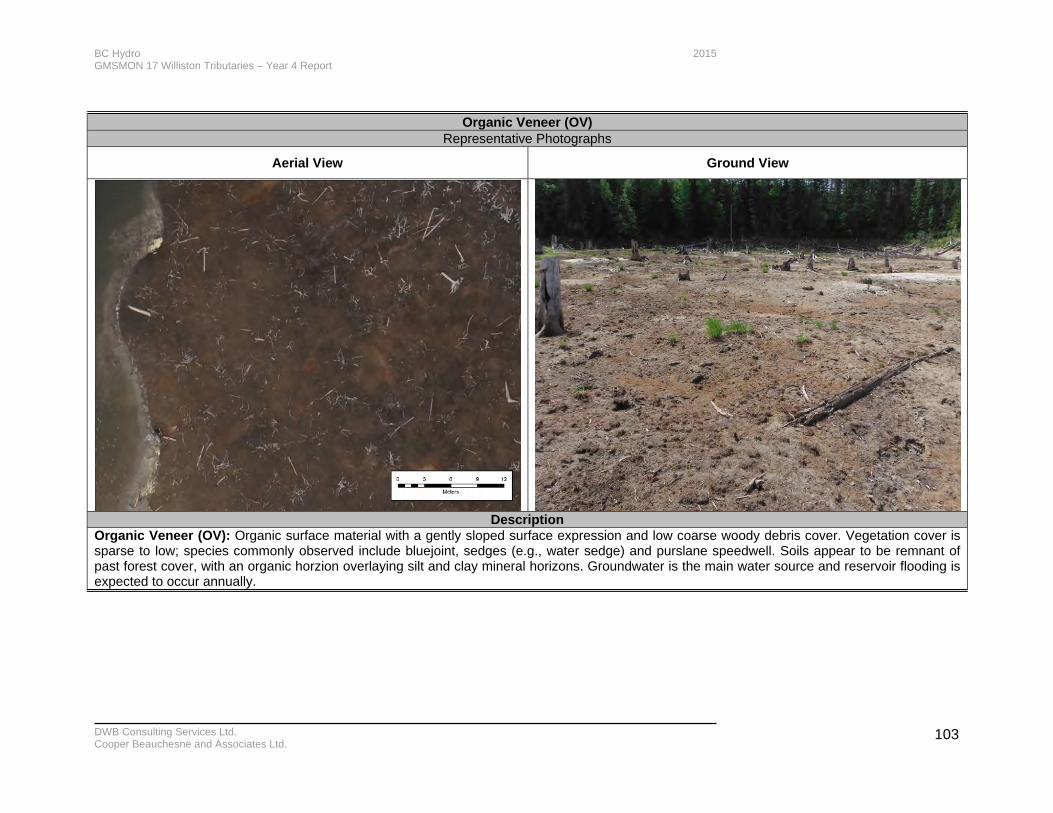
BC Hydro 2015 GMSMON 17 Williston Tributaries – Year 4 Report
DWB Consulting Services Ltd. Cooper Beauchesne and Associates Ltd.
103
Organic Veneer (OV)
Representative Photographs
Aerial View Ground View
Description Organic Veneer (OV): Organic surface material with a gently sloped surface expression and low coarse woody debris cover. Vegetation cover is sparse to low; species commonly observed include bluejoint, sedges (e.g., water sedge) and purslane speedwell. Soils appear to be remnant of past forest cover, with an organic horzion overlaying silt and clay mineral horizons. Groundwater is the main water source and reservoir flooding is expected to occur annually.
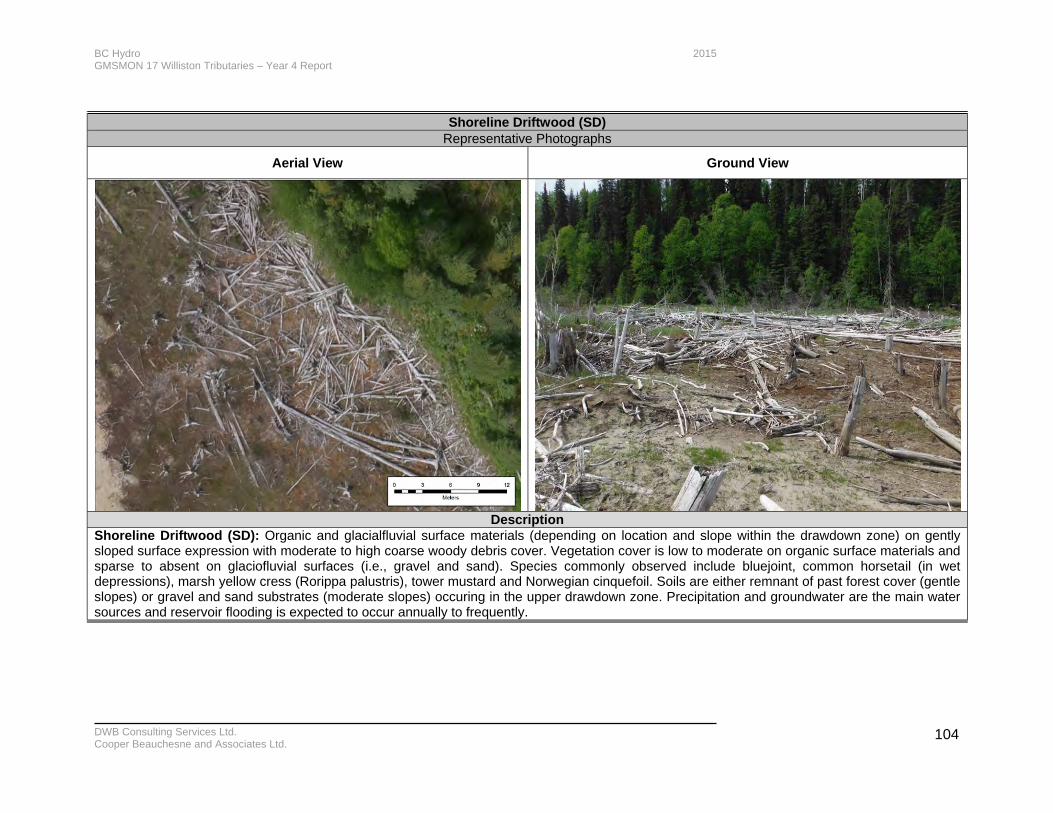
BC Hydro 2015 GMSMON 17 Williston Tributaries – Year 4 Report
DWB Consulting Services Ltd. Cooper Beauchesne and Associates Ltd.
104
Shoreline Driftwood (SD)
Representative Photographs
Aerial View Ground View
Description Shoreline Driftwood (SD): Organic and glacialfluvial surface materials (depending on location and slope within the drawdown zone) on gently sloped surface expression with moderate to high coarse woody debris cover. Vegetation cover is low to moderate on organic surface materials and sparse to absent on glaciofluvial surfaces (i.e., gravel and sand). Species commonly observed include bluejoint, common horsetail (in wet depressions), marsh yellow cress (Rorippa palustris), tower mustard and Norwegian cinquefoil. Soils are either remnant of past forest cover (gentle slopes) or gravel and sand substrates (moderate slopes) occuring in the upper drawdown zone. Precipitation and groundwater are the main water sources and reservoir flooding is expected to occur annually to frequently.

BC Hydro 2015 GMSMON 17 Williston Tributaries – Year 4 Report
DWB Consulting Services Ltd. Cooper Beauchesne and Associates Ltd.
105
Shoreline Forest (SF):
Representative Photographs
Aerial View Ground View
Description Shoreline Forest (SF): Undisturbed forest cover above the upper limits of the drawdown zone. Forest cover at the study sites is representative of the Williston variant for the moist cool subzone of the Sub-boreal Spruce Biogeoclimatic zone (SBSmk2). At Six Mile, Lamonti and Factor Ross Creek study sites, the tree cover along the shoreline is primarily coniferous; dominant tree species include lodgepole pine (Pinus contorta var. latifolia), subalpine fir (Abies lasiocarpa) and hybrid white spruce (Picea glauca x engelmannii), with Black Spruce (Picea mariana) occurring on wet sites. At Ole Creek, tree cover along the shoreline is primarily deciduous and diverse (shown in representative photographs above); species include trembling aspen (Populus tremuloides), black cottonwood (Populus balsamifera ssp. trichocarpa), paper birch (Betula papryifera), hybrid spruce, subalpine fir and lodgepole pine; large willow (Salix spp.) and Sitka alder (Alnus viridis ssp. sinuata) also occur within the tree canopy. Groundwater and precipitation are the main water sources and reservoir flooding is not expected to occur.

BC Hydro 2015 GMSMON 17 Williston Tributaries – Year 4 Report
DWB Consulting Services Ltd. Cooper Beauchesne and Associates Ltd.
106
Shoreline Willow (SW)
Representative Photographs
Aerial View Ground View
Description Shoreline Willow (SW): Organic surface materials on plain to gently sloping surface expressions with low to moderate coarse woody debris cover. Vegetation cover is moderate to high and consists of willow domianted shrub cover and a grass dominated (i.e., bluejoint) herbaceous cover. Reservoir flooding is expected to be frequent to rare.
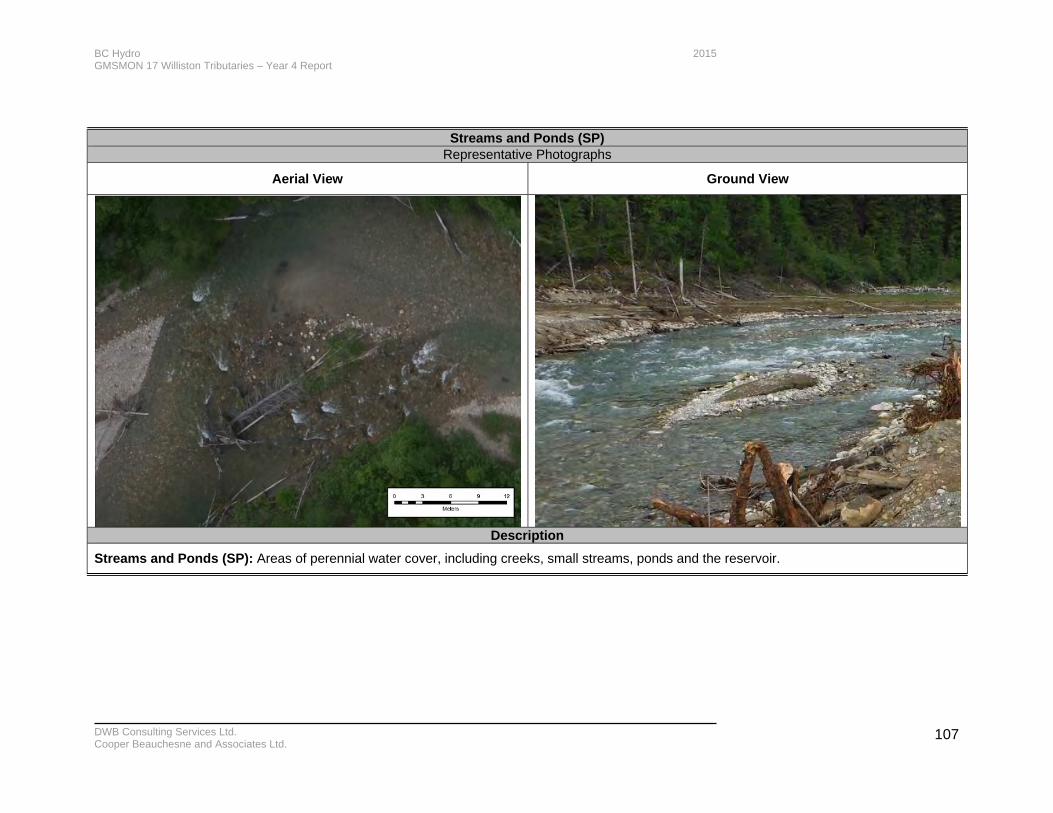
BC Hydro 2015 GMSMON 17 Williston Tributaries – Year 4 Report
DWB Consulting Services Ltd. Cooper Beauchesne and Associates Ltd.
107
Streams and Ponds (SP) Representative Photographs
Aerial View Ground View
Description
Streams and Ponds (SP): Areas of perennial water cover, including creeks, small streams, ponds and the reservoir.
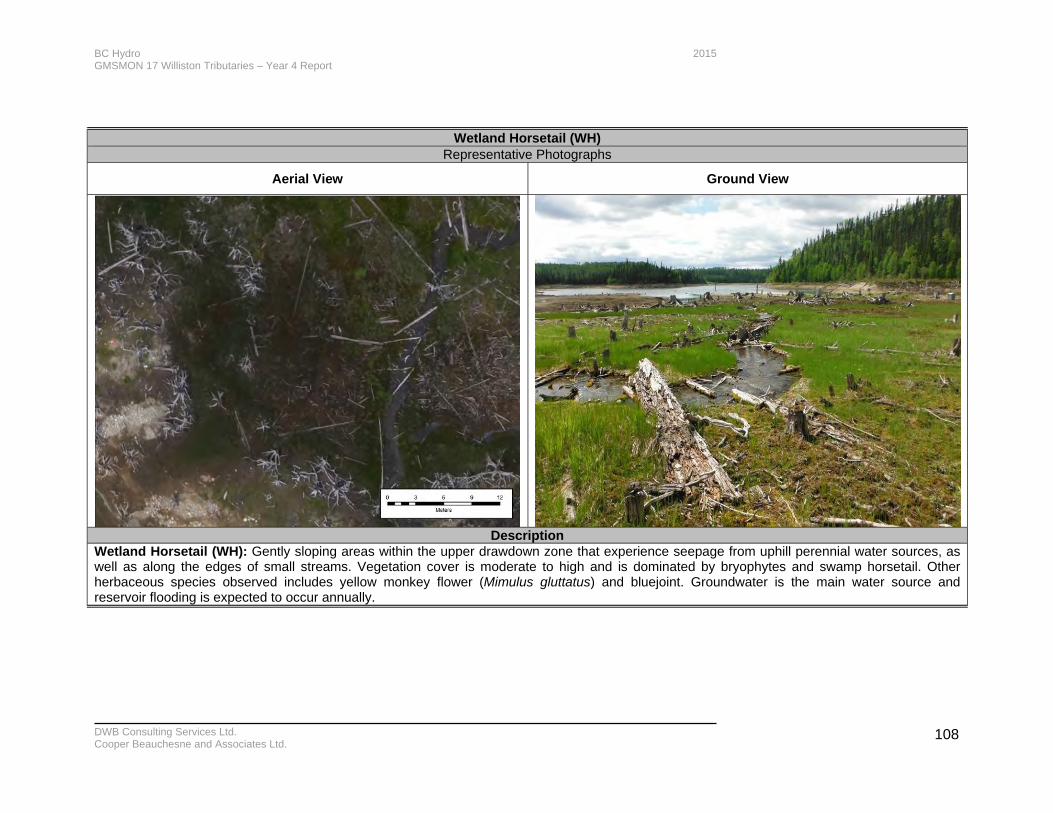
BC Hydro 2015 GMSMON 17 Williston Tributaries – Year 4 Report
DWB Consulting Services Ltd. Cooper Beauchesne and Associates Ltd.
108
Wetland Horsetail (WH) Representative Photographs
Aerial View Ground View
Description Wetland Horsetail (WH): Gently sloping areas within the upper drawdown zone that experience seepage from uphill perennial water sources, as well as along the edges of small streams. Vegetation cover is moderate to high and is dominated by bryophytes and swamp horsetail. Other herbaceous species observed includes yellow monkey flower (Mimulus gluttatus) and bluejoint. Groundwater is the main water source and reservoir flooding is expected to occur annually.
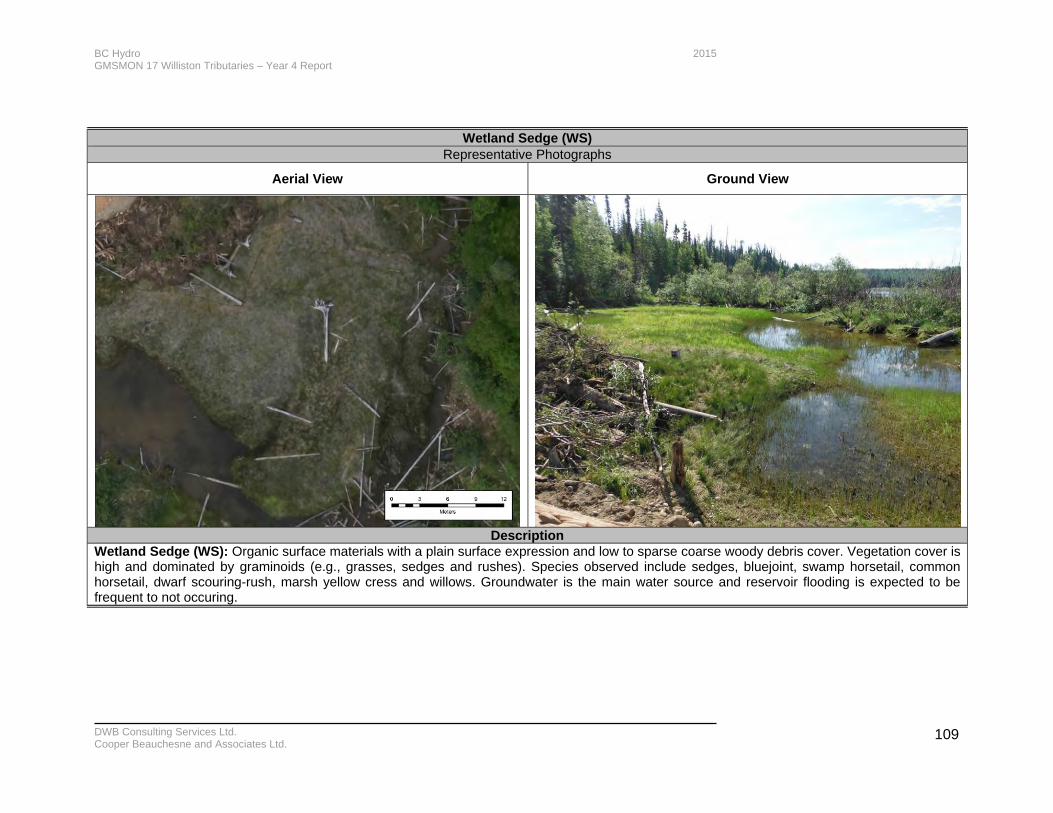
BC Hydro 2015 GMSMON 17 Williston Tributaries – Year 4 Report
DWB Consulting Services Ltd. Cooper Beauchesne and Associates Ltd.
109
Wetland Sedge (WS) Representative Photographs
Aerial View Ground View
Description Wetland Sedge (WS): Organic surface materials with a plain surface expression and low to sparse coarse woody debris cover. Vegetation cover is high and dominated by graminoids (e.g., grasses, sedges and rushes). Species observed include sedges, bluejoint, swamp horsetail, common horsetail, dwarf scouring-rush, marsh yellow cress and willows. Groundwater is the main water source and reservoir flooding is expected to be frequent to not occuring.
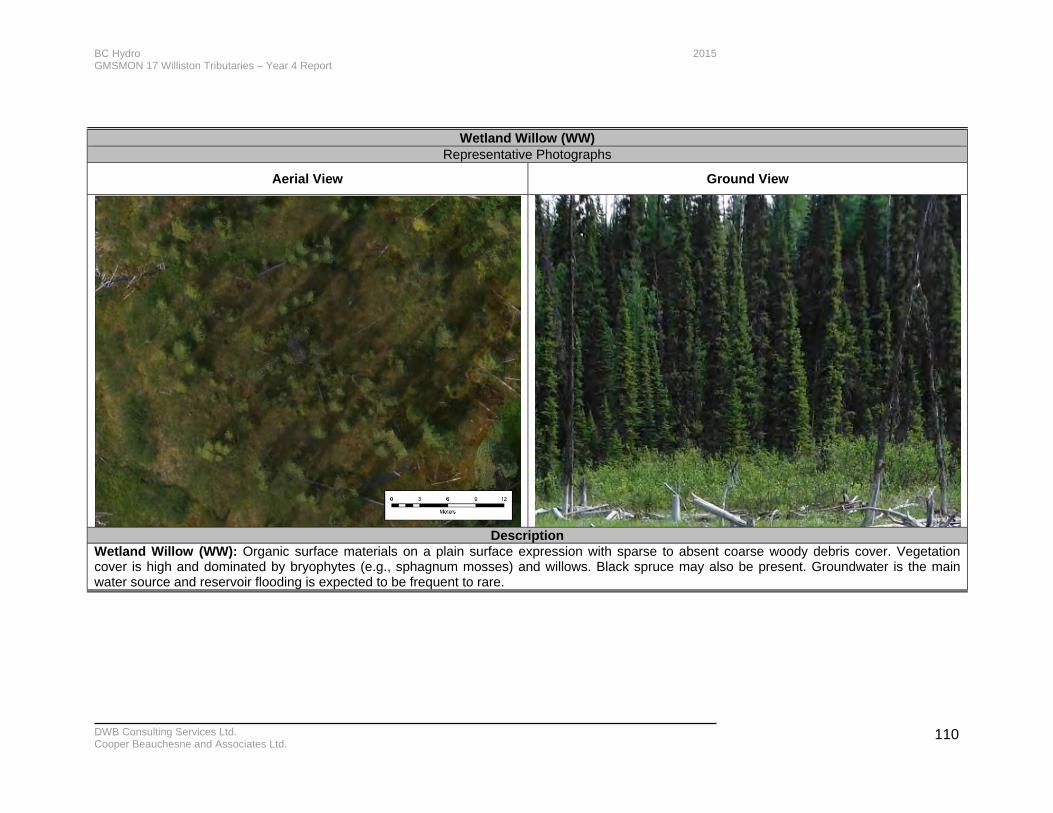
BC Hydro 2015 GMSMON 17 Williston Tributaries – Year 4 Report
DWB Consulting Services Ltd. Cooper Beauchesne and Associates Ltd.
110
Wetland Willow (WW) Representative Photographs
Aerial View Ground View
Description Wetland Willow (WW): Organic surface materials on a plain surface expression with sparse to absent coarse woody debris cover. Vegetation cover is high and dominated by bryophytes (e.g., sphagnum mosses) and willows. Black spruce may also be present. Groundwater is the main water source and reservoir flooding is expected to be frequent to rare.
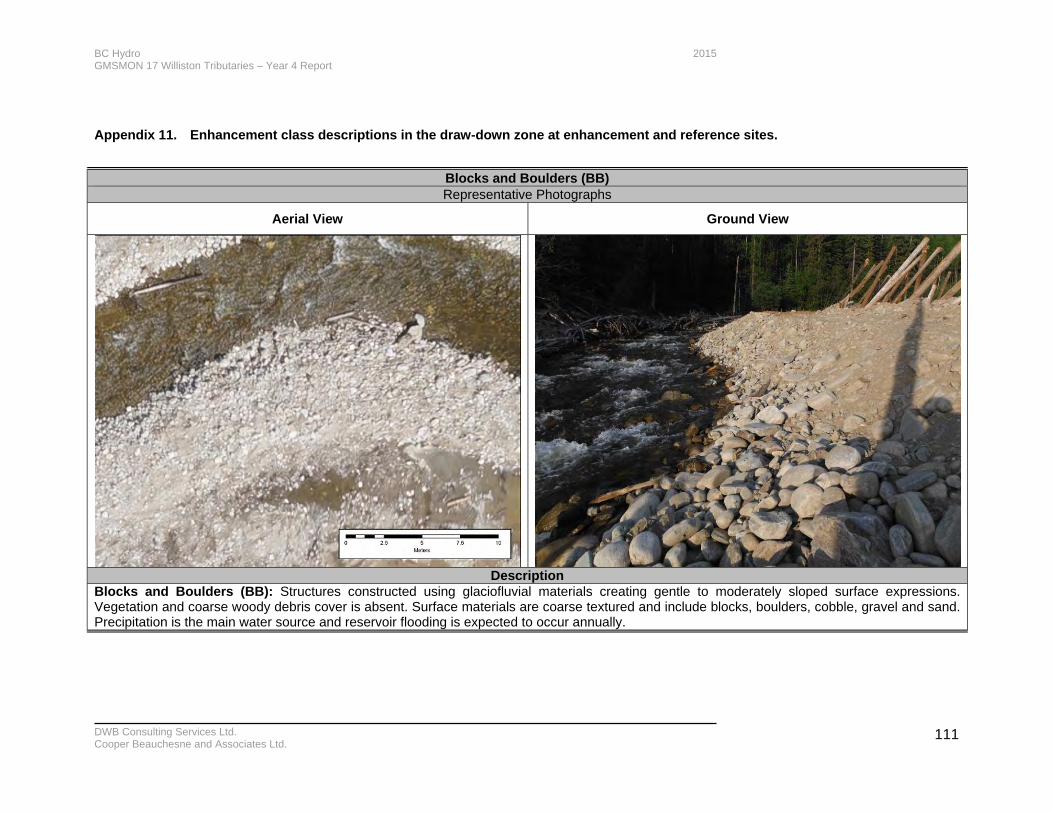
BC Hydro 2015 GMSMON 17 Williston Tributaries – Year 4 Report
DWB Consulting Services Ltd. Cooper Beauchesne and Associates Ltd.
111
Appendix 11. Enhancement class descriptions in the draw-down zone at enhancement and reference sites.
Blocks and Boulders (BB) Representative Photographs
Aerial View Ground View
Description Blocks and Boulders (BB): Structures constructed using glaciofluvial materials creating gentle to moderately sloped surface expressions. Vegetation and coarse woody debris cover is absent. Surface materials are coarse textured and include blocks, boulders, cobble, gravel and sand. Precipitation is the main water source and reservoir flooding is expected to occur annually.
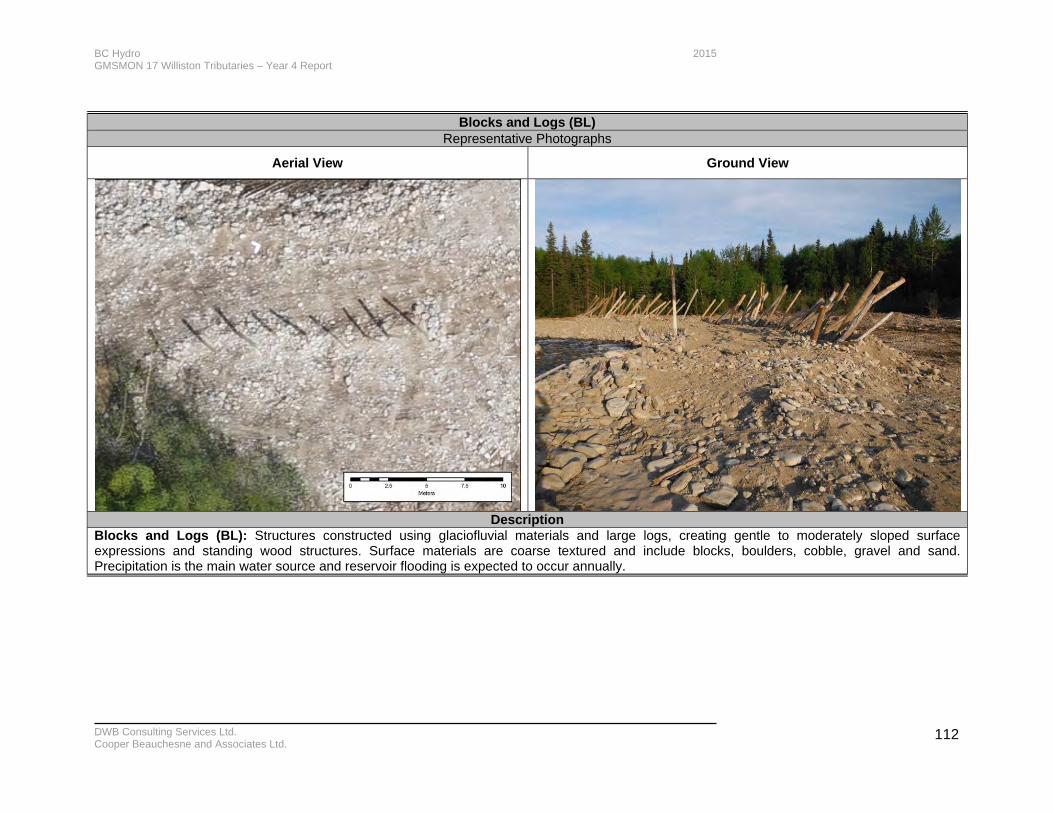
BC Hydro 2015 GMSMON 17 Williston Tributaries – Year 4 Report
DWB Consulting Services Ltd. Cooper Beauchesne and Associates Ltd.
112
Blocks and Logs (BL)
Representative Photographs
Aerial View Ground View
Description Blocks and Logs (BL): Structures constructed using glaciofluvial materials and large logs, creating gentle to moderately sloped surface expressions and standing wood structures. Surface materials are coarse textured and include blocks, boulders, cobble, gravel and sand. Precipitation is the main water source and reservoir flooding is expected to occur annually.
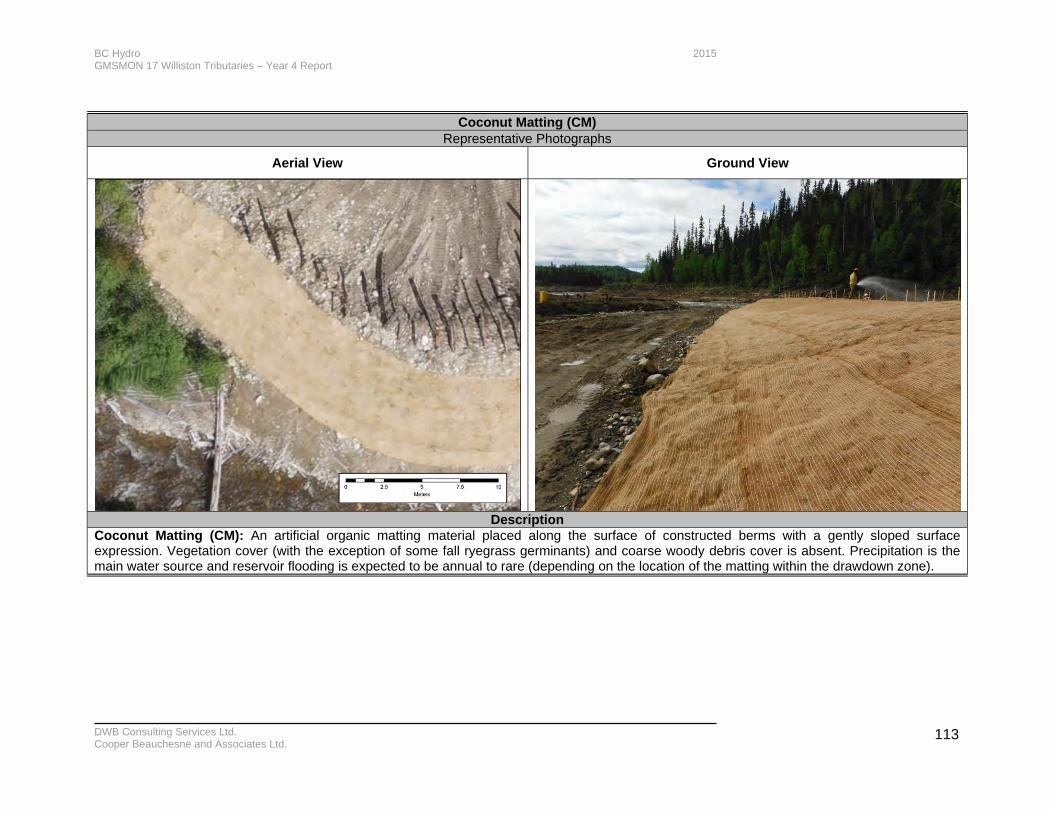
BC Hydro 2015 GMSMON 17 Williston Tributaries – Year 4 Report
DWB Consulting Services Ltd. Cooper Beauchesne and Associates Ltd.
113
Coconut Matting (CM)
Representative Photographs
Aerial View Ground View
Description Coconut Matting (CM): An artificial organic matting material placed along the surface of constructed berms with a gently sloped surface expression. Vegetation cover (with the exception of some fall ryegrass germinants) and coarse woody debris cover is absent. Precipitation is the main water source and reservoir flooding is expected to be annual to rare (depending on the location of the matting within the drawdown zone).
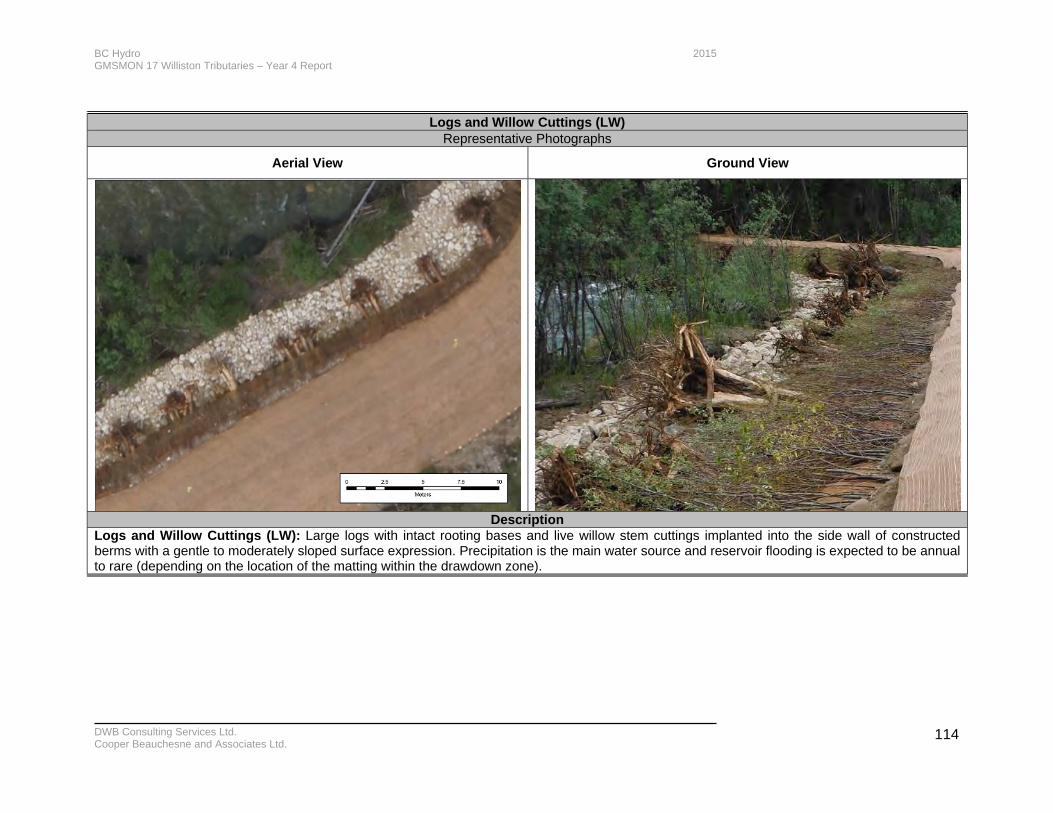
BC Hydro 2015 GMSMON 17 Williston Tributaries – Year 4 Report
DWB Consulting Services Ltd. Cooper Beauchesne and Associates Ltd.
114
Logs and Willow Cuttings (LW)
Representative Photographs
Aerial View Ground View
Description Logs and Willow Cuttings (LW): Large logs with intact rooting bases and live willow stem cuttings implanted into the side wall of constructed berms with a gentle to moderately sloped surface expression. Precipitation is the main water source and reservoir flooding is expected to be annual to rare (depending on the location of the matting within the drawdown zone).
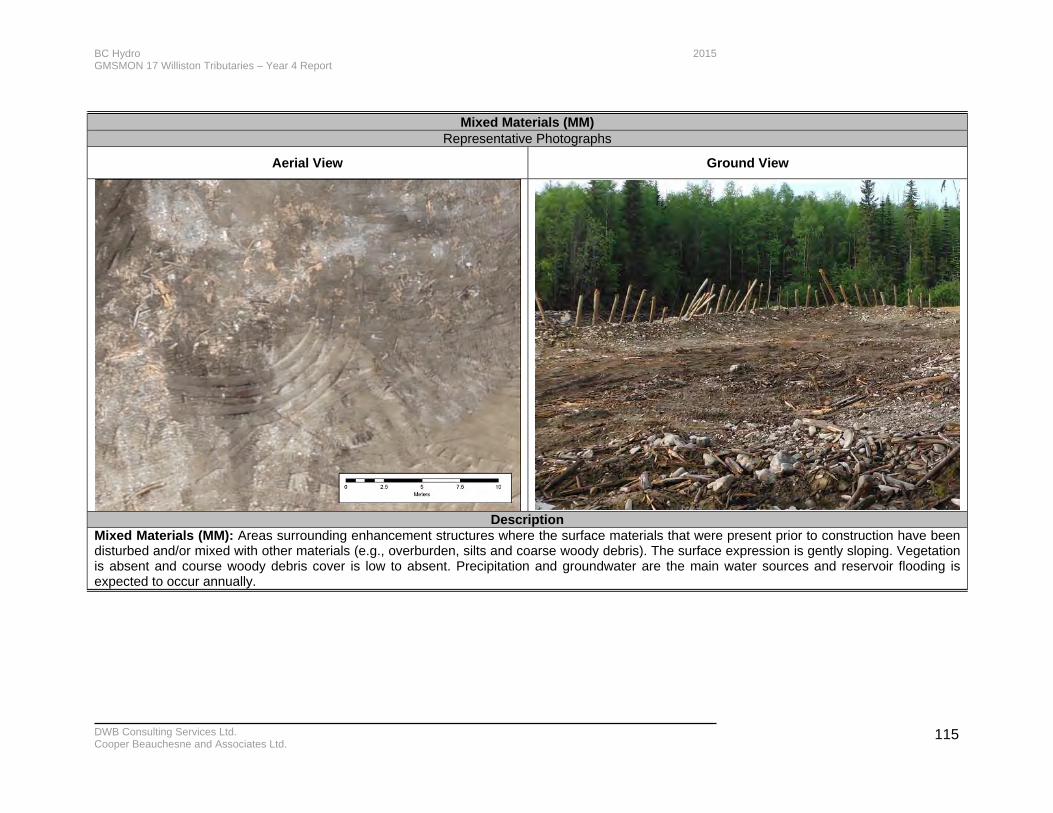
BC Hydro 2015 GMSMON 17 Williston Tributaries – Year 4 Report
DWB Consulting Services Ltd. Cooper Beauchesne and Associates Ltd.
115
Mixed Materials (MM)
Representative Photographs
Aerial View Ground View
Description Mixed Materials (MM): Areas surrounding enhancement structures where the surface materials that were present prior to construction have been disturbed and/or mixed with other materials (e.g., overburden, silts and coarse woody debris). The surface expression is gently sloping. Vegetation is absent and course woody debris cover is low to absent. Precipitation and groundwater are the main water sources and reservoir flooding is expected to occur annually.
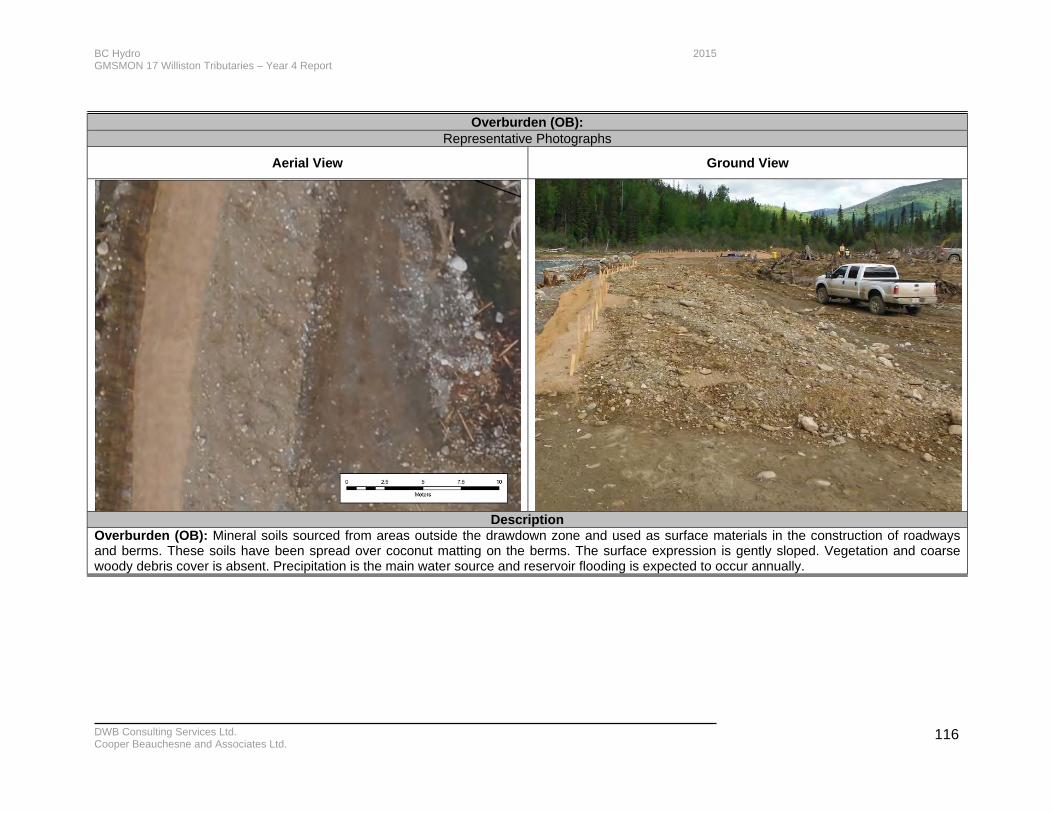
BC Hydro 2015 GMSMON 17 Williston Tributaries – Year 4 Report
DWB Consulting Services Ltd. Cooper Beauchesne and Associates Ltd.
116
Overburden (OB):
Representative Photographs
Aerial View Ground View
Description Overburden (OB): Mineral soils sourced from areas outside the drawdown zone and used as surface materials in the construction of roadways and berms. These soils have been spread over coconut matting on the berms. The surface expression is gently sloped. Vegetation and coarse woody debris cover is absent. Precipitation is the main water source and reservoir flooding is expected to occur annually.
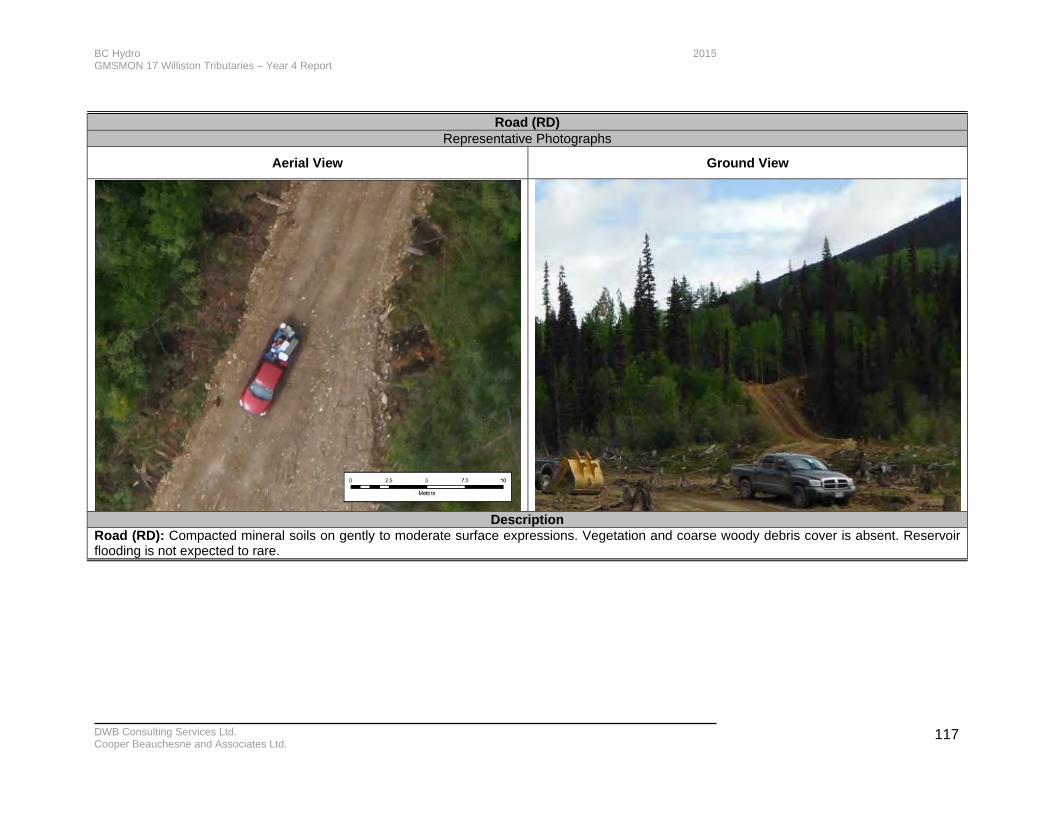
BC Hydro 2015 GMSMON 17 Williston Tributaries – Year 4 Report
DWB Consulting Services Ltd. Cooper Beauchesne and Associates Ltd.
117
Road (RD)
Representative Photographs
Aerial View Ground View
Description Road (RD): Compacted mineral soils on gently to moderate surface expressions. Vegetation and coarse woody debris cover is absent. Reservoir flooding is not expected to rare.
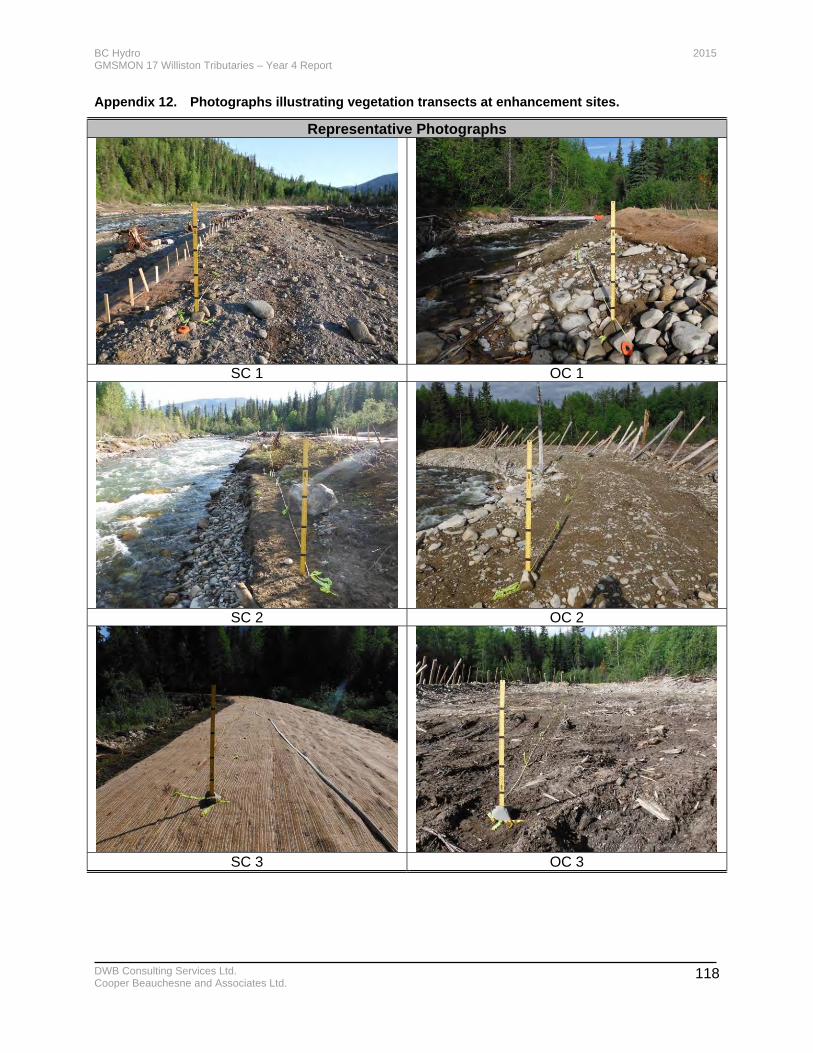
BC Hydro 2015 GMSMON 17 Williston Tributaries – Year 4 Report
DWB Consulting Services Ltd. Cooper Beauchesne and Associates Ltd.
118
Appendix 12. Photographs illustrating vegetation transects at enhancement sites.
Representative Photographs
SC 1 OC 1
SC 2 OC 2
SC 3 OC 3
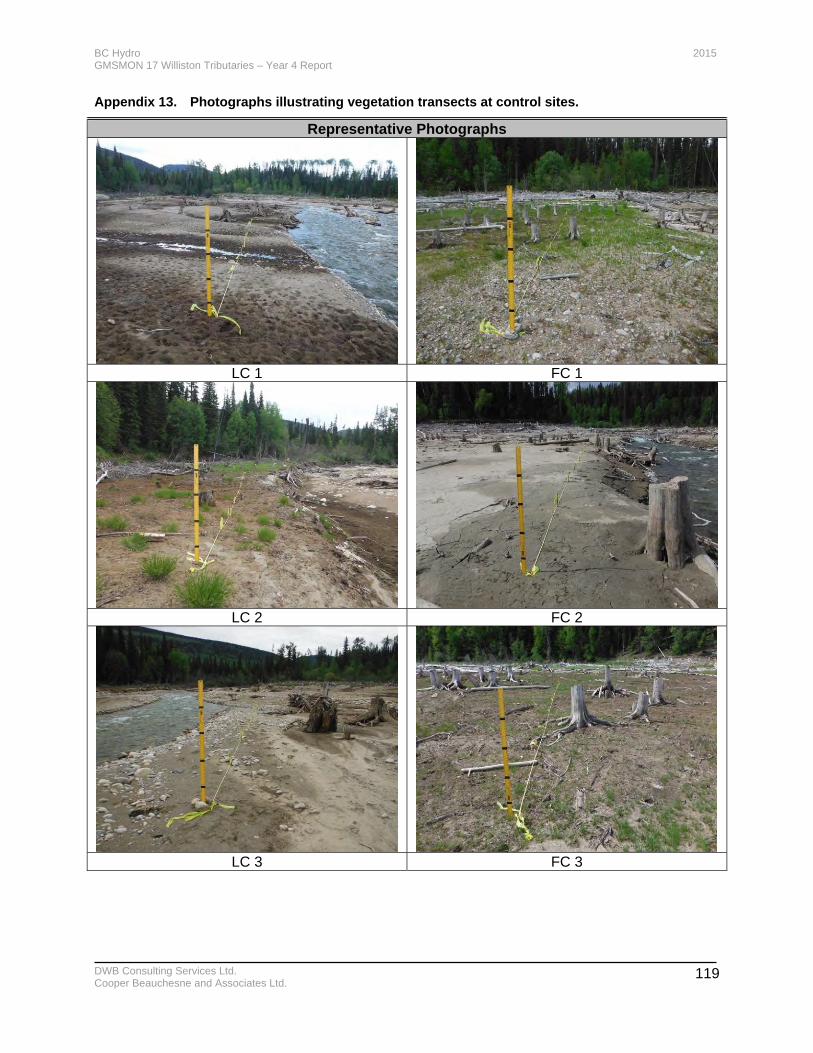
BC Hydro 2015 GMSMON 17 Williston Tributaries – Year 4 Report
DWB Consulting Services Ltd. Cooper Beauchesne and Associates Ltd.
119
Appendix 13. Photographs illustrating vegetation transects at control sites.
Representative Photographs
LC 1 FC 1
LC 2 FC 2
LC 3 FC 3
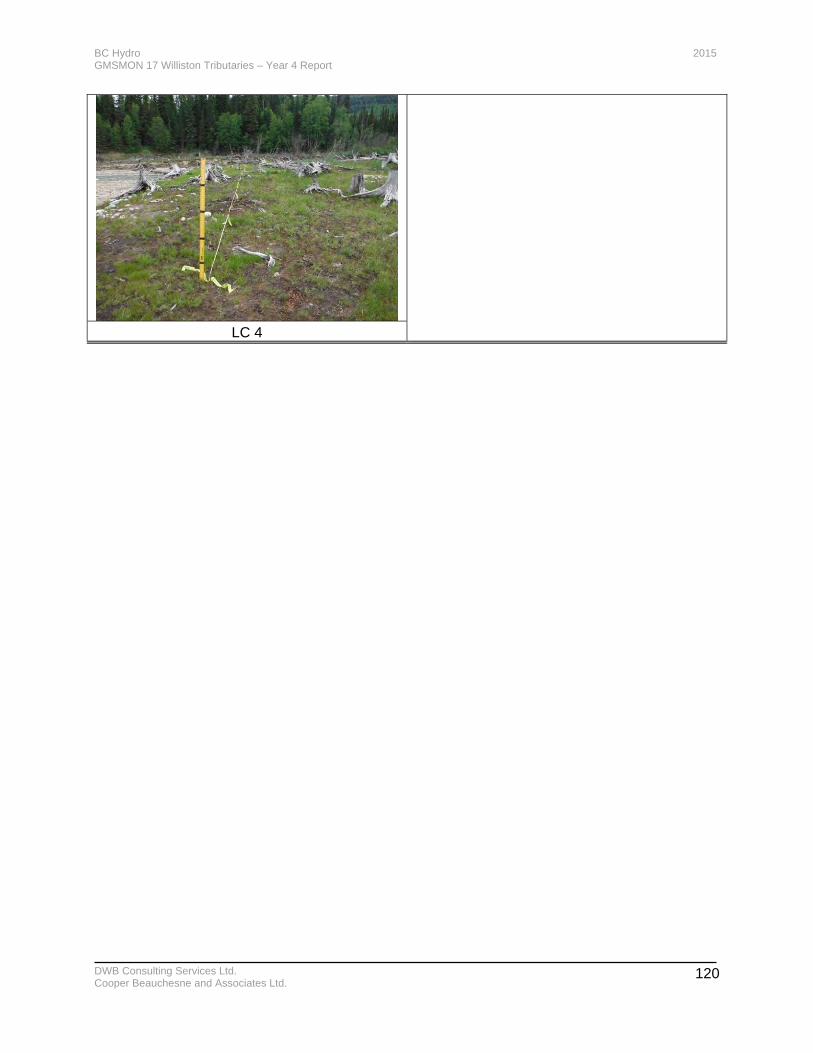
BC Hydro 2015 GMSMON 17 Williston Tributaries – Year 4 Report
DWB Consulting Services Ltd. Cooper Beauchesne and Associates Ltd.
120
LC 4
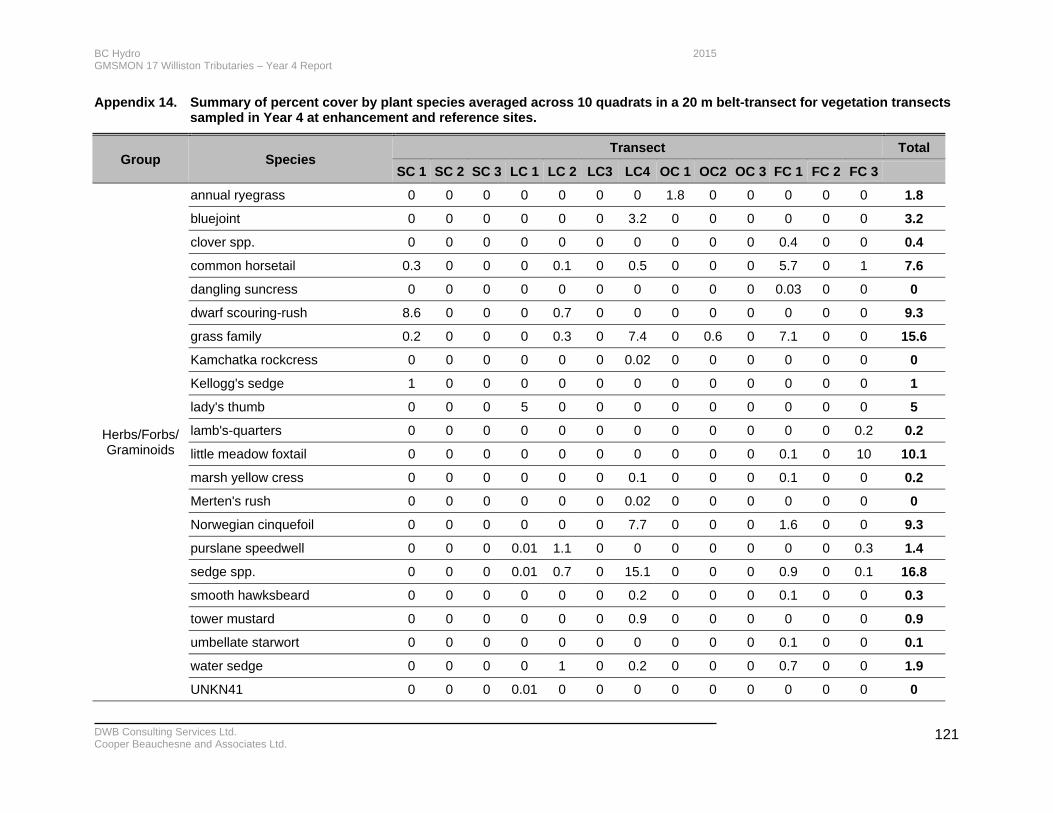
BC Hydro 2015 GMSMON 17 Williston Tributaries – Year 4 Report
DWB Consulting Services Ltd. Cooper Beauchesne and Associates Ltd.
121
Appendix 14. Summary of percent cover by plant species averaged across 10 quadrats in a 20 m belt-transect for vegetation transects sampled in Year 4 at enhancement and reference sites.
Group Species Transect Total
SC 1 SC 2 SC 3 LC 1 LC 2 LC3 LC4 OC 1 OC2 OC 3 FC 1 FC 2 FC 3
Herbs/Forbs/ Graminoids
annual ryegrass 0 0 0 0 0 0 0 1.8 0 0 0 0 0 1.8
bluejoint 0 0 0 0 0 0 3.2 0 0 0 0 0 0 3.2
clover spp. 0 0 0 0 0 0 0 0 0 0 0.4 0 0 0.4
common horsetail 0.3 0 0 0 0.1 0 0.5 0 0 0 5.7 0 1 7.6
dangling suncress 0 0 0 0 0 0 0 0 0 0 0.03 0 0 0
dwarf scouring-rush 8.6 0 0 0 0.7 0 0 0 0 0 0 0 0 9.3
grass family 0.2 0 0 0 0.3 0 7.4 0 0.6 0 7.1 0 0 15.6
Kamchatka rockcress 0 0 0 0 0 0 0.02 0 0 0 0 0 0 0
Kellogg's sedge 1 0 0 0 0 0 0 0 0 0 0 0 0 1
lady's thumb 0 0 0 5 0 0 0 0 0 0 0 0 0 5
lamb's-quarters 0 0 0 0 0 0 0 0 0 0 0 0 0.2 0.2
little meadow foxtail 0 0 0 0 0 0 0 0 0 0 0.1 0 10 10.1
marsh yellow cress 0 0 0 0 0 0 0.1 0 0 0 0.1 0 0 0.2
Merten's rush 0 0 0 0 0 0 0.02 0 0 0 0 0 0 0
Norwegian cinquefoil 0 0 0 0 0 0 7.7 0 0 0 1.6 0 0 9.3
purslane speedwell 0 0 0 0.01 1.1 0 0 0 0 0 0 0 0.3 1.4
sedge spp. 0 0 0 0.01 0.7 0 15.1 0 0 0 0.9 0 0.1 16.8
smooth hawksbeard 0 0 0 0 0 0 0.2 0 0 0 0.1 0 0 0.3
tower mustard 0 0 0 0 0 0 0.9 0 0 0 0 0 0 0.9
umbellate starwort 0 0 0 0 0 0 0 0 0 0 0.1 0 0 0.1
water sedge 0 0 0 0 1 0 0.2 0 0 0 0.7 0 0 1.9
UNKN41 0 0 0 0.01 0 0 0 0 0 0 0 0 0 0
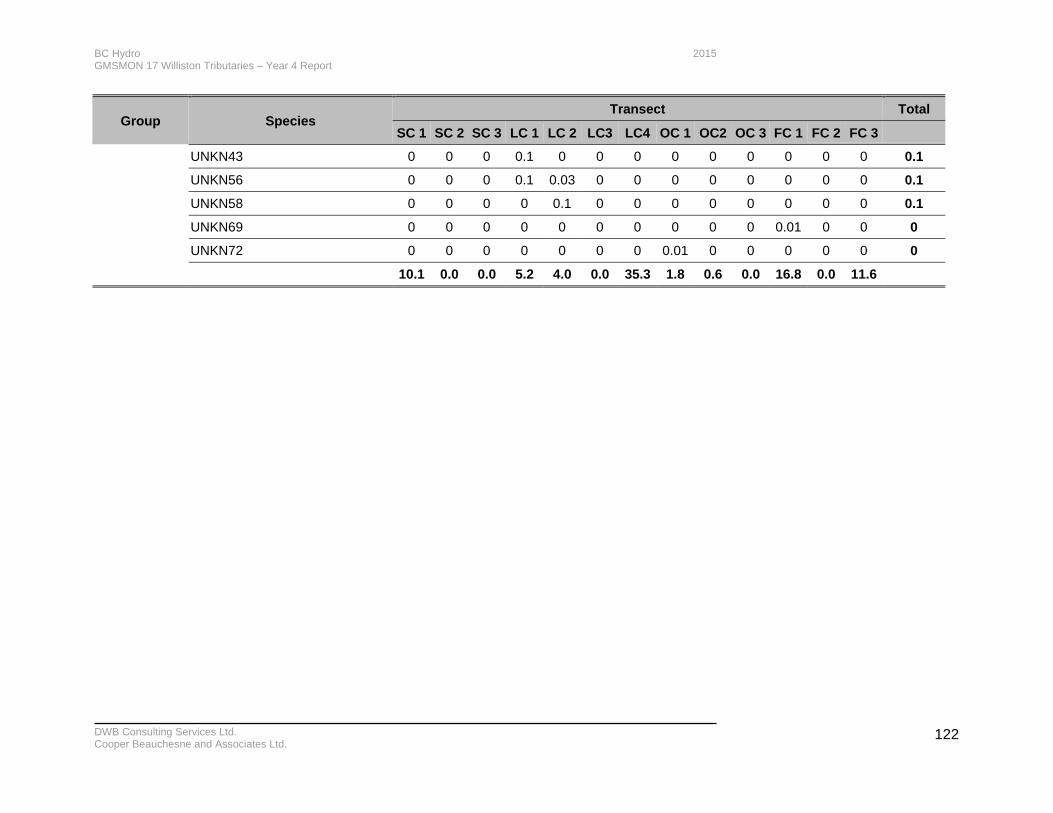
BC Hydro 2015 GMSMON 17 Williston Tributaries – Year 4 Report
DWB Consulting Services Ltd. Cooper Beauchesne and Associates Ltd.
122
Group Species Transect Total
SC 1 SC 2 SC 3 LC 1 LC 2 LC3 LC4 OC 1 OC2 OC 3 FC 1 FC 2 FC 3
UNKN43 0 0 0 0.1 0 0 0 0 0 0 0 0 0 0.1
UNKN56 0 0 0 0.1 0.03 0 0 0 0 0 0 0 0 0.1
UNKN58 0 0 0 0 0.1 0 0 0 0 0 0 0 0 0.1
UNKN69 0 0 0 0 0 0 0 0 0 0 0.01 0 0 0
UNKN72 0 0 0 0 0 0 0 0.01 0 0 0 0 0 0
10.1 0.0 0.0 5.2 4.0 0.0 35.3 1.8 0.6 0.0 16.8 0.0 11.6

BC Hydro 2015 GMSMON 17 Williston Tributaries – Year 4 Report
DWB Consulting Services Ltd. Cooper Beauchesne and Associates Ltd.
123
Appendix 15. Amphibian survey plots and transects with locations of amphibian detections in 2014.
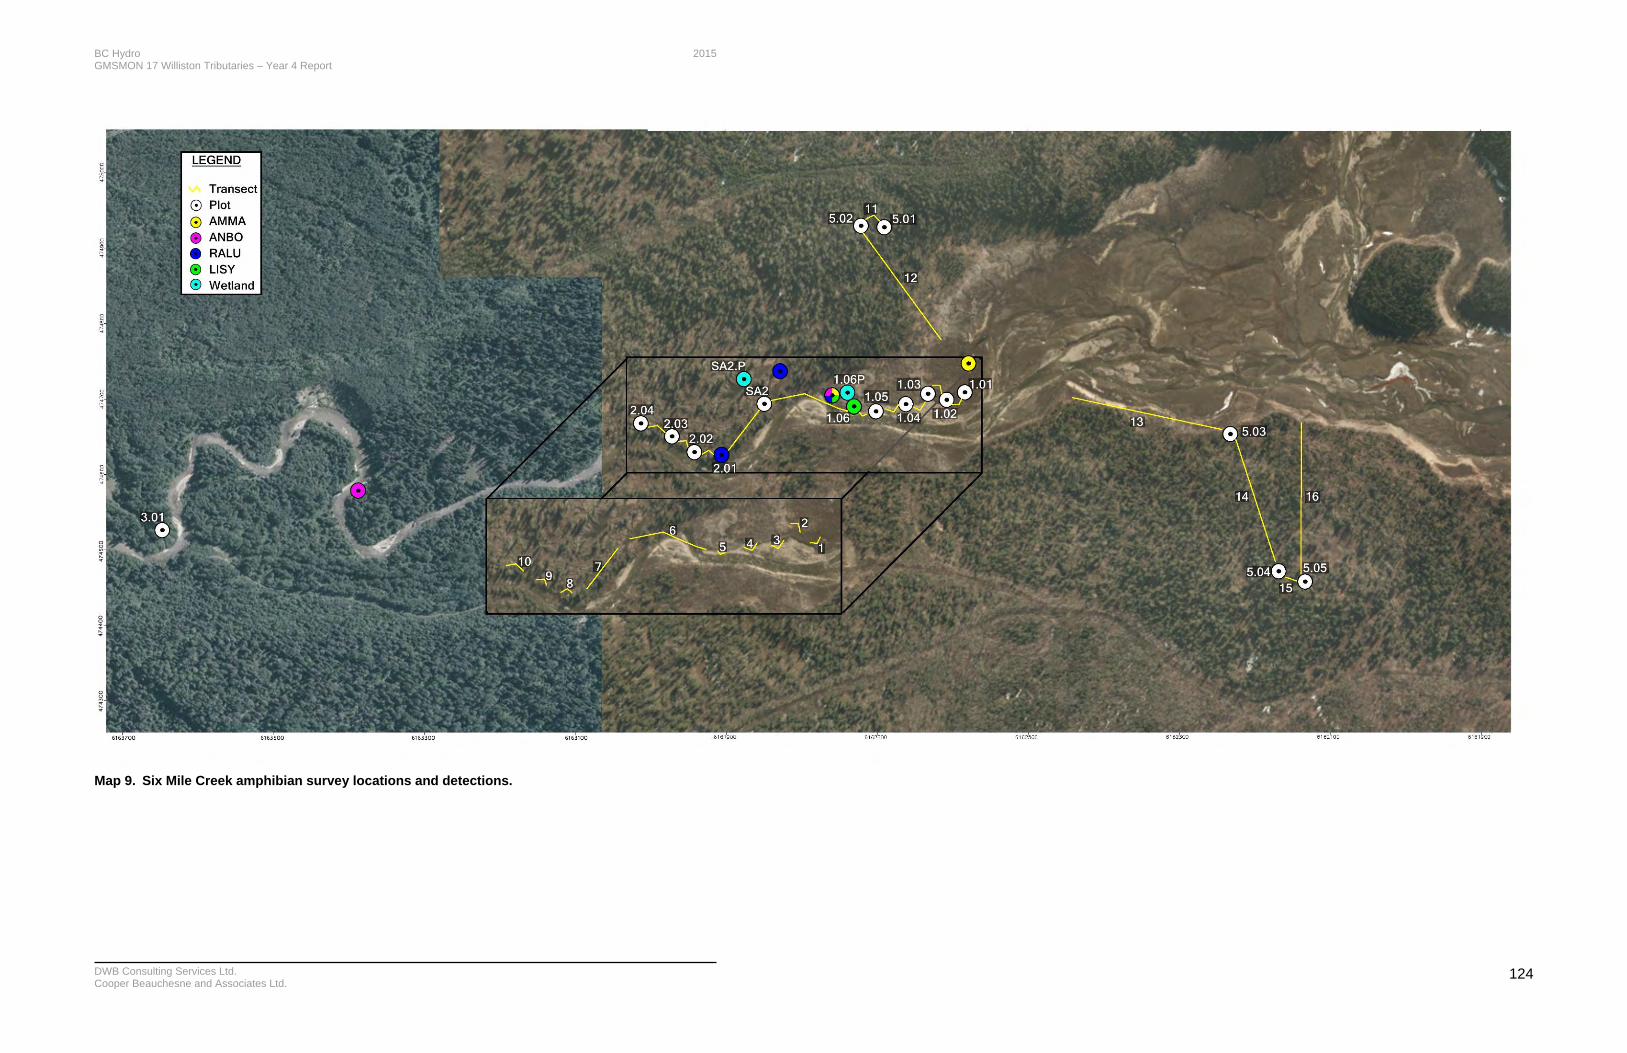
BC Hydro 2015 GMSMON 17 Williston Tributaries – Year 4 Report
DWB Consulting Services Ltd. Cooper Beauchesne and Associates Ltd.
124
Map 9. Six Mile Creek amphibian survey locations and detections.
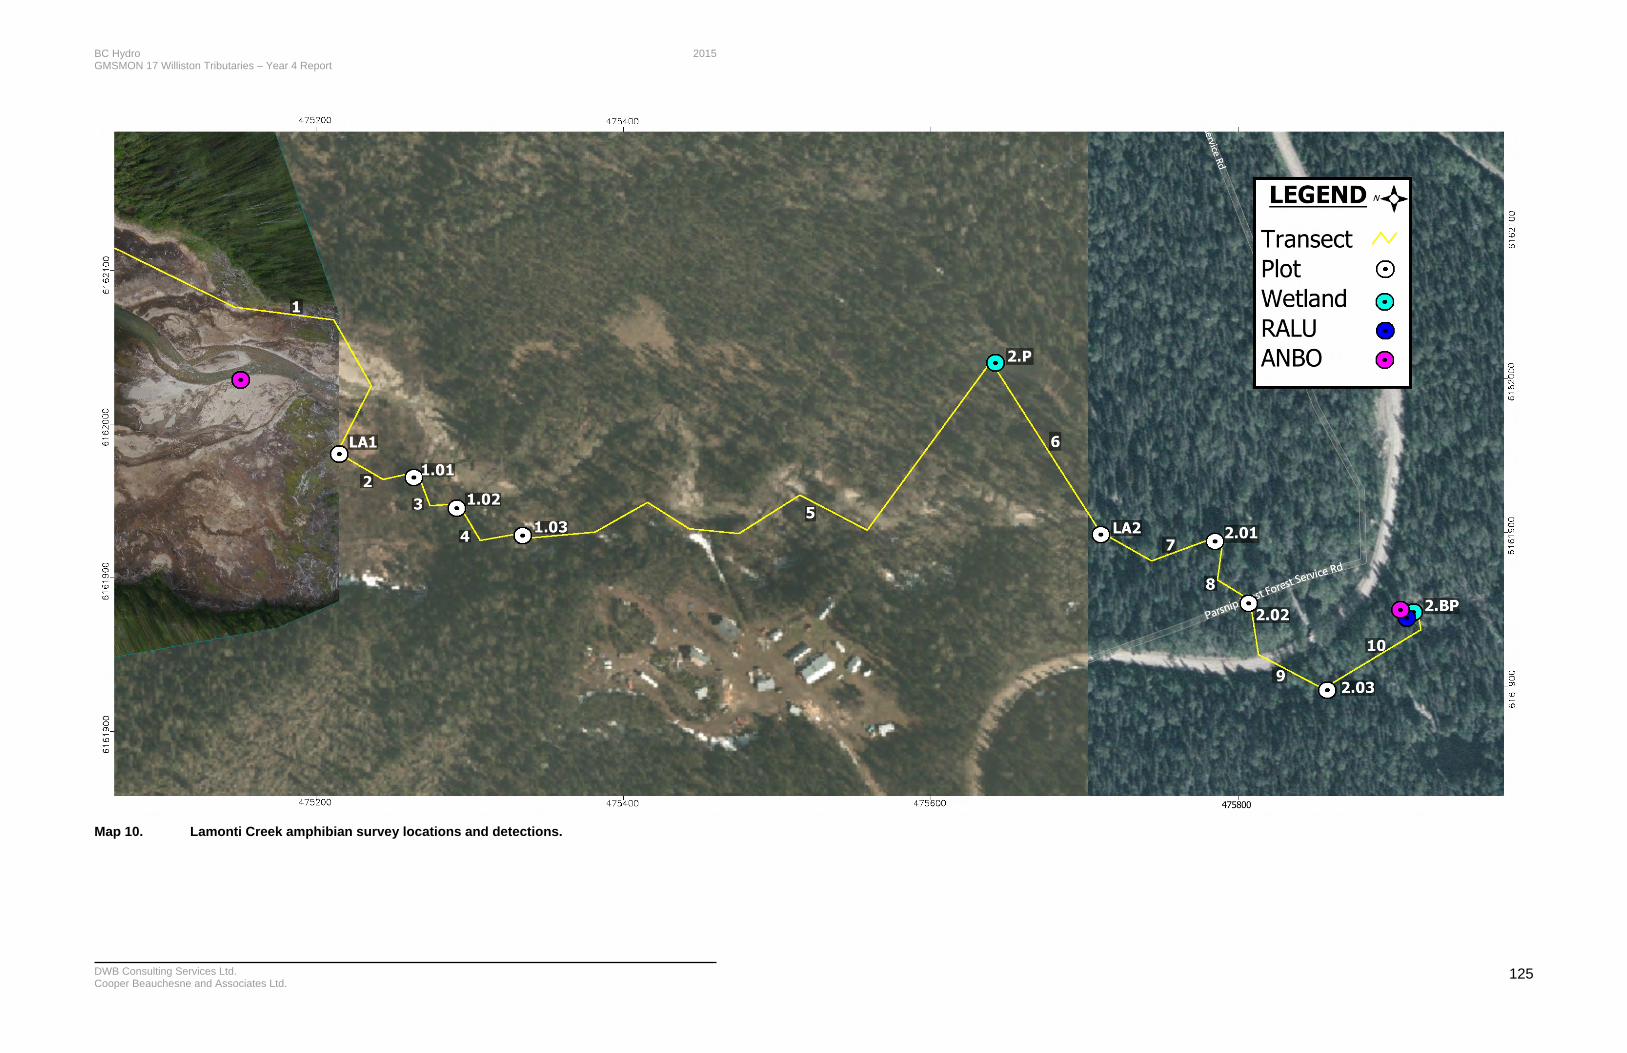
BC Hydro 2015 GMSMON 17 Williston Tributaries – Year 4 Report
DWB Consulting Services Ltd. Cooper Beauchesne and Associates Ltd.
125
Map 10. Lamonti Creek amphibian survey locations and detections.
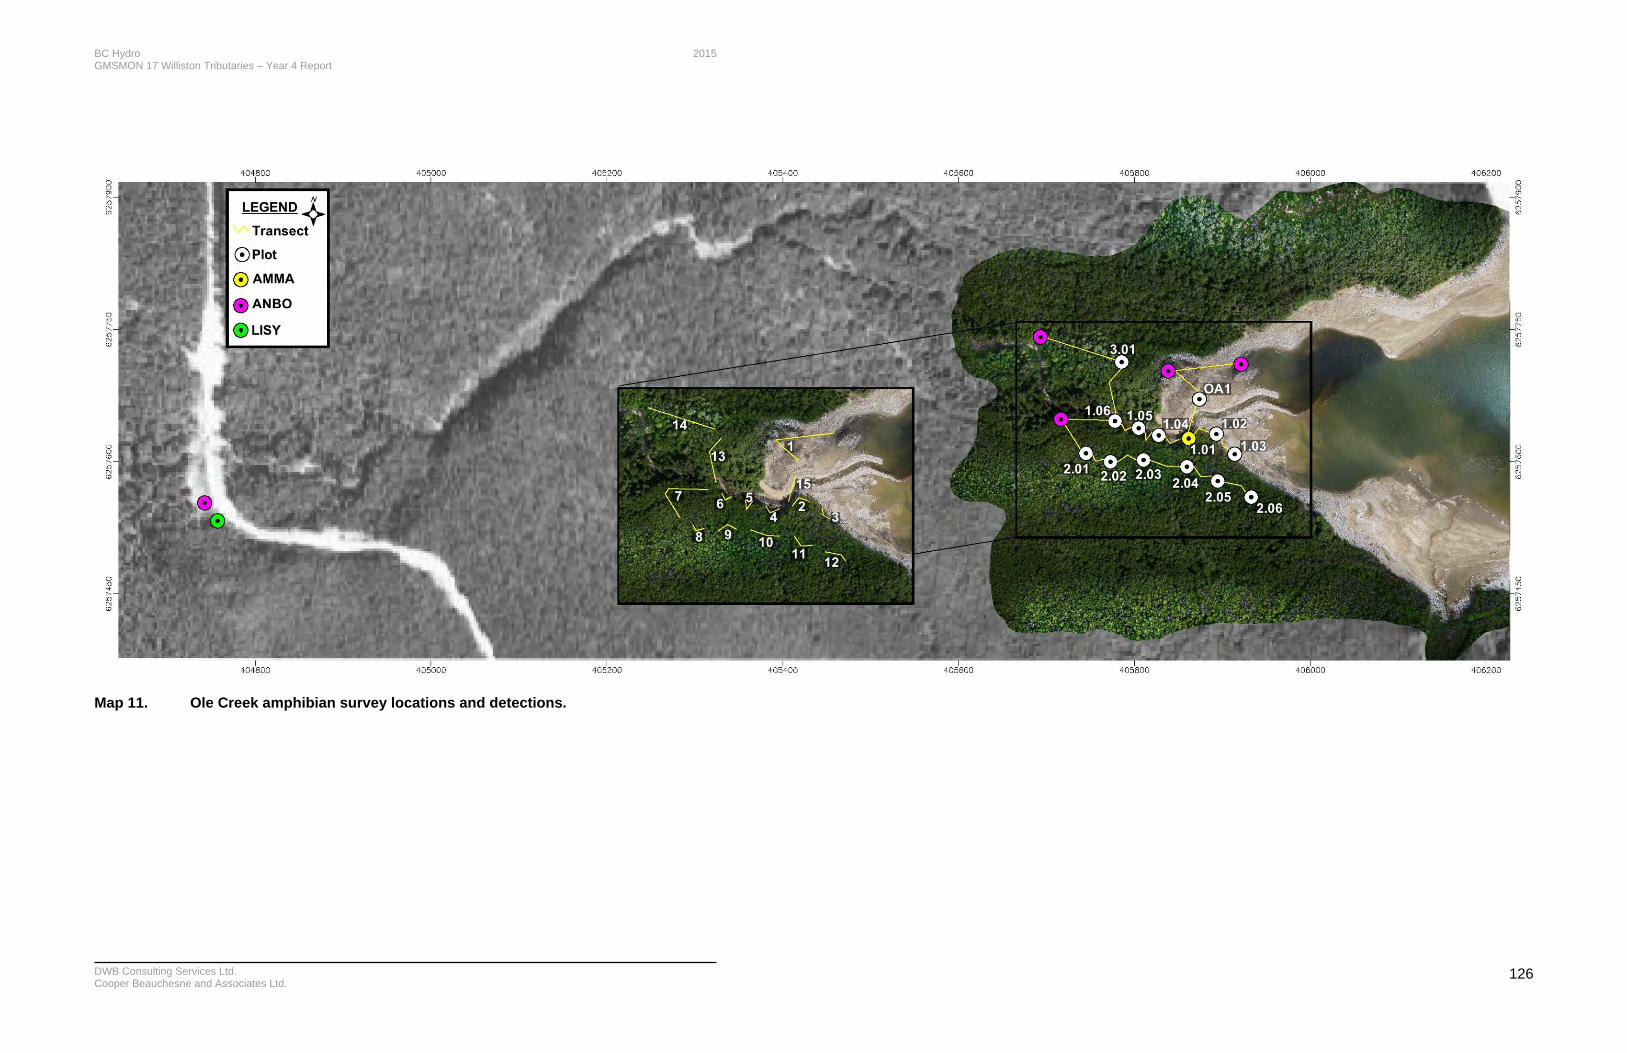
BC Hydro 2015 GMSMON 17 Williston Tributaries – Year 4 Report
DWB Consulting Services Ltd. Cooper Beauchesne and Associates Ltd.
126
Map 11. Ole Creek amphibian survey locations and detections.
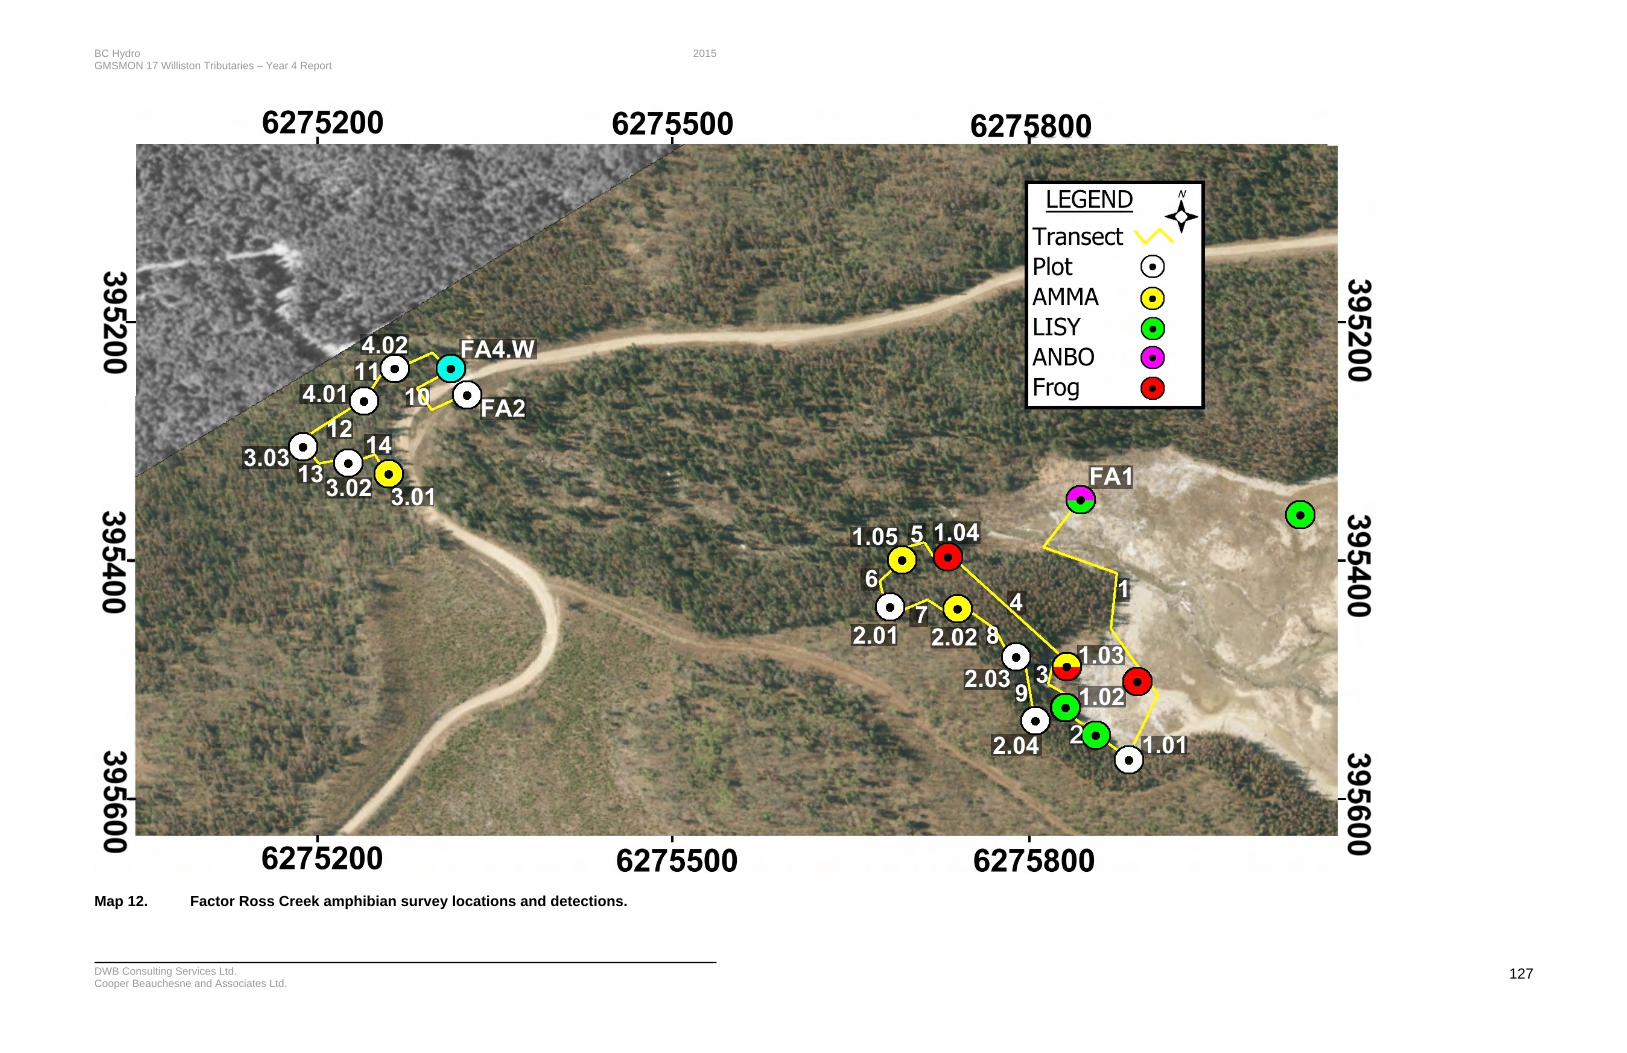
BC Hydro 2015 GMSMON 17 Williston Tributaries – Year 4 Report
DWB Consulting Services Ltd. Cooper Beauchesne and Associates Ltd.
127
Map 12. Factor Ross Creek amphibian survey locations and detections.