PE and outbound drive M&A - ey.com · A potential Grexit from the Eurozone and Russo-Ukrainian...
52
PE and outbound drive M&A Transactions 2016
Transcript of PE and outbound drive M&A - ey.com · A potential Grexit from the Eurozone and Russo-Ukrainian...

PE and outbound drive M&A Transactions 2016

2 | PE and outbound drive M&A
ContentsForeword ................................................................................................................................3
Mergers and Acquisitions (M&A) activity highlights ..............................................................4
Private Equity (PE) highlights ..............................................................................................10
Sector focus
1. Technology .......................................................................................................................15
2. Financial services .............................................................................................................18
3. Infrastructure ...................................................................................................................21
4. Media and entertainment ..................................................................................................24
5. Pharmaceuticals ...............................................................................................................27
6. Real estate and hospitality ................................................................................................30
7. Retail and consumer products ...........................................................................................33
8. Travel services ..................................................................................................................37
M&A Outlook ........................................................................................................................40
Appendices ..........................................................................................................................42
Methodology ........................................................................................................................46

3Transactions 2016 |
2015 was a challenging year for global businesses, owing to uncertainties created through challenging political and business developments. In India, while the domestic M&A activity was tepid, cross-border deals drove the momentum. The silver lining to the year was Private Equity which posted a record year with the highest ever volume and value of investments.
On the global front, the business environment was confronted with challenging developments. A potential Grexit from the Eurozone and Russo-Ukrainian crisis adversely affected the global economic environment early this year. Other factors that impacted the same in the latter half of the year included a slowing Chinese economy, apprehensions around the Federal Reserve’s monetary tightening in the US and a slump in commodities, which are expected to remain soft.
In terms of M&A activity in India, cross-border deals drove the momentum. Big-ticket outbound
border perspective. These large transactions took place in the pharmaceuticals and oil & gas sector. On the Inbound front, activity was steady. While deal volume increased marginally, the value saw a decline vis-à-vis the previous year. The domestic M&A activity was tepid, owing to fewer big-ticket deals that were witnessed in the previous year, as also due to a lack of big-ticket divestments by debt-ridden companies. While there was a marginal increase in volume, the value declined.
2015 emerged as a record year for PE activity, with deals amounting to US$19.6 billion in investments, it marked the best year ever in terms of value and volume of investments. It
pharmaceuticals. It also saw the highest number of exits recorded in a year with the value doubling as compared to last year. We expect this momentum to continue.
Confronted with an uncertain business environment, CEOs focused on leveraging operational
the world. Several restructuring deals over the past year, including the Vedanta-Cairn and
Despite a challenging global environment and soft domestic deal activity in 2015, we expect the same to bounce back this year. Domestic activity should strengthen as we are likely to see more deals with an eye on debt consolidation and restructuring especially in sectors like manufacturing and infrastructure. With other sectors including pharmaceuticals, technology
2016.
Foreword
Amit KhandelwalNational Director and PartnerTransaction Advisory Services

4 | PE and outbound drive M&A
Mergers and Acquisitions (M&A) activity highlights

5Transactions 2016 |
Overall Indian M&A activity softens • The Indian M&A activity softened in 2015 with a total
of 930 deals that were announced with a cumulative disclosed deal value of US$26.3 billion. While the deal volume remained at levels similar to the previous year
11% from US$29.4 billion in 2014.
• The decline in deal value can be attributed to a sharp slowdown in the domestic deal activity through the year, which declined to a cumulative deal value of US$10.9 billion from 513 deals compared to a total deal value of US$16.2 billion from 493 deals in 2014. The slump in domestic deal activity was largely due to the absence of megadeals, which were quite prominent in the previous
global markets, owing to a weak outlook and downturn in the commodity cycle, adversely affected the domestic deal activity. At the same time, 2015 lacked big-ticket divestments by debt-ridden companies, which were a
• While domestic deals accounted for 55% of the total deal
deal value, accounting for 59% of the same in 2015.
32.1
27.2 28.429.4
26.3
825 835
763
870
930
600
700
800
900
1,000
20
25
30
35
40
2011 2012 2013 2014 2015
Num
ber o
f dea
ls
US$
bill
ion
Deal value (US$ billion) Number of deals
Exhibit 1: M&A activities of Indian companies
Source: EY analysis of Thomson ONE data
• Technology, retail and consumer products and infrastructure were the most active sectors through the year with respect to the deal volume and accounted for nearly one-third of the total announced deals in 2015. From a value perspective, the oil and gas sector was at the forefront, followed by pharmaceuticals, on account of big-
Exhibit 2: Five most active sectors by deal value in 2015
Source: EY analysis of Thomson ONE data
3,425
Oil
and
gas
Reta
il an
d co
nsum
erpr
oduc
ts
Infr
astr
uctu
re
Fina
ncia
l ser
vice
s
Phar
mac
eutic
als
3,118 2,696 2,509 2,406
0
2,000
4,000
6,000
8,000
US$
mill
ion
Exhibit 3: Five most active sectors by deal count in 2015
Source: EY analysis of Thomson ONE data
121
95 91 86 84
0
30
Tech
nolo
gy
Reta
il an
dco
nsum
erpr
oduc
ts
Infr
astr
uctu
re
Fina
ncia
lse
rvic
es
indu
stria
lpr
oduc
ts
60
90
120
150

6 | PE and outbound drive M&A
Cross-border activity marked by big-ticket outbound deals
cumulative disclosed deal value of US$15.4 billion, representing
US$13.2 billion in 2014.
Geographical distribution of deals
2014 2015
Count Value (US$ million)
Count Value (US$ million)
Domestic 493 513
Inbound 259 10,150
Outbound 2,361 145
Total 870 29,424 930 26,287
Exhibit 4: Geographical spread of deals in 2015
Source: EY analysis of Thomson ONE data
57%
55%
55%
41%
30%
29%
37%
39%
13%
16%
8%
20%
2014
2015
2014
2015
Domestic
By v
alue
By c
ount
Inbound Outbound
• Outbound drove the year’s M&A activity in terms of value:
• In 2015, cumulative disclosed deal value was US$5.3 billion — up 123% in terms of disclosed value from US$2.4 billion in 2014.
•
to a few big-ticket outbound transactions in the pharmaceuticals and oil and gas sectors.
• Pharma players made outbound acquisitions to increase their customer base, expand distribution reach and broaden their product portfolios.
Exhibit 5: Five most acquisitive nations for Indian companies in 2015
Source: EY analysis of Thomson ONE data
78
33 18 16 16
0
20406080
100
United States
Japan United Kingdom
Singapore France
Exhibit 6: Five most targeted nations by Indian companies in 2015
Source: EY analysis of Thomson ONE data
United States
United Kingdom
Germany United ArabEm
Singapore
42
14 8 6 6
0
10
20
30
40
50
• In the oil and gas sector, state-owned ONGC Videsh
15% stake in Vankorneft oil project from Rosneft for
• Inbound activity demonstrated steady momentum:
•
a cumulative disclosed deal value of US$10.2 billion — registering a marginal increase of 5% in volume from
value from US$10.9 billion seen in 2014.
• The decline in inbound deal value was primarily driven by the global slowdown, a weakening of commodity prices and a deceleration in economic activity in key emerging markets. These factors drove global buyers to remain cautious about pursuing big-ticket acquisitions in the country.
•
the most active sectors for inbound M&A activity in 2015.
• US continued to be the most active cross-border partner

Transactions 2016 |
Restructuring attracts attention as a driver of domestic activity
of domestic M&A activity during the year. This trend was also
respondents expressed cost optimization and operational
• During the year, we saw three big mergers in the domestic arena, which were done with an aim to build healthy balance sheets, simplify group structures and gain operational synergies:
• Vedanta’s announced mega-merger with Cairn India, which has a deal value of US$2.2 billion.
• Aditya Birla Group’s announced merger of its branded apparels businesses Pantaloons Fashion and Madura
•
• At the same time, stakes and assets transfers within group companies were also reported during the year.
•
businesses, Radio City and Radio Mantra, under the name Music Broadcast to simplify its ownership structure and consolidate its ad-sales revenues.
•
Agro to Gujarat Apollo Industries and Apollo Earthmovers.
• Max India spun-off its business activities into three listed companies, which will be individually responsible for the group’s main business activities, namely, life insurance, health and allied businesses and manufacturing.
• A few examples of spin-offs being concluded during the year include:
•
to reduce its debt burden.
•
with its strategy to sell non-core assets to reduce its debt burden.
• Share repurchases were also a prominent aspect across many deals. Few examples include:
•
to INR165 crores, while shelving its earlier announced fundraising plans. The company was expected to utilize the funds as raised for acquisitions, which it suspended citing high valuations of internet companies.
• Clariant Chemicals bought back shares for US$54 million, with a view to reward its shareholders by purchasing the shares at a premium to the prevailing market price, after selling its Kolshet land.
Exhibit 7: Domestic M&A activities of Indian companies
Source: EY analysis of Thomson ONE data
Deal value (US$ billion) Number of deals
5.5
13.9
6.2
16.2
10.9
424 452 448 493 513
0
100
200
300
400
500
0
4
8
12
16
20
2011 2012 2013 2014 2015
Num
ber o
f dea
ls
Dea
l val
ue (U
S$ b
illio
n)

| PE and outbound drive M&A
E-commerce: the game changer across industriesThe e-commerce market in India has been growing
Improving access to the internet, burgeoning 3G internet users, the recent introduction of 4G and the proliferation of internet-enabled devices such as smartphones and tablets means an ever-increasing online consumer base in the country. Improvements in technology used for online payments, resulting in their growing acceptability, are further helping a shift in the shopping patterns of consumers from brick-and-mortar to online.
Traditional retailers foray into the online space to capitalize on the trend
•
in 2015 as the changing buying pattern of consumers — who now expect convenience, a much wider product range and competitive prices as a norm — is creating pressure on traditional brick-and-mortar players to have an online presence.
• This, however, is also creating opportunity for retailers,
opportunity to offer personalization. Consequently, we saw traditional retailers continuing to venture into the online space either through tie-ups with e-tailers, or through acquisitions or the launch of their own online portals.
• A few examples of such deals include:
• Aditya Birla Group’s entry into e-retail through the launch of its online fashion store, www.abof.com.
• Mahindra Group’s foray into e-commerce with the
products.
• Tata Value Homes’ tie-up with Snapdeal to offer its products for sale.
• Traditional players also acquired existing e-tailers. This route helped them leverage the existing brand name of the target at reduced investments in terms of money and time. Examples include:
• Mahindra Retail’s acquisition of Babyoye.com, an e-retailer of baby-related products.
• 21st Century Fox’s acquisition of Screen Magazine
platform “Hotstar”.
• Spencer’s Retail, the supermarket chain owned by the Goenka Group acquired the online grocery store Meragrocer.

9Transactions 2016 |
Quest to expand scale and market share steers consolidation within e-commerce
• The fast-growing e-commerce industry continued to attract
of PE and VC funds into e-commerce ventures.
• As a result, we saw companies with strong balance sheets taking the inorganic route to consolidate their position in the market. These players are considering these deals as a way to increase their market share by adding a customer base, upscaling their technology and procuring a better talent pool.
•
deals, since these were considered safe bets by acquirers compared with all-cash deals. Equity deals divide the risk of a failed transaction between the shareholders of the acquirer and the target.
• Examples of such deals include:
• Acquisition of TaxiForSure by Ola Cabs for US$200 million in cash and equity.
• Acquisition of Mygreenbox, an online grocery delivery service, by Grofers.
• Proposed acquisition of Zo Rooms by Oyo Rooms in an all-equity deal.
E-commerce players acquired tech-start-ups to build capabilities, especially in the mobility domain
Besides acquisitions within the industry, e-commerce players also sought interest in emerging technology start-ups to complement growing business needs and build in-house capabilities. Mobile technology was an obvious key focus area as an increasing percentage of online transactions are being conducted on mobile apps. Examples include:
•
by Snapdeal to strengthen its mobile presence.
• Acquisition of NexTable and Maple Graph by Zomato to acquire mobility capabilities with an aim to start online delivery services.
• Acquisition of travel mobile development business of SourceN Inc. by HolidayIQ to boost its mobile presence.
Acquisitions for securing talent are becoming a norm
Acquiring the right talent was one of the prominent drivers of deals in the e-commerce sector. There is considerable demand for tech talent and acquiring them through acquisition
enhance one’s delivery capabilities with reduced risk and investment that comes with a fresh hiring process. Most of these acquisitions are structured in a way that the team is
thereby ensuring relatively low attrition rates. Prominent examples of such deals include:
• Acquisition of Appiterate, an analytics platform, and AdlQuity, a mobile marketing platform, by Flipkart.
• Acquisition of Reduce Data Inc., an advertising platform, by Snapdeal.
• Acquisition of Bakfy, a messaging start-up, by
in India, the majority of the acquisitions were domestic in
of the industry. We expect a robust M&A scenario in the near future, with deals aimed at gaining market share and achieving top-line growth goals, consolidating vertical segments and enriching offerings with new innovations, denying competitors an edge. The e-commerce industry will get a further push from government programs such as “Digital India,” wherein providing high-speed internet and mobile connectivity across the country and the modernization of India Post are listed as priorities on the agenda.

10 | PE and outbound drive M&A
Private Equity highlights

11Transactions 2016 |
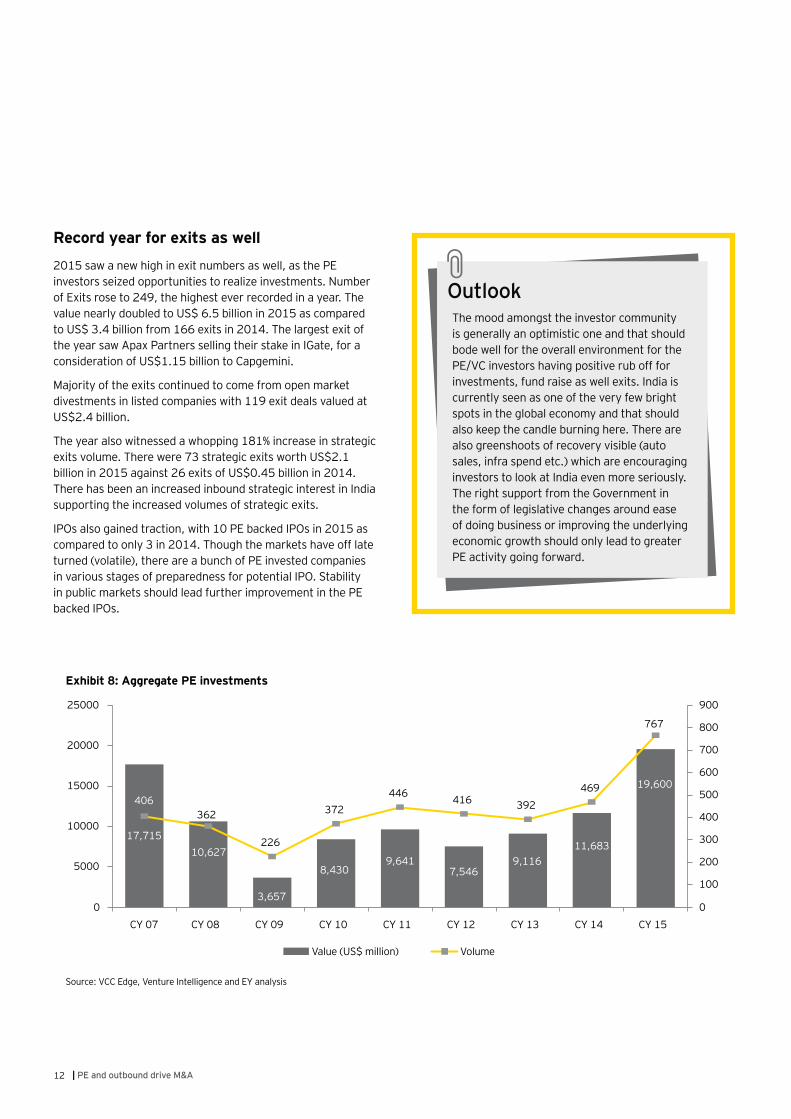
Record year for investments
amounting to US$19.6 billion in investments which marked the highest ever in terms of value and volume of investments. This
The year exhibited three discrete trends - marked improvement in big deals, substantial growth in early stage activity and unprecedented interest in e-commerce and internet related businesses partly contributing to the early stage investments.
in Flipkart by Tiger Global, Steadview Capital and other investors. Also, there were 3 deals of US$500 million each
There was substantial early stage VC activity1
through 456 deals. This accounted for 59% of total announced deal volume in 2015. The investors were aggressive in
from 2014.
The year also saw more buyout deals. There were 23 buyout
worth US$513 million in 2014.
Similar to the previous year, 2015 also saw an increased focus of investors in e-commerce and technology sectors. These sectors accounted for 331 deals valued at US$6.1 billion in 2015. These investments invariably were made by investors who hitherto have not been India focused or are very focused
will need to be closely watched. Other sectors which gained
US$3.2 billion from 64 deals.
The real estate sector saw platform deals where investors such as Warburg Pincus and Goldman Sachs committed money to build a portfolio of assets. The other continuing trend was investment in completed or near completion commercial real
1
Positive Fund Raising Sentiments
Fund raising was at a historic high at US$6.4 billion which
HDFC Offshore Fund.
the surge of activity in this space. Total money raised by real estate focused funds in 2015 was close to US$ 1 billion.
during the year amounting to US$10.4 billion highlighting the positive sentiments of the GPs.
12 | PE and outbound drive M&A
Record year for exits as well
2015 saw a new high in exit numbers as well, as the PE investors seized opportunities to realize investments. Number of Exits rose to 249, the highest ever recorded in a year. The value nearly doubled to US$ 6.5 billion in 2015 as compared to US$ 3.4 billion from 166 exits in 2014. The largest exit of the year saw Apax Partners selling their stake in IGate, for a consideration of US$1.15 billion to Capgemini.
Majority of the exits continued to come from open market divestments in listed companies with 119 exit deals valued at US$2.4 billion.
billion in 2015 against 26 exits of US$0.45 billion in 2014. There has been an increased inbound strategic interest in India supporting the increased volumes of strategic exits.
IPOs also gained traction, with 10 PE backed IPOs in 2015 as compared to only 3 in 2014. Though the markets have off late
in various stages of preparedness for potential IPO. Stability in public markets should lead further improvement in the PE backed IPOs.
OutlookThe mood amongst the investor community is generally an optimistic one and that should bode well for the overall environment for the
investments, fund raise as well exits. India is currently seen as one of the very few bright spots in the global economy and that should also keep the candle burning here. There are
investors to look at India even more seriously. The right support from the Government in the form of legislative changes around ease of doing business or improving the underlying economic growth should only lead to greater PE activity going forward.
Exhibit 8: Aggregate PE investments
Source: VCC Edge, Venture Intelligence and EY analysis
17,71510,627
3,657
8,4309,641
7,5469,116
11,683
19,600406
362
226
372446 416 392
469
767
0
100
200
300
400
500
600
700
800
900
0
5000
10000
15000
20000
25000
CY 07 CY 08 CY 09 CY 10 CY 11 CY 12 CY 13 CY 14 CY 15
Value (US$ million) Volume

13Transactions 2016 |
Exhibit 9: Stage-wise analysis (by volume)
Source: VCC Edge, Venture Intelligence and EY analysis
9 11 11 8 14 9 11 8 23
221 209109
204 198 173 133 147
247
7746
41
50 7563
69 61
41
9996
65
110159
171179
253
456
CY 07 CY 08 CY 09 CY 10 CY 11 CY 12 CY 13 CY 14 CY 15
Buy-out Growth PIPE Early Stage
Exhibit 10: Funds announced and raised
Source: VCC Edge, Venture Intelligence and EY analysis
10,415
8,420
6,440
3,609
CY 15
CY 14
CY 15
CY 14
By value (US$ million)
By volume
57
32 29
36
Announced Raised
Exhibit 11: Exits
Source: VCC Edge, Venture Intelligence and EY analysis
23 153 10
96119
18
3226
73
CY 14 CY 15
Buyback IPO Secondary StrategicOpen market

14 | PE and outbound drive M&A
Exhibit 12: Sector-wise investment analysis – by value (US$ million)
Source: VCC Edge, Venture Intelligence and EY analysisOther includes Industrial Products, Education, Business services, Textiles, Automotive, Chemicals, Cement & building products, Professional services and travelRHC – Real estate, hospitality and construction, FS – Financial services, P&U – Power & utilities, HC – Healthcare, M&E- Media and Entertainment, RCP – Retail and consumer products, F&A – Food and agriculture
4,1153,643
3,150
2,0321,122 847 813 671 666 540 500 355 219
926
E-co
mm
erce
RHC FS
Tech
nolo
gy
P&U HC
M&E RC
P
Logi
stic
s
Phar
ma
Oil
& Ga
s
Infr
a
F&A
Oth
ers
Exhibit 13: Sector-wise investment analysis – by volume
Source: VCC Edge, Venture Intelligence and EY analysisOther includes Automotive, Professional services, Chemicals, Textiles, Oil & Gas, Travel and Aerospace & defence
177154
8364
41 35 33 30 30 23 19 18 14 1333
E-co
mm
erce
Tech
nolo
gy
RHC FS
Logi
stic
s
RCP
Educ
atio
n
HC
F&A IP
M&E P&
U BS
Phar
ma
Oth
er

15Transactions 2016 |
Sector focusTechnology

16 | PE and outbound drive M&A
Technology continues to shine with strong deal volume The technology sector sustained its number one rank with the highest deal volume among all sectors during the year. With 121 deals totaling US$1.4 billion, the sector also recorded
The trends observed in the sector last year continued to strengthen this year as well: the strong position of the US
mark across all other industries.
SMAC applications — the emerging game changers
The increase in deal volume can be attributed to the sector’s growing prominence across different industries, not only domestically but also globally, on the back of SMAC solutions. These applications are being increasingly adopted both by technology as well as non-technology companies, to expand their portfolio of services and also to strengthen their capabilities in their core business operations. The inorganic route is seen as the most preferred course to gain such capabilities in the form of either technology or the talent pool to ensure a timely response to the evolving technology landscape and the resultant changing industry trends.
• High-margin opportunities from SMAC attract IT players: Within the technology industry, SMAC was more popular owing to its high-margin business opportunities compared with relatively lower-margin traditional IT offerings. Demand for SMAC solutions has shifted from small, pilot projects to deeper integration into enterprises’ IT environments over the past years. NASSCOM estimates SMAC revenues will account for around 20% of the total revenue of Indian IT companies in 2020, from the current
levels of less than 5%. The key driver for IT players to sell SMAC offerings is the fact that they are high-margin businesses providing them with non-linear growth. During the year, we saw large players investing in start-ups
• Acquisition of Kallidus Inc, a provider of digital experience solutions, by Infosys for US$120 million.
•
a consultancy specializing in SAP for US$66.1 million and Relational Solutions, Inc., a provider of analytics for consumer goods industry for US$10 million, by
•
cloud technologies, by Cisco Systems Inc.
• SMAC revolution across industries: SMAC has not just brought transformation in the technology industry today, but is emerging as one of the biggest game changers across multiple industries, including retail, health care and wellness, and travel services. Its penetration across industries has increased over the years as these solutions enable adopters to build and strengthen their capabilities,
to either develop or acquire these capabilities, thus
highlighting this trend include:
• Acquisition of Insta Health Solutions, a cloud-based hospital information management company, by Practo
•
•
cloud-based hotels solution provider by ibibo Web
One of the notable trends for the year gone by was the increasing
as evident from the number of transactions in the segment. This is expected to encourage more technology entrepreneurship in the country and also catapult Indian IT players on the technology forefront.
Ashish Basil, Partner-Technology, Transaction Advisory Services

Transactions 2016 |
• Mobility solutions gather momentum with increase in e-retail: Among the SMAC solutions, mobility took center stage owing to the increasing proliferation of smartphones and improved internet infrastructure. E-retail players were active in acquiring emerging mobile software developers, as they are striving to build in-house capabilities for a robust mobile presence. Examples of such transactions include:
• Acquisition of MartMobi, which enables e-commerce businesses, brands and retailers to have an instant mobile presence, by Snapdeal.
•
• Acquisition of Native5, a mobile app development platform company, by Myntra.
2013 2014 2015
Number of deals
Domestic 25 40 49
Inbound 39 39
Outbound 19 22 33
Total 71 101 121
Deal value (US$ million)
Domestic 10
Inbound 494
Outbound 250 211
Total 837 1,978 1,412
OutlookStrong year ahead as India Inc moves on the path of digitization
SMAC technologies are likely to continue to be hot topics for India Inc, as they promise to change the way organizations conduct business. Deal activity is expected to remain strong as large cash-rich players would acquire or engage
SMAC segments to gain intellectual property, talent pool and add emerging technologies to their portfolio of traditional services.
A leading example is Microsoft Ventures, which plans to incubate 500 start-ups in India in the
a US$500 million innovation fund to tap into the start-up ecosystem from Silicon Valley to Bengaluru. Besides the corporate factor, the Indian government has also taken up several initiatives, including Digital India and Smart Cities, to promote the digital arena. This, in turn, has created more demand for such solutions.
Mobility, along with cloud and analytics solutions, will continue to gain more importance, not only among e-retailers but
want secure access to enterprise applications and dashboards on tablets for their senior executives. Small and medium enterprises are using mobile devices in courier companies to update consignment information, in restaurants to take orders and updates, in agriculture for weather and crops, market price information, etc.
The proliferation of indigenous applications
real-time information will assist decision-
an unprecedented manner. On the back of burgeoning demand for such solutions and the supporting start-up ecosystem, we expect to see robust deal activity in the sector.
Deal value (US$ million) Number of deals
Exhibit 14: M&A deals in the technology sector
Source: EY analysis of Thomson ONE data
837
1,978 1,412 71
101 121
020406080100120140
0
1,000
2,000
3,000
2013 2014 2015
Num
ber o
f dea
ls
US$
mill
ion

| PE and outbound drive M&A
Sector focusFinancial services

19Transactions 2016 |
Regulatory changes coupled with increasing digitization drives M&A
the sector slipped down in terms of total disclosed deal value,
the sector in the recent past was US$2.4 billion acquisition of ING Vysya Bank by Kotak Mahindra Bank in 2014. Barring this deal, 2015 fared better with a 100% increase in terms of total disclosed deal value.
The key highlight of the sector was the increase in inbound interest, both in deal volume and deal value. The year recorded blockbuster inbound activity over the last six years with 39 deals aggregating to nearly US$2 billion. Overall, insurance
disclosed deal value of US$1.5 billion. Other active segments
Insurance leads sector’s M&A activity with increased inbound interest
Insurance was in the limelight throughout the year as this segment saw a steep increase in the volume of deals, primarily inbound in nature. A total of 24 inbound deals aggregating to US$1.3 billion were announced, as compared to an average of
activity can be primarily attributed to easing in foreign direct investment cap, to 49% from 26%, announced in December 2014. The Indian insurance industry has been grappling with relatively lower margins in the country, compared with margins in other developing countries. While the potential of the sector always remained attractive given the sheer size and relatively lower penetration in the country, the foreign players were seen to get more access and control. With this hurdle being removed, India was back on the boardroom agenda of the leading global
additional stake in their existing business ventures with Indian insurance players. Few examples include:
• Announcement by German insurer ERGO International
insurance joint venture with Housing Development Finance
• Announcement to acquire an additional 23% stake in
from Reliance Capital for US$342 million.
• Paris-headquartered insurer AXA raising its stake to 49%
Insurance and Bharti AXA General Insurance, with Bharti Enterprises.
Consolidation in the asset management space
The asset management sector in India is witnessing consolidation, with several foreign players continuing to exit the market. Such foreign players’ exit deals that were announced this year include:
• Deutsche Bank Group has entered into an agreement to divest its India asset management business to Pramerica Asset Managers.
• KBC Asset Management has entered into an agreement to sell its 49% stake in Union KBC Asset Management to its
• Goldman Sachs has entered into an agreement to divest its mutual fund business to Reliance Capital Asset Management.
Companies vie to enter the payment solutions segment through the inorganic route
We also saw e-commerce players acquiring payment solutions companies. As the e-commerce market grows, companies are also working on making payments easier by creating mobile wallets to create a convenient and reliable mode for payment transactions for the customers. For e-tailers also, problems with logistics and payment gateways with respect to inappropriate handling of goods and late recovery of revenue, respectively, created the need for them to own these capabilities. We have
The new differentiated bank licenses are expected to
industry, which has been reeling under the stress of non-performing assets in recent quarters.
Rajeev Suneja, Partner – Financial Services, Transaction Advisory Services

20 | PE and outbound drive M&A
seen e-tailers acquiring logistics players or creating their own logistics hub internally in the recent past. Now they have moved to the payment gateways market and are seeking potential targets to acquire such technologies. Additionally, increasing penetration of smart phones coupled with low penetration of ATM cards opens up considerable opportunities for mobile point of sales solution.
Two such deals announced during the year include:
• Acquisition of payments services start-up FX Mart Pvt.
a payment service on its platform and on that of its unit Myntra.
• Acquisition of FreeCharge, online recharge platform, by Snapdeal.
A few investors also made strategic investments in this segment. Acquisition of undisclosed minority stake in Paytm
an example of the same.
Another emerging segment within the online transaction space was payment banks
have been granted in-principle approvals for the establishment of payment banks. Several of these license winners have entered into joint venture partnerships with existing scheduled commercial banks, with the aim of leveraging their experience and expanding customer reach.
include:
•
with the State Bank of India.
• Announcement of planned 19.9% stake acquisition in Airtel
the segment, as they would want to leverage the experience and capabilities of existing players to foray in the online payments space.
Source: EY analysis of Thomson ONE data
Deal value (US$ million) Number of deals
Num
ber o
f dea
ls
1,342
3,747 2,696
61
57
84
0
20
40
60
80
100
0
2,000
4,000
6,000
2013 2014 2015
US$
mill
ion
2013 2014 2015
Number of deals
Domestic 40 44
Inbound 9 16 39
Outbound 4 1 1
Total 61 57 84
Deal value (US$ million)
Domestic 3,191 621
Inbound 553
Outbound 3 100
Total 1,342 3,747 2,696
OutlookA positive credit growth outlook to support banking and NBFC market
have been reeling under the pressure of non-performing assets, resulting in subdued credit growth in recent quarters. This stress on credit quality has made banks and NBFCs shift their focus to taking corrective measures to restructure their portfolios and to improve
campaign and various other initiatives by the government are however expected to lead to higher credit growth in the coming few years. Banks and NBFCs are accordingly expected to hit the market to raise funds for funding this future growth. Some of the weaker players may exit the market or exit certain products, leading
market.

Sector focusInfrastructure
21Transactions 2016 |

22 | PE and outbound drive M&A
Sector sustains M&A momentum; clean energy and logistics in focus2015 was a stable year for M&A activity in the Indian infrastructure space. Deal volume remained at the same level as that of last year with 91 deals in 2015, as compared to 93 deals in 2014. However, deal value declined by nearly 60% to US$2.5 billion this year from US$6.2 billion in 2014. This decline in value was primarily due to the absence of big-ticket deals in 2015, as against four such deals with a cumulative disclosed deal value of US$4.1 billion last year.
Within the sector, the power segment continued to be the primary space for M&A activity recording 40 deals with a total deal value of US$1.2 billion. The rest of the activity was
deals in infrastructure were domestic in nature, though we also witnessed noteworthy inbound acquisitions in the power segment, especially in clean energy.
Clean energy increasingly on the radar of overseas players
Within the power segment, the focus on clean energy continued to gain momentum in the power-starved Indian economy, helped by increased volatility in commodity prices. The government has set ambitious targets for clean power
renewable sources by 2022, more than six times of its current capacity. To meet these targets, it has continued with its several schemes and incentives, including tax breaks and subsidized loans, to encourage private players to enter the segment.
Both domestic and overseas renewable energy players in the wake of industry’s underlying potential are acquiring clean energy portfolios in India, especially in solar and wind energy. The industry’s attractiveness was clearly visible on the inbound front, where deal volume rose to 14 deals with a cumulative
with a cumulative disclosed value of US$415 million in 2014.
Among the overseas player in the sector, the US-based Sun Edison Inc, the world’s largest renewable energy developer, showed the maximum interest — two solar and one wind energy properties for an undisclosed value. Deals by Sun Edison include:
• Agreement to acquire 102 MW wind power plants in the states of Rajasthan and Karnataka from Spain’s Fersa Energías Renovables.
• Acquisition of a 51% equity interest in a NSM 24 solar
• Agreement to acquire a 49% stake in Solar Power SPV, a
Other notable inbound acquisitions include:
•
•
by Italy’s Enel Green Power Spa for US$33.6 million.
• Agreement to acquire Orient Green Power Company
Maharashtra by Singapore-based Sindicatum Captive
We also witnessed a few domestic transactions where the acquirers aimed to strengthen their position in the renewables market. Prominent examples include the acquisition of a 51%
Global Solutions for US$2 million.
Focus on expansion drives deals in logistics
With increasing demand for transportation and warehousing services, especially by e-marketers, logistics is an emerging segment looking for growth. Indian logistics players acquired companies to strengthen their product offerings and expand geographically in 2015. Examples include the acquisition of
start-up Pickingo by on-demand hyperlocal delivery service
Indian market seems to be dominated by transactions in the renewable space but in 2016, we could see transactions in the toll road and network business as well.
Kuljit Singh, Partner – Infrastructure, Transaction Advisory Services

23Transactions 2016 |
The digital wave also made a mark in the industry, as emerging technology start-ups were active in transactions to capture an increased market share. Examples include:
• Acquisition of Shifter, an online venture, which connects
player for last mile logistics service providers to augment the latter’s operations from both, customer as well as a
• Acquisition of Zippon by Turant Delivery, another e-logistics start-up, to increase the latter’s presence both in consumer and business space.
Exhibit 16: M&A deals in the infrastructure sector
Source: EY analysis of Thomson ONE data
Deal value (US$ million) Number of deals
2013 2014 2015
2,057
6,224
2,509
78
93 91
0
20
40
60
80
100
120
0
1,000
2,000
3,000
4,000
5,000
6,000
7,000
Num
ber
of d
eals
US$
mill
ion
2013 2014 2015
Number of deals
Domestic 53 56
Inbound 23 33 29
Outbound 6
Total 78 93 91
Deal value (US$ million)
Domestic 1,259
Inbound 1,239 1,319
Outbound 39 36
Total 2,057 6,224 2,509
OutlookA promising road ahead
Infrastructure is high on the agenda of the Central Government, as several initiatives have been taken to ensure the sector’s rapid development — announcing highway projects worth US$93 billion, plans to develop 100 smart cities across the country, and announcing
expect robust inbound investment in the sector, especially in roads and highways segments, amid already existing 100% FDI in most of the infrastructure segments. The need for increased connectivity between cities, towns and villages with rise in automobile and freight movement, combined with government support, offers huge potential for foreign investors to join hands with Indian players to capitalize on the sector’s growth.
Furthermore, clean energy is also expected to be the segment in focus, particularly for inbound investments. We are likely to see more global energy and utility companies entering the Indian clean energy market via partnerships with Indian counterparts and stake acquisitions.

24 | PE and outbound drive M&A
Sector focusMedia and entertainment

25Transactions 2016 |
Digital leads M&A; regional consolidation drives deals in broadcastingM&A activity in the M&E sector was more or less stable. The sector registered a cumulative disclosed deal value of US$1
were scattered among traditional media segments, such as
Increasing demand for digital platforms propelled deals
digital platforms. Consumers are increasingly accessing content on on-the-go devices and demanding customized content. This necessitates media companies to gear up and establish or strengthen their digital presence to cater to the changing needs of the new-age population. To address this requirement, media companies acquired players in the digital segments, such as online publishing and online streaming. Prominent examples include:
• In the online publishing segment, News Corp signed an agreement to acquire VCCircle, and Cedar Management Consulting acquired IBS Intelligence.
• In the online streaming space, BroadbandTV Corp acquired
acquired the song sharing app PingTune.
Digital marketing players were also high on the M&A radar, as media and e-commerce companies acquired them to gain technological capabilities and target consumers with customized advertisements. Prominent acquisitions by large advertising players include GroupM’s announcement to acquire WPP’s Foxymoron, and Dentsu’s acquisition of WAT Consult and Fountainhead. E-commerce companies also look to obtain valuable data on consumers’ shopping patterns through these acquisitions. A few examples by e-retailers includes the
ad-tech start-up Reduce Data by Snapdeal.
Consolidation continued in the movie exhibition segmentBuilding on the previous year’s trend, we observed continuing consolidation in the cinema exhibition space in 2015. Companies made acquisitions to expand their geographical
and distributors. Prominent examples include.
• Carnival’s agreement to buy Stargaze Entertainment with 30 screens, operational primarily in north India, for an
after it bought Big Cinemas with 242 screens.
• PVR’s announcement to acquire DT Cinemas with 29
million.
• Inox’s acquisition of two theatres with three screens each in Gujarat for an undisclosed deal value.
Players in the exhibition business see this consolidation as a positive move for the industry, because it would help drive
experience. Further, these players are also considering organic investments, especially in the increasingly important tier-II and tier-III cities, where lower screen penetration provides good prospects for business expansion.
Regional consolidation assisted deals in broadcastingCompanies in the TV broadcasting segment made acquisitions to strengthen their presence in the rapidly growing regional markets. During the year, Star India announced the acquisition of MAA TV to enter the Telugu TV market. Its competitor Zee Entertainment also geared up and announced the acquisition of Sarthak Entertainment to strengthen its regional presence
interest from US-based Viacom Inc., which acquired a 50% stake in Prism TV, which owns and operates regional entertainment channels in India. The well-established national broadcasters are looking at regional markets as a key driver for future revenue growth amid increasing competition in the Hindi TV market.
With an improvement in broadband connectivity and a proliferation of digital media, traditional media players are expected to increase their online presence via strategic acquisitions. We expect deals across content and technology players in the digital domain. Within the traditional sectors, we
radio segment is expected to see fresh investments.
Ajay Shah, Partner - Media and Entertainment, Transaction Advisory Services

26 | PE and outbound drive M&A
Exhibit 17: M&A deals in the media and entertainment sector
Source: EY analysis of Thomson ONE data
Deal value (US$ million) Number of deals
2013 2014 2015
Num
ber o
f dea
ls
US$
mill
ion
96
1,096 1,023
58 57 52
0
20
40
60
80
0
500
1,000
1,500
2,000
2,500
3,000
2013 2014 2015
Number of deals
Domestic 36 34
Inbound 20 16
Outbound 5 3 9
Total 58 57 52
Deal value (US$ million)
Domestic 26 1,069 549
Inbound 63
Outbound —
Total 96 1,096 1,023
OutlookSustained momentum expected in the coming year
Within digital media, the ad-tech segment is likely to continue to lead the M&A action, as traditional ad agencies are likely to consider acquiring digital marketing companies to avoid the risk of losing their non-creative business to other digital media agencies. E-retailers are also expected to remain active in acquiring
advertising technologies and reliable data on consumer spending. At the same time, we expect companies in the gaming, publishing and broadcasting space to scale up their digital offerings through acquisitions.
In the traditional media segments, we foresee further consolidation, especially in television,
would look to strengthen their foothold in the market. Regional expansion would continue to be the primary driver behind these acquisitions as ever-increasing competition
in existing markets.

Transactions 2016 |
Sector focusPharmaceuticals

| PE and outbound drive M&A
Big-ticket cross-border transactions were in the limelightIt was an encouraging year for M&A in the pharmaceuticals sector, as big-ticket cross-border transactions drove the sector’s deal value in 2015. A total of 53 deals were announced during the year — the highest annual deal volume in the sector in the
disclosed deal value declined to US$3.1 billion from US$4.1 billion in 2014, due to the US$3.2 billion blockbuster deal
Indian pharma majors continued to acquire companies globally
players were the highlight of the sector’s deal activity in 2015, registering the largest outbound deal volume and value in the
acquired overseas pharma players to increase their customer base, expand distribution reach and broaden product portfolios. While the US remained a key market for Indian players, they also evaluated opportunities in other high growth pharma markets, such as Australia, Africa and Brazil, to build a balanced portfolio across developed and emerging economies. Increased scrutiny in the USFDA approvals and moderating growth in the US drug market also propelled Indian players to assess prospects outside the US.
We also observed the Indian pharmaceutical industry’s largest-
signed an agreement to buy US-based Gavis Pharmaceuticals
million. Other prominent outbound transactions include Cipla
and Exelan Pharmaceuticals Inc. for a joint consideration of
of South African drug maker Aspen Pharmacare’s generic pharmaceuticals business in Australia for US$209 million.
Interest from foreign MNCs softened; selective acquisitions continued
There was a noticeable decline in MNC pharma companies’ interest in the Indian domestic branded generics market. This
announced the sale of its Indian business to Dr. Reddy’s in April
2014. This can be attributed to various factors such as the strengthening of price control mechanisms, the increasing use of compulsory licensing, and the perception of an unfavorable regime for protection of intellectual property rights in India. However, foreign MNCs are still open to deals if they offer
to acquire its female healthcare business. The deal is likely to accelerate Mylan’s growth in the women’s health care space and make it the leader in the hormonal contraceptives segment
transactions include Sweden-based Recipharm’s agreement
based Mitsui’s agreement to acquire a 20% stake in Indian drug wholesaler Keimed.
Domestic consolidation remained prominent in branded generics
domestic counterparts to gain economies of scale and improve margins under the prevailing price control policy. Prominent examples of such deals include Strides Arcolab’s agreements to acquire a majority stake in Medispan, the CNS division of erstwhile Ranbaxy from Sun Pharma, and the Indian brands
Pharmaceuticals’ acquisition of Zyg Pharma.
the accelerated pace of consolidation underway in the US Generics market. There has been a marked increase in ticket-value as well as risk appetite from Indian acquirers. We expect an increased pace
pharma in the medium term. Scale has become more important now than ever before in the domestic branded formulations industry, given the expanding scope of price control and tightening regulations
interest in backing good pharma growth stories, even if the deal might involve a pure secondary purchase of promoter stake, or the stake of an incumbent PE investor.
Krishanakumar V, Partner - Pharmaceuticals, Transaction Advisory Services

29Transactions 2016 |
Exhibit 18: M&A deals in the pharmaceuticals sector
Source: EY analysis of Thomson ONE data
Deal value (US$ million) Number of deals
2013 2014 2015
Num
ber
of d
eals
US$
mill
ion
3,718 4,142
3,118
31
50 53
0
20
40
60
80
100
120
0
1,000
2,000
3,000
4,000
5,000
2013 2014 2015
Number of deals
Domestic 15 22 23
Inbound 12 10
Outbound 9 16 20
Total 31 50 53
Deal value (US$ million)
Domestic 211
Inbound 2,962 1,155
Outbound 16 210
Total 3,718 4,412 3,118
OutlookInternational markets — an avenue for continued growth
There has been a sharp increase in the value of outbound deals in 2015 and we believe it is linked to the accelerated pace of consolidation underway in the global generics market. We witnessed a marked increase in the ticket value of deals as well as the risk appetite of Indian acquirers. Moreover, with most large-cap pharma companies having attained critical mass in India, turning their attention to overseas markets seems to be the only avenue to achieve further growth.
In parallel, we also expect an increased pace of consolidation in the domestic branded generics market in the medium-term. Scale has become more important than ever before in this industry, given the expanding scope of price control and tightening regulations
the cautious optimism displayed by global strategists in approaching India also leaves a lucrative opportunity for domestic players to remain active in pursuing acquisitions in a less competitive M&A environment.

30 | PE and outbound drive M&A
Sector focusReal estate and hospitality

31Transactions 2016 |
Renewed interest in real estate and hotel industries
years, indicating an improved deal situation of the market. Domestic M&A accounted for more than three-fourth of the total deal activity in the sector, both in terms of value
territories by acquiring other players within the industry. Real
segments, which cumulatively accounted for majority of the M&A action in the sector both in terms of deal value and volume.
Corporate demand and realistic valuations aid deal-making in the hotel industry
After witnessing a severe slowdown in recent years, the Indian hotel industry saw renewed investor interest in 2015 on the back of a growing tourism sector, which saw hotel performances improve as pan-India occupancy crossed 60% after more than
for the past few years due to the economic slowdown that hit both business and leisure travel. On the back of an improving business sentiment, we saw a strong growth in corporate demand, though growth in foreign tourists’ arrivals remained tepid this year. Within the corporate segment, meetings,
generate increasing business for the hospitality industry, especially luxury hotels.
industry’s M&A landscape, where primarily domestic hotel players, especially luxury and upscale hoteliers, engaged in the acquisition of hotel assets to expand their revenue streams from different domestic territories and an increased portfolio of services. These hoteliers are betting big on India’s long-term potential as a tourist destination and have announced their plans to add more properties and rooms in their portfolios. On the other side, valuations of hotels in India have also softened and now lenders to hotel projects have also started playing an active role in transactions, not just for non-performing assets but also for assets where they see potential stress. This revision
in valuation expectations to more realistic levels, supported by the sector’s business potential, is likely to increase deals in the segment. Few prominent deals during 2015 include:
•
MetTube Sdn. Bhd for US$110.1 million.
•
•
star hotel in Ahmedabad by SAMHI Hotels, in two separate deals.
• Acquisition of Aura Grande, Mumbai and Express Sarovar Portico, Faridabad by MRG Hospitality and Infrastructure in two separate deals.
Real estate witness green shoots
The realty sector also showed early signs of revival in demand, especially on the commercial property front in cities such as Mumbai, Bengaluru and Hyderabad. The year reported a record
back of eased foreign direct investment norms. Private equity
invested in 2015, compared to US$2.2 billion in 2014. The
spaces and residential, thereby indicating a long-term view
private equity transactions in different asset class include:
• Commercial:
•
with Milestone Capital and Hindustan Construction Company to acquire Vikhroli Corporate Park Pvt.
includes assumed debt.
• GIC acquired ICICI Ventures’ stake in Waverock, a commercial development in Hyderabad. It now owns
Speyer, a leading global developer.
• Residential: Deals were announced both at project and platform levels in the residential segment.
• Warburg Pincus acquired an undisclosed minority
land and expand its portfolio in Mumbai.
commercial real estate segment has consistently attracted investment dollars, we are now starting to see renewed interest around equity investments in the residential segment.
Randhir Kochhar, Partner – Real estate and hospitality, Transaction Advisory Services

32 | PE and outbound drive M&A
• Shapoorji Pallonji group received a commitment of US$200 million from Standard Chartered Private Equity, International Finance Corporation and Asian Development Bank for developments in the affordable housing segment.
The year also saw a few big business houses selling their real estate assets indicating the acquirer’s positive opinion about
companies are looking to sell land parcels to keep their balance sheets clean, adopt an asset-light model, reduce debt and use land assets in a more effective way. Few examples include:
•
in Bengaluru, held through Brooke Bond Real Estate Pvt.
Group and GIC.
• K Raheja Corp bought a 1.4 acres land parcel from HSBC in Mumbai for over INR220 crores and a 30 acre land parcel in Navi Mumbai for INR220 crores from Cabot Corporation.
OutlookSupportive deal fundamentals aided by the government to lead to increased deals in the sector
The hotel industry was back in action last year on the M&A front. With prices coming down and reaching realistic valuations, big hotel players are looking for sweet deals in the market. Furthermore, with improving markets and recuperating performance of hotel players, the hospitality market is likely to witness more transactions by funds, institutional investors and domestic companies.
In the real estate sector, besides private sector participation, we saw the government announcing initiatives on several fronts to ensure the sector is back on the growth track. For instance, the entry barrier of minimum investment of US$5 million and minimum area of 20,000 square meters of development was removed on the FDI front to encourage foreign investments across tier-II and tier-III
create real estate regulatory authorities in every state and ensure a transparent market place for buyers. Additionally, the REIT market is yet to take off pending certain
which are expected in this year’s budget. These initiatives pave a smooth road for some big-ticket portfolio deals and platform level transactions in the market in 2016, supported by an improving economy, increasing demand
2013 2014 2015
Number of deals
Domestic 36 53
Inbound 2 9
Outbound 4
Total 43 52 69
Deal value (US$ million)
Domestic 325 606 549
Inbound — 590 110
Outbound 490
Total 815 1,464 727
Deal value (US$ million) Number of deals
Exhibit 19: M&A deals in the real estate and hospitality sector
Source: EY analysis of Thomson ONE data
815 727
1,464
0
20
40
60
80
100
0200400600800
1,0001,2001,4001,600
2013 2014 2015
Num
ber o
f dea
ls
US$
mill
ion
43 52
69

33
Sector focusRetail and consumer products
33Transactions 2016 |

34 | PE and outbound drive M&A
Domestic consolidation sustains deal momentum Deal activity in the retail and consumer products sector was stable in 2015, recording 95 deals this year as compared to 96 deals in 2014. However, total disclosed deal value declined by
M&A activity was spread across various segments — food and
Domestic action continues in the F&B segment - packaged food and alcoholic beverages industries led the M&A activity
The F&B segment continued to be one of the active segments for deal activity in the sector given the favorable demographics in the country. Within the segment, deals happened primarily in packaged food and alcoholic beverages industries. The two industries have grown at an overall steady pace triggered by increasing disposable income of the consumers, and the fact that consumption of these products has increased, given the increasing urbanization of Indian households and changing social dynamics. Domestic players are exploring the inorganic growth route to expand their capacities to capitalize on these expanding segments and increase their market share. Few examples of such deals are:
•
Fuels, a Telangana-based grain distillery.
•
wholesaler of wafer biscuits.
•
Mother’s Recipe, acquired Elmac Agro Manufacturing Pvt.
We also witnessed a few global players foraying into this segment or increasing their stake in Indian ventures to capture the growth potential. For example:
•
Nissin Foods, maker of Top Ramen instant noodles in India, marking its entry in direct-to-consumer food business in India.
• US-based Molson Coors Brewing Company, through its wholly owned subsidiary, Coors Brewing Company,
•
Online retail segment: increasing prominence in the Indian M&A landscape
The e-retail space sustained the ongoing euphoria reported last year with new segments coming up as technology evolved.
who have been injecting substantial amounts of money into this segment, even at high valuations and even when companies continues to bleed red. The focus so far has been on customer acquisition and hence, on capturing the market share.
However, we expect the trend to change in the coming months, as investors, who would now start to look for exit options, will compel players to start focusing on improving the margins
expenditure being calibrated in the food technology segment with few of the start-ups already either have shut down or in the process of downsizing their operations. However, we expect this to be a positive trend for the overall industry in the long run, since this will bring some rationale and maturity in the discounts and deals.
On the strategic M&A front, we saw some consolidation happening, especially in segments, including online grocery,
offer discount, competitive pricing, value offer on the sale of
• Online grocery space in vogue: Online grocery poses a potential opportunity in the market as every household
Even though growth in consumer demand has slowed down considerably, the demand in consumer sector M&A continues to outstrip supply. Hence, we continue to expect higher deal activity in the coming year. Some of the most promising segments are expected to be consumer appliances, lifestyle, food and beverages and e-retail.
Nitin Gupta, Partner - Retail and Consumer Products, Transaction Advisory Services

35Transactions 2016 |
can relate to this category. Additionally, buying grocery is
lists, making it more comfortable to buy it online. During the year, we saw Indian online grocery players acquiring other players to consolidate their position in the market and counter the burgeoning competition. For example:
• BigBasket acquired Delyver to strengthen its last-mile delivery network.
• Grofers acquired Mygreenbox to expand its market share.
• Askme acquired online grocery shopping marketplace Bestatlowest.com.
• Price comparison and deals platforms space is another upcoming segment in the Indian retail market. In addition to the convenience factor, luring consumers to shop online, competitive pricing has also become an important factor. With a considerable presence of e-commerce companies in each category, consumers feel the need for websites that offer price comparison, and coupons and discounts. In recent years, several start-ups have emerged in the segment and this year we saw the consolidation process kicking off. These players are acquiring their peers with an aim to expand their market share in the segment. Some deals in the segment include:
•
CarDekho, BikeDekho and PriceDekho, acquired cross-product price comparison portal BuyingIQ.com.
• Online price comparison and product discovery portal
Priceburp.com.
•
marketplace Trideal to fuel its expansion plans.
Personal care segment - new avenue for growth
Domestic players, especially cash-rich ones, acquired both local and overseas players to expand their businesses and serve an expanded market. The prominence of the domestic market has increased with the increase in the disposable income in the country, which in turn, is leading to changing lifestyles of the consumer. A piece of the growing income pie is being grabbed by the personal grooming segment, which has now found a place of its own in the monthly spend by any household. Few examples of domestic acquisitions in this space include:
•
million to foray into the domestic hair care industry.
•
to the segment, which it had exited in 2006.
•
to acquire consumer products division of Grasim Industries
Furthermore, large Indian corporate entities, such as Dabur, Godrej and Emami, are also speeding up their international expansion amid aspirations to become truly multinational. They are also concerned about increased domestic crowding. Emerging countries, including Russia and those from Middle East and Africa are high on their radar, as these have received relatively less attention from global players, when compared to developed nations, and remain largely untapped markets. Examples of a few overseas acquisitions include:
•
and hiked its stake by 39% to 90% in the operations of hair extension brand Darling South Africa and Mozambique businesses, in two separate deals.
•
foray into the natural and organic personal care business.

36 | PE and outbound drive M&A
Exhibit 20: M&A deals in the retail and consumer products sector
Source: EY analysis of Thomson ONE data
Deal value (US$ million) Number of deals
2013 2014 2015
Num
ber
of d
eals
US$
mill
ion 3,903
4,064 2,406
82
96 95
75
80
85
90
95
100
0
1,000
2,000
3,000
4,000
5,000
6,000
2013 2014 2015
Number of deals
Domestic 59 66
Inbound 16 22
Outbound 12 5
Total 82 96 95
Deal value (US$ million)
Domestic 164 1,269
Inbound
Outbound 15 —
Total 3,903 4,064 2,406
OutlookOutbound acquisitions likely to increase in the personal care segment; consolidation to speed up in the e-retail segment
Overall, we expect personal care, food and beverage and confectionary segment to continue to do well. Indian companies, especially the ones with strong balance sheets will continue to explore new markets such as South East Asia, Middle East and Africa for growth. They are expected to increase the momentum and accelerate their overseas acquisition plans. Simultaneously, we expect large players to look for bolt-on acquisition opportunities domestically as well. Competition is anyway heating up with the entry of relatively new players, such as Patanjali, which managed to create a cult following and capture a sizeable market share in a very short span of time.
Within the e-retail segment, we should see the initial trend of consolidation happening in the sector. It will be interesting to watch the action by PE players, whether they continue to back these start-ups or focus only on the bigger players. Furthermore, how much longer the PE investors can wait before they look for exit
activity in the coming years.

Transactions 2016 |
Sector focusTravel services

| PE and outbound drive M&A
Competition starts heating up M&A activity in the travel services sector continued its upward
disclosed deal value of US$546 million in 2015. There was a
million in 2014 as compared with just six deals with US$103
is indicative of both the improving sentiment as travel is considered to be a discretionary spend and thereby, relatively
the changing social fabrics of the society. Indians are travelling in increased numbers more than ever before and it is only expected to grow as the young generation moves away from the traditional earn and save, to earn and spend ideology. This is creating opportunities for both hotels and tour providers.
Furthermore, increasing number of people look to shift from hassles of owning and maintaining a car. Combined with
transport system, especially in urban areas, and one has the perfect recipe for taxi providers to grow in the country. This is
Online taxi aggregators are taking the inorganic route to expand scale and face competition
The taxi market in India is heating up and has been growing phenomenally over the last few years on the back of reasons listed above. However, much of the market is still dominated by the unorganized sector, which constitutes roughly 95% of the market in terms of number of vehicles. This presents
providers. This ever-increasing demand for reliable and quick taxi services is attracting interest from investors, which have pumped millions of dollars in recent times in this segment, to capitalize on the lucrative opportunity.
While domestic service providers are aiming to expand scale and combat the increasing competition through acquisitions, foreign investors are willing to be a part of the emerging growth story of the taxi travel in India.
• Key deals include:
• Domestic players making acquisitions: ANI Technologies-owned Ola acquired TaxiForSure for US$200 million, which was also the largest deal of the
owned Ixigo acquired Rutogo.
• Foreign investors acquiring stake in Indian players: Several foreign players, including DST Global, Sarin Family and Chinese Didi Kaudi, have acquired stakes in
strategic stake in Meru cabs.
Online tour providers and hotel aggregators brace themselves for exciting times ahead
The country’s travel and tourism market is not only growing at a rapid pace, but also increasingly moving online like other sectors. Increasing penetration of smart phones and internet is creating unprecedented opportunities for growth for online travel agencies as they get prepared for the new reality. By itself, the country’s tourism market looks set to grow on the back of government’s initiatives such as “open skies policy”, plan to build 150 new airports by 2020 and increasing number of budget hotels in tier-I and tier-II cities. In one such example of the deal where the acquirer is looking to capitalize on the
However, much of this growth will likely be guzzled by online players as they have a wider reach and cater to today’s price conscious, experience-seeking generation. Nowadays, people tend to compare not only the prices online but also the features, services and the reviews by fellow travelers before
means, exciting times for new age companies such as the online hotel aggregators, online travel planners, review sites etc.
To adapt to this, travel agencies are taking the inorganic route
Travel services, while one of the largest components of the Indian economy, had remained unorganised and fragmented for a long period of time. The entry of well-funded online service aggregators will enable consolidation of services and players and provide a cost effective, consistent and professional services to the consumers. We expect the sector to continue to attract capital and be active in the transactions space.
Ashish Basil, Partner – Travel services, Transaction Advisory Services

39Transactions 2016 |
Exhibit 21: M&A deals in the travel services sector
Source: EY analysis of Thomson ONE data
103
445
546
6
13 17
0
5
10
15
20
25
30
0
100
200
300
400
500
600
2013 2014 2015
Num
ber o
f dea
ls
US$
mill
ion
Deal value (US$ million) Number of deals
2013 2014 2015
Number of deals
Domestic 3 4
Inbound 3 6 5
Outbound — 3 4
Total 6 13 17
Deal value (US$ million)
Domestic — — 215
Inbound 103 440 234
Outbound — 5
Total 103 445 546
OutlookConsolidation and acquisitions of new age companies will help sustaining the momentum in the coming year
Within the online taxi provider segment, consolidation is likely to drive M&A as the bigger established players are sitting on huge war-chest and are committed to capitalise on the Indian market potential. Operators who own
presence in one or two cities are more likely to be acquired up by bigger players. Players such as Ola and Uber have been offering incentives to customers and drivers alike to secure both the demand and the supply side. They will look for inorganic growth to gain scale to secure supply and better bargaining power in the long run. Another segment, which is likely drive M&A is the ride sharing, which will emerge as a new avenue for growth in the next couple of years. Taxi players might scoop up the new ride sharing start-ups to foray into this segment.
Similarly, within the hotel aggregators and the online tour providers segment, we foresee further consolidation driven by a strategy to gain scale and capture the market.
to acquire necessary technological capabilities and expand their product portfolio. For instance, MakeMyTrip acquired a minority stake in travel review site HolidayIQ and two travel planning start-ups Inspirock and Mygola.com in separate transactions from its innovation fund, which it established to invest in start-ups or early-stage companies in the travel technology space.
acquired Awesome Stays in the online hotel aggregators’ space.

40 | PE and outbound drive M&A
M&A outlook

41Transactions 2016 |
M&A activity to revive in 2016
cautious approach among dealmakers. However, we expect the scenario to change in 2016 and the deal activity to pick up. Domestic activity, which was subdued last year, should strengthen in the coming year as we are likely to see more consolidation deals, especially in sectors including infrastructure and manufacturing, retail and pharmaceuticals. Additionally, we are likely to see big-ticket divestments by leveraged corporations, which were largely absent from the Indian space this year as banks take a stronger view on non-performing assets.
Inbound activity, which was steady last year, should remain the same in 2016. Global buyers are cautious about the persistently low-growth environment, accompanied by stretched balance sheets in the wake of low commodity prices, including oil and metals. They would still look to wait a little longer and see some sustained growth in the economy.
inbound front. There is softness in relations between the two countries, which will impact the investments coming in. This
on huge cash piles, to look elsewhere for growth. Manufacturing sectors such as automotive and speciality chemicals are likely
develop a manufacturing base in India but also to access the large Indian market.
Outbound investments will continue to be led by oil and gas, and pharmaceuticals in the next year as well. India’s quest to secure supplies of natural resources is expected to gather pace, with the government taking steps to encourage Indian players to acquire oil, gas and coal assets overseas. In line with this, several state-owned and private companies have announced
war chests to acquire assets abroad, available at attractive valuations, amid low oil prices.
The pharmaceuticals sector will also continue to be active with consolidation in the global generics market underway. However, outbound activity will likely to be more or less stable in sectors, such as automotive, power equipment and other manufacturing segments.
A key factor likely to have a considerable impact on M&A in the coming year is the pickup in capex cycle of Indian players. We expect capex to pick up during second half of 2016 due to two triggers. Firstly, the government focus on core infrastructure and the plans it has announced for road and highways, smart cities and “Digital India,” should help the capex cycle to revive and provide further sustenance to deal activity. Besides, further cut in the rate by RBI, as the market expects, should support the demand cycle, aid industrial recovery and boost economic growth in the country. The M&A market is likely to follow these patterns and revive in the coming year.

42 | PE and outbound drive M&A
Appendices

43Transactions 2016 |
Num
ber o
f dea
ls
US$
bill
ion
Deal value (US$ billion) Number of deals
Exhibit 22: Quarterly deal activity
Source: EY analysis of Thomson ONE data
2.7
11.6
6.6
8.5
4.76.5
8.36.7
202 221 231
216 214 230
253 233
0
50
100
150
200
250
300
0
5
10
15
20
Jan-Mar14
Apr-Jun14
Jul-Sep14
Oct-Dec14
Jan-Mar15
Apr-Jun15
Jul-Sep15
Oct-Dec15
Geography Month Target Target Country
Acquiror Acquiror Country
Value (US$ million)
Target Sector
Domestic India India 2,156 Oil and gas
Outbound Sep Vankorneft’ AO Russia Oil & Natural Gas India 1,250 Oil and gas
Inbound Oct India American Tower Corp
US 1,169 Telecommunications
Outbound GAVIS US India Pharmaceuticals
Domestic May Madura Fashion & India Pantaloons Fashion & Retail
India Retail and consumer products
Inbound FebFemale Health Care Business
India Mylan Inc US Pharmaceuticals
Domestic Aug India India Cement and building products
Domestic Nov India India Agriculture
Inbound Sep Sabah Forest Industries Sdn. Bhd.
Malaysia Pandawa Sakti Sdn Bhd
Malaysia 500 Paper and forest products
Outbound Sep InvaGen Pharmaceuticals Inc
US India 500 Pharmaceuticals
Exhibit 23: Top 10 deals of 2015

44 | PE and outbound drive M&A
Taget vertical2014 2015
Deal count Deal value (US$ million)
Deal count Deal value (US$ million)
Aerospace and defense 5 - 5
Agriculture 16 529 12
Automotives 29 291
Cement and building products 19 1,156
Chemicals 330
Education 11 15 169
Financial services 2,696
Healthcare 34 213 26
Hospitality and leisure 20 115
Infrastructure 93 6,224 91 2,509
Investment companies 12 3 12 200
Media and entertainment 1,096 52 1,023
Metals and mining 24 25 690
Oil and gas 16 11 3,425
Paper and forest products 4 1 6 510
Pharmaceuticals 50 4,142 53
Professional services 50 99 45 220
Real estate 32 1,349 31 429
Retail and consumer products 96 4,064 95 2,406
Technology 101 121 1,412
Telecommunications 14 15 2,193
Textiles 16 23 14 43
Travel services 13 445 546
Exhibit 24: Deal activity by industry

45Transactions 2016 |
Methodology
45Transactions 2016 |

Transaction Annual is based on EY’s analysis of Thomson ONE’s M&A data •
December 2015. The report highlights announced deals and indicates their status — either pending or completed. Terminated deals have been excluded from it.
• Data was obtained from Thomson ONE through an “M&A” customized search, where India was either a target or seller or an acquirer.
• Deal values have been taken as indicated in Thomson
non-US dollar deals is in accordance with Thomson ONE
deal announcement dates.
• Instances of multiple deals involving mandatory open offers, stake acquisitions in tranches or mergers have been combined into a single deal.
•the following basis:
•
• Inbound, outbound and domestic based
• Deal size brackets based on announced deal values.
• The numbers have been rounded off where otherwise indicated.
• Total disclosed value of the deals does not include the acquired debt of the targets.
46 | Title to be incorporated

Transactions 2016 |

| PE and outbound drive M&A
Notes

49Transactions 2016 |
Notes

Connect with us
Kuljit Singh
M&A advisory Email id: [email protected]
Amit Khandelwal National Director
Transaction Advisory Services Email id: [email protected]
Ajay Arora
Transaction Advisory Services Email id: [email protected]
Ranjan Biswas
Communication and Entertainment Email id: [email protected]
Sailesh Rao
Email id: [email protected]
Mayank Rastogi Partner - Private Equity Desk
Transaction Advisory Services Email id: [email protected]

Kolkata22, Camac Street3rd Floor, Block C”
Mumbai14th Floor, The Ruby29 Senapati Bapat Marg
5th Floor Block B-2Nirlon Knowledge ParkOff. Western Express Highway
Mumbai-400 063, India
Pune
Panchshil Tech Park
Pune-411 006
Delhi NCRGolf View Corporate
Sector 42, Sector Road
3rd & 6th Floor, Worldmark-1IGI Airport Hospitality District
4th & 5th Floor, Plot No 2BTower 2, Sector 126NOIDA-201 304Gautam Budh Nagar, U.P. India
Hyderabad
Hitech City, Madhapur
Kochi9th Floor “ABAD Nucleus”NH-49, Maradu PO
Ahmedabad
Near. C.N VidhyalayaAmbawadi
Bengaluru
“U B City” Canberra BlockNo.24, Vittal Mallya RoadBengaluru-560 001
1st Floor, Prestige EmeraldNo.4, Madras Bank Road
Bengaluru-560 001 India
Chandigarh1st Floor
Sector 9-C, Madhya MargChandigarh-160 009
ChennaiTidel Park
No.4, Rajiv Gandhi SalaiTaramaniChennai-600113

Ernst & Young LLPEY | Assurance | Tax | Transactions | AdvisoryAbout EYEY is a global leader in assurance, tax, transaction and advisory services. The insights and quality services we deliver help build trust and confidence in the capital markets and in economies the world over. We develop outstanding leaders who team to deliver on our promises to all of our stakeholders. In so doing, we play a critical role in building a better working world for our people, for our clients and for our communities.
EY refers to the global organization, and may refer to one or more, of the member firms of Ernst & Young Global Limited, each of which is a separate legal entity. Ernst & Young Global Limited, a UK company limited by guarantee, does not provide services to clients. For more information about our organization, please visit ey.com.
Ernst & Young LLP is one of the Indian client serving member firms of EYGM Limited. For more information about our organization, please visit www.ey.com/in.
Ernst & Young LLP is a Limited Liability Partnership, registered under the Limited Liability Partnership Act, 2008 in India, having its registered office at 22 Camac Street, 3rd Floor, Block C, Kolkata - 700016
© 2016 Ernst & Young LLP. Published in India. All Rights Reserved.
EYIN1602-017
ED None
This publication contains information in summary form and is therefore intended for general guidance only. It is not intended to be a substitute for detailed research or the exercise of professional judgment. Neither Ernst & Young LLP nor any other member of the global Ernst & Young organization can accept any responsibility for loss occasioned to any person acting or refraining from action as a result of any material in this publication. On any specific matter, reference should be made to the appropriate advisor.
JG
EY refers to the global organization, and/or one or more of the independent member firms of Ernst & Young Global Limited